1. Introduction
The development of web technologies and the availability of the Internet has changed many educational processes [
1,
2], which was especially evident during the COVID-19 epidemic [
3]. The widespread adoption of new pedagogical tools has revealed both the advantages and limitations of online educational technologies. For pedagogical and psychological research, web technologies have created the conditions for collecting large amounts of evidence-based data, allowing us to move away from small samples in traditional research. Large data obtained in the practice of online learning and online testing [
4] allow getting away from low statistical power, to achieve more reliable results [
5] due to a significant expansion of the sample. In addition, large, accumulated data sets are the basis for the application of machine learning mechanisms and other approaches that use artificial intelligence in solving the problems of data processing of pedagogical and psychological research [
6,
7,
8,
9]. However, the widespread practice of remote educational technologies has also revealed disadvantages, so it became clear that in digital educational platforms, a significant place in the learning process should be given to interactive user interaction (waiting for user response, reading certain texts, tests, and surveys). To analyze the involvement, special technologies, mathematical methods, and algorithms need to be developed.
The characteristic of user (learner) involvement in the interactive educational process can be the time between the stimulus, the necessary action (to read a text, solve a problem, give an answer to a question), and pressing the keyboard or mouse on the web interface element, that is, the reaction time in interactive interaction. Given the opportunities provided by educational learning and web technologies, one can record and store reaction time as the time between the task and the result performed and recorded by the user in the web interface (entering the answer, mouse action or pressing the “Ok,” “Next” button on the web interface, etc.). That is, the reaction time of the user, this is the time, depending on the task, which is required to assimilate the material, read the text of the task or test, or other required action of the educational system.
Obtaining data on reaction time will allow forming a system of control over the involvement in the educational process. Lack of involvement in the interactive process can be considered an unnatural type of reactions of two types: Bots and clickers. Bots are software script (robot) that interacts with the digital platform in some random or regular way through the web interface by means of software code. Clickers are users (a pattern of user behavior) who are not involved in the interactive process of interaction with the platform, who simply click (tap) on elements of the web interface, formally going further, e.g., on training topics, but not actually stopping at the screen. The problem of engagement tracing is also important in web surveys and online psychological research because people and clicker-bots can greatly distort the results of the survey, influencing the essence of the conclusions and decisions based on unreliable data.
Currently, there are methods for detecting clickers when filtering psychological survey data based on machine learning. However, these methods cannot be applied online [
10] but only in data processing [
11]. In addition, machine learning methods require a significant amount of computational resources and for the big data that modern educational online systems collect, it becomes very resource-intensive. The approach needs to be accurate, reproducible, not computationally demanding, and capable of identifying clickers from incomplete data. Identifying bots and clickers will improve data quality, which will have a positive impact on the validity of research results.
Among the various methods for identifying clickers, a method based on the analysis of user reaction time anomalies seems to be one of the most promising [
12,
13,
14]. Educational digital systems that store user session data generate large amounts of data. Such systems can store not only the time of responses to tests and any reaction to what is happening interactively (press a button, select an item with the mouse, swipe a page), but also the time it takes the user to perform an action or solve a task [
15]. Thus, the initial data for the analysis of user engagement can be the reaction time of the user on each element of interactive interaction (web interface) from the time of providing him with information on the screen to perform the required action. With a long interactive interaction, a series of reactions can form a time series, which can be investigated by the methods of dynamic systems theory. “Real” users involved in the interactive process, although they have personal reactions [
14,
16] but with prolonged interaction in an educational system (for 2–3 h) have delays in responses caused by external causes (for example, dropped pen, student was distracted by external noise or irritant, went to drink water, etc.). Single, irregular delays in reaction time during interactive interaction with the digital environment cannot be programmed, they are part of the individual’s existence in his/her environment.
Thus, in the proposed circumstances, to control the involvement in the interactive meaningful interaction with the educational platform, they need computational non resource-intensive tools, which will allow them to know whether the user is a person just flipping through questions and screens or a bot or has thought through all the questions and tasks offered by the educational environment.
The article is further organized as follows.
Section 2 describes the background of the study,
Section 3 is about research methods,
Section 4 presents the materials and input data,
Section 5 the main results, and
Section 6 the conclusion.
2. Background
Many studies show that learner engagement tracing in educational activities [
17] is the strongest predictor of competence and personal development of a learner [
18,
19,
20]. Thus, the assessment of learners’ involvement in online educational activities is an important tool to assess both the results of a particular learner and the effectiveness of online educational programs as a whole. Many components can be identified that influence learner engagement both in and out of the classroom [
21,
22,
23]. However, the implementation of online learning requires specialized methods for assessing engagement in an online environment. There are works that quantify the impact of taking online courses by university students on the overall results of educational activities [
24]. Quite a large stratum of research is devoted to assessing student engagement in a particular online course based on automatic, semi-automatic, and manual methods. According to [
25], manual methods are divided into self-observation and observation checklist, engagement tracing refers to semi-automatic methods, and automatic methods include computer vision methods (analysis of facial expressions, gestures and postures, eye movements), sensor data analysis methods, log-file analysis methods.
Self-observation methods attract many researchers by their simplicity, but the validity of self-observation depends on many factors beyond the control of researchers—the honesty of learners, the willingness to participate in the observation of their emotions, the correctness of emotion perception, etc. [
26]. Observation checklists are also a popular method where the questionnaire is completed by outside observers rather than the learners themselves. Among the many limitations of this method, there is an ambiguous correspondence between the observed behavior of the learner (“sits quietly”) and the cognitive processes associated with the assimilation or non-assimilation of the material being studied [
27].
The semi-automatic category of methods includes methods that require implicit participation of the learner in the process of engagement assessment, such as engagement tracing, which uses the time and accuracy of learners’ responses [
28]. The engagement tracing method is actively used in intelligent learning systems, but is not yet so common in online learning with a teacher [
29].
Automatic engagement assessment methods extract characteristics from a variety of data captured by computer vision sensors [
30] (eye movements, facial expressions, gestures, postures), physiological and neurological sensors [
31] (HR, EEG, blood pressure, skin-galvanic response).
Undoubtedly, automatic methods for assessing involvement provide a more complete objective picture of the student’s state for further analysis in comparison with the method of tracking involvement. However, they require the presence of appropriate sensors, which may often not be applicable in a particular context. Sensory observation is explicit to the learner and is an additional stressor, such as knowing the learner is being captured by the webcam while solving a problem. Thus, the development of hidden (semi-automatic) methods is relevant, while new computationally efficient methods of converting the initial signal about the student’s reaction time to assess involvement can be applied.
3. Research Methods
Dynamic systems are defined as a mathematical model of the evolution of a real (physical, biological, economic, etc.) system, the state of which at any time is uniquely determined by its initial state. Initially, the theory of dynamical systems studied the solution of a system of ordinary differential equations, considering the solution as a change in time and in phase space. The phase space includes the phase coordinates (variables) of the system of differential equations, as well as the derivatives of these coordinates. It should be noted that among the phase coordinates, there is no time variable. Each moment of time corresponds to the value of the phase variables, resulting in a curve (the locus of points) in the state space. Therefore, for systems with one phase variable or one observable process, for example, phase trajectories in two-dimensional space can be considered, the coordinates of which are the variable itself and its derivative. For a given differential equation, a particular solution under given conditions, called the solution of the Cauchy problem, can be analytically, more often numerically, constructed. It is an equation defined by a particular solution of the original system. By numerically or analytically differentiating the solution, we obtain the form of the phase trajectory. The type of this trajectory is given considerable attention in the theory of dynamical systems, the geometric properties of this curve determine the understanding and description of the properties of the system. For oscillatory systems, phase trajectories are closed trajectories. For stable systems, phase trajectories converge to an equilibrium point.
The state of equilibrium of a dynamical system corresponds to a degenerate trajectory—a point in the phase space, to a periodic motion—a closed curve, to a quasi-periodic motion. The stationary regime (steady motion) of a dissipative system corresponds to an attractor—a set of trajectories that attract all close trajectories to themselves. The steady periodic oscillations correspond to the limit cycle—a closed trajectory isolated in the phase space. There is a separate class of dynamical systems whose phase trajectories are unstable. Chaotic self-oscillations correspond to a strange attractor—an attracting set consisting of unstable trajectories.
According to the nature of the equations and research methods, dynamic systems are divided into finite-dimensional systems with a finite-dimensional phase space and infinite-dimensional distributed systems. Finite-dimensional dynamical systems can be divided into conservative and dissipative, which corresponds to the different physical nature of real systems. Conservative: For dissipative systems, the phase volume is not preserved, in their phase space, there is a limited area (the ball of dissipation) into which a point forever falls on any trajectory.
For modern data processing, not only theories of mathematical statistics widely used in psychometrics, but also dynamic models are used. Statistical methods are based on a statistical (probabilistic) representation of the observed process. That is, it is based on the concept of a random variable, the measurements of which obey some hypothetical distribution law. The distribution of a random variable is tested as a statistical hypothesis based on an empirically constructed histogram. As a result, the statistical approach allows, for the purposes of forecasting, to determine the most probable value of a random variable and the spread of possible values. Thanks to knowledge based on statistical observations, distributions allow scaling of the values of measured indicators. Dynamic models describe the next value based on the current value and the equation of evolution—the equation of dynamics. Of course, the problem of constructing equations from observed data, the so-called inverse problem of dynamics, is an ill-posed mathematical problem since there is an infinite number of equations whose solution has the same form. There are a large number of methods for reconstructing equations from the type of observed processes, but for systems with chaotic dynamics, it is sufficient to obtain numerical estimates of the characteristics. Chaotic systems are dissipative, having fallen into the region of a strange attractor, the system remains on its trajectories, although unstable, but included in a certain region of the phase space. Returning to the difference between the approaches of statistical random variable and dynamic systems, let us consider their application in psychometrics. Considering a battery of tests for a specific group of respondents, with a statistical approach, each answer to a task is a random variable. One answer does not depend on the previous one. The hit of the answer is in some areas of the constructed histogram. In this case, of course, all static hypotheses are verified by computationally reliable methods that correspond to the sample power and the required rules. If we consider as a parameter not the answer, but the time spent to obtain the correct answer, then nothing will change significantly in the analysis of the data. We will evaluate the response time, getting it into the appropriate scale built on the distribution of a random variable. In a dynamic approach, we evaluate the next value (response) based on the previous response. This makes it possible to take into account the degree of fatigue, which is essential for large test batteries. We can, considering the dynamics as a random process and testing the hypothesis of stationarity, build the average response time to the battery, spread, etc., based on the theory of random processes and identification methods, and most likely, the results will be the same for the averages. However, based on dynamic models, personal response trajectories can be taken into account. These responses will be significantly different for bot patterns and clicker patterns. For dynamic models of passing a battery of tests within two hours, distractions will be characteristic. If this is a student, then in two hours, he will certainly be distracted, and he can be distracted for a significant time. For static processing, these values will be filtered out as outliers. However, for a dynamic model, this is important information that a living person cannot be in maximum concentration for two hours of passing tests. Moreover, each person will be distracted at different times. Someone will get tired at the fortieth minute, someone later, but this is inevitable. It is also important to note one more fact—for modeling bots, one can generate a random value of a given distribution. Although it will be based on pseudo-random numbers, for large data, such a generator is difficult to catch in real time. The generation of a chaotic signal is a complex task that requires significant computational costs. Such a generator can be calculated in real time during the response to a long battery of tests.
Long-term interaction with the learning environment is similar in terms of dynamics to response to an online battery of tests. More or less attention is required to ongoing events in the learning environment, the user can scroll back some materials or pause. These delays will be patterns of the human behavior of the student involved not just statistically significant responses and reactions. That is why a hypothesis is made about the prospects of using dynamic models for an impersonal operational analysis of involvement.
There are a large number of characteristics of chaotic dynamics. Some of them can be estimated on the basis of a time series, without building complete adequate models of dynamic systems. These characteristics include the senior Lyapunov exponent, a significant advantage of estimating the Lyapunov exponent is its signature (sign) and not the actual value, although the senior exponent can be calculated on the basis of experimental data.
The Lyapunov exponents are defined as follows. Let there be a system given by an ordinary differential equation. Consider the perturbations that can be given to the trajectory of this system. If their amplitude all the time remains infinitely small with respect to the initial phase space, then such perturbations are called infinitesimal and are described by a linear equation. Such perturbations are also called trajectory variations. Infinitesimal vectors are tangents to the trajectories of the original system. All possible tangent vectors form a space, which is called tangential or tangent, and has a dimension equal to the dimension of the phase space. Depending on the direction of application of the perturbation and the properties of the system, the infinitesimal vector increases or decays, and due to the linearity of the equation, this occurs on average according to an exponential law. As the multiplicative ergodic Oseledets theorem says, there exists a set of numbers λ1 > λ2 > … > λm, the number of which is equal to the dimension of the tangent space, such that, for any initial perturbation, there is an exponent that takes values from the set λi depending on the choice of the tangent vector. The numbers λi are called Lyapunov exponents. It also follows from the multiplicative ergodic theorem that the sum of the first k Lyapunov exponents is the average exponential compression or expansion of the k-dimensional phase volume. The leading Lyapunov exponent is calculated as follows. It is necessary to solve jointly linearized equations over a sufficiently long period of time, periodically performing renormalizations and accumulating the logarithms of the norms, and then averaging the accumulated values over the calculation time. For several indicators, there are a large number of algorithms.
4. Materials and Experiment
Formally, the problem can be formulated as follows. Let there be a series derived from user reactions during a long-term interactive session with an educational web-service, we need to determine the users involved in the educational process. We will monitor on the basis of identifying two types of behavior patterns not involved in the interactive process: (1) Clickers—very fast reaction (e.g., the time is much less than it takes to read a text, solve a problem, etc.), (2) bots—reaction time is regular, regardless of the complexity of the task (perhaps, subject to some law of distribution of a random value), under the assumption that the time series of reactions of real people during the interactive session is chaotic.
The initial data for the experiments were the results of mass testing of schoolchildren and students using a digital platform for psychological research [
6]. Students were asked to complete a battery of tests including questions, cognitive tests, and tasks.
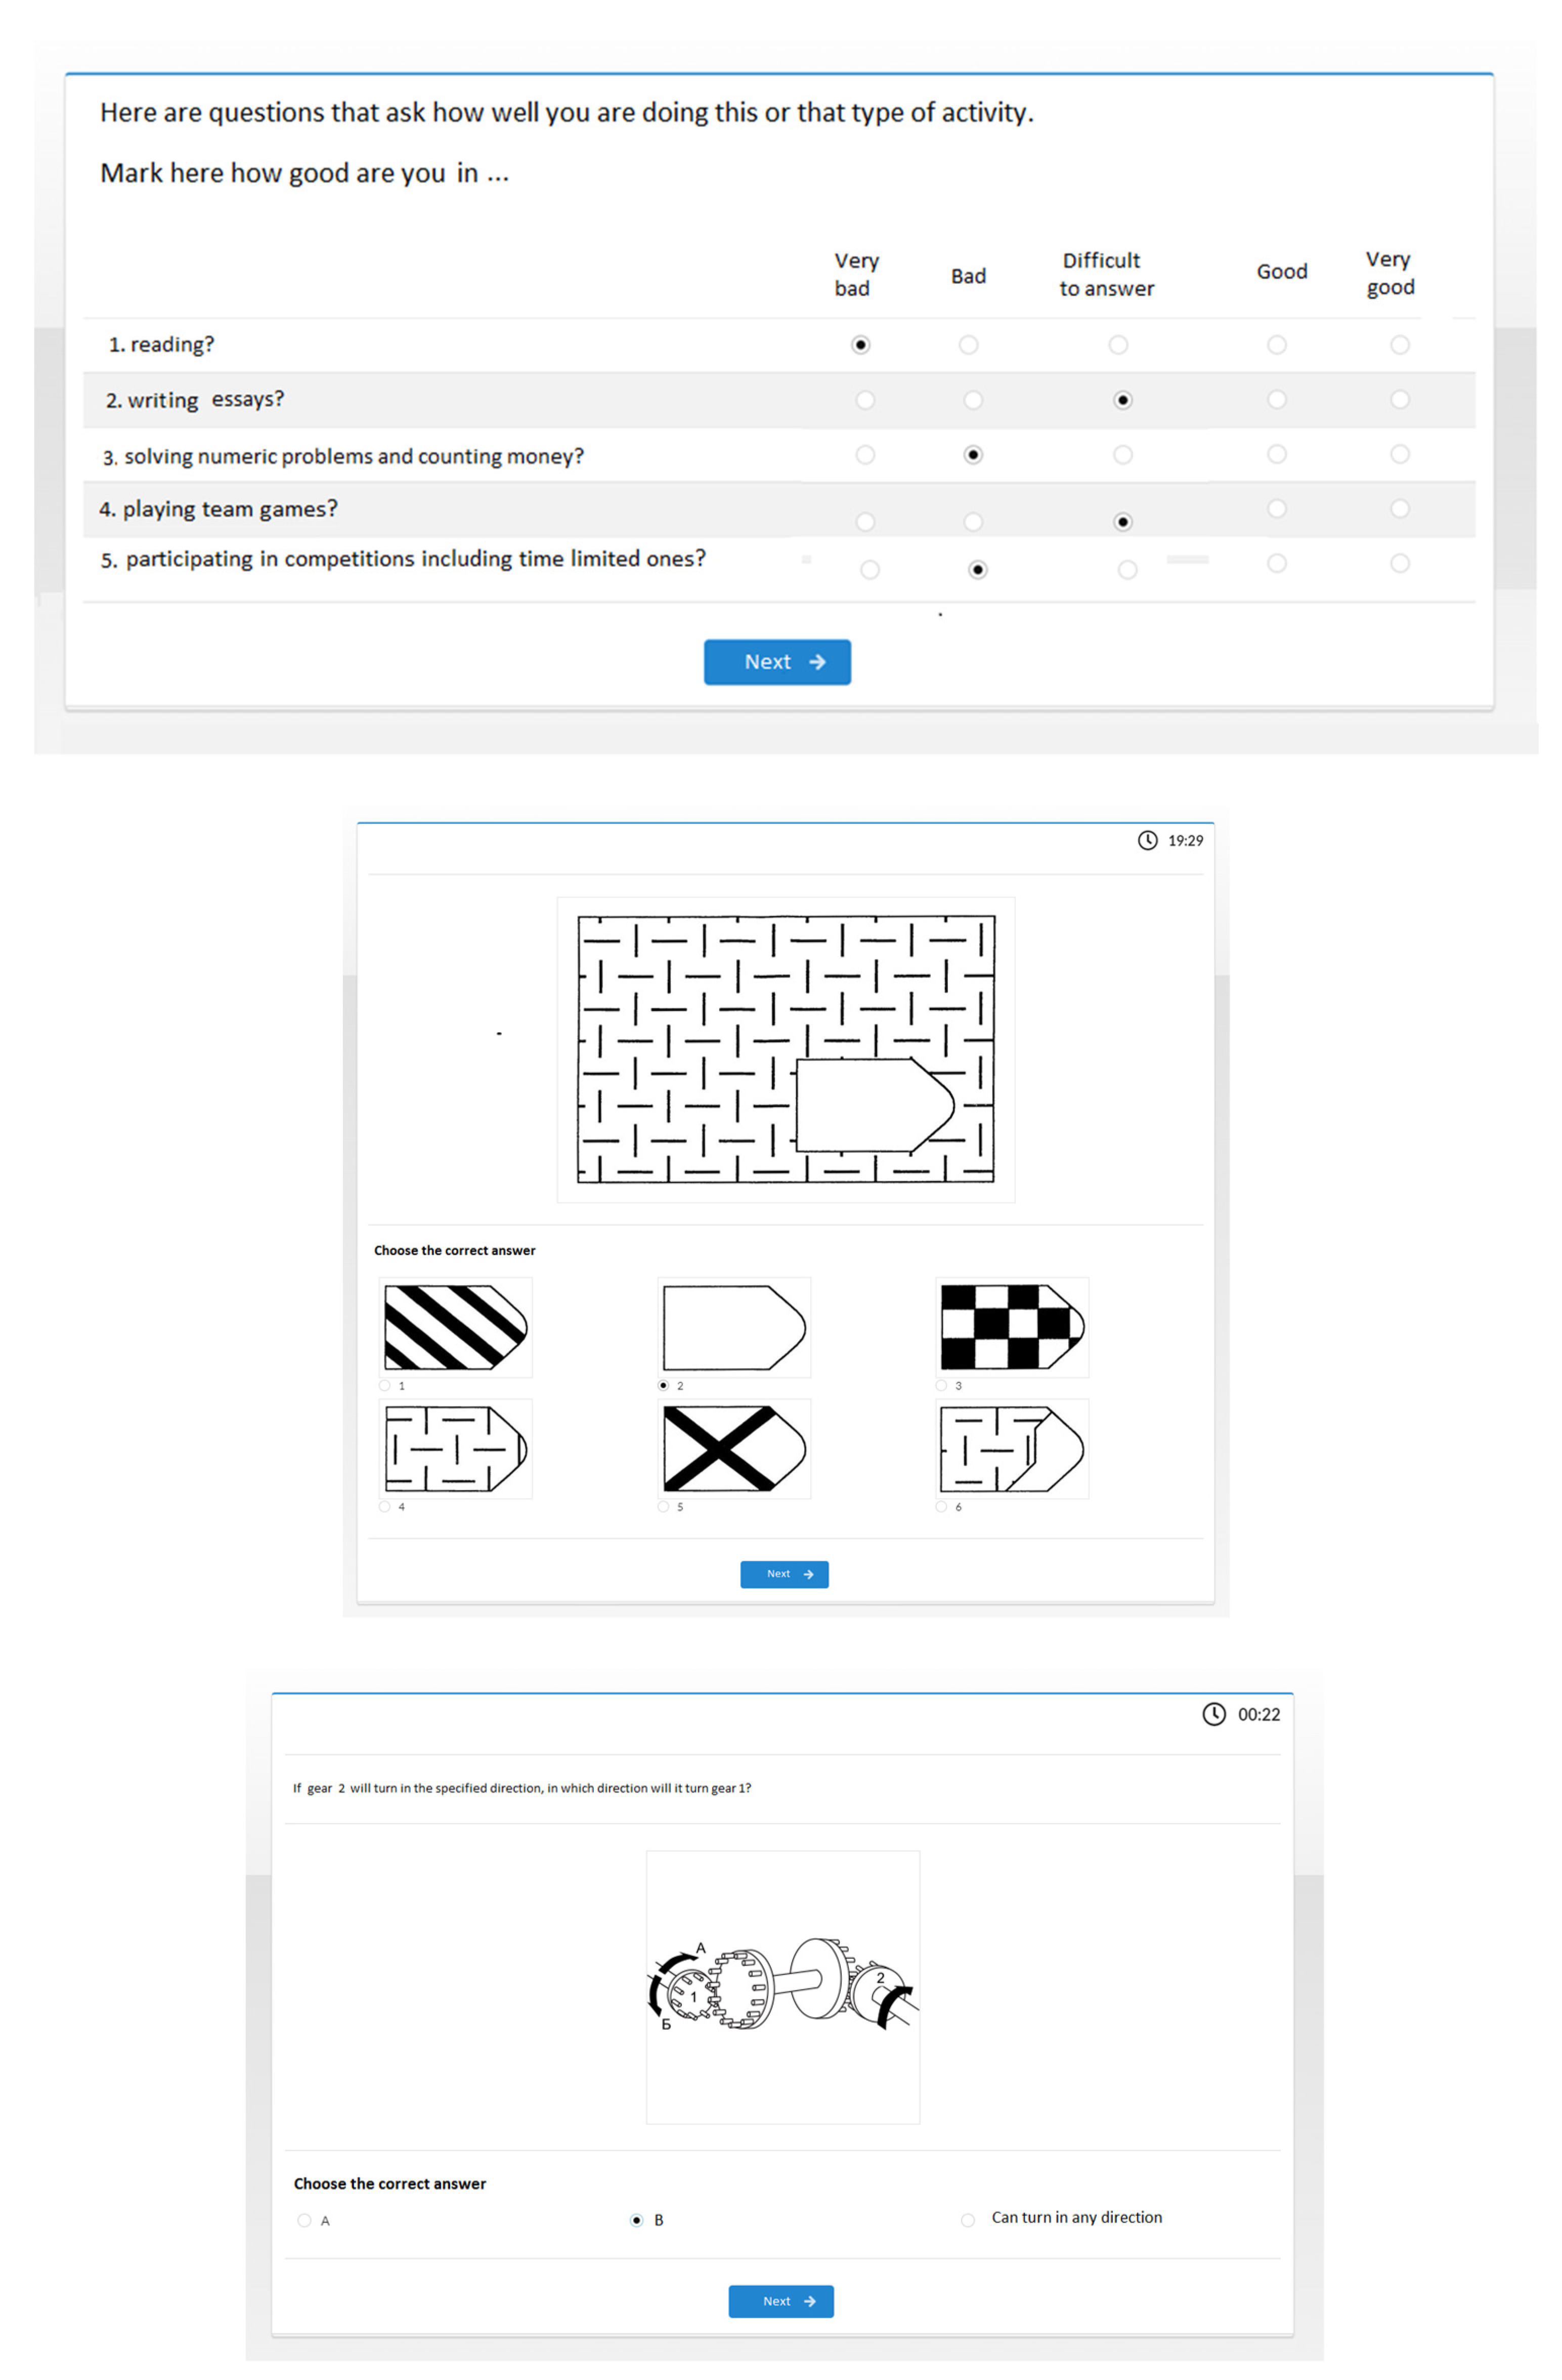
Figure 1 shows examples of web pages with user tasks. The platform used a web interface that users opened on any of their devices with Internet access. Not only the results of the answers were saved, but also the reaction times of the users. The latter were used in the present study. The student could see their answer time in the upper left corner of the screen.
The number of questions per page varied but was the same for all users. User reaction time is the time interval from the beginning of the web survey screen presentation until the user clicked the “Next” button. Technically, response time was defined as the difference between the last recorded response time (including returning to the page to change the response) and the time of the first display.
To solve the problem, we used a characteristic of chaotic time series, the value of the largest Lyapunov exponent, which allowed identifying clickers and bot-like users in the experimental data during long-term interaction with the digital environment.
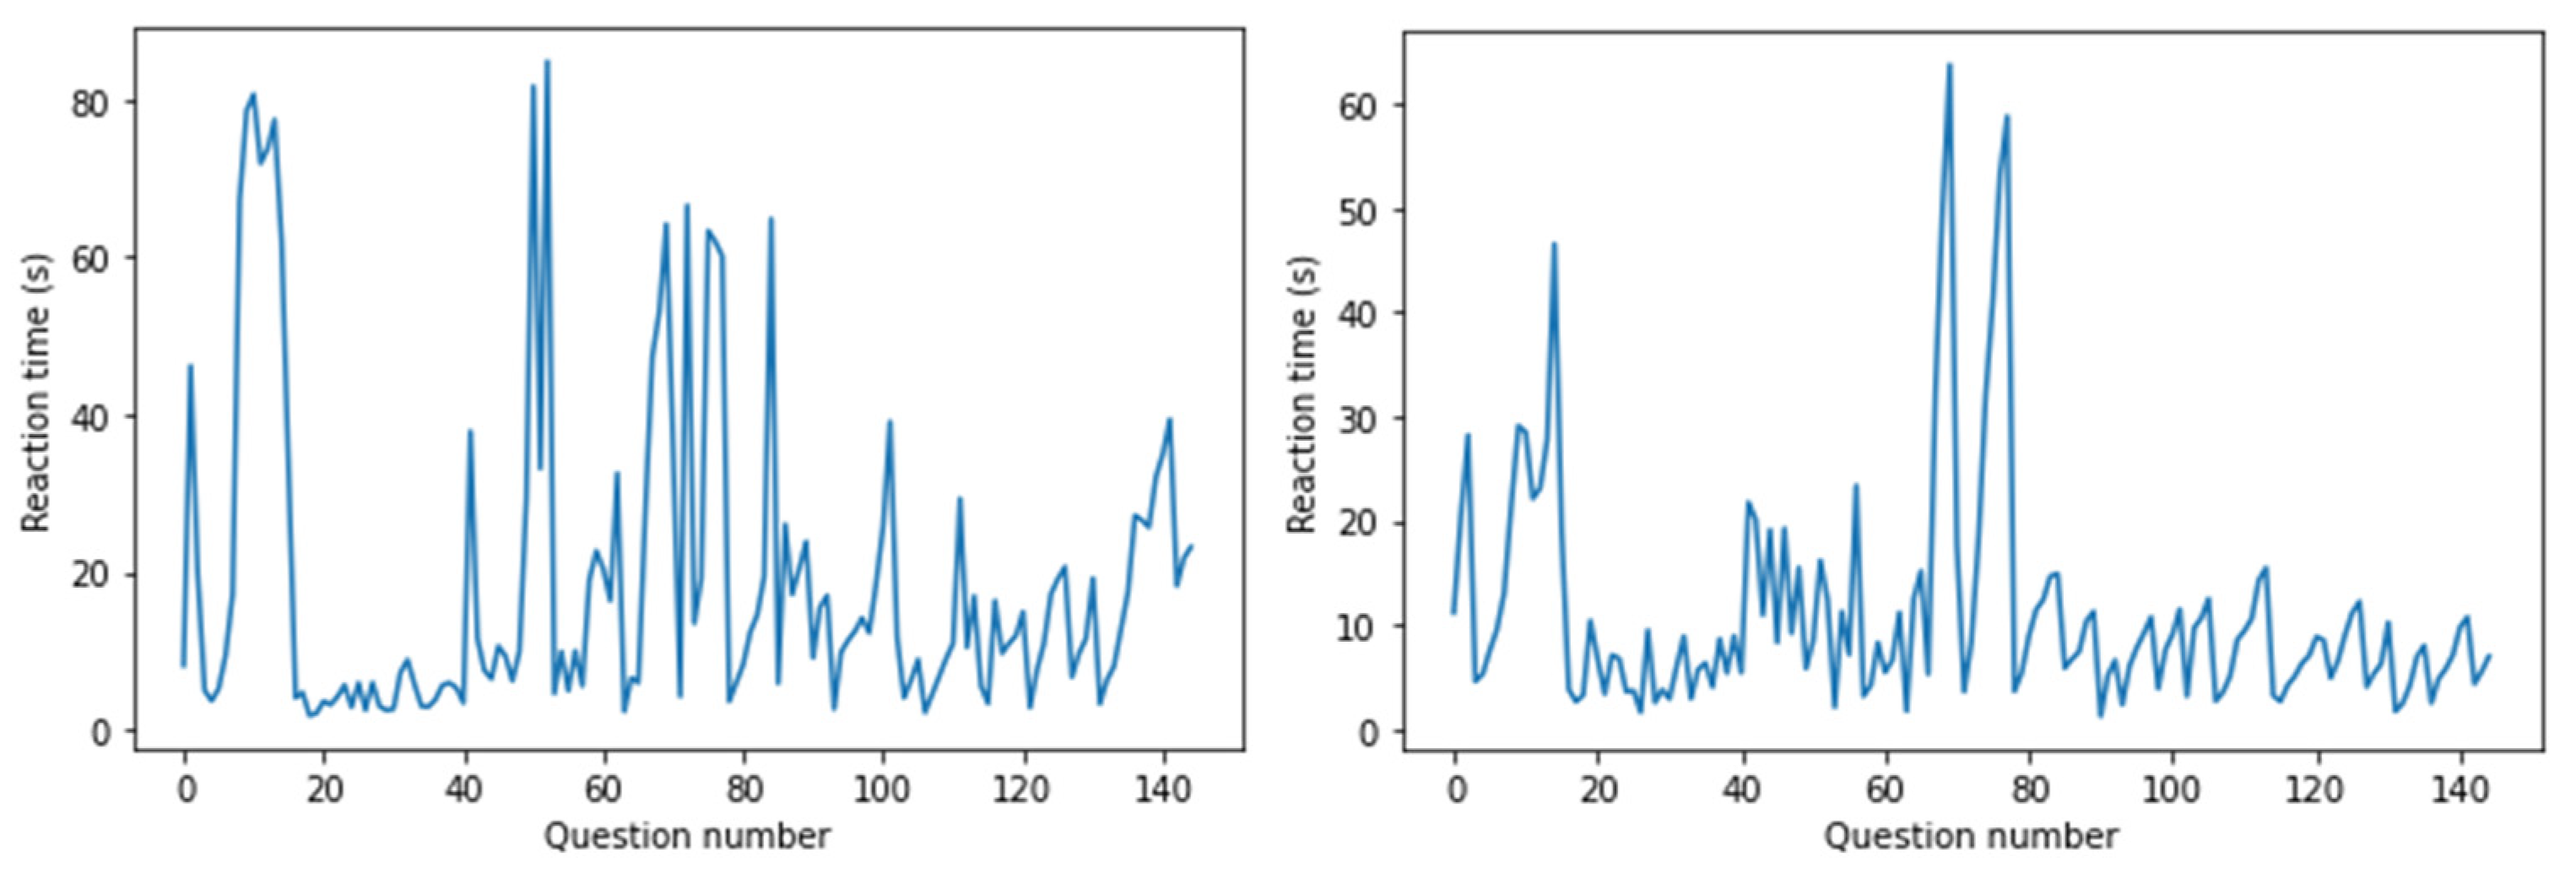
For each user, we built a time series representing the reaction time when working with web interfaces, an example of a time series is shown in
Figure 2. All students answered equivalent tasks and questions in the same order.
It was necessary to identify users with a pattern of clicker behavior that either from the beginning of the interaction or after several questions, answered “without thinking”. A typical series of uninvolved user reactions is shown in
Figure 3. All students answered equivalent tasks and questions in the same order. Minimal values close to zero reflect the pattern of the clicker user. Here, the user clicked through multiple answers without even taking the time to read the question.
It was also necessary to identify users with a pattern of bot behavior, that is, there is a pattern in the reaction time, in other words, there are no chaotic phenomena.
Using various chaotic dynamics indicators, it was found that for the series in question, a computationally reliable characteristic is the largest Lyapunov exponent (LLE). The use of dynamical systems and chaos theory to capture and then recognize the underlying dynamics of various human activities has shown good results [
32,
33,
34]. The hypothesis is that for engaged users, there is chaotic behavior (diverging phase trajectories), hence, their
λ value will be non-negative, while the responses of clickers and human bots will be characterized by shrinking phase trajectories, their
λ value will be negative.
Assume that the obtained user reaction time series
= (
T(
q1),...,
T(
qi),...,
T(
qn)),
T—reaction time(s),
q—question,
i—question number [1, ...,
n] is formed by a dynamic system with chaotic dynamics. For the time series, provided that
n ≫ 2, the MPE equation can be calculated:
There .
5. Results
A sample of 22,236 student web test entries was considered for Experimental Study I.
It was found that out of 22,236 entries, 21,663 entries had a non-negative
λ.
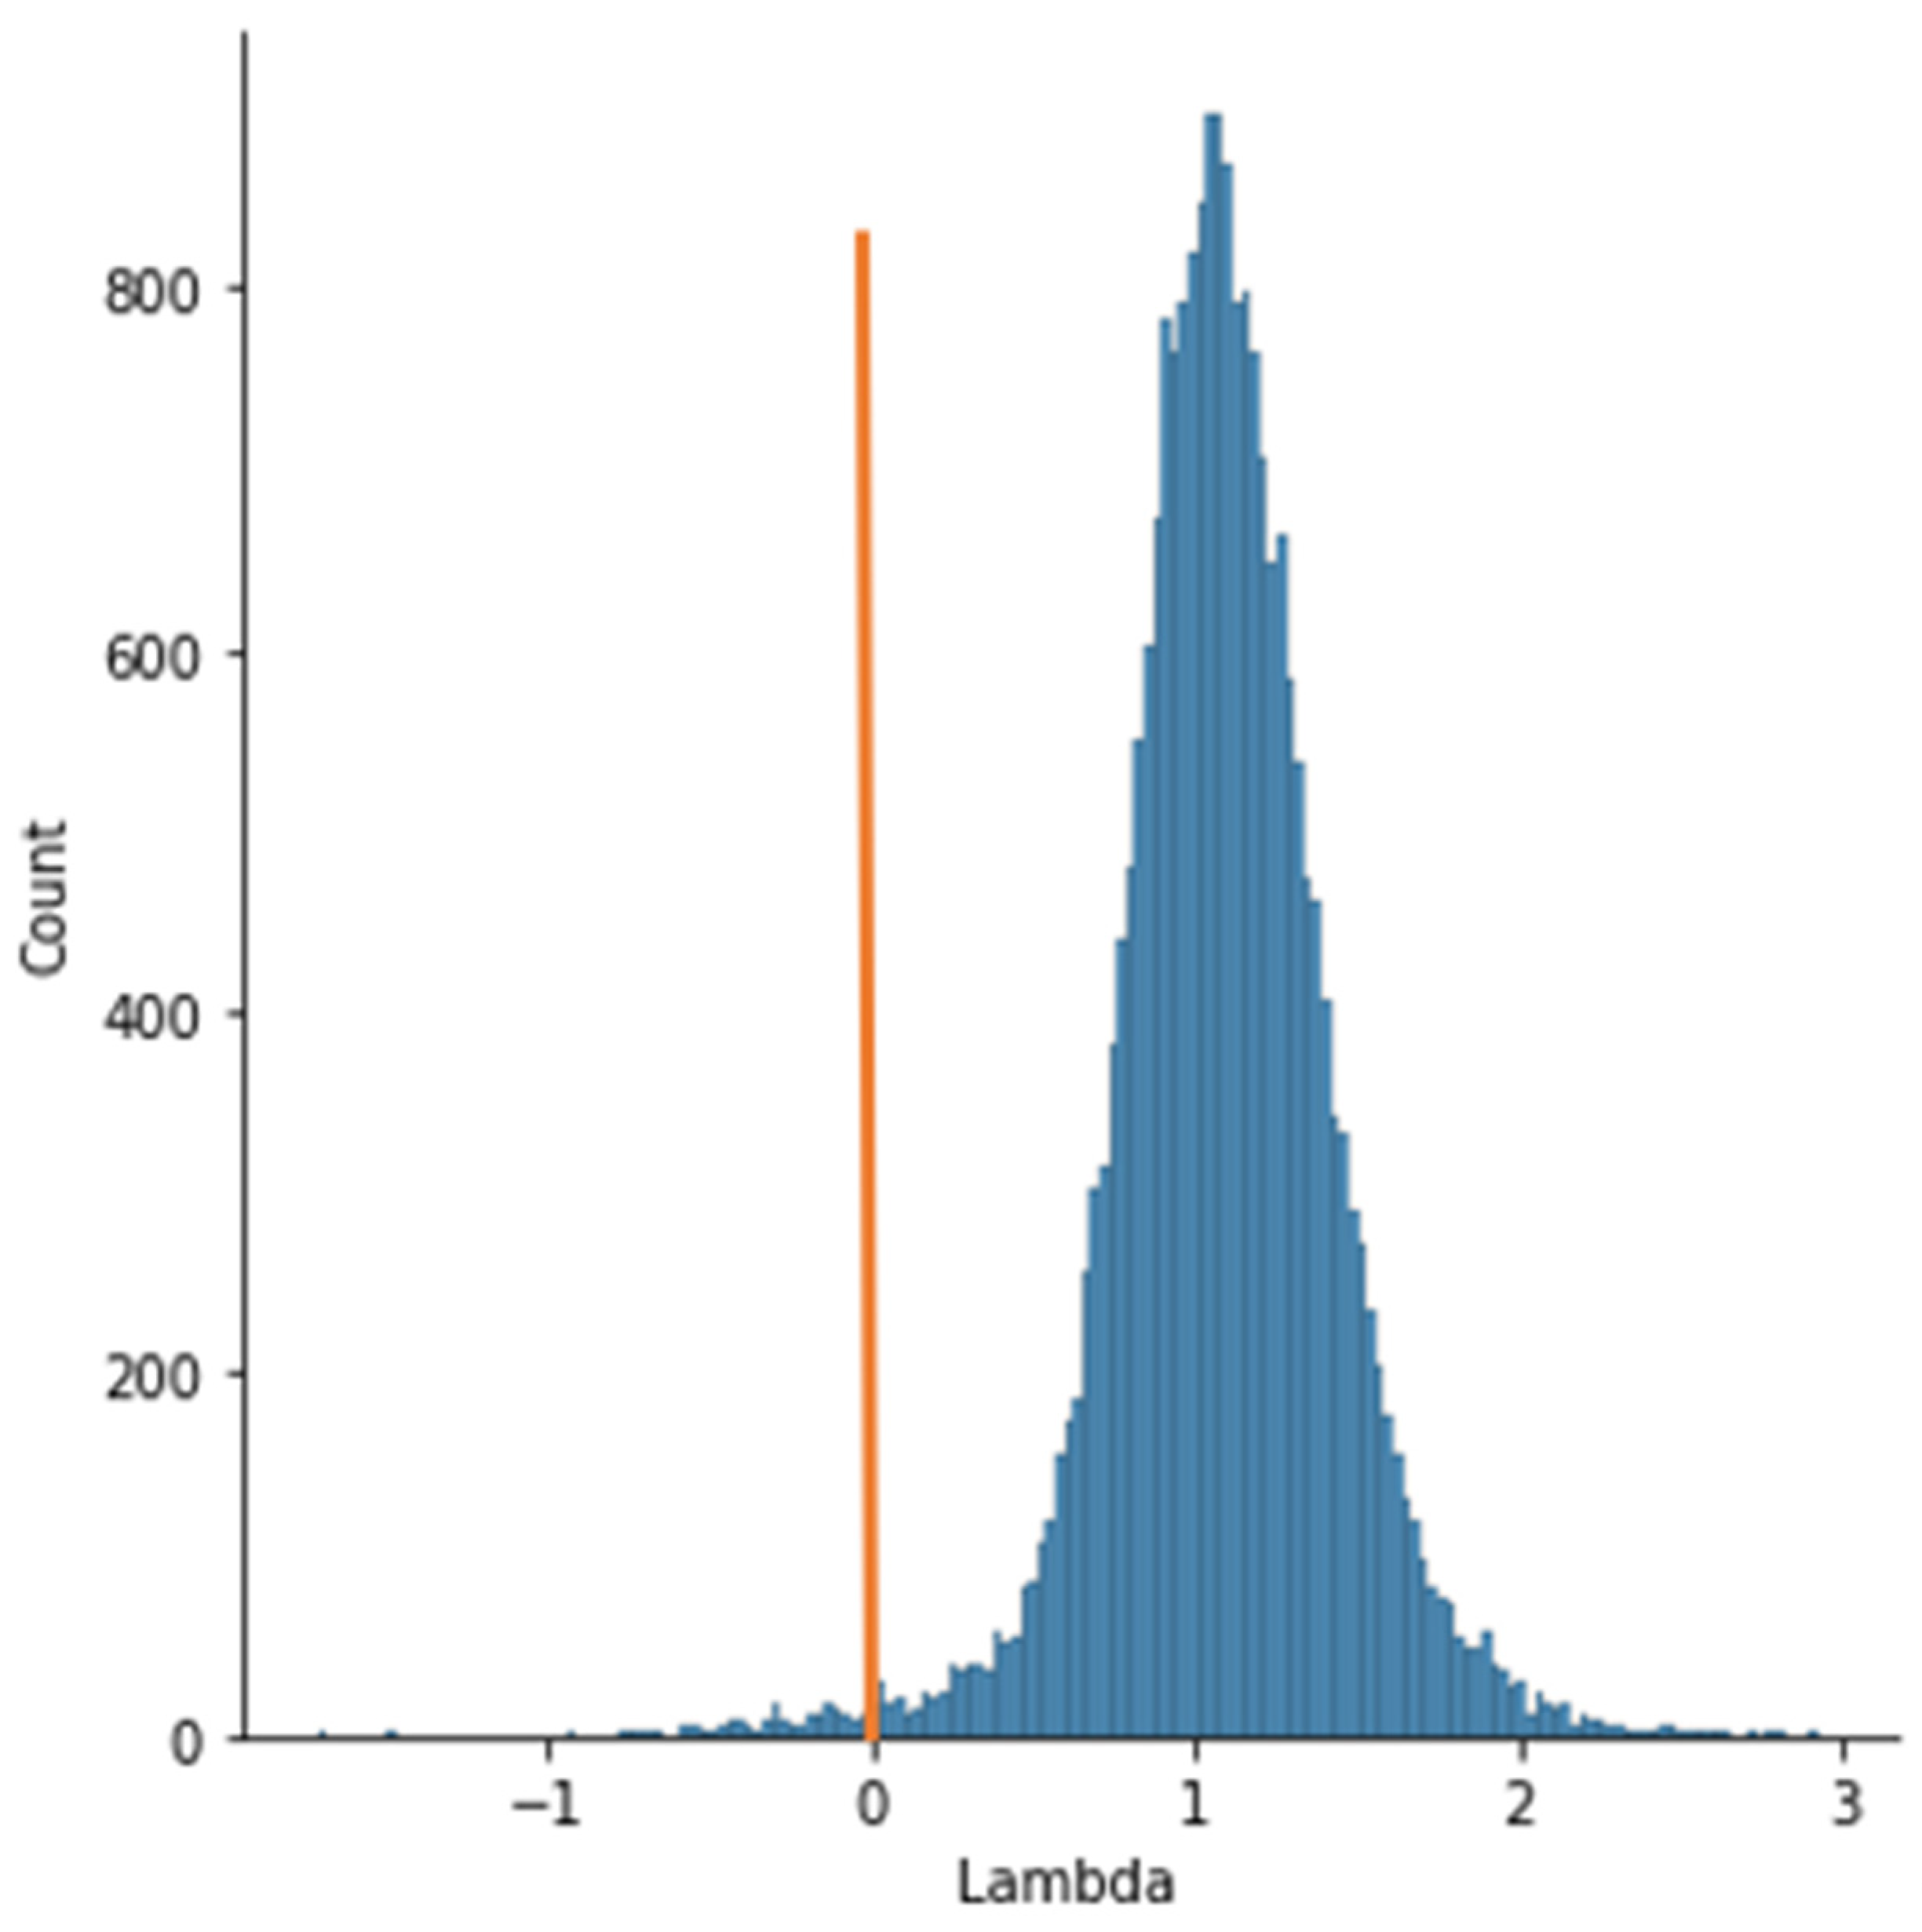
Figure 4 shows the distribution of
λ values for the entire sample. The orange line is the border, to the right of which there are positive values, that is, chaos takes place. There are 573 records with negative
λ.
Thus, the proportion of rows negative according to the λ indicator (the share of clickers) is 2.48%.
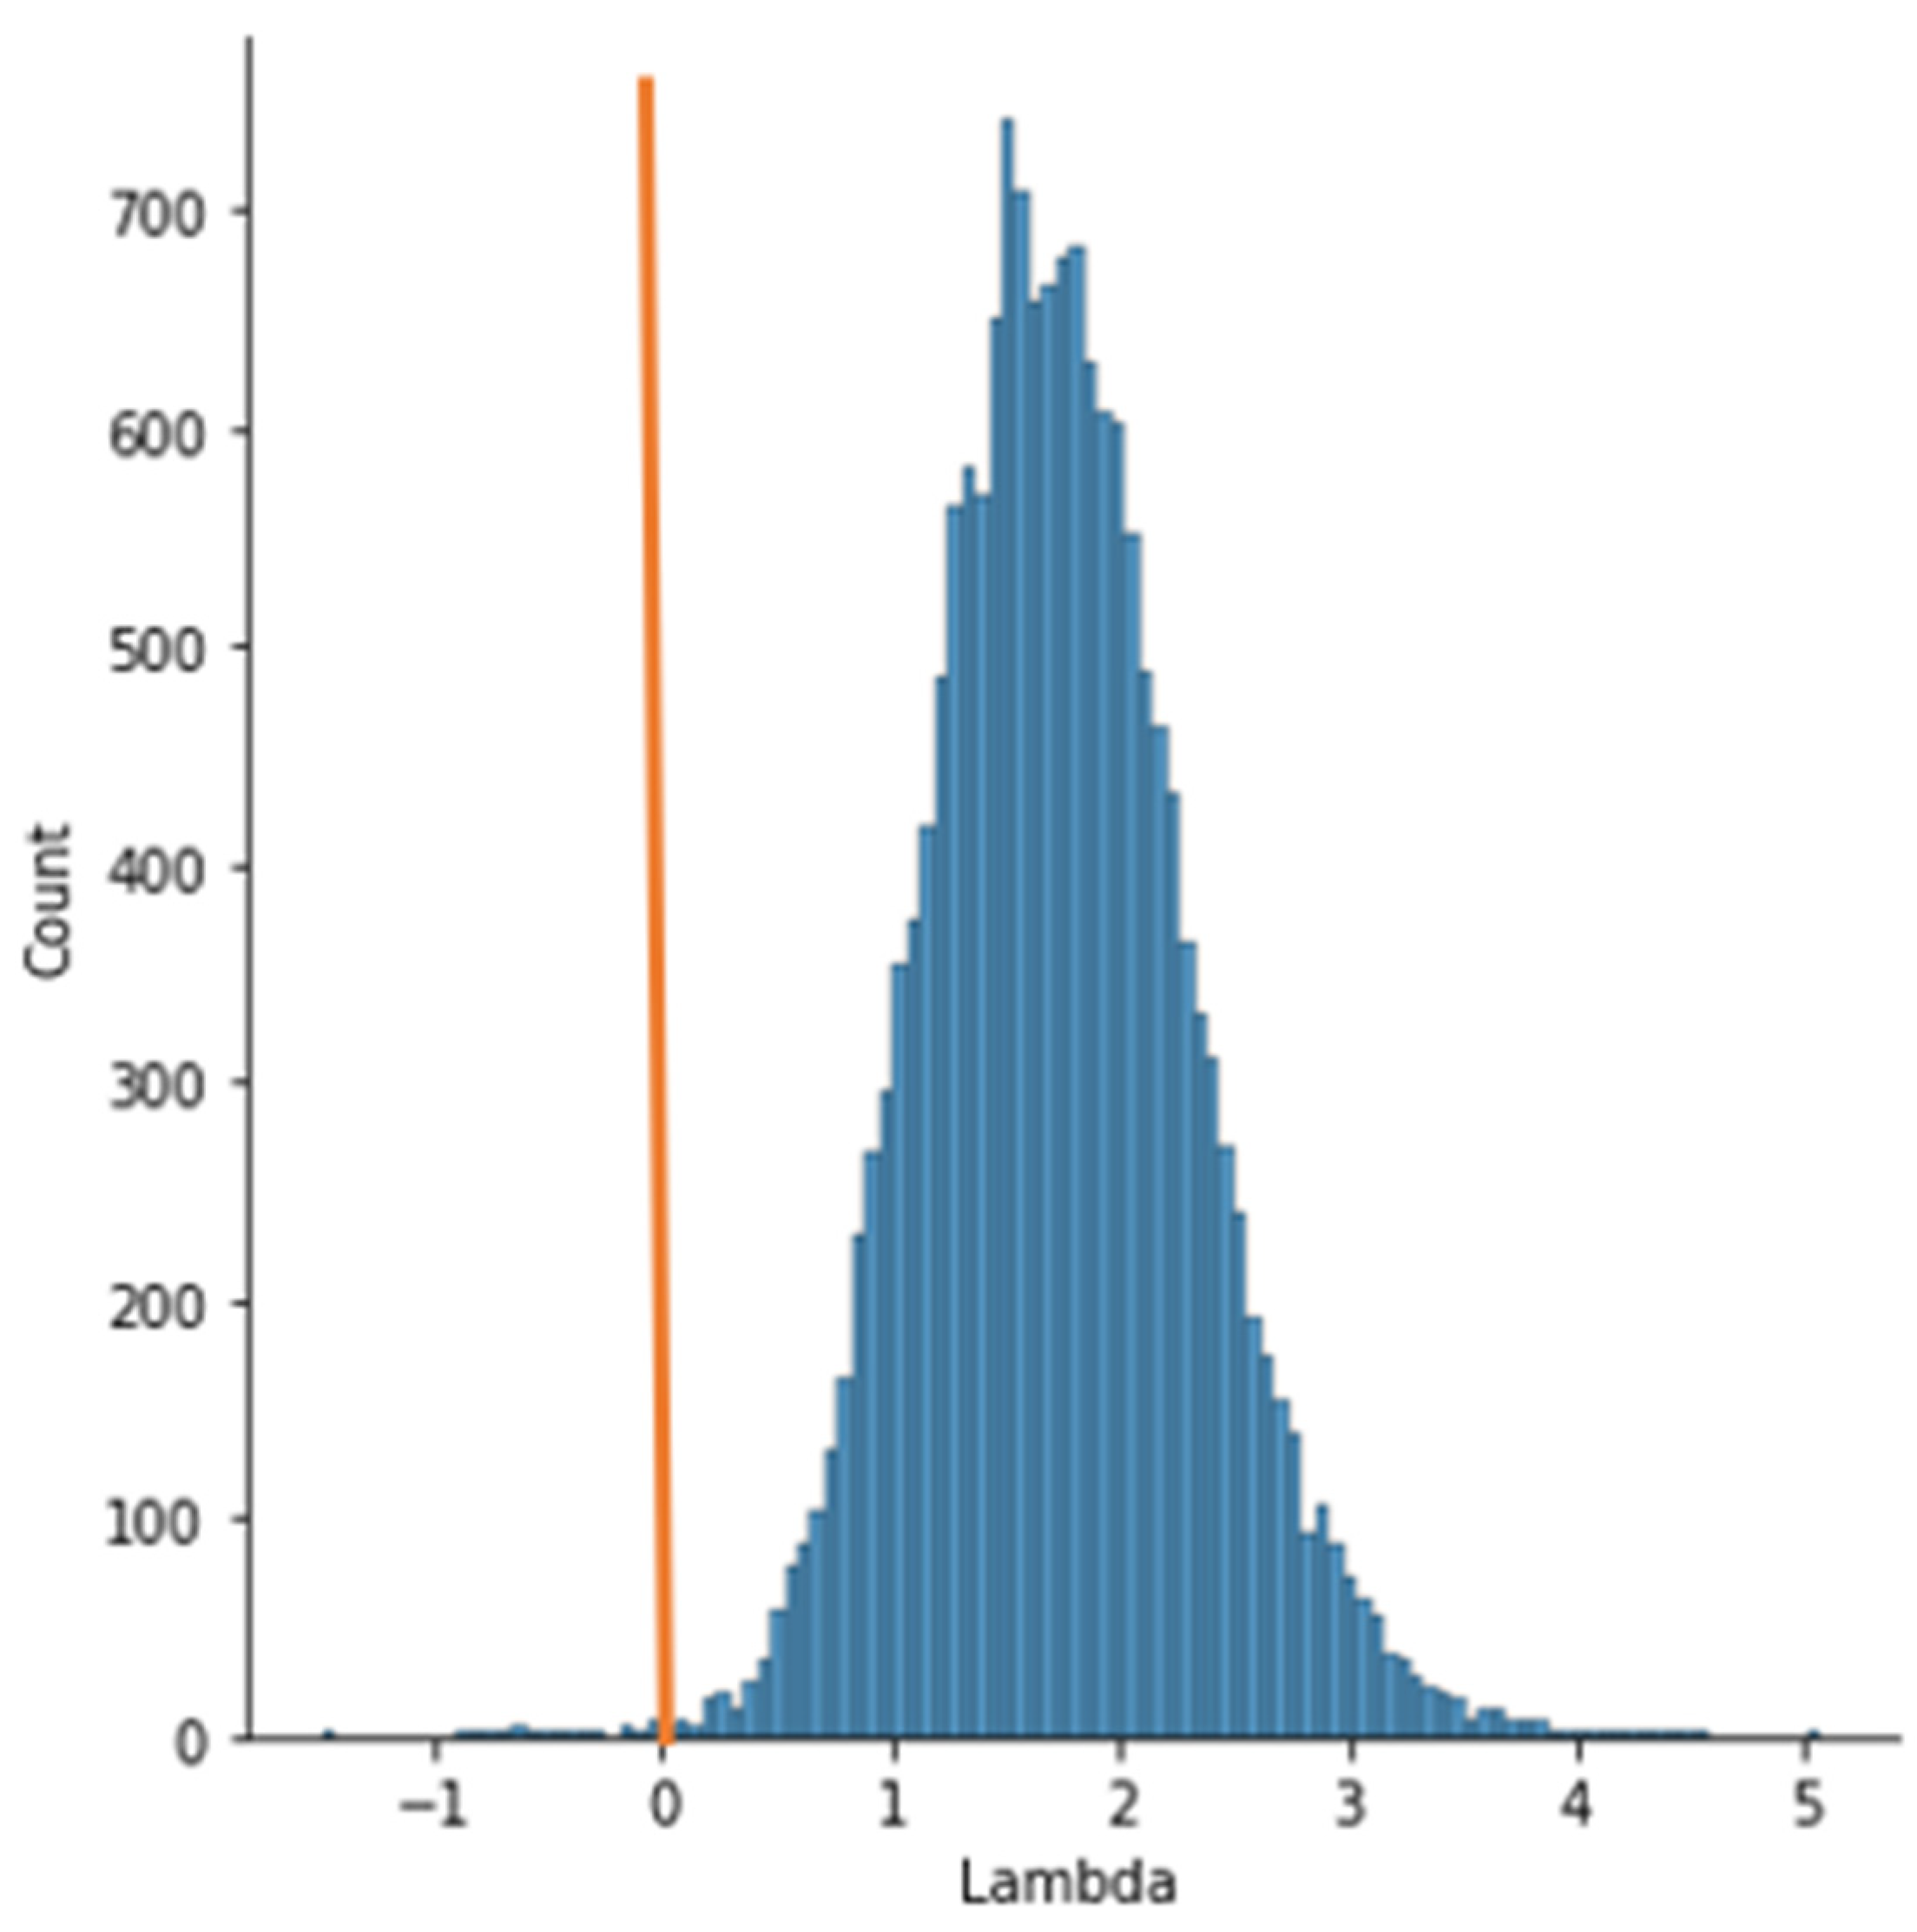
With the reduction of the initial sample (users’ data containing values beyond 3σ were removed) to 13,444 records, the LLE calculations were performed.
Figure 5 shows the distribution of
λ values for the modified sample.
The 13,083 records had a non-negative index λ. Negative λ had 361 records. The proportion of negative values was 2.68%. Thus, filtering the data significantly reduced the sample but did not change the proportion of clickers in the total sample and the shape of the distribution of λ values.
For Experimental Study II, a sample of 16,350 user response records discussed in the article [
14] was used.
Figure 6 shows the distribution of
λ values across the sample.
In this experiment, only 27 entries out of 16,350 were made by uninvolved clicker users. This is consistent with the organizational support for this study, which was provided by the administrations of educational institutions.
A script bot was developed to complete the web survey in Experimental Study II, automatically answering the questions posed. It shows the behavior pattern of the bot, which was generated programmatically. We applied the calculation of
λ to a sample of data from 688 records generated by this bot (
Figure 7). For all records, the value of
λ was negative. The distribution of
λ values is shown in
Figure 7.
Thus, the experiments confirmed the hypothesis of identifying non-involved users in the interactive process on the basis of non-negativity of LLE as characteristic of chaotic dynamics.
6. Conclusions
The paper considers the task of controlling the involvement of the user in the interactive process of educational web services. To implement it, it is proposed to use user reactions, which are fixed time ranges between the provision of a screen form and user reaction in the web-interface. Two types of patterns of uninvolved interactive behavior of students are identified—bots and clickers. As a computational characteristic that distinguishes the two types we proposed to use the characteristics of chaotic dynamics. Computational experiments were conducted for big data, showing the possibility of identifying bots and clickers in the total volume of users. The proposed solutions will improve the system of current control of educational involvement in digital environments, as well as remove unreliable data in web surveys and psychological studies.
It should be noted that computer vision and body sensor methods for assessing engagement give a more complete objective picture of the learner’s state for further analysis in comparison with the methods of engagement tracing based on learner’s reaction time, however, they require the presence of appropriate sensors, which may often not be applicable in a particular context. Sensory observation is explicit to the learner and is an additional stressor, such as knowing the learner is being captured by the webcam while solving a problem. Thus, further development of the hidden engagement assessment methods is relevant, while new computationally efficient techniques for analyzing learner’s reaction time to assess engagement can be developed based on the results we obtained.


 ,
, 


