Article

User Experience of a Mobile App in a City Tour Game for International Doctoral Students

by
Margarida M. Marques
* and
Lúcia Pombo
*
CIDTFF—Research Centre on Didactics and Technology in the Education of Trainers, Department of Education and Psychology, University of Aveiro, Campus Universitário de Santiago, 3810-193 Aveiro, Portugal
*
Authors to whom correspondence should be addressed.
Educ. Sci. 2023, 13(12), 1221; https://doi.org/10.3390/educsci13121221
Submission received: 13 October 2023 / Revised: 29 November 2023 / Accepted: 6 December 2023 / Published: 7 December 2023
(This article belongs to the Special Issue Assessment and Evaluation in Higher Education—Series 3)

Abstract

:
Mobile augmented reality games (MARGs) offer exciting possibilities for enriching outdoor learning and enhancing tourism experiences. However, there is a notable gap in understanding the perspectives of doctoral students on these innovative approaches. This paper presents the results of a case study conducted during the 2023 EERA Summer School in Portugal, where PhD students in Education, from universities all around the globe, engaged in a MARG for sustainable development education. Seventy-three students embarked on a walking city tour, whilst playing an interdisciplinary game supported by the EduCITY Smart Learning City Environment. It comprises a web platform, an app, location games, and game creation training. Students experienced the EduCITY app, which guided them through a designated city path encompassing tourist sites, while promoting diverse learning opportunities. At the end, students provided feedback through a short and anonymous evaluation questionnaire, incorporating the user experience questionnaire and one open-ended question for improvement suggestions. This study revealed valuable insights into the doctoral students’ perspectives on the EduCITY app’s user experience, highlighting the strengths of “Attractiveness”, “Stimulation”, and “Novelty”. However, it also identified areas for improvement, particularly in “Dependability” and “Efficiency”. The analysis of the open-ended responses suggested that “Attractiveness” and “Perspicuity”, while not immediate priorities, should be considered in refinement phases as well. As more and more students recognize the importance of MARGs in education, there is a growing need for research in this field, aligning with the 2030 Agenda for Sustainable Development, Goal 4.

1. Introduction

Sustainability challenges, although recognized for decades, have intensified globally, particularly in urban areas, where approximately 55% of the 7.7 billion world population resides [1,2]. Raising sustainability awareness is crucial for fostering behavioral change. Communities must have opportunities to reflect on their actions and to develop the necessary competencies to act in a sustainable manner [3,4]. Smart Cities are emerging as potential solutions to the sustainability problems exacerbated by rapid urbanization [5]. This concept is closely associated with employing smart technologies supporting stakeholders’ access to information to improve city life [6], making cities inclusive, safe, resilient, and sustainable, as outlined in Goal 11 of the 2030 Agenda for Sustainable Development [7].
Studies on Smart Cities show the potential for adopting mobile devices for data generation, collection, and curricular learning. Mobile devices can seamlessly integrate interactive digital content with the physical environment, creating augmented reality (AR) experiences, representing an innovative approach in education [1,2]. They provide access to contextualized information, supporting situated learning [1]. The combination of mobile devices and AR, coupled with gamification, proves effective in engaging learners [2,3]. Thus, they hold value in education by offering new experiences in non-threatening scenarios, supporting school learning, and fostering competencies, such as problem-solving and decision-making [3,4].
In education for sustainability, games can raise awareness, facilitate learning, and drive behavior change [5,6]. Mobile AR games (MARGs) in outdoor collaborative learning activities present significant potential for educational and tourism purposes.
Stemming from EduPARK’s success [1,7], the EduCITY project emerged. EduCITY promotes innovative interdisciplinary learning strategies within the context of education for sustainability in the outdoors, merging teaching, mobile learning, and AR in urban settings. The project team developed a Smart Learning City Environment comprising four main elements: a mobile app, a web-based platform, educational games, and game creation training. The app allows access to AR content and environmental sensor data, both in free and game modes. The game mode enables people to explore the city through games aimed at students and teachers from basic to higher education, as well as the whole community. These games are collaboratively developed by the team, as well as by different members of the (educative) community, in the user-friendly web-based platform, which does not require programming skills for game and AR content creation.
The supporting technologies for the implementation of MARGs are increasingly pervasive and popular [8], so it is time for their adoption in educational contexts. For this to happen, it is not only important that teachers learn how to use them, but also that they have access to user-friendly software that supports these pedagogical approaches [9].
PhD students in Education bring a unique set of skills and knowledge to the evaluation of user experiences in MARGs. Their growing expertise in, e.g., educational pedagogy enables them to have a deep understanding of how users engage with AR games in educational settings [10], and positions them as crucial contributors in understanding and evaluating the educational impact of these technologies (mobile and augmented reality) and learning approach (game). Moreover, the exposition of PhD students to emergent learning technologies and pedagogical approaches, as is the case of MARGs, is relevant as the students can contribute to bridging gaps in current evaluation practices [10,11] by contributing to research on user engagement, learning outcomes, and the impact of MARGs in educational settings [12,13].
Despite the abundance of studies on MARGs, there is a notable absence in the research specifically targeting the perspectives of PhD students in Education. Hence, the main aim of this paper is to analyze the above-described prototype of the EduCITY app in respect of the user experience of PhD students in Education. One robust instrument to measure user experience is the User Experience Questionnaire (UEQ) [14], which has been used to quantitatively measure “Pragmatic Quality” (task-related attributes) and “Hedonic Quality” (non-task-related attributes), as well as the overall attraction of the software, in a reliable and valid way [15,16,17]. This tool integrates six scales, as shown in Figure 1. The overall attraction of the software is assessed through the “Attractiveness” scale (general impression regarding the acceptance or rejection). This is linked to the “Pragmatic Quality” scales: “Perspicuity” (easiness of use), “Efficiency” (sense of organization and easiness of task completion), and “Dependability” (predictability and control of the interaction). It is also connected to the “Hedonic Quality” scales: “Stimulation” (interest and excitement) and “Novelty” (innovation and creativeness).
Mobile apps have been evaluated through a UEQ. For example, ref. [18] evaluated Halodoc, a mobile health application, to address complaints and negative reviews regarding the app’s usability. The Halodoc’s evaluation was conducted using a mixed-method approach, which included the use of a User Experience Questionnaire (UEQ) and usability testing. The authors claim that this app obtained a “positive user experience value because all scales show an average value greater than 0.8” [18] (p. 69).
Sabukunze and Arakaza [19] analyzed the user experience of the Grab mobile app using a UEQ. The study revealed the level of satisfaction of users of the app, which was positive in all scales, with “Dependability” being the scale with a lower performance. The authors highlight that this research is important to improve the usability of mobile applications and to reduce errors for users, and hence to improve the service quality and increase user satisfaction.
Another study [20] explores the use of mobile learning with the Discord app to create an interactive and engaging learning experience for students. The study found that the use of media and technology can positively impact students’ critical thinking and problem-solving skills. Once more, the user experience scales reached a positive value for the evaluated technology.
The user experience of mobile augmented reality apps has been studied as well. For example, ref. [21] used different evaluation tools to understand the overall user experience, including a user experience questionnaire, expert evaluation, and the Handheld Augmented Reality Usability Scale. The study found that the main factors influencing the positive user experience are the explicit purpose of the application, easy to use and learn, smooth operation, imaginative information presentation, and interactivity. The study recommends that augmented reality applications should be clear and user-friendly, with short, clear user instructions provided at the start step of the application.
The research reported in this paper is guided by the research question “How do doctoral students in Education evaluate the user experience of a prototype app that integrates mobile and augmented reality games, and which are their improvement suggestions?”. For that purpose, a case study was conducted, where the perceptions of international PhD students were collected through a questionnaire, answered after game playing with the EduCITY prototype app during the EERA Summer School 2023, in Portugal. Anonymous game logs (e.g., score) are collected automatically by the app for contextual information about the activity.
The next sections briefly present and discuss the adopted materials and methods, followed by the results concerning the points of view of the game users. The last section, Conclusions, summarizes the main findings, some limitations, and lines of future work.

2. Materials and Methods

This research was conducted under a case study [22], which is considered, in the literature, as an effective methodology to investigate and understand complex issues in real-world settings that do not aim to extrapolate probabilities through statistical generalization [22,23]. This research approach is adequate when researchers want to understand a real-world case and assume that such an understanding is likely to involve important contextual conditions [22].
The case in this study includes one initiative developed under the EERA Summer School 2023, in Portugal, attended by international doctoral students in Education, from universities all around the globe. The initiative was a 3 h city tour in Aveiro, which was unknown to the PhD students. In this tour, 73 students explored an interdisciplinary game named “Aveiro walking” that was supported by the EduCITY app, integrating AR content. This was the first time any of the PhD students had used this app, as it is still in development and the software has never been publicly released, and they reported no previous experience with augmented reality nor with other similar software. Here, they experienced the EduCITY Smart Learning City Environment, by walking in a specific path in the city. The game path included tourist sites, while promoting learning about several subjects. It started at the Rectory of the University of Aveiro and ended in the area of the bridges in downtown Aveiro, integrating 9 points of interest in a total of 25 questions with feedback that integrates several educational resources, in themes such as Mathematics, Natural Sciences, History, Visual Education, Citizenship, Environmental Education, in addition to curiosities about the city, traditions, and natural and built heritage of Aveiro. Hence, a purposive sampling method was used. Volunteer participant consent was obtained from the respondents.
This study intends to analyze the mobile app prototype, with the aim of understanding the user experience it provides, according to the PhD international students in Education. So, the research question that guided the work reported in this contribution is: How do doctoral students in Education evaluate the user experience of a prototype app that integrates mobile and augmented reality games, and what are their improvement suggestions?
To answer the research question, the doctoral students answered a short and anonymous evaluation questionnaire immediately after the end of the game-playing activity.

City Tour Questionnaire for Game Users

The City Tour Questionnaire allowed for understanding how participants evaluated the EduCITY app and their motivation for participating in the educational touring game activity. The questionnaire comprised a set of closed- and open-ended questions and it was organized into three sections.
Section A—Value of the EduCITY app, with the list of 26 attributes of the app from the User Experience Questionnaire (UEQ) [15]. This UEQ is a semantic differential, where a list of items is presented to the respondent with opposite meanings, and it is composed of six scales, as presented before in Figure 1. According to this questionnaire, attractiveness, pragmatic quality, and hedonic quality contribute to the overall experience of the user. Attractiveness tends to measure the general impression towards the likeness of the product and includes items such as annoying/enjoyable or pleasing/unpleasant. Pragmatic quality is composed of three scales: efficiency, perspicuity, and dependability. This measures the task-oriented features like fast/slow, clear/confusing, or unpredictable/predictable. Finally, hedonic quality relates to aspects that appeal to a person’s desire of pleasure and avoidance of boredom and discomfort. Hence, it comprises the stimulation and novelty scales, and includes items such as boring/exciting and conservative/innovative [15].
Each line has pairs of contrasting attributes that may apply to the app. The circles between the attributes represent gradations between the opposites. Participants are invited to express their agreement with the attributes by ticking the circle (from 1 to 7) that most closely reflects their impression. For data analysis, the excel sheet “UEQ_Data_Analysis_Tool_Version12” (downloaded from the site www.ueq-online.org at https://www.ueq-online.org/Material/Data_Analysis_Tools.zip accessed on 21 August 2023) was used. It requires the researcher to introduce the raw data and it automatically outputs scale values, bar charts, and other basic statistical indicators. As this study implementation of the questionnaire is not applied in a controlled environment (users answer after playing the game, in the outdoors), not all participants answered all items seriously. To detect suspicious answers, the initial analysis comprised checking if all items in a given scale measured a similar aspect of the user experience. Hence, three questionnaires revealed a big difference (≥3) between the best and worst evaluation of an item in a scale, in two or more scales, and were eliminated from the data set. Additionally, one more questionnaire was eliminated as it contained more than 15 items with the same response, indicating a lack of ponderation.
This section also included an open-ended question with suggestions to improve the app, which was analyzed through inductive categorical content analysis [24]. The unit of analysis was the answers’ main themes, and no sampling was conducted, so all the answers were analyzed. The coding scheme was developed based on the data themes.
Section B—Motivation and overall appreciation of the activity. The closed question was based on the Situational Motivation Scale (SIMS) [25], which measures four forms of motivation: intrinsic motivation, identified regulation, external regulation, and amotivation. The scale comprised a list of 16 sentences where participants circled the number that best describes the reason why they have engaged in the activity. A scale from 1 to 7 was used, where 1 “corresponds not at all” and 7 “corresponds exactly”. This question was not considered for this study analysis, as it is not directly related to the research question.
The following question of this section requests participants to complete three sentences about what they have liked, or not, concerning the EduCITY activity. The last question was for participants to give a concrete example of something they have learned from this Smart Learning City Environment. To analyze these open-ended questions, an inductive categorical content analysis [24] was conducted.
Section C—My profile asked respondents to fill in their age and gender, which were analyzed through simple frequency count.
In this study, the analysis is focused on section A of this questionnaire.

3. Results and Discussion

This section starts with the brief characterization of the participants and contextual aspects of the activity, followed by the game users’ perspectives on their user experience with a mobile augmented reality app.

3.1. Study Participants and Contextual Results

To triangulate students’ perceptions on the app, data logs collected anonymously were analyzed to provide general insights regarding game performance. The data logs comprise each group’s obtained score (including the points gathered in questions with AR), number of correct and incorrect answers for each question, among other information.
Considering the game players, 53 PhD students agreed to participate in this study and answered the questionnaire. Most students were female (39), 10 were male, and 4 did not disclose their gender.
The three most frequent classes of age were between 25 and 29 years old (16), between 30 and 34 (14), and between 35 and 39 (8). The remaining classes of ages had 3 students (40–44 and 45–49), 2 (20–24), and 1 (50–54, 55–59). Five students did not disclose their age.
Table 1 and Table 2 show the contextual results of the game-playing activity. Participants played the game in 14 groups. Each group had 3 to 10 members, with an average of 5 members and achieved an average of 71.4 points and 15.7 points through AR, with a range of 35 to 113 and 5 to 30, respectively. In a game with 25 questions, the PhD students were able to correctly answer an average of 16.1 questions (ranging from 10 to 23) and incorrectly an average of 8.9 (ranging from 4 to 15). Despite the average of correct answers being higher than the average of the incorrect ones, the results indicate, overall, a modest game performance, in a game where the multimedia contents are designed to support answer giving. This indicates that the game can be improved to be more efficient in promoting learning.
No correlation was found between the number of participants in each group and the game score (0.22) nor with the game score with AR (0.23). Therefore, a higher number of participants do not seem to increase the game performance. However, Lee and Yang [26] point out that collaborative learning assists students’ shared knowledge construction. In addition, in this activity, the option of having students playing in groups has the advantage of supporting ideas discussion to negotiate and justify the selection of an option to answer the challenges, which is aligned with constructivist approaches [27].
Considering the relation between the number of participants and the game duration, no correlation was found (0.07). Hence, the number of members in a group did not affect the time of game play, indicating that other factors, such as the walking time, are influencing this variable.
As expected, the number of correct and incorrect answers have a perfect positive and negative correlation, respectively, with the game scores (see Table 2), as the game was developed to have the score directly dependent on the number of correct answers. As the game score incorporates the game score with AR, there is a high correlation between these two variables (0.77).

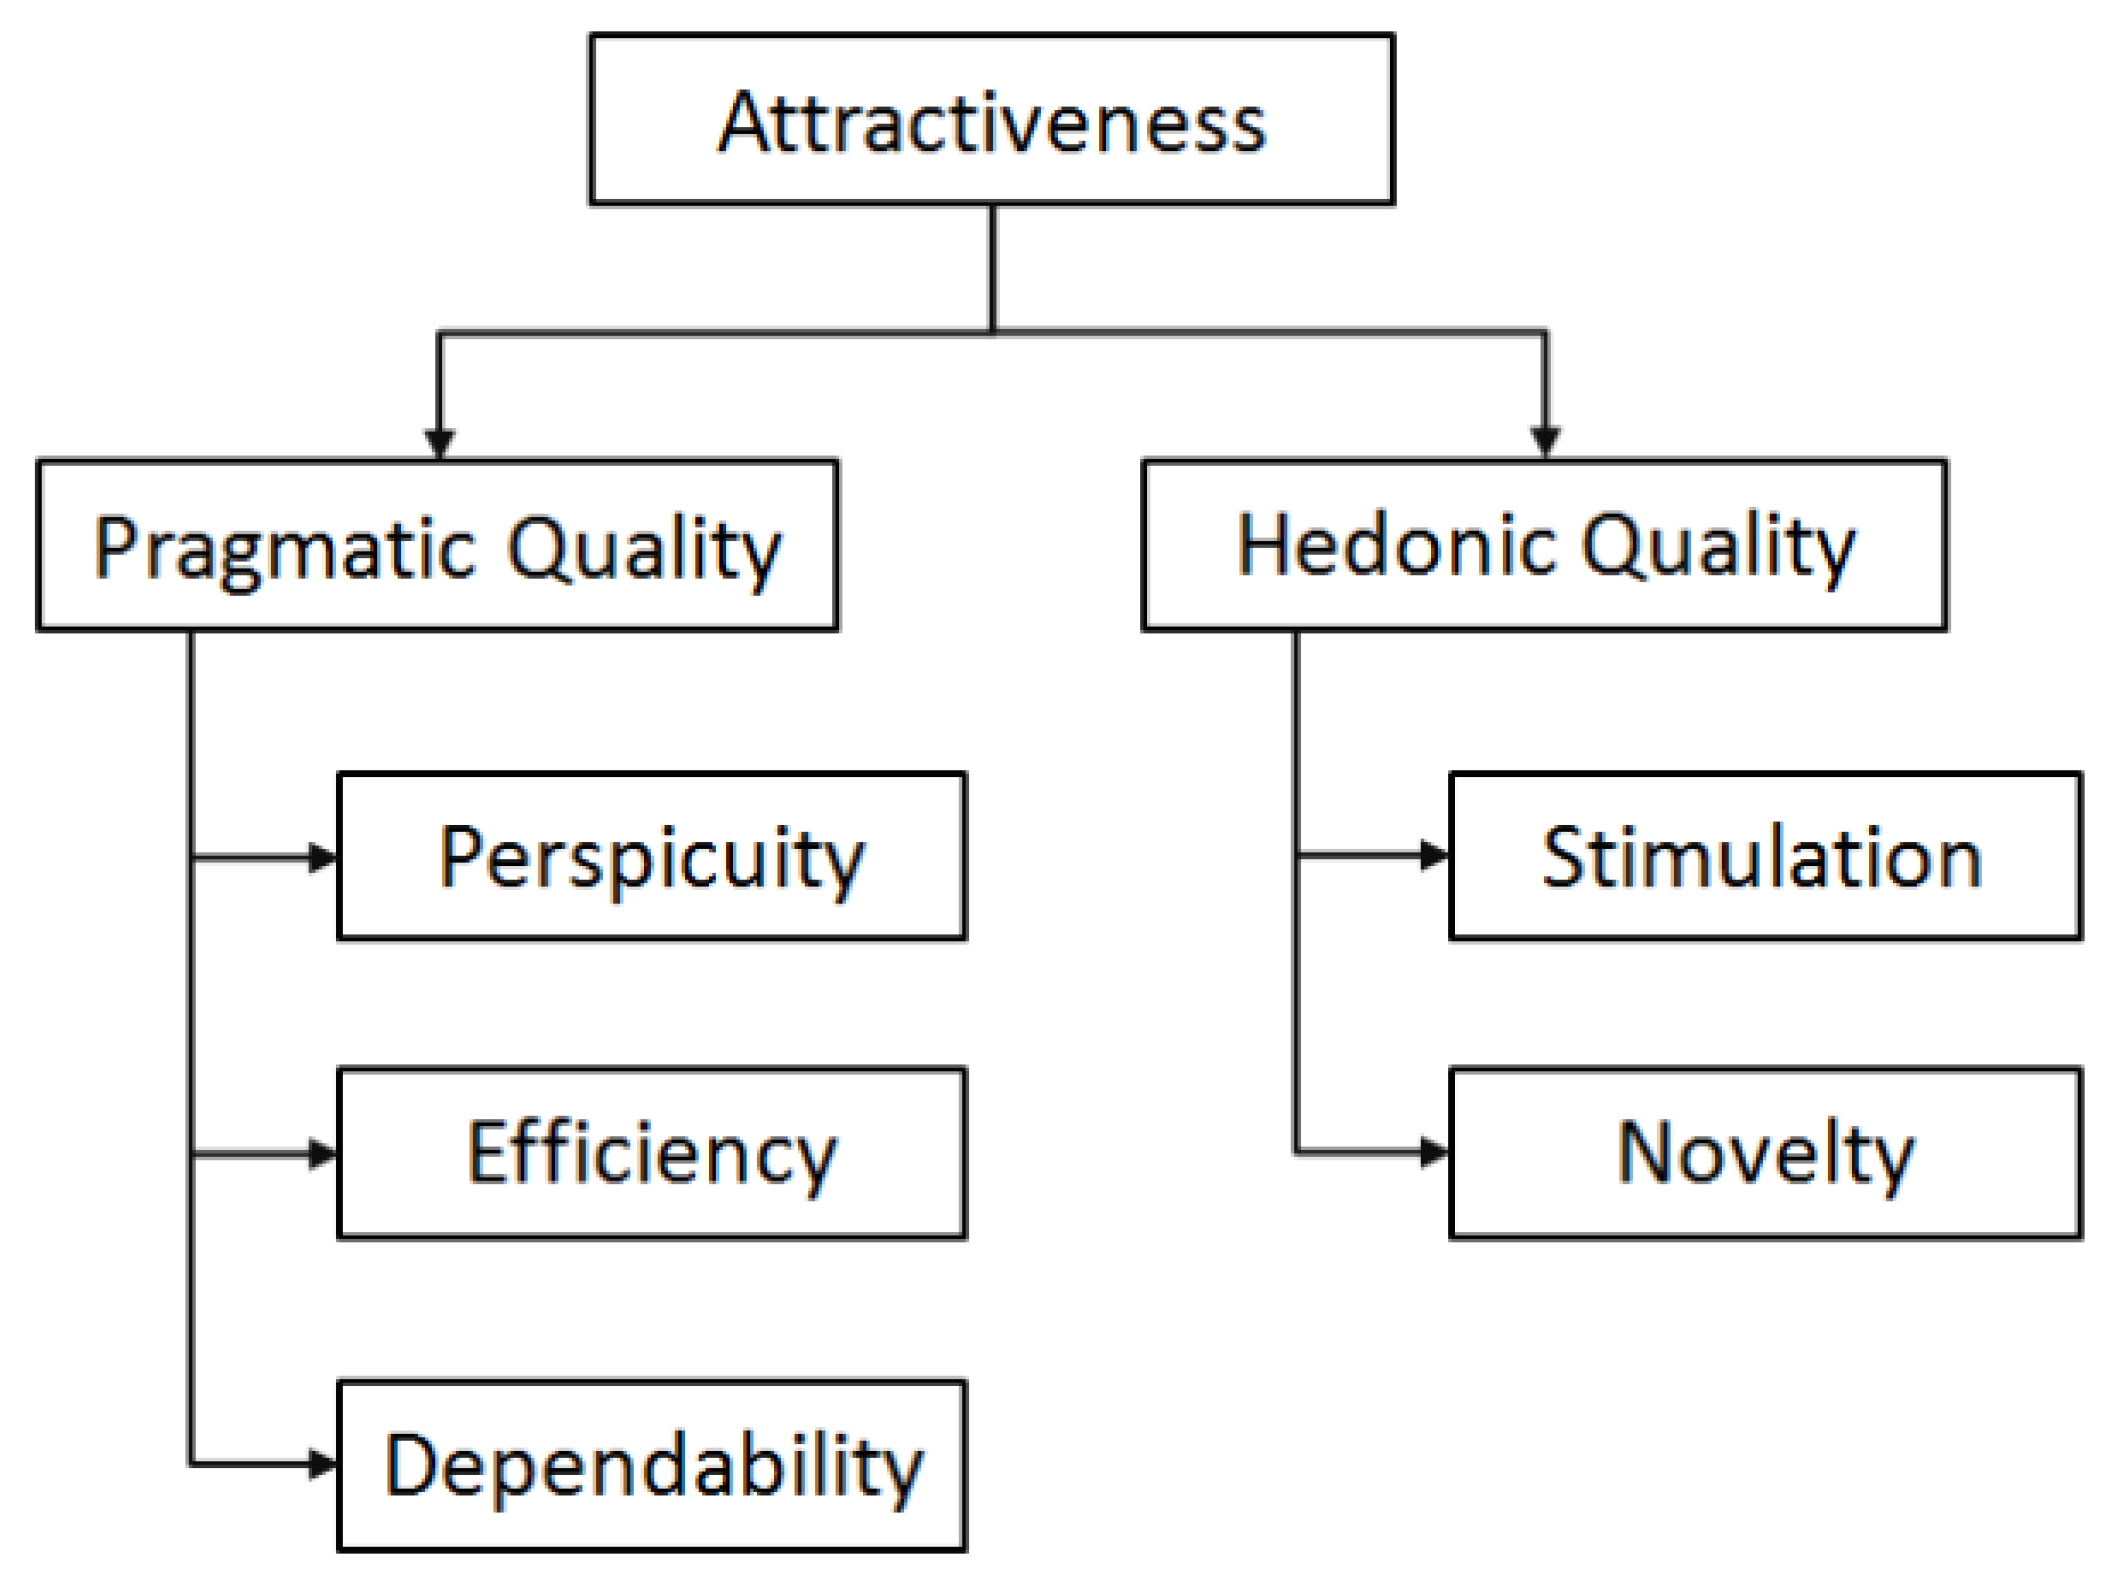
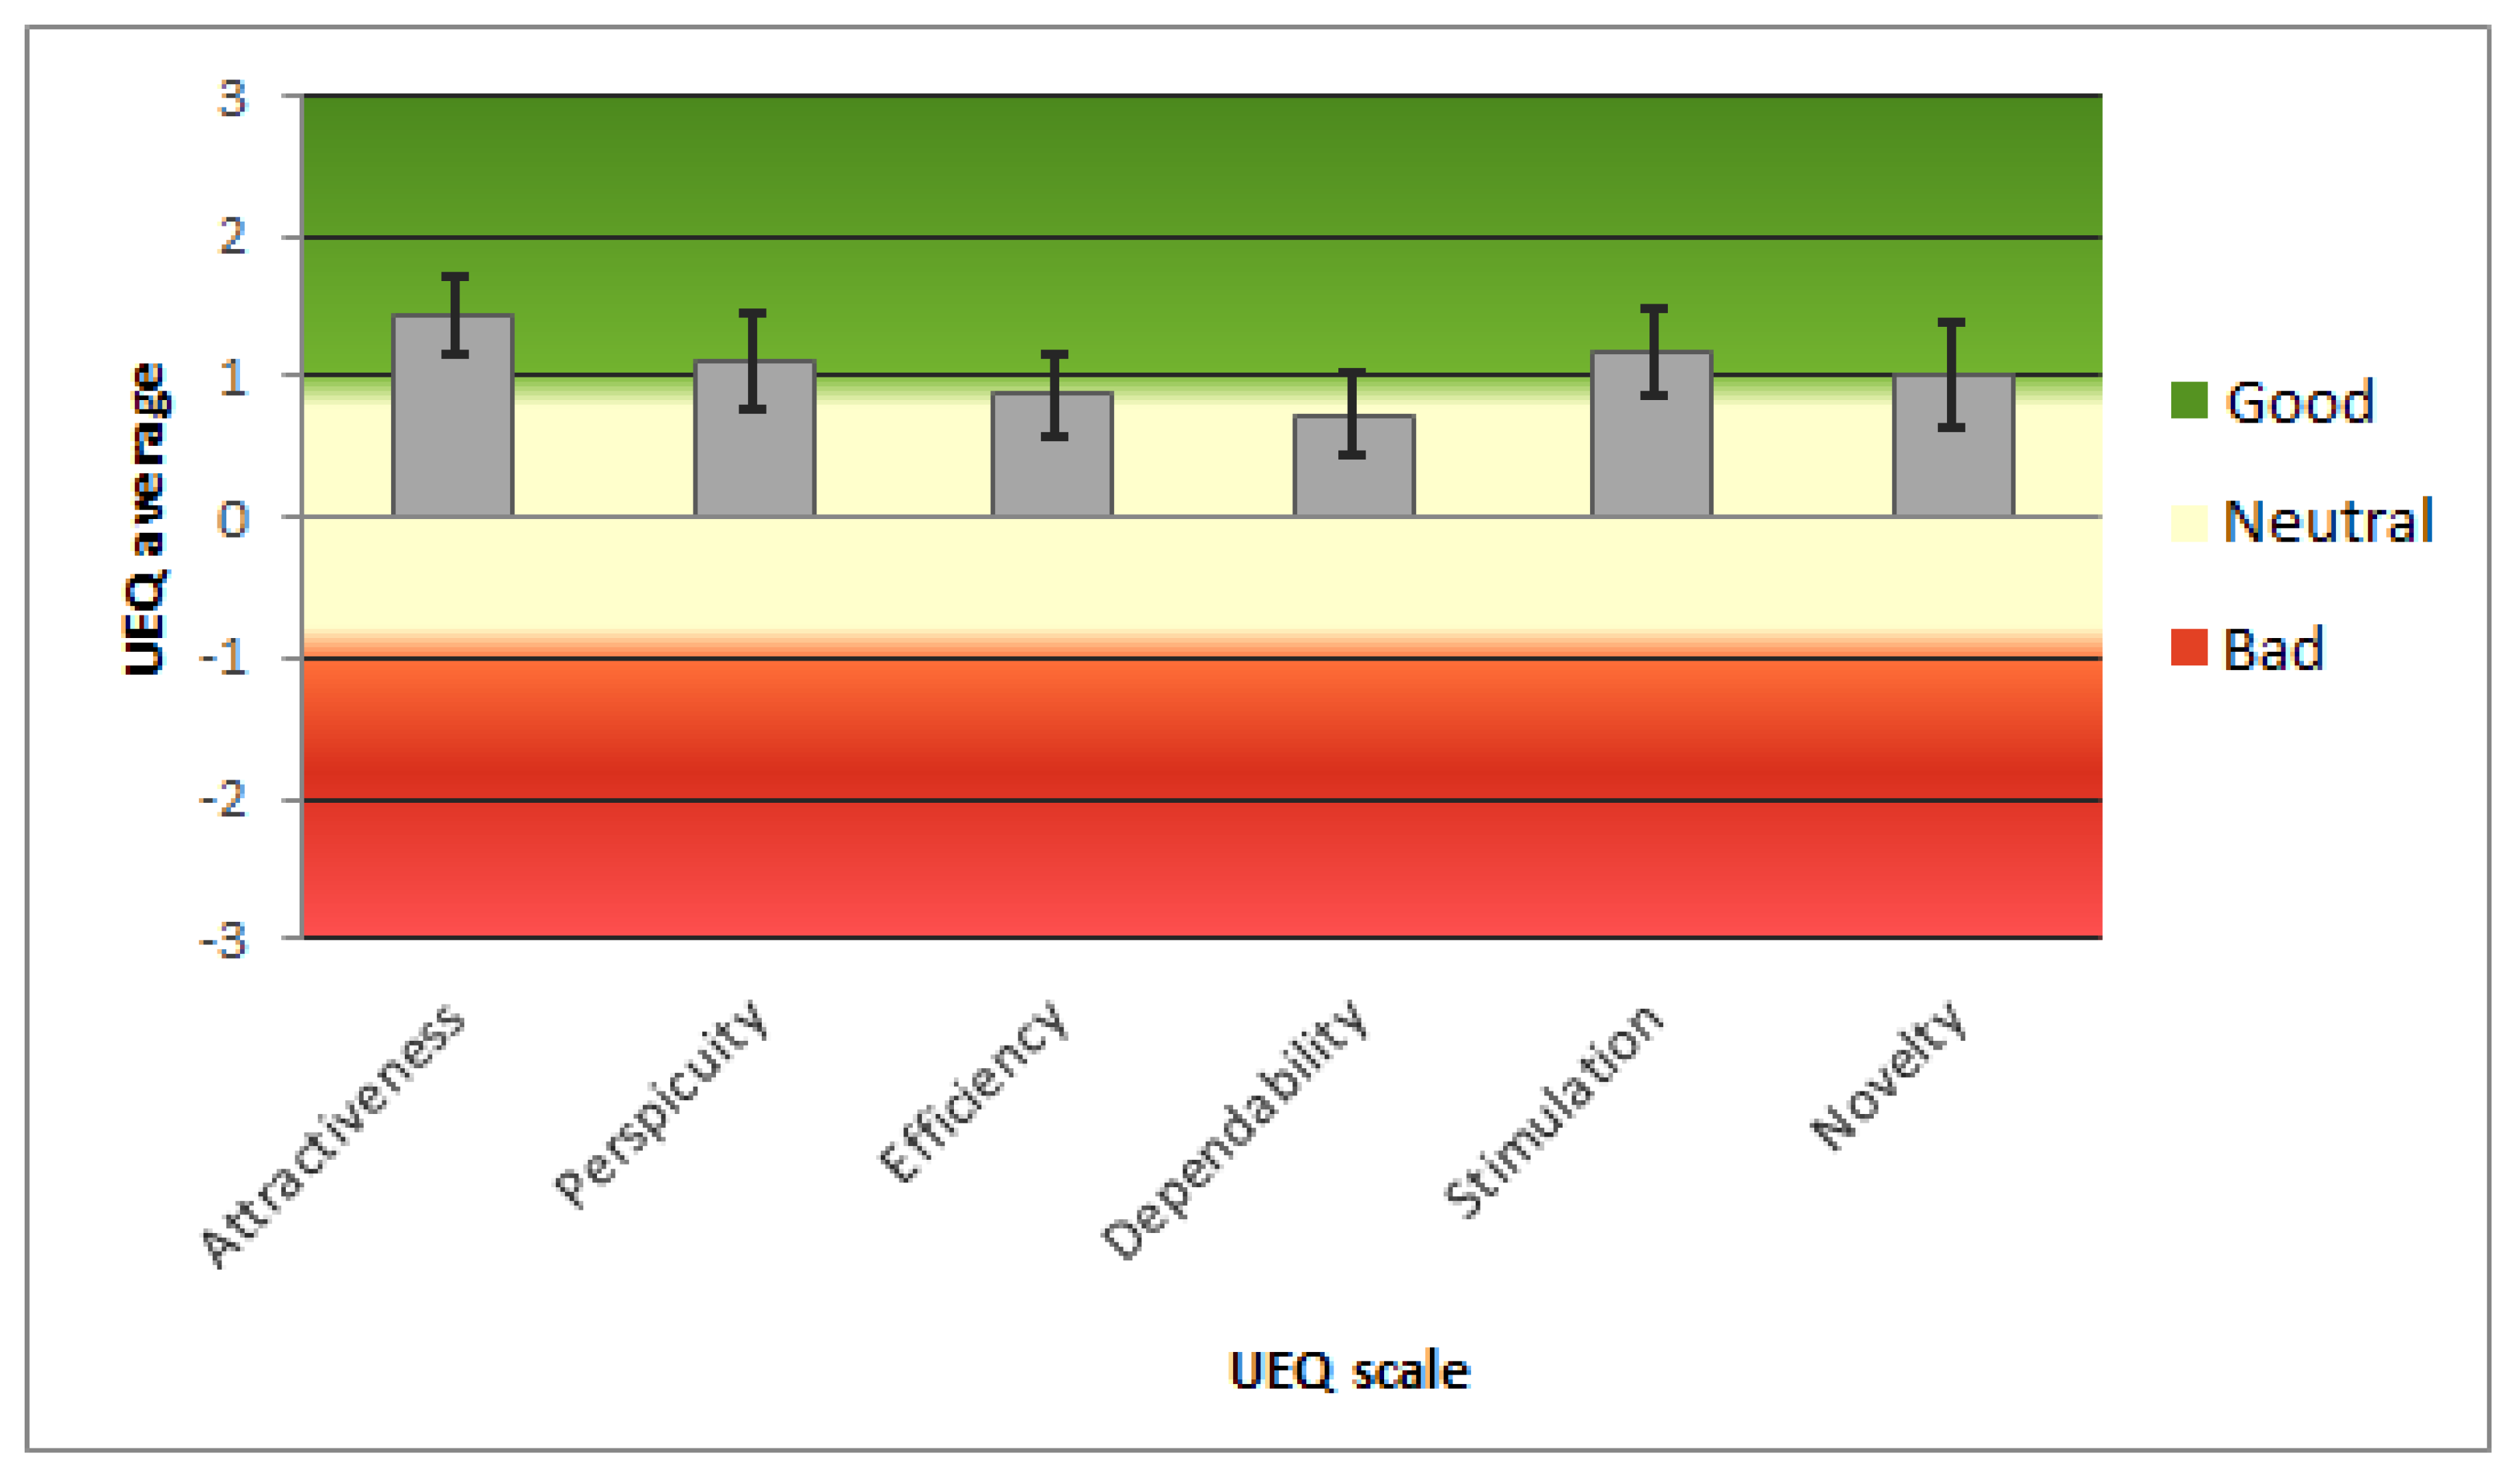
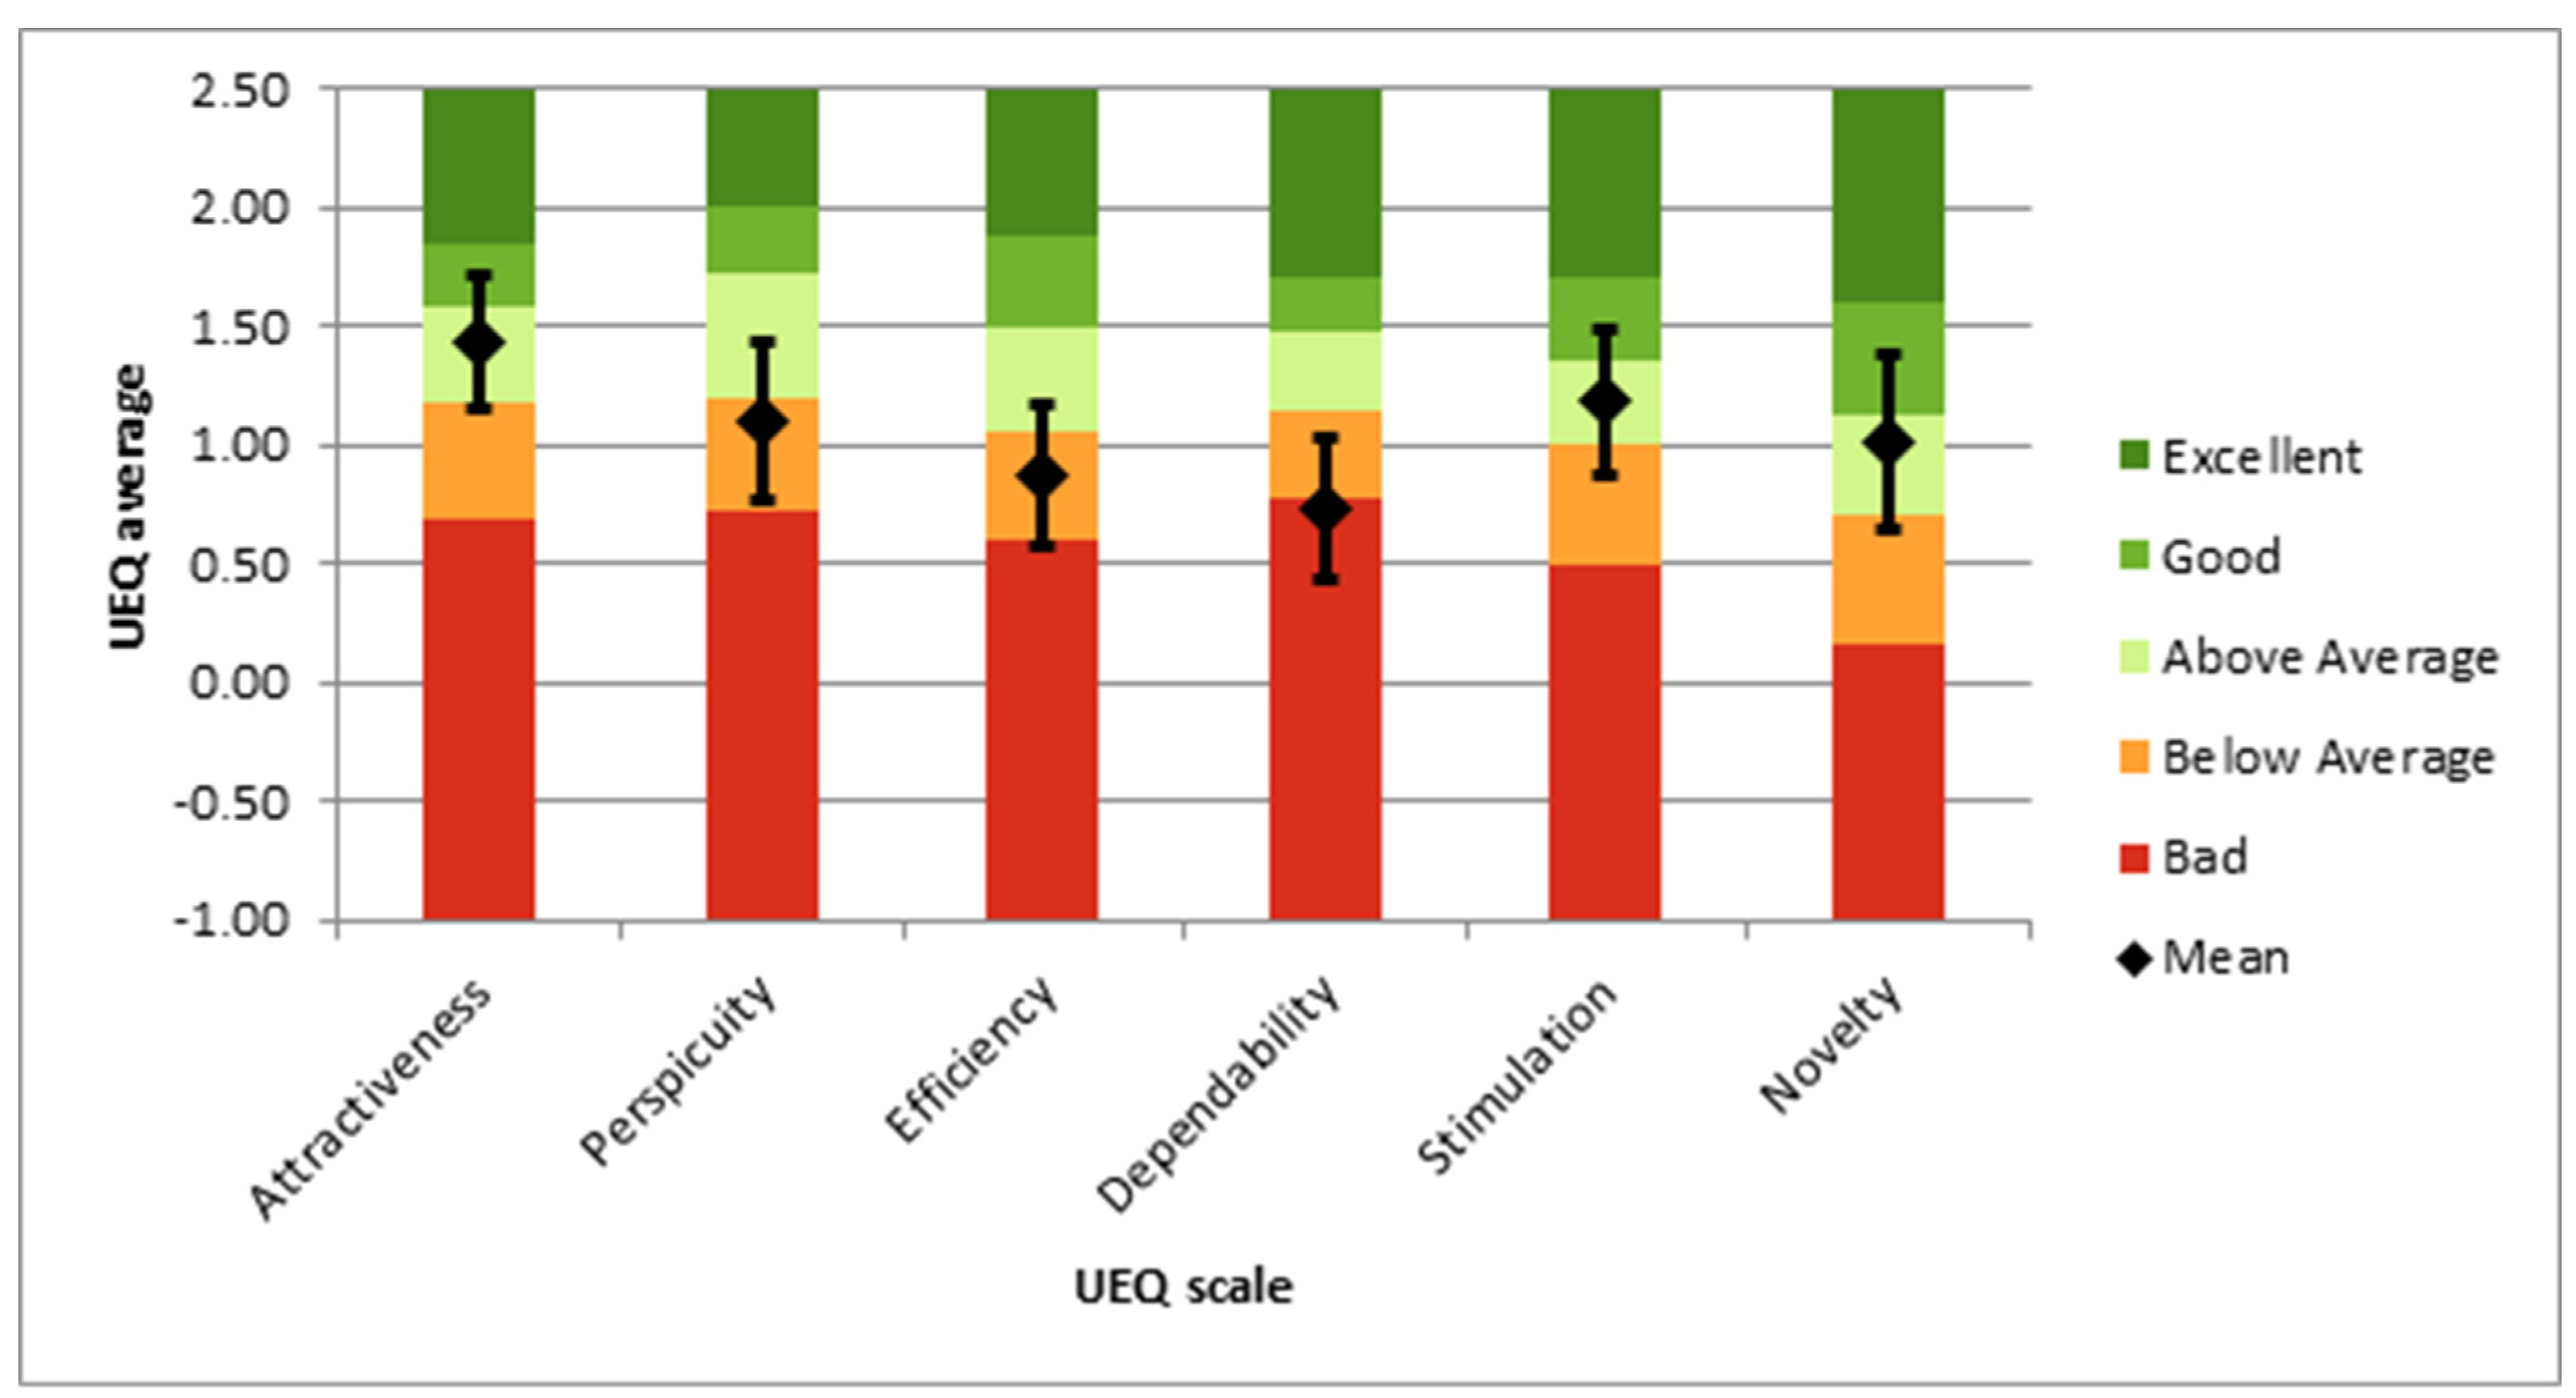
3.2. User Experience with a Mobile Augmented Reality App

The 73 doctoral students, distributed in 14 groups, used the EduCITY app and played the game “Aveiro walking”, for an average of 75 min (rounded value).
Figure 2 presents the overall result of the UEQ (section A of the questionnaire). As recommended by the UEQ authors, the answer options were transformed from a range of 1 to 7 to a range of −3 to +3, where −3 is a negative answer, 0 is neutral, and +3 is positive. The authors of the tool consider that “values above +1 indicate a positive impression of the users” and “a value near +2 represents a very positive near optimal impression of participants”, due to the avoidance of the extremes effect [15]. Hence, the EduCITY app prototype created a positive impression regarding Attractiveness (1.43), Perspicuity (1.11), Stimulation (1.18), and Novelty (1.02), and a neutral–positive impression on the Efficiency (0.87) and Dependability (0.73) scales. Other studies on user experience of mobile apps have found positive user experience values [18,19,20,21].
From the above results, Attractiveness is clearly a strong dimension of the app prototype, followed by the Hedonic quality (Stimulation, Novelty). The Pragmatic quality (Perspicuity, Efficiency, and Dependability) is the one collecting more modest impressions. From here, we can assume that the Pragmatic quality is the area where the prototype needs further refinement based on the PhD students’ perspective.
In a benchmark analysis, Figure 3 presents the relative quality of the EduCITY app prototype when compared to other software products of the UEQ data set. Attractiveness, Stimulation, and Novelty are classified as “above average”; Perspicuity and Efficiency are classified as “below average”; and Dependability is classified as “Bad”, when compared to the software regarding which evaluation data are included in the benchmark data set.
Analyzing the internal consistency of the data, Table 3 reveals the Cronbach’s Alpha [27] data for the scales of the UEQ. An alpha value above 0.7 is usually considered sufficiently consistent. In this study, Attractiveness (0.89), Perspicuity (0.73), Stimulation (0.86), and Novelty (0.86) reveal a high consistency, so it is considered that all items in each scale measure the same aspect and were well interpreted by the respondents. Hence, the scales that reveal a positive impression also reveal a high consistency, and thus the confidence in these results is high. However, Efficiency (0.61) and Dependability (0.55) are below the 0.7 benchmark. Thus, the scales that reveal a neutral–positive impression are the ones that need to be interpreted with caution.
Some hypotheses can be presented regarding the lower internal consistency values for Efficiency and Dependability. Firstly, it is possible that some items of these two scales may have been misinterpreted or interpreted in an unexpected way by several participants, e.g., regarding the security of the app, as pointed out before in the literature [15]. In this case, it is worthwhile noting that respondents were international students, most whose native language was not English (language used in the UEQ), and they may not have taken the time needed to correctly interpret all the UEQ items. The authors of this tool recommend giving the questionnaire to respondents in their mother tongue, for higher rigor in the results [15]. However, in this context, that option was not feasible, as the respondents were from several different countries and were expected to be fluent in English.
Secondly, in this specific study, users used a prototype of a mobile app on their own mobile devices, which yields a considerable variation in device features, such as memory availability and processing capacities, a scenario closer to the naturalistic use of the app. Consequently, the experience of using the app (e.g., fast/slow, unpredictable/predictable) may differ from one mobile device to another, resulting in different impressions in users from different groups.
Regarding improvement suggestions from the game players, Table 4 summarizes the results obtained, aligned with the UEQ scales. Most users (22) did not present any improvement suggestions. The remaining respondents made a total of 41 suggestions, regarding:
(a)
Attractiveness (6 suggestions), where the main proposal was to improve the multimedia resources quality (5);
(b)
Efficiency (7), which was divided into improving energy use efficiency (4) and revising some interaction features (3);
(c)
Perspicuity (6), regarding the improvement in some texts’ clarity;
(d)
Dependability (14), the majority of these are regarding pedagogical issues (12);
(e)
Others (8), regarding access issues (IoS version and availability on app stores).
Table 4. Game users’ suggestions for prototype improvements.
UEQ ScaleSub-CategoryFrequencyCitation Example
AttractivenessImprove multimedia resources quality5“videos are too long” (Q4)
Revise the app scheme of colors1“The pink is not the best color.” (Q34)
EfficiencyImprove energy use efficiency4“it needs a lot of battery” (Q53)
Revise interaction features3“language switching option could be clearer” (Q42)
PerspicuityReformulate texts/information for improved clarity6“map instructions could be clearer” (Q4)
DependabilityImprove pedagogical quality 12“Don’t show the pictures on the app (or only parts of it), so that there is more incentive to find the place in real!” (Q17)
Address app bugs1“AR isn´t well supported, and the app crashed at some point.” (Q16)
Include security endorsement warnings1“should have alerts about traffic. People get too involved and don´t pay attention.” (Q31)
Stimulation-0-
Novelty-0-
OthersMake iOS version6“Please make this application/games available in iOS, not only android user could enjoy the intuitiveness” (Q27)
Make it available in official app stores2“place it on play store” (Q32)
No suggestions-22“thank you for developing this for us!” (Q6)
It is worthwhile to point out that no suggestion could be classified as being related to the Stimulation and Novelty scales.
Considering these results, the PhD students recommended a higher number of improvements in features regarding “Dependability”, which is one of the scales that revealed a neutral–positive impression among these respondents and is classified as “Bad” in the benchmark analysis. This is surely one area of further improvement for the Smart Learning City Environment app.
Another area of further refinement is “Efficiency”, which is one of the scales that collected a neutral–positive impression as well, and it is classified as “below average” in the benchmark analysis. Although both these scales (“Dependability” and “Efficiency”) must be interpreted with caution, the open-ended question in the questionnaire reinforces these two areas as the ones to be prioritized in the improvement procedures.
Finally, although obtaining high scores, “Attractiveness” and “Perspicuity” (respectively, “above average” and “below average” in the benchmark analysis) can also be improved, as the respondents made some suggestions related to these two areas. Hence, although not a priority, these can be refined as well.
According to the data collected, “Stimulation” and “Novelty”, which were classified as “above average” in the benchmark analysis and were not the subject of any improvement suggestions, are not a priority for further refinement.

4. Conclusions

This study is focused on analyzing the perceptions of doctoral students in Education regarding the user experience of a prototype of a mobile augmented reality app, which integrates a game-based approach and pervasive and emergent technologies [28].
According to the participating PhD students, the user experience of the EduCITY app is positive overall. The strongest quality attributes are related to “Attractiveness” (general impression towards the acceptation/rejection of the app), “Stimulation” (interest and excitement created by the app), and “Novelty” (the app is considered innovative and creative), as these areas created the most positive impression. Other quality attributes require further refinement, particularly the ones classified as “bad” or “below average” in the benchmark analysis. For example, “Dependability” (interaction with the app is secure and predictable) and “Efficiency” (using the app is easy and fast) also collected neutral–positive impressions and several improvement suggestions from the respondents. Furthermore, the open-ended question regarding improvement suggestions, added to the UEQ in this study, allowed for reinforcing these two quality attributes as the ones to give priority to during the next refinement cycle of the prototype. Although not being a priority in the refinement phase, “Attractiveness” and “Perspicuity” are quality attributes that may be addressed. The “Hedonic quality” aspects of the prototype were the ones that reached the best results, and the “Pragmatic quality” aspects were the ones that need more attention in the next improvement cycle. These results are based on a validated questionnaire (UEQ) and the analysis is performed as recommended by the questionnaire’s authors.
It is important to point out that the app is under development, so the use of evaluation tools, such as the UEQ complemented with an open-ended question regarding improvement suggestions, is relevant during the development phase.
The analysis of the PhD students’ improvement suggestions, aligned with the UEQ scales, reinforces the results obtained with the UEQ. This is particularly relevant when a moderate consistency is found in some scales, as was the case in this study. Moreover, it allows for identifying areas of improvement in situations where a scale obtained high results, as was the case of the “Attractiveness” scale in this study. Otherwise, it could be interpreted that these quality attributes did not require refinement.
Finally, it is relevant to contrast the purpose of the app with the results of the user experience evaluation and the characteristics of the users. As the main purpose of the app is to support AR games for outdoor sustainability education, the overall positive perspective of the PhD students makes the evaluation results robust due to the unique profile of the evaluators. They are international students at the highest academic level, specializing in education, and thus bring to the evaluation a deep understanding of how users engage with AR games in educational settings [10]. In addition, they reported no previous experience with augmented reality in educational contexts nor with the specific supporting technology used, the EduCITY app. Moreover, this software supported users that were unfamiliar with the city to successfully navigate it throughout the game. As the user experience is positive, this study points to a smart learning city environment that is already capable of supporting innovative sustainable development education even at a prototyping stage. Additionally, the PhD students were exposed to a learning technology that points to new research avenues, whose results may, ultimately, empower teachers and students to incorporate new media and technologies in curricular learning.
Considering the limitations of this study, it is highlighted the data collection involved a single activity, in a real non-formal education context where participants used their own devices, instead of the usual laboratory test, with controlled conditions, as in previous studies [21]. This more naturalistic option probably originated different user experiences, with implications on the users’ impressions. Furthermore, the questionnaire was filled in immediately after the activity, in an outdoor environment (the last point of interest of the game), with several distractors, such as automobiles and people passing by. This factor, allied to the native language of the respondents not being English, may have caused some misinterpretations of the questionnaire items.
Further research needs to collect new data, with the same profile of users, in each new version of the EduCITY app, in order to compare the results of the technology in different stages of development and support continuous quality assessment, as recommended by [15]. In alignment with design-based research [29], it is also important to conduct several refinement cycles, until a software version with as many positive results in the quality attributes as possible is reached. This may foster technology adoption in the educational field [30]. Moreover, it is relevant to analyze user experience data from other target audiences, particularly teachers and students from basic and secondary education, in order to better understand the user experience in emergent mobile technologies. It can also be useful to compare the results obtained in this study with apps with similar features or with similar purposes. The findings presented in this study are also relevant to mobile app developers, as they can complement existing user experience evaluation tools with questions that allow for understanding areas requiring deep improvement, which is in line with the previous literature [18,19,21].
The development of mobile technology that provides good user experiences can facilitate the learning process; in this study, it was in terms of sustainability. Thus, students can enjoy user-friendly mobile technology, equipping them to integrate technology into their learning, encompassing content and technological knowledge [20]. This study supports previous studies that show that sustainable development learning can be fostered through mobile user-friendly technologies [31,32]. As more and more students acknowledge the relevance of this type of approach, it is pertinent to invest in research on mobile augmented reality games for education, thus contributing to Goal 4 of the 2030 Agenda for Sustainable Development.

Author Contributions

Conceptualization, M.M.M. and L.P.; methodology, M.M.M. and L.P.; software, not applicable; validation, M.M.M. and L.P.; formal analysis, M.M.M.; investigation, M.M.M. and L.P.; resources, M.M.M. and L.P.; data curation, M.M.M.; writing—original draft preparation, M.M.M. and L.P.; writing—review and editing, M.M.M. and L.P.; visualization, M.M.M.; supervision, M.M.M. and L.P.; project administration, M.M.M. and L.P.; funding acquisition, M.M.M. and L.P. All authors have read and agreed to the published version of the manuscript.

Funding

The EduCITY project is funded by National Funds through the FCT—Fundação para a Ciência e a Tecnologia, I.P., under the project PTDC/CED-EDG/0197/2021. The work of the first author is funded by national funds through FCT—Fundação para a Ciência e a Tecnologia, I.P., under the Scientific Employment Stimulus—Individual Call [2022.02153.CEECIND].

Institutional Review Board Statement

This study was conducted in accordance with the Declaration of Helsinki. No approval by the Institutional Ethics Committee as all data were collected anonymously from capable consenting adults.

Informed Consent Statement

Informed consent was obtained from all subjects involved in the study.

Data Availability Statement

Data are available upon request to the authors.

Acknowledgments

The authors acknowledge the contribution of the research team of the project EduCITY in the development of the EduCITY app, web-platform, game explored by the participants and support in the data collection event. The authors also appreciate the participants will to contribute to this study.

Conflicts of Interest

The authors declare no conflict of interest. The funders had no role in the design of the study; in the collection, analyses, or interpretation of data; in the writing of the manuscript; or in the decision to publish the results.

References

  1. Pombo, L.; Marques, M.M. An App That Changes Mentalities about Mobile Learning—The EduPARK Augmented Reality Activity. Computers 2019, 8, 37. [Google Scholar] [CrossRef]
  2. Laine, T. Mobile Educational Augmented Reality Games: A Systematic Literature Review and Two Case Studies. Computers 2018, 7, 19. [Google Scholar] [CrossRef]
  3. Pombo, L.; Marques, M.M. The Potential Educational Value of Mobile Augmented Reality Games: The Case of EduPARK App. Educ. Sci. 2020, 10, 287. [Google Scholar] [CrossRef]
  4. Weerasinghe, M.; Quigley, A.; Ducasse, J.; Pucihar, K.Č.; Kljun, M. Educational Augmented Reality Games. In Augmented Reality Games II; Springer International Publishing: Cham, Switzerland, 2019; pp. 3–32. [Google Scholar]
  5. Floricel, S. Understanding the Nature and Effects of Digital Games in Promoting Sustainability. Glob. Econ. Obs. 2020, 8, 125–134. [Google Scholar]
  6. Pombo, L.; Marques, M.M. Learning with the Augmented Reality EduPARK Game-Like App: Its Usability and Educational Value for Primary Education. In Proceedings of the Computing Conference, London, UK, 16–17 July 2019; Arai, K., Bhatia, R., Kapoor, S., Eds.; Springer: Cham, Switzerland, 2019; Volume 997, pp. 113–125, ISBN 9783030228705. [Google Scholar]
  7. Pombo, L.; Marques, M.M.; Oliveira, S. Lessons Learned—EduPARK; UA Editora: Aveiro, Portugal, 2019; ISBN 978-972-789-613-4. [Google Scholar]
  8. Mascheroni, G.; Cuman, A. Net Children Go Mobile: Final Report. Deliverables D6.4 & D5.2; SAGE Publications: Milano, Italy, 2014. [Google Scholar]
  9. Marques, M.M.; Pombo, L. Game-Based Mobile Learning with Augmented Reality: Are Teachers Ready to Adopt It? In Smart Innovation, Systems and Technologies; Rehm, M., Saldien, J., Manca, S., Eds.; Springer: Singapore, 2020; Volume 158, pp. 207–218. ISBN 9789811396519. [Google Scholar]
  10. Amanatidis, N. Augmented Reality in Education and Educational Games-Implementation and Evaluation: A Focused Literature Review. Comput. Child. 2022, 1, em002. [Google Scholar] [CrossRef]
  11. Liu, S.; Gao, S.; Ji, X. Beyond Borders: Exploring the Impact of Augmented Reality on Intercultural Competence and L2 Learning Motivation in EFL Learners. Front. Psychol. 2023, 14, 1234905. [Google Scholar] [CrossRef] [PubMed]
  12. Lampropoulos, G.; Keramopoulos, E.; Diamantaras, K.; Evangelidis, G. Integrating Augmented Reality, Gamification, and Serious Games in Computer Science Education. Educ. Sci. 2023, 13, 618. [Google Scholar] [CrossRef]
  13. Marques, M.M.; Pombo, L. The Impact of Teacher Training Using Mobile Augmented Reality Games on Their Professional Development. Educ. Sci. 2021, 11, 404. [Google Scholar] [CrossRef]
  14. Laugwitz, B.; Held, T.; Schrepp, M. Construction and Evaluation of a User Experience Questionnaire. In HCI and Usability for Education and Work, Proceedings of the 4th Symposium of the Workgroup Human-Computer Interaction and Usability Engineering of the Austrian Computer Society, Graz, Austria, 20–21 November 2008; Holzinger, A., Ed.; Springer: Berlin/Heidelberg, Germany, 2008; pp. 63–76. [Google Scholar]
  15. Rauschenberger, M.; Schrepp, M.; Perez-Cota, M.; Olschner, S.; Thomaschewski, J. Efficient Measurement of the User Experience of Interactive Products. How to Use the User Experience Questionnaire (UEQ). Example: Spanish Language Version. Int. J. Interact. Multimed. Artif. Intell. 2013, 2, 39. [Google Scholar] [CrossRef]
  16. Schankin, A.; Budde, M.; Riedel, T.; Beigl, M. Psychometric Properties of the User Experience Questionnaire (UEQ). In Proceedings of the Conference on Human Factors in Computing Systems, New Orleans, LA, USA, 30 April–5 May 2022; Barbosa, S., Lampe, C., Appert, C., Shamma, D.A., Drucker, S., Williamson, J., Yatani, K., Eds.; Association for Computing Machinery: New York, NY, USA, 2022; pp. 1–11. [Google Scholar] [CrossRef]
  17. Hassenzahl, M.; Schöbel, M.; Trautmann, T. How Motivational Orientation Influences the Evaluation and Choice of Hedonic and Pragmatic Interactive Products: The Role of Regulatory Focus. Interact. Comput. 2008, 20, 473–479. [Google Scholar] [CrossRef]
  18. Kushendriawan, M.A.; Santoso, H.B.; Putra, P.O.H. Martin Schrepp Evaluating User Experience of a Mobile Health Application ‘Halodoc’ Using User Experience Questionnaire and Usability Testing. J. Sist. Inf. 2021, 17, 58–71. [Google Scholar] [CrossRef]
  19. Sabukunze, I.D.; Arakaza, A. User Experience Analysis on Mobile Application Design Using User Experience Questionnaire. Indones. J. Inf. Syst. 2021, 4, 15–26. [Google Scholar] [CrossRef]
  20. Salehudin, M.; Zurqoni, Z.; Robingatin, R.; Syobah, S.N.; Janah, F.; Rorimpandey, W.H.F.; Subakti, H. Mobile Learning With Discord Application as Creative Teaching. TEM J. 2023, 12, 1697–1705. [Google Scholar] [CrossRef]
  21. Davidavičienė, V.; Raudeliūnienė, J.; Viršilaitė, R. Evaluation of User Experience in Augmented Reality Mobile Applications. J. Bus. Econ. Manag. 2021, 22, 467–481. [Google Scholar] [CrossRef]
  22. Yin, R.K. Case Study Research and Applications: Design and Methods, 6th ed.; SAGE Publications, Inc.: Los Angeles, CA, USA, 2017. [Google Scholar]
  23. Harrison, H.; Birks, M.; Franklin, R.; Mills, J. Case Study Research: Foundations and Methodological Orientations. Forum Qual. Sozialforsch. 2017, 18, 19. [Google Scholar] [CrossRef]
  24. Forman, J.; Damschroder, L. Qualitative Content Analysis. In Empirical Methods for Bioethics: A Primer; Jacoby, L., Siminoff, L.A., Eds.; Elsevier: Oxford, UK, 2008; Volume 11, pp. 39–62. ISBN 0762312661. [Google Scholar]
  25. Guay, F.; Vallerand, R.J.; Blanchard, C. On the Assessment of Situational Intrinsic and Extrinsic Motivation: The Situational Motivation Scale (SIMS). Motiv. Emot. 2000, 24, 175–213. [Google Scholar] [CrossRef]
  26. Lee, W.W.S.; Yang, M. Effective Collaborative Learning from Chinese Students’ Perspective: A Qualitative Study in a Teacher-Training Course. Teach. High. Educ. 2020, 28, 221–237. [Google Scholar] [CrossRef]
  27. Cronbach, L.J. Coefficient Alpha and the Internal Structure of Tests. Psychometrika 1951, 16, 297–334. [Google Scholar] [CrossRef]
  28. De Sa, M.; Churchill, E.F. Mobile Augmented Reality: Exploring Design and Prototyping Techniques. In Proceedings of the MobileHCI’12: 14th International Conference on Human-Computer Interaction with Mobile Devices and Services, San Francisco, CA, USA, 21–24 September 2012; pp. 221–230. [Google Scholar] [CrossRef]
  29. Christensen, K.; West, R.E. The Development of Design-Based Research. In Foundations of Learning and Instructional Design Technology: The Past, Present, and Future of Learning and Instructional Design Technology; West, R.E., Ed.; EdTech Books: London, UK, 2018. [Google Scholar]
  30. Marangunić, N.; Granić, A. Technology Acceptance Model: A Literature Review from 1986 to 2013. Univers. Access Inf. Soc. 2015, 14, 81–95. [Google Scholar] [CrossRef]
  31. Sebastián-López, M.; de Miguel González, R. Mobile Learning for Sustainable Development and Environmental Teacher Education. Sustainability 2020, 12, 9757. [Google Scholar] [CrossRef]
  32. Schaal, S.; Lude, A. Using Mobile Devices in Environmental Education and Education for Sustainable Development-Comparing Theory and Practice in a Nation Wide Survey. Sustainability 2015, 7, 10153–10170. [Google Scholar] [CrossRef]
Figure 1. Assumed scale structure of the UEQ, according to [15].
Education 13 01221 g001
Figure 2. UEQ scales averages and confidence intervals of the EduCITY app prototype.
Education 13 01221 g002
Figure 3. EduCITY app prototype compared to the UEQ benchmark data set.
Education 13 01221 g003
Table 1. Average, minimum, and maximum concerning the number of participants per group, game score (with AR), (in)correct answers, and game duration.
AverageMinimumMaximum
Number of participants5.23.010.0
Game score71.435.0113.0
Score with AR15.75.030.0
Correct answers16.110.023.0
Incorrect answers8.94.015.0
Game duration 174.919.0132.0
1 Expressed in minutes.
Table 2. Correlation matrix.
Number of ParticipantsGame ScoreScore with ARCorrect AnswersIncorrect AnswersGame Duration
Number of participants1.00.220.230.22−0.220.07
Game score0.221.00.771.0−1.0
Score with AR0.230.771.0
Correct answers0.221.0
Incorrect answers−0.22−1.0
Game duration0.07
Table 3. Cronbach’s Alpha for the UEQ scales.
UEQ ScaleAlpha
Attractiveness0.89
Perspicuity0.73
Efficiency0.61 *
Dependability0.55 *
Stimulation0.86
Novelty0.86
* results of scales that need to be interpreted with caution.
Disclaimer/Publisher’s Note: The statements, opinions and data contained in all publications are solely those of the individual author(s) and contributor(s) and not of MDPI and/or the editor(s). MDPI and/or the editor(s) disclaim responsibility for any injury to people or property resulting from any ideas, methods, instructions or products referred to in the content.

