Abstract
Learning Analytics Dashboards (LADs) can help provide insights and inform pedagogical decisions by supporting the analysis of large amounts of educational data, obtained from sources such as Digital Learning Materials (DLMs). Extracting requirements is a crucial step in developing a LAD, as it helps identify the underlying design problem that needs to be addressed. In fact, determining the problem that requires a solution is one of the primary objectives of requirements extraction. Although there have been studies on the development of LADs for K12 education, these studies have not specifically emphasized the use of a Human-Centered Design (HCD) approach to better comprehend the teachers’ requirements and produce more stimulating insights. In this paper we apply prototyping, which is widely acknowledged as a successful way for rapidly implementing cost-effective designs and efficiently gathering stakeholder feedback, to elicit such requirements. We present a three-step HCD approach, involving a design cycle that employs paper and interactive prototypes to guide the systematic and effective design of LADs that truly meet teacher requirements in primary/secondary education, actively engaging them in the design process. We then conducted interviews and usability testing to co-design and develop a LAD that can be used in classroom’s everyday learning activities. Our results show that the visualizations of the interactive prototype were easily interpreted by the participants, verifying our initial goal of co-developing an easy-to-use LAD.
1. Introduction
The growing prevalence of digital technology in education has enabled educational institutions and educational technology (EdTech) companies to gather a wide range of educational data about students through Digital Learning Materials (DLMs). This data may include grades, text, quizzes, timestamps, and even behavioral information regarding how students use the DLMs. In this study, DLM refers to all materials that are created for educational purposes, published digitally, and accessible through a computer or a tablet. Because each student may engage in a variety of activities through the DLM over a long period of time, datasets that document such activities are typically high-dimensional, large, and complex. Learning Analytics (LA) was established to aid in the interpretation of educational data [1]. According to Siemens et al. [2] (p.1), LA is “the measurement, collection, analysis and reporting of data about learners and their contexts, for purposes of understanding and optimizing learning and the environments in which it occurs”. Learning Analytics Dashboards (LADs) can provide visual representations of data, aiding teachers and students, but also school principals and EdTech companies, in gaining a more comprehensive understanding of LA [3]. Schwendimann et al. [4] (p. 8) define LAD as “a single display that aggregates different indicators about learner(s), learning process(es), and/or learning context(s) into one or multiple visualizations”. As a result, a LAD can be used to generate a graphical representation of what a teacher or student can do to improve motivation, self-direction, learning effectiveness, student performance, and teacher engagement [5,6].
While research on the use of LADs in the classroom has grown quickly over the last decade, a recent study suggests that incorporating LADs into primary and secondary education is a more challenging task compared to higher education. This is primarily due to concerns regarding data security, privacy, and ethics of minors, as stated by Aguerrebere et al. [7]. What this suggests is that, with this specific group of students and teachers, it is not enough to use an off-the-shelf LAD solution to cover all their contextual requirements. Therefore, the research question that drives our work is formulated as follows: how can teachers in primary and secondary education be involved in the process of co-designing an easy-to-use LAD to meet their initial requirements?
A Human-Centered Design (HCD) approach [8] is one possible solution which involves teachers throughout the design process, grasps their requirements, and helps co-designing and developing a dashboard accordingly. Prioritizing human needs, the goal of HCD is to facilitate a transition from an ad hoc, data-centric approach to indicator design to a structured, people-centric approach [9]. The HCD methodology allows us to develop new theories, artifacts, and practices that can be generalized to other projects [8]. HCD argues that a more effective and long-lasting strategy involves initially understanding users’ inherent behaviors, as well as any limitations affecting their attention, learning, and performance. This enables the creation of interfaces that are inherently intuitive, easier to grasp, and less prone to performance errors. The potential outcome of adopting this approach is a significant enhancement in the commercial potential of next-generation systems across a diverse array of real-world applications [10]. However, there is a lack of research focusing on the design of LADs using HCD in this specific educational context. To bridge this gap, it is important to comprehend the initial requirements of teachers in terms of data-informed education, data analysis, and visualization. Concentrating on teachers as crucial stakeholders and designers of LAD, our investigation examines the potential for LAD to be crafted in a way that empowers teachers to create impactful pedagogical interventions. Therefore, to achieve this methodological objective and answer the research question, a pilot study was conducted employing a three-step HCD approach. This approach leveraged existing insights from the Design and Human-Computer Interaction (HCI) communities [11], emphasizing the integration of theory and practice, as well as active collaboration between researchers and teachers. This study was carried out within primary schools in Sweden.
The rest of the article is organized as follows. Section 2 describes the related work in this field. The methodology is described in Section 3. Section 4 describes the outcomes of our three-step HCD approach. Section 5 provides a discussion of the study result. Section 6 presents the limitations of the study and Section 7 provides our conclusions and presents possible lines of future work.
2. Related Work
2.1. Learning Analytics Dashboards
As per the 2017 Horizon K-12 report [12] (p. 44), the primary and secondary education settings offer significant opportunities for LA to “predict learner outcomes, prompt interventions or curricular adjustments, and even prescribe new pathways or strategies to enhance student success”.
To further aid teachers in their interpretation of LA, and make data-informed decisions about the students, data can be visualized using LADs [3]. Within higher education, there has been a great deal of research into the development of LADs. According to studies by Chen et al. [13] and Verbert et al. [6,14], the primary aim of developing LADs is to enhance students’ motivation, self-directed learning, learning effectiveness, and performance, as well as to promote teacher engagement. Various studies, such as the one by Govaerts et al. [15], demonstrate the potential benefits of visualization tools such as the Student Activity Meter, which helps teachers and students become aware of the time and resources students use on specific activities. Ez-zaouia and Lavoué [16] presented the EMODA dashboard, which enables teachers to track learners’ emotions and gain insights into how emotions change during online learning sessions. LearnerVis, developed by He et al. [17] is a tool that visualizes the temporal aspects of the learning process and helps users analyze students’ learning schedules across multiple courses. Mohseni et al. [5,18] proposed the SBGTool and SBGTool v2.0 to assist teachers in identifying student groups with similar learning outcomes and activities, exploring the relationship between student engagement and achievement, and maximizing the potential for collaborative learning by analyzing students’ responses. Additionally, Mohseni et al. [19] developed a LAD that allows teachers to interact with multiple visualizations of student data to investigate their learning progress and activities. Effective use of LADs such as these can aid teachers in preparing formative feedback, predicting learning paths, and improving student performance. However, it is crucial for instructors to have data literacy skills to utilize these LADs effectively [20]. As already mentioned, the focus of research and development has been mainly within higher education, nonetheless, the contribution of LAD in education is growing. As previously stated in the introduction, Aguerrebere et al. [7] discovered that concerns over ethics, privacy, and data security of children make incorporating LADs into primary and secondary education more challenging than in higher education, resulting in the modest number of LAD development in this segment of education.
2.2. Human-Centered Design
Human centeredness can manifest in various aspects, ranging from the user interface, effects on work routines, changes in user empowerment, and the incorporation of values into data models [21]. In each instance, human centeredness is a quality found in systems meticulously crafted by first identifying key stakeholders, their interconnections, and the environments in which these systems will operate. Subsequently, creative approaches or methodologies are employed to gain insights into the needs, wants, and experiences of these stakeholders [22]. The core principle of embracing a human-centered approach is that the meanings, interaction possibilities, functions, and attributes associated with a system should be shaped by the individuals for whom the system is intended, rather than being dictated by designers or researchers. Consequently, the design of Learning Analytics (LA) should consider the diverse individuals who will engage with them (who), the specific actions these individuals will perform using LA (what), the various contexts in which these interactions will occur (when), the methods through which analytics will integrate with interaction and communication (how), and the significance that these analytics, interactions, and communication will hold for stakeholders (why) [22].
There is in general insufficient research that employs a HCD approach to design LADs that effectively capture primary- and secondary-level teachers’ requirements and develop a dashboard accordingly. Therefore, the focus of this study is to design a LAD more specifically for this user, utilizing a HCD approach to comprehensively understand their needs and involve them throughout the design process. There is a wealth of literature explaining various design study research methodologies in the domains of social science [23,24,25] and HCI [26,27,28,29,30,31]. For instance, Holstein et al. [32] were pioneers in using various generative tools and co-design methods to discover what data teachers require and to design prototypes of awareness and orchestration tools for use with Intelligent Tutoring Systems (ITSs) in classrooms. Sedlmair et al. [33] suggested a method for carrying out design studies, the nine-stage framework, in which visualization researchers investigate a particular real-world problem faced by subject matter experts, design a visualization system to assist in resolving this problem, validate the design, and then consider the lessons learned to improve visualization design guidelines.
Furthermore, numerous studies have explored HCD approaches with LA. For instance, in the research conducted by Buckingham Shum et al. [8], they introduced principles of HCD sourced from relevant domains, which can be integrated and tailored to promote the evolution of human-centered LA. Additionally, Dimitriadis et al. [34] outlined three HCD principles for LA solutions. These principles involve empowering teachers and other stakeholders as active participants, integrating the learning design cycle into the LA design process, and harnessing educational theories to guide the design and implementation of LA solutions. In this article, we propose a HCD workflow which is characterized by three steps [9]: identification of requirements; idea generation and testing; and prototyping and testing. To propose a solution design for an easy-to-use LAD, we incorporated paper and interactive prototypes into our three-step HCD approach.
Paper prototypes, also known as low-fidelity prototypes, which can be made from drawings on paper or other low-fidelity materials, enable designers to quickly and inexpensively explore and fine-tune design concepts by collecting insightful feedback [35]. Interactive prototypes, also known as high-fidelity prototypes, offer a more realistic and immersive experience because they closely resemble the final product in terms of visual design and functionality, engaging the users with the interface [35]. Low-fidelity prototypes facilitate early ideation and concept testing, while high-fidelity prototypes allow for more thorough user testing and validation of design decisions, allowing designers to balance between the quick exploration and in-depth evaluation. In order to make a prototype, test and analysis procedures are carried out in a co-design fashion with the direct participation of the intended users. One of the strengths of HCD is that it utilizes a combination of qualitative and quantitative methodologies.
3. Methodology
In accordance with the HCD methodology, our research incorporated both qualitative (quotes of the statements made by teachers during the interviews) and quantitative approaches (analysis of nominal data gathered from a questionnaire) [36]. Our pilot study is guided by the following three HCD steps (Figure 1): (1) identification of requirements: in this step, we conducted interviews to make observations of teachers and identify the obstacles to their adoption of Learning Analytics (LA) and explore ways to improve their awareness of LA and visualizations; (2) idea generation and testing: building on the insights gained in step one, the second step involved creating a low-fidelity prototype solution (paper prototype) for teachers by investigating a variety of educational data sources, methodologies, and visualizations that could provide insights into students’ learning processes. To accomplish this, a second series of interviews was conducted; and (3) prototyping and testing: this step required developing an actual solution in the form of an interactive prototype based on the data gathered in the previous step. Based on the teachers’ feedback of the interface evaluation, a usability test on the interactive prototype was performed to finalize the design.
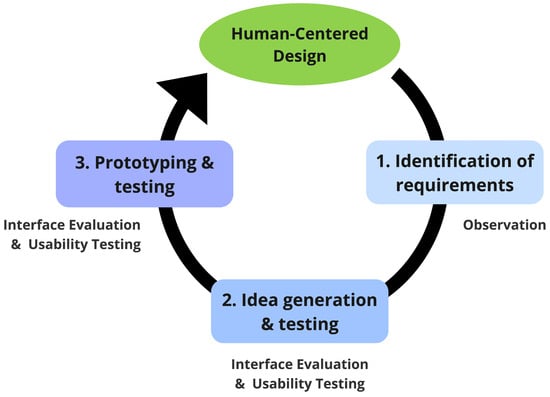
Figure 1.
Cycle of design presenting our three-step HCD approach.
Figure 2 represents the project timeline indicating the three steps of our HCD approach and the series of interviews related to each step. As shown in Figure 2, we began preparing for the first step of the HCD approach in September 2021, and we completed it in December 2021. In the meantime, we set the first series of interviews for December 2021. In January 2022, we began the second step of the HCD approach after analyzing the data gathered from the first interviews. The proposed visualizations in the paper prototype were also discussed over two meetings with the co-authors. After completing the development of the paper prototype, we conducted the second interviews in May 2022. We finished analyzing the information gathered during the second interviews in June 2022. From August 2022 to October 2022, we focused on the third step of the HCD approach, and a teacher workshop was set for November 2022. The following sections will provide descriptions of both the three HCD steps and the participants involved in each of these steps.
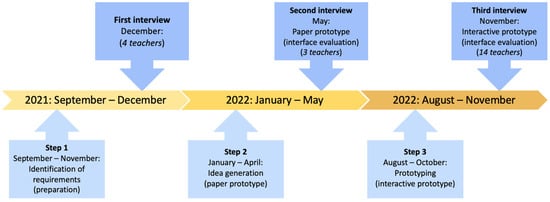
Figure 2.
Project timeline indicating the three steps of our HCD approach and the series of interviews.
3.1. Participants
Starting from the fourth grade, many schools in Sweden adhere to a one-to-one policy—every student is provided with a laptop/tablet—employing various DLMs that generate daily digital data. Teachers use DLMs differently, some using them daily, while others sporadically. However, we conducted the first series of interviews with four teachers from two primary/secondary schools in Sweden who were proficient users of a DLM, to capture a richer picture of the usage. At the schools where the participating teachers worked, every student was provided with a tablet, and the teachers used the DLM almost daily in various disciplines such as Mathematics, English, and Swedish. The students were required to complete certain tasks on their tablets or computers via the DLM, and the teachers could monitor their progress by viewing the number of correct/incorrect answers and whether or not they have completed the assigned tasks. Table 1 shows more detailed information about the teachers: subject, gender, teachers’ age group, and the students’ grade level in the first step. The study was conducted online via Zoom, a video-conferencing software, and the group interviews were held in English. All teachers agreed to let the researcher record the Zoom meeting. Participation in this study was completely voluntary; however, as we stated in the interview instructions, the participants remained anonymous.

Table 1.
Teachers’ composition during the first series of interviews.
The paper prototype (the second step of our HCD approach) was evaluated with a total of three teachers from three primary/secondary schools in Sweden. Table 2 shows more detailed information about the teachers.
Table 2.
Teachers’ composition during the second series of interviews.
Before beginning the evaluation, each participant was informed about the project, its goals, and the purpose of the interview. The study was conducted online via Zoom, with the participants and the researchers sitting in separate, silent rooms. This time, the interviews were held in Swedish. All participants agreed to let the experimenters record the Zoom meeting. To enroll the teachers, we enlisted our representative at each school to inform the teachers about the interviews and subsequently furnish us with a list of those willing to participate voluntarily.
To gather evidence on the effectiveness of the interactive prototype, which is the third step in our HCD approach, we carried out a user study within a workshop setting. People with primary–secondary teaching experience in Sweden were our main target group. The technology ecosystems of the schools mentioned in the second and third interviews were similar to those of the schools examined in the first interview. We were able to reach 14 voluntary participants through a 40 min workshop which was open to local teachers in the region. The workshop was held in Swedish. Each participant had his or her own computer to examine the interactive prototype. Since it was an open workshop, we did not collect information about participants.
3.2. Our Three-Step HCD Approach
3.2.1. Identification of Requirements
In the first step, we conducted a series of interviews with four primary/secondary school teachers, as in Table 1. We wanted to observe the teachers and identify their requirements [37] and explore their grasp of data visualization by displaying an example of a dashboard that had previously been developed for other purposes. The DLM in question was a multimodal digital learning tool built around the core curriculum for the school’s grades 4–9. In this DLM, animated topic videos with relatable characters and clear examples demonstrated concepts, facts, and context.
The authors, two researchers in information visualization (one junior and one senior) and one researcher in educational science with expertise in LA, met with two researchers in educational science (one junior and one senior) to prepare the template of the first interview pilot study and questions presented in Table 3.
Table 3.
Protocol of the first series of interviews.
We asked the participants a week before the interview to prepare by thinking about the following questions and their experiences with EdTech:
- How do you usually evaluate your students’ data through the DLM or any other EdTech?
- How do you communicate with your students through the DLM or any other EdTech?
- Do you evaluate if your students use the DLM?
3.2.2. Idea Generation and Testing
In the second step, a paper prototype was designed while taking into consideration the requirements of the teachers who participated in the first step of the HCD. Figure 3 illustrates the designed paper prototype of the teacher dashboard and its main components. We conducted the second series of interviews with three teachers from three primary/secondary schools in Sweden, as in Table 2. The proposed paper prototype exemplified three views: Class, Student, and Discipline.
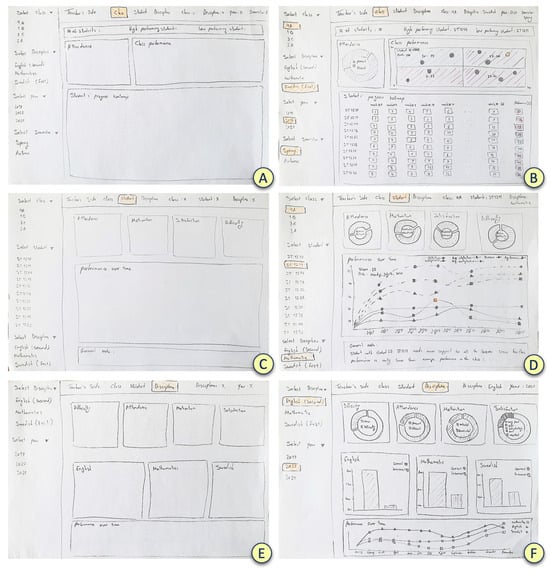
Figure 3.
Paper prototype for teacher dashboard. (A) Class view before selecting items from the item lists. (B) Class view after selecting items from the item lists. (C) Student view before selecting items from the item lists. (D) Student view after selecting items from the item lists. (E) Discipline view before selecting items from the item lists. (F) Discipline view after selecting items from the item lists.
The Class view (Figure 3A,B) visualizes the class name, discipline, academic year, and school semester. Moreover, it visualizes the number of students in the class, the high- and low-performing students, the percentages of absent and present students (in the pie chart), the percentages of students’ performance presented in four clusters, and the students’ progress heatmap, which shows the number of scores for each student in the selected semester and the percentage of performance.
The Student view visualizes the students’ learning outcomes individually by selecting the class name, student ID, and discipline. The attendance, motivation, satisfaction, and difficulty percentages are displayed in the four pie charts at the top of Figure 3C,D. Also, this view enables the teacher to see the student’s performance in different sub-areas over time. We also considered a generic note box for the teacher so that he or she may get a general idea of the student’s learning outcomes after reading the text.
Figure 3E,F illustrates a Discipline view that shows the proportion of attendance, motivation, satisfaction, and difficulty for a certain discipline and year, allowing teachers to compare the number of correct and incorrect answers in various disciplines, as well as seeing the learning performance of various disciplines over the period of an academic year. Table 4 presents the protocol of the interview and the interview questions.
Table 4.
Protocol of the second series of interviews with the groups of teachers and researchers.
3.2.3. Prototyping and Testing
In this third step, we created an actual solution in the form of an interactive prototype based on the data gathered in the previous steps. This means that, upon selecting an icon on the screen, the user could anticipate that windows or operations would launch [38]. Figure 4 presents the interactive prototype we developed for the teacher dashboard. A workshop (user study) lasting 40 min was used as the platform for our final series of interviews with 14 individuals who possessed teaching experience in primary–secondary education in Sweden.
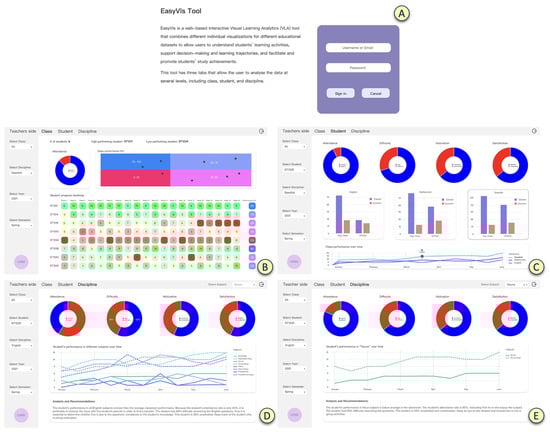
Figure 4.
Interactive prototype for the teacher dashboard. (A) Login. (B) Class view. (C) Student view. (D) Discipline view before selecting items from the sub-area list. (E) Discipline view after selecting items from the sub-area list.
Table 5 presents the instructions for the user study. The data collection was separated into five steps, to which all participants contributed. In the first step, we described the interactive prototype to the teachers by showing its main components and visualizations and how to use it. In the second step, participants were given a URL through which they could later engage with the interactive prototype. In the third step, the participants used the interactive prototype to perform a set of nine tasks. Participants were given a paper sheet with task descriptions and were asked to write their responses to the nine tasks on the paper within 20 min. In the fourth step, the participants were asked to enter their answers into Mentimeter—which is an interactive presentation platform with an easy-to-use online editor—while all could watch the results appearing, together with the researchers. Finally, in the fifth step, the researchers asked the teachers a number of reflection questions and had a short discussion about the dashboard. The participants shared their comments, attitudes, or feelings about it.
Table 5.
Protocol of the third series of interviews with teachers in a workshop (user study).
As can be seen in Figure 4A, we considered a login system so that different stakeholders could see the relevant dashboard developed based on their needs, but as previously stated, the focus of this study was on the teacher’s dashboard. Similar to the previous paper prototype, this model had three views: Class, Student, and Discipline.
Teachers can use the Class view presented in Figure 4B to compare the outcomes of individual students in a classroom during the first or second semester of an academic year, find the number of students in a classroom, discover the high- and low-performing students in a classroom, categorize students into different groups based on their learning outcomes, discover the weeks when a student has the most and least number of correct answers, and find the percentage of attendance in a classroom.
Using Student view (Figure 4C) allows teachers to obtain the percentages of attendance, difficulty, motivation, and satisfaction for one student in the selected discipline throughout the first or second semester of an academic year, compare the student’s performance in different disciplines by assessing the number of correct and incorrect answers for the chosen student in each discipline, compare the student’s success in multiple disciplines by examining the number of scores over time, and compare the student’s performance to the class’s average performance.
The teacher can use Discipline view (Figure 4D,E) to get more detailed information about a student’s performance in a discipline. This view enables teachers to analyze the student’s performance in different sub-areas of the discipline over time by looking at the number of scores obtained for each sub-area and comparing it with the class’s average performance presented in the line plot and receive a text analysis and recommendations about the student’s performance in the chosen discipline. We considered an extra dropdown component in the top right side of the view (Figure 4E) because there should be many sub-areas in a discipline, so the teacher could select a sub-area and have more comprehensive information about it in the pie charts, line chart, and text analysis.
4. Outcomes
4.1. Outcomes of the First Step of the HCD: Identification of Requirements
Table A1 in Appendix A presents the teachers’ direct responses (quotes) to the questions of the first series of interviews. To the question Can you describe how educational technology in general is part of your teaching? the teachers answered that they used a variety of Google products, including Google Classroom (a free integrated learning platform to make the process of creating, distributing, and grading assignments simpler) and Google Forms (a survey administration software), as well as a number of tools, such as Exit Ticket (a tool for evaluating the lesson with the students) to understand where the students are. They have also used the DLM in addition to the other mentioned technologies for two years. They also tried digital mathematic books as supplements, where students can find new tasks to work on. However, the students were uncomfortable with the digital books, so they stopped using them:
Teacher 2 (school 1): “… we tried digital math books as complements to the stages where the students can find other tasks to work with, but the students were not comfortable with it, so we have given up on them...”.
The teachers also explored some online digital tools such as GeoGebra, an interactive mathematic software for all educational levels that integrates geometry, algebra, spreadsheets, graphing, statistics, and calculus into a single engine, to assist them in balancing the pedagogy. All the answers indicated that the teachers had experience with the use of EdTech (Table A1 in the Appendix A, Answ. Q1).
Furthermore, we were interested in seeing how teachers integrated data analysis from the DLM into their teaching. To the question How do you use the DLM or data analysis from the DLM in your teaching (Student evaluation)? the teachers responded by simply stating that they used the DLM to check whether students watched the videos or completed their homework during the pandemic:
Teacher 1 (school 1): “Well, in our school, teachers use it to check out if students watched the movies or to see if they did their home study during the pandemic…”.
However, when it came to the quiz, the teacher could see how well the students knew the subject, but they noted that the outcome was unreliable because the students may have simply clicked on the response without knowing the right response. The teachers were able to identify which questions were difficult and try to ascertain which students did not understand them by using the DLM.
To determine whether the students needed to complete any more tasks, the teachers may also see a visualization of the class. They also discussed the issue of “taking quiz before watching video,” so teachers should inform students to watch the video in the DLM once or twice before taking the quiz; otherwise, they would be unable to determine whether the students understood the material and would have no data to analyze later. By taking into account the answers, some issues and bugs with the DLM were detected and reported to the EdTech company.
The teachers mentioned that it is encouraging to observe the students’ understanding of the actual word that they must learn in response to the question What do you think should/would be possible to analyze with the data? Additionally, they want to be able to tell if a student misread a word:
Teacher 4 (school 2): “I think the understanding of the actual word that they need to learn. ... also, to see if the students misunderstand a word and where are they …”.
The teachers responded to the question What do you think you can gain or lose from using data analysis in your teaching? by explaining that the teachers should use a variety of tools and cannot rely on just one. They stated that the challenge is that knowledge differs significantly depending on the tool used, and when the DLM reduces knowledge to simply a “click,” the teacher loses the discussion component with the students, which cannot be replaced by a click. In order for students to express their feelings and for teachers to better understand and categorize all of the students in the class, teachers were more interested in “what do you think about...?” questions than quizzes with correct or incorrect answers:
Teacher 3 (school 2): “… I think instead of having quiz which has a right or wrong answer, the DLM should add ‘what do you think about …?’ so students can describe their feelings…”.
In response to the question How do you provide feedback to your students? the teachers mentioned that they gave feedback to the students while the students were working by walking around the room and evaluating their progress. As a result, the students asked many questions and the teachers engaged in a meaningful conversation with the students:
Teacher 1 (school 1): “We do it in the classroom during the work by walking around the classroom and checking the progress, so the students ask a lot of questions and by talking a lot with the students”.
Teachers further noted that they could quickly mark the text when students wrote digitally (Table A1, Answ. Q2.b).
In response to the question If you want to measure student learning or progress, how do you usually do it? the teachers mentioned that they use a variety of quick questions throughout the session to determine how much the students understood, and that they typically concluded each session with a test:
Teacher 4 (school 2): “We use different types of quick questions during the session to check and know how much they understand. We usually end up a session with a test”.
Additionally, the teachers informed the students to write various types of text (either on paper or digitally) so that they could show the teacher how much they had learned from the videos and applied it to the text afterwards, but reading is a process that the teacher could observe during the time (by test and seminars).
In response to the question Can you tell us anything that comes to your mind about the suggested dashboard? the teachers’ reaction indicated that the dashboard was interesting since it enables teachers to evaluate and monitor their students more thoroughly. It was also interesting for them since the teachers could discuss and show the analysis of a large amount of data to their students:
Teacher 1 (school 1): “… There are a lot of data to analyze, and it is so interesting. It is something that you can even discuss with the kids and show them”.
In response to the question Can you be more specific on what kind of visualization that you would need to get a better picture of your students, coming that from educational technologies or other sources? the teachers stated the requirement for a visualization that demonstrates how frequently students used a system to understand how they interacted. Additionally, they wanted to have a visualization for measuring how active students are when watching a video because they may be watching a movie while simultaneously playing a game, making a single click meaningless. According to the responses, it would also be beneficial to have a visualization that tracks students individually to help them feel more confident and to see if they are improving or not:
Teacher 2 (school 1): “… to see if they are getting better, so you can follow students individually and help them increase their confidence”.
We asked teachers Do you want to see individual, collaborative, and group learning processes? and they explained that group-level data activity is more significant to them because teachers do not have enough time to focus on each student individually (group first, then individual students). They also noted that teachers sometimes assign a lot of DLM videos for the students to watch and sometimes they do not, which is why some of them came to the conclusion that having a pie chart is beneficial:
Teacher 3 (school 2): “In some weeks we do not watch the DLM’s videos, but in some weeks, we assign lots of videos to students, so pie chart is more meaningful for me to have a conclusion”.
Additionally, they requested a plot that shows the number of interactions by sub-area, enabling the teacher to find videos on a sub-area where students are having difficulty (Table A1, Answ. Q5).
Analyzing the collected responses from the first interview helped us grasp the fundamental requirements for the second step of our HCD approach, idea generation and testing.
4.2. Outcomes of the Second Step of the HCD: Idea Generation and Testing
The teachers’ direct answers to the questions in the second series of interviews are shown in Table A2 in Appendix A. Due to the fact that interviews were conducted in Swedish, we present here translations of the answers into English performed by a fluent speaker (co-author). An overview of the key points raised in response to the first question How would you interpret what you see? (General impressions) follows (Table A2, Answ. Q1):
- The design is more appealing to teachers since they do not have to add information to the dashboard.
- The design is easy, useful, and clear for teachers to obtain results and see how a student’s performance changes over time.
- The sketch prototype has a good layout.
- Some of the teachers already have some information about the students from the DLM that they use in their school. When they assign a task, they can see the response frequency for individual students as well as the entire class, and this sketch prototype provides a more comprehensive view of that.
According to the responses to the second question Do the sketches represent the information you needed about the students? the sketch prototype provides all the information that the two teachers needed. One teacher was unsure whether the DLM they use in their school included the “Easy read” option, so that, as a teacher, they know if a student has a reading problem with the assignments, if the student understands the mathematic question, if there is a problem with the solution, or if there is a problem with understanding the text. Also, the number of repetitions in answering a question (how many times students answered a question) was one of the issues raised during the interview, which should be discussed with the EdTech companies that produce the DLMs:
Teacher 3: “One thing that would be interesting is how many times students answered a question, whether they read a lot before or answered right away and got it wrong…”.
The responses to the question Do the visualizations represented by the sketches help you see the student’s needs? were rather broad since the teachers in different schools are dealing with many different issues. As one teacher explained, the answer to this question depends on the assignment provided to the students. Every day the assignment changes and the students do something different. If they have a lot of content to read and then answer many questions or write something, the teacher might be able to notice it by looking at the visualizations. Another teacher explained that, in their school, teachers use the circle approach, in which the entire student group practices together, then in a small group or in pairs, and finally alone. Therefore, if EdTech companies modify their DLMs to accommodate such a teaching approach, teachers may gain valuable data about their students’ progress by using a dashboard. Teachers believed that communication between EdTech companies and teachers is critical since teachers can provide comments/feedback on the DLM assignments. One teacher was happy with the visualizations proposed in the paper prototype:
Teacher 2: “… Me and my colleague work a lot with the circle model, where the whole group practice together, then a small group or in pairs then they work individually. So how can the companies adjust their DLM so that it fits with such a teaching model, if they can, then you would automatically get good data over students’ progress...”.
The following is a summary of the points expressed in response to the last question Are the visualizations represented by the sketches useful or are you missing something? from the three teachers (Table A2, Answ. Q4):
- The dashboard can provide information regarding class and student variances.
- View the entire class before entering data for individual students.
- In the “Discipline” view, the teacher should be able to select both a class and a student.
- Be able to select a discipline, class, and student under the “Student” view and compare the student’s performance in English, Mathematics, and Swedish. In this way, the teacher can see if one student has problems in one or all the disciplines.
- Be able to select the class name in the “Discipline” view.
- Be able to compare student performance across subjects in a discipline and compare students in a class.
By taking into consideration the responses from the group interviews regarding the paper prototype, we developed an interactive prototype.
4.3. Outcomes of the Third Step of the HCD: Prototyping and Testing
Participants were asked one or more questions for each task. Correct answers to the questions indicated that the participants could “read” the interactive prototype’s visualizations. Tasks 1 to 4 were related to the Class view. In Task 1, participants were asked to identify the high- and low-performing students in Class 2A for the Swedish discipline in the year 2021, Spring. The assignment for Task 2 was to analyze the information in the class performance visualization at the top of the Class view, determine how many students have a performance between 25% and 50%, and write down their student IDs. For Task 3, participants had to find the percentages of present and absent students in Class 2A. In Task 4, the participants were asked to find the weeks that the student with the student ID ST1238 had the most correct answers. Tasks 5–6 were associated with the Student View. For Task 5, the participants were asked to estimate the number of incorrect answers for the student with the student ID ST1225 as well as the average incorrect answer in the class for the mathematics discipline. In Task 6, the participants were required to figure out the percentage of difficulty for the student with the student ID ST1225 in the Swedish discipline.
The participants were required to use the Discipline view to answer the questions on Tasks 7–9. Task 7 required participants to identify the English sub-area in which the student with the student ID ST1225 performed the poorest. In Task 8, participants were asked to find the student score in the Noun sub-area on April 15th. In Task 9, participants were asked to discover the percentage of motivation in the Noun sub-area for the student with the student ID ST1225.
Figure 5 illustrates a summary of the data collected throughout the workshop, including the participants’ answers to all questions/tasks. One early observation was that most of the participants were able to effectively complete most of the tasks. Tasks 5 (Q.2) and 8, each with three incorrect answers, Tasks 5 (Q.1) and 9, each with two incorrect answers, and Tasks 3 (Q.1) and 6, each with one incorrect answer, were the questions where the participants answered incorrectly the most. When we checked the incorrect answers, we found that two participants had entered the answers to Task 5 in reverse, which meant they had entered the answers to the first question for the second question and vice versa. On the other hand, one of the main reasons for “No answer” was the time constraints for transferring the answers to Mentimeter.
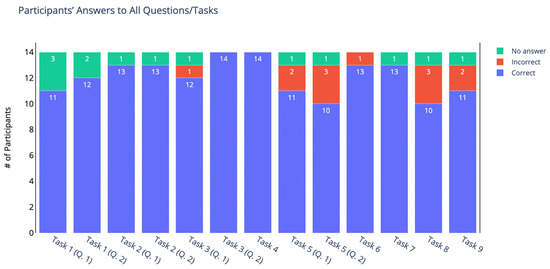
Figure 5.
Results of the user study: participants’ answers to all the questions/tasks.
Following that, we had a brief group discussion on how participants felt about the interactive prototype and asked some reflection questions. According to the teachers’ answers to the question. Is there any value in using the dashboard in the classroom? the proposed interactive prototype can be used to evaluate student performance in a classroom and assist a school principal/teacher in making improvement plans. They also found it helpful to be able to compare student performance in a classroom and concentrate on each student’s progress separately. We received the following responses regarding the second question What could you tell by looking at the visualizations presented in the dashboard?: the possibility of relating students’ performance to their attendance rate, assessing whether or not higher attendance leads to better outcomes, looking at the pie charts in the dashboard to be aware of inaccurate data when the teachers have students who they know are abroad but who have a 65% confirmed attendance in the system represents a good resource for “development plan conversations” with students, and finally, finding patterns over time and being aware of thinking correlation, because the teachers do not know what influences what. Additionally, some teachers noted that the dashboard can be used as a guideline, and they found it fascinating while working with big datasets.
5. Discussion
We conducted research using a HCD approach to answer our research question about the involvement of teachers of primary and secondary education in the process of designing an easy-to-use LAD to meet their initial requirements that addresses educational issues. HCD was explained by Chatti et al. [9] as an interactive framework that encouraged cooperation between participants, designers, and researchers. As a result, the researchers, teachers, and developers actively engaged in this study. Our HCD approach was divided into three steps. In the first step, we determined the obstacles that prevent teachers from adopting LA, as well as the strategies that are currently in use to better understand the teachers’ awareness of LA and visualizations and their initial requirements. The second step involved developing a straightforward paper-prototype solution for teachers using a variety of educational data sources, techniques, and visualizations that might offer insights into students’ learning processes, building on the knowledge gathered in step one. Based on the information obtained in the second step, the third step involved creating an actual solution in the form of an interactive prototype. A usability test was performed with the interactive prototype, and teachers’ feedback was gathered.
The outcomes of the narrative analysis of the interviews, together with the statistical analysis, show that the interactive prototype of the teacher dashboard provides sufficient support to the teachers to analyze and complete educational/administrative tasks. Consequently, visualizations in the interactive prototype can be interpreted as being helpful to teachers who want to group students based on their learning performance, compare students’ performance in a classroom while focusing on each student’s individual progress, and monitor the student’s learning path based on learning outcomes and activities. Teachers’ response to the reflection questions and their feedback shows that we can go one step further and start developing a teacher’s dashboard to implement in iterative steps and with a larger number of teachers to better exploit necessary requirements and changes.
Previous studies [39,40] have indicated that, although there exist LAD solutions in primary and secondary education, the research evidence is scarce about the goal of supporting teachers in adopting visualizations for pedagogical interventions. This study does not reach that goal either. Yet, we have used the HCD methodology to iterate the design, execution, analysis, and redesign of a LAD, which we believe provides researchers with a richer design picture. Research has, for instance, presented the development of WiREAD (a LAD) using a design-based approach that helps students enhance their self-awareness, SRL dispositions, and learning motivation and engagement while fostering connected literacy [41]. According to Ez-Zaouia et al. [42], conducting research considering a design-based approach and developing a LAD for teachers based on the finding could assist them in using an online learning platform that relates to the curriculum and allows them to monitor their students’ activity and progress in French grammar and spelling.
5.1. First Step
The HCD approach used in this pilot study began with identifying the initial requirements of the teachers for data visualizations. According to research, this is a fundamental design assumption [37,43]. The teachers described how they employed a variety of EdTech, online digital tools, and DLMs to assess student progress and to help them balance the pedagogy. The responses showed that the teachers had prior knowledge of using EdTech. McGrath and Kerfeldt [44] claimed that the Nordic countries are well situated to take advantage of cutting-edge EdTech, and in Swedish schools, both teachers and students use digital materials in the classroom on a daily basis.
The teachers noted that, throughout the pandemic, they used the DLM to verify that students had done their assignments, although the results were untrustworthy because of students’ erratic clicking on responses. Research has proved that it is indeed difficult to demonstrate different aspects of student learning, and both quantitative (quiz score) and qualitative (technology portfolios made up of all student’s activities) data are essential to better understand student progress [45]. So DLM co-design needs to take these learning science aspects into consideration. Using the DLM gave the participating teachers a picture of the class to assess whether the students need to complete additional tasks and helped them identify which questions were difficult and which students did not understand them. This is indicative that student progress and performance to teachers using DLMs has a progressive impact on teaching practice [46], even though this was not the focus of this study.
The teachers emphasized that a variety of EdTech and digital tools should be used as part of teaching. As research has proved, a higher use of EdTech among teachers appeared to promote pedagogical diversity and changes in teachers’ behavior [47]. The teachers also claimed that they lose the opportunity for dialogue with the students when the quizzes in the DLM only include correct/incorrect or multiple-choice questions, which prevents the students from expressing their feelings. One possible design and pedagogical solution for this is for EdTech to foster dialog between teachers and students in both directions with added communication features. Research has demonstrated that such dialog improves the learning experience in the classroom [42].
One of the main points the participating teachers made was for teachers to provide feedback to students and assess their progress as they were working. Research has shown that, although face-to-face interactions with students are essential, teachers who use the teacher dashboard more frequently are able to interpret the data using a wider variety of pedagogical knowledge, which led to a wider variety of feedback [46]. This indicates that researchers should promote the use of dashboards to support feedback that could possibly contribute to learning outcomes.
To determine how much the students knew, the teachers indicated that they used a variety of quick questions throughout the lesson, and that they usually ended each session with a test. Teachers’ answers shown that they do not rely on the DLM for evaluating students’ skills. This is a pity since data can be collected and analyzed to provide a quick picture of the learning progress, which should inspire the use of LADs. However, in terms of implementation, research has shown that one of the contributing issues is that DLM companies failed to offer the teachers enough practical support to make the best use of the DLM, or that the teachers did not find it appropriate for the curriculum [48,49].
According to the teachers’ answers, it was interesting for them to be able to discuss and show the analysis of a significant amount of data to their students while also being able to evaluate and monitor their students more thoroughly using different visualizations. This demonstrates that specific visualization features of LADs that cover pedagogical purposes are considered positive factors by the participants, as research has also shown [50]. This is also true for the need to visualize how frequently students use the DLM and how active they are, as stated by the teachers. Again, co-creation of effective LADs becomes important.
Teachers claimed that they do not have enough time to spend on each student individually, therefore they request group-level data activity to be part of LADs, as well as features like pie chart to show weekly progress. These developments are displayed in several LADs [5,39,51], but development is usually not conducted together with teachers to better generate educational value.
5.2. Second Step
In the second step of our HCD approach, we created a paper prototype to test our research question. Research has demonstrated these are inexpensive and effective at identifying usability issues [33,52,53].
Overall, the teachers had positive opinions of the proposed paper prototype, and they liked the simple and practical design that theoretically allowed them to monitor students’ and entire classes’ progress. Those are of course important design features if teachers wish to visualize the monitoring of individual [54] and classroom activities [46]. However, our results also showed that teachers are not always aware of what visualizations could actually be of benefit to them.
The participating teachers suggested that various Swedish schools are dealing with a variety of issues regarding assignments provided to students. In terms of co-design and implementation, the teachers expressed a wish for better collaboration with EdTech companies to match DLMs with teaching approaches. This is a valuable insight for LADs development. As stated by Farjon et al. [55], to establish efficient procedures for integrating EdTech into the classroom, teachers require practical support and instructional content that is pedagogically informed [48,49]. Teachers also provided constructive suggestions to help us improve the prototype that was then used to create the interactive prototype tested in the next step.
5.3. Third Step
In step three, we finally developed an interactive prototype. Research has shown that these can be operated almost as if they were the final product [38].
According to [35], performing a usability test on a high-fidelity prototype is essential to receive final approval on a product design before development begins. Our results of the usability test with a questionnaire with several tasks on the interactive prototype and its resulting statistical analysis imply that the visualizations presented were easily interpreted. This was our initial goal, that is, co-develop an easy-to-use LAD.
To find out how participants felt about the interactive prototype, we also asked them various reflection questions. According to the teachers’ answers, our LAD solution could be used by school principals or teachers for improvement and pedagogical work. Research has shown, for example, that teachers who regularly use LADs have been able to monitor students and plan pedagogical feedback [42]. Another important usability aspect pointed out by the teachers is that they believe they can link students’ success to their rate of attendance visualized on the LAD. Research has shown that, typically, attendance is seen as an indicator of how engaged students are with their courses and as being essential to their success [56]. LAD visualizations could also be a good resource for “development plan conversations” with students, as stated by the teachers. Visualizations could help teachers in finding patterns over time to detect dropout behavior [57]. Additionally, some teachers mentioned that they like using the dashboard when working with large datasets and used it as guidelines, which was also encountered in previous studies [58]. Even though our study focused on the use of the HCD approach to co-design an easy-to-use LAD and test its use, the conversations with our teachers pivoted around possible benefits of the LAD. This is understandable from the teachers’ point of view. In this respect, it is the designers’ role to listen and take into account the requirements of the teachers and their concerns and incorporate those in a sound and valuable LAD.
6. Limitations
One limitation of the study is the low number of participants in the earlier steps of the pilot study. A larger number of users may have provided a more nuanced set of results. However, this is a pilot study, and, as such, we wanted to achieve a quick glimpse of what we can expect and what to look for or avoid when we move forward to conducting a large research project with a number of local schools.
What could be considered another limitation is the lack of results on learning impacts from the student’s perspective. This concern was made apparent in the conversations with the participants. This is also a topic with little research evidence; therefore, we plan to contribute to it with our future research.
While conducting our pilot study, we faced obstacles such as concerns regarding data security, privacy, and ethical considerations raised by the participants. Our hypothesis is that data analysis and literacy is so current that participants struggle to see possibilities while focusing, justly, on concerns. Additionally, following the GDPR and obtaining agreements with EdTech companies, municipalities, students, and parents proved to be a very lengthy process, which hindered our ability to implement our LAD and conduct empirical research on the improvement of students’ performance based on the intervention of teachers’ decision making after consultation with data visualizations. Nevertheless, we maintain that the discovery presented in this article remains a valuable resource for researchers seeking to tailor a LAD using a HCD method to better meet the demands of their users.
7. Conclusions and Future Work
LADs can give insights and inform pedagogical decisions by evaluating large amounts of diverse educational data obtained from digital learning resources. However, LADs have to be co-designed with teachers to become viable and be adopted. There has been insufficient investigation into the creation of a LAD using a HCD methodology, which would effectively capture the needs of teachers and create a suitable dashboard. This study used HCD to understand the initial requirements of teachers regarding data-driven education, data analysis, and visualization. The three-step HCD approach was useful to determine the primary and secondary teachers’ initial requirements for the design of a LAD, include those in visualizations about the learning process to be featured in a LAD, and finally test a simple prototype of the LAD. To answer our initial research question, the results indicate that the HCD approach is a useful iterative process that in co-operation with the intended user can provide valuable design solutions. Moreover, we incorporated both qualitative and quantitative methodologies, encompassing data obtained from interviews (dialogs) and questionnaires. Nonetheless, the design and usability results of our pilot study have to be tested in a real classroom environment with students, so that data generated by the use of DLMs can be analyzed and visualized in our proposed LAD to guide the pedagogical decision making of the teachers. Only then can we also contribute to research on the benefits of LADs for students and teachers in primary and secondary education.
Author Contributions
Conceptualization, Z.M., I.M. and R.M.M.; methodology, Z.M. and I.M. and R.M.M.; software, Z.M.; validation, I.M.; formal analysis, Z.M.; investigation, Z.M.; resources, Z.M. and I.M.; data curation, Z.M.; writing—original draft preparation, Z.M.; writing—review and editing, Z.M., I.M. and R.M.M.; visualization, Z.M.; supervision, I.M. and R.M.M.; project administration, I.M. All authors have read and agreed to the published version of the manuscript.
Funding
This work is supported by the Swedish Research Council for Health, Working Life and Welfare (FORTE), grant number 2020-01221 and Växjö Kommun, grant number 2020/3209-5.1.1.
Institutional Review Board Statement
Not applicable.
Informed Consent Statement
Informed consent was obtained from all subjects involved in the study.
Data Availability Statement
This manuscript has no associated data.
Conflicts of Interest
The authors declare no conflict of interest.
Appendix A
Table A1.
Teachers’ direct responses to the questions in the first series of interviews.
Table A1.
Teachers’ direct responses to the questions in the first series of interviews.
| Answ. Q1 | Teacher 1 (school 1): We use different things such as google classroom; we do lot of google forms and Exit ticket to understand where the students are. We use the DLM for 2 years as tool beside the other things. Teacher 2 (school 1): Yes, also, we tried digital math books as complements to the stages where the students can find other tasks to work with, but the students were not comfortable with it, so we have given up on them. We do some amount of GeoGebra online and we try to find online digital materials to help students to balance up the pedagogy. We use whiteboard.fi in the pandemic so we can see the students’ self-writing. Teacher 3 (school 2): We use different google products but google classroom is the base, the DLM and digital books—they don’t work very well, because students and parents are conservative. Teacher 4 (school 2): O-hum [murmurs of confirmation]. |
| Answ. Q1.a | Teacher 1 (school 1): Well, in our school, teachers use it to check out if students watched the movies or to see if they did their home study during the pandemic, but when it comes to the quiz, the teacher can see somehow how the students understand the subject, but sometimes it is quite difficult, and the students just click on an answer while they don’t know the correct answer. The teachers can see which questions are the difficult ones and try to figure out why and which students did not understand it. Teacher 2 (school 1): The teachers also can see a picture of the class, so they can see if they need to do something more. Teacher 3 (school 2): Now the DLM is more like a complement to other stuff (watching movies and nothing more). Same problem of “doing quiz before watching the movie”, so we ask the students to watch the movie ones or twice and later do the quiz, so we can see if we should stop if they don’t understand the subject and then we can use the data. If the students do not follow the steps, we can’t rely on the data. Teacher 4 (school 2): O-hum [murmurs of confirmation]. Quite often the students do the quiz before watching the movies which is not a good thing… |
| Answ. Q2 | Teacher 4 (school 2): I think the understanding of the actual word that they need to learn. Also, to see if the students misunderstand a word and where are they—the usual misconception that the students get when they learn a new word. Teacher 2 (school 1): O-hum [murmurs of confirmation]. |
| Answ. Q2.a | Teacher 2 (school 1): We should use different tools and we cannot be relying on just one. The tough part is that by using different tools, the knowledge is quite different and when we narrow it down to just a click, you lose the discussion part with students and we cannot replace that thing with a click, so they must be complemented. Teacher 1 (school 1): Yes, it important to talk to students. Teacher 3 (school 2): Yes, I think instead of having quiz which has a right or wrong answer, the DLM should add “what do you think about …?” so students can describe their feelings (something like Kahoot to check in if the students know a subject), and teachers can have better view about all the students in the class and categories them. |
| Answ. Q2.b | Teacher 1 (school 1): We do it in the classroom during the work by walking around the classroom and checking the progress, so the students ask a lot of questions and by talking a lot with the students. Teacher 2 (school 1): Yes. Teacher 3 (school 2): We mark the text immediately when students write in the digital way. Teacher 4 (school 2): O-hum [murmurs of confirmation]. |
| Answ. Q2.c | Teacher 4 (school 2): We use different types of quick questions during the session to check and know how much they understand. We usually end up a session with a test. Teacher 3 (school 2): Yes, exactly. Teacher 2 (school 1): The students should write different types of text, so I can see how much they learned from the movies that they apply to the text later. They can write in digital way or on the paper, but for readying, this a process that I can see during the time by test and seminars. |
| Answ. Q3 | Teacher 1 (school 1): M-mm [murmurs of thought]. There are a lot of data to analyze, and it is so interesting. It is something that you can even disuses with the kids and show them. Teacher 2 (school 1): I find it useful too! Teacher 3 (school 2): It is interesting, and I can evaluate my students on a deeper level and follow they. Teacher 4 (school 2): That could be absolutely useful! |
| Answ. Q4 | Teacher 3 (school 2): The visualization that shows how much a student used a system is the one that I will use to check how they are interacting. Teacher 1 (school 1): I think having something to show how active students are when they watch a movie is useful because in distance, students play a movie but at the same time play game, so in this way, just one click doesn’t mean anything. Teacher 4 (school 2): I like to see the progress of students—means how many incorrect answers does the student make and what is the end result. Teacher 2 (school 1): Yes, exactly, to see if they are getting better, so you can follow students individually and help them increase their confidence. Teacher 4 (school 2): Definitely! |
| Answ. Q5 | Teacher 1 (school 1): Well, the amount of time that we have doesn’t allow us to really focus on students individually, so seeing group-level data activity is more important for me. Teacher 2 (school 1): I agree, group first and later students individually. Teacher 3 (school 2): In some weeks we do not watch the DLM’s videos, but in some weeks, we assign lots of videos to students, so pie chart is more meaningful for me to have a conclusion. Teacher 4 (school 2): I want to have a plot which shows the number of interactions per subject because maybe I can find the videos on a subject that students have problem with them |
Table A2.
Teachers’ direct responses to the questions in the second series of interviews.
Table A2.
Teachers’ direct responses to the questions in the second series of interviews.
| Answ. Q1 | Teacher 1: If teachers don’t have to add information, it’s more appealing to the teacher. Teacher 2: You can go in and see “wops! I thought this student was further along in their progress!” then I think the design of the dashboard is much easier and useful. it’s much clearer for the teachers then they get results and how a student’s performance is at different times. Teacher 3: I thought it was easy, good layout. I already have some information on the DLM’s platform. If I assign an assignment, I can see the response frequency for students and the whole class, and this is a more detailed view of that. |
| Answ. Q2 | Teacher 1: I think so, I use google in my classroom and then I can get diagrams. I can get an overview too. you must get used to the system. I think all info I need is there in the dashboard. There is nothing I see that should be added or removed. Teacher 2: I don’t know if the DLM provides data about the option “easy read” they have in their DLM. It would be interesting to see that on a student level. As a teacher you know if a student has a reading problem, it would be nice to see if this “easy read” option had been activated during an assignment. Because that is the first adjustment we make if a student display problem. Would be nice to see if students use text to speech in assignments depending on their needs. You want to know if the student understands the question in math. In a data point, is there a problem with the solution or a problem with understanding the text? is it a mathematical problem or a problem with language? Teacher 3: One thing that would be interesting is how many times students answered a question, whether they read a lot before or answered right away and got it wrong, there after reading the text quickly, maybe got it wrong again, then read it carefully and got it right. It would be interesting to see the student’s activity in such a way. |
| Answ. Q3 | Teacher 1: It depends on the assignment. If there is a heavy text which they should read and then answer a lot of questions or write something, then you might be able to see it using the sketches. Or if you watch a documentary and pick out important thing. The assignment varies each day, they do different things every day. I think it is like that in every subject, for example in Swedish. If they have a writing assignment, then it takes a long time, and they work creatively for a long period in their writing. Then there is the next task which is spelling or grammar and such. Teacher 2: The data come from the DLM. Then the teachers must feel comfortable with the material. Most teachers work according to some model. Me and my colleague work a lot with the circle model, where the whole group practice together, then a small group or in pairs then they work individually. So how can the companies adjust their DLM so that it fits with such a teaching model, if they can, then you would automatically get good data over students’ progress. Maybe we can contact the Edtech company and ask them and be a part of the technical solutions for the DLM. I think that there is a key in the intersection between the teachers and the DLM companies, if they can find the right way together, if the companies can give encouragement and tips on programs/assignments and if the teachers can try to see possibilities and can communicate. We would need more of these interviews, it is another process in the teaching. Teacher 3: Yes, absolutely! |
| Answ. Q4 | Teacher 1: It feels useful. the dashboard can show information about class and student differences. Teacher 2: It was just on DISCIPLINE that it would be good to be able to pick both class and student. Under STUDENT I would like to select, subject, class, student there because if I have a student which failing math, I would like to see what it looks like in other subjects. DISCIPLINE must have which class it is displayed. Teacher 3: Maybe also compare student performance in different subject but also compare with the class. |
References
- Aruvee, M.; Ljalikova, A.; Vahter, E.; Prieto, L.; Poom-Valickis, K. Learning analytics to informand guide teachers as designers of educational interventions. In Proceedings of the International Conference on Education and Learning Technologies, Palma de Mallorca, Spain, 2–4 July 2018. [Google Scholar]
- Siemens, G.; Baker, R.S.J.d. Learning analytics and educational data mining: Towards communication and collaboration. In Proceedings of the LAK ‘12: 2nd International Conference on Learning Analytics and Knowledge, Vancouver, BC, Canada, 29 April–2 May 2012; pp. 252–254. [Google Scholar]
- Verbert, K.; Govaerts, S.; Duval, E.; Santos, J.L.; Van Assche, F.; Parra, G.; Klerkx, J. Learning dashboards: An overview and future research opportunities. Pers. Ubiquitous Comput. 2014, 18, 1499–1514. [Google Scholar] [CrossRef]
- Schwendimann, B.A.; Rodriguez-Triana, M.J.; Vozniuk, A.; Prieto, L.P.; Boroujeni, M.S.; Holzer, A.; Gillet, D.; Dillenbourg, P. Perceiving learning at a glance: A systematic literature review of learning dashboard research. IEEE Trans. Learn. Technol. 2016, 10, 30–41. [Google Scholar] [CrossRef]
- Mohseni, Z.; Martins, R.M.; Masiello, I. SBGTool v2. 0: An Empirical Study on a Similarity-Based Grouping Tool for Students’ Learning Outcomes. Data 2022, 7, 98. [Google Scholar] [CrossRef]
- Verbert, K.; Ochoa, X.; De Croon, R.; Dourado, R.A.; De Laet, T. Learning analytics dashboards: The past, the present and the future. In Proceedings of the LAK20: Tenth International Conference on Learning Analytics and Knowledge, Frankfurt, Germany, 23–27 March 2020; pp. 35–40. [Google Scholar]
- Aguerrebere, C.; He, H.; Kwet, M.; Laakso, M.J.; Lang, C.; Price-Dennis, C.M.D.; Zhang, H. Global Perspectives on Learning Analytics in K12 Education. In Handbook of Learning Analytics, 2nd ed.; SOLAR: Vancouver, BC, Canada, 2022; Chapter 22; pp. 223–231. [Google Scholar]
- Buckingham Shum, S.; Ferguson, R.; Martinez-Maldonado, R. Human-centred learning analytics. J. Learn. Anal. 2019, 6, 1–9. [Google Scholar] [CrossRef]
- Chatti, M.A.; Muslim, A.; Guesmi, M.; Richtscheid, F.; Nasimi, D.; Shahin, A.; Damera, R. How to design effective learning analytics indicators? A human-centered design approach. In Addressing Global Challenges and Quality Education: 15th European Conference on Technology Enhanced Learning, EC-TEL 2020, Heidelberg, Germany, 14–18 September 2020, Proceedings 15; Springer International Publishing: New York, NY, USA, 2020; pp. 303–317. [Google Scholar]
- Oviatt, S. Human-centered design meets cognitive load theory: Designing interfaces that help people think. In Proceedings of the 14th ACM International Conference on Multimedia, Santa Barbara, CA, USA, 23–27 October 2006; pp. 871–880. [Google Scholar]
- Sharp, H.; Preece, J.; Rogers, Y. Interaction Design: Beyond Human-Computer Interaction, 5th ed.; John Wiley & Sons: New York, NY, USA, 2019; ISBN 978-1-119-02075-2. [Google Scholar]
- Freeman, A.; Becker, S.A.; Cummins, M. NMC/CoSN Horizon “Report”: 2017, K; The New Media Consortium; U.S. Department of Education: Washinghton, DC, USA, 2017.
- Chen, L.; Lu, M.; Goda, Y.; Yamada, M. Design of Learning Analytics Dashboard Supporting Metacognition. In Proceedings of the 16th International Conference Cognition and Exploratory Learning in Digital Age (CELDA 2019), Cagliari, Italy, 28 June 2019; pp. 175–182. [Google Scholar]
- Verbert, K.; Duval, E.; Klerkx, J.; Govaerts, S.; Santos, J.L. Learning analytics dashboard applications. Am. Behav. Sci.-Entist. 2013, 57, 1500–1509. [Google Scholar] [CrossRef]
- Govaerts, S.; Verbert, K.; Duval, E.; Pardo, A. The student activity meter for awareness and self-reflection. In Proceedings of the CHI’12 Extended Abstracts on Human Factors in Computing Systems, Austin, TX, USA, 5–10 May 2012; pp. 869–884. [Google Scholar]
- Ez-Zaouia, M.; Lavoué, E. EMODA: A tutor oriented multimodal and contextual emotional dashboard. In Proceedings of the Seventh International Learning Analytics & Knowledge Conference, Vancouver, BC, Canada, 13–17 March 2017; pp. 429–438. [Google Scholar]
- He, H.; Dong, B.; Zheng, Q.; Di, D.; Lin, Y. Visual Analysis of the Time Management of Learning Multiple Courses in Online Learning Environment. In Proceedings of the 2019 IEEE Visualization Conference (VIS), Vancouver, BC, Canada, 20–25 October 2019; IEEE: New York, NY, USA, 2019; pp. 56–60. [Google Scholar]
- Mohseni, Z.; Martins, R.M.; Masiello, I. SBGTool: Similarity-Based Grouping Tool for Students’ Learning Outcomes. In Proceedings of the 2021 Swedish Workshop on Data Science (SweDS), Växjö, Sweden, 2–3 December 2021; IEEE: New York, NY, USA, 2021; pp. 1–7. [Google Scholar]
- Mohseni, Z.; Martins, R.M.; Masiello, I. SAVis: A Learning Analytics Dashboard with Interactive Visualization and Machine Learning. In Proceedings of the Nordic Learning Analytics (Summer) Institute 2021, KTH Royal Institute of Technology, Stockholm, Sweden, 23 August 2021; School of Electrical Engineering and Computer Science: Stockholm, Sweeden, 2021; p. 2985. [Google Scholar]
- Kippers, W.B.; Poortman, C.L.; Schildkamp, K.; Visscher, A.J. Data literacy: What do educators learn and struggle with during a data use intervention? Stud. Educ. Eval. 2018, 56, 21–31. [Google Scholar] [CrossRef]
- Fitzpatrick, G. A short history of human computer interaction: A people-centred perspective. In Proceedings of the 2018 ACM SIGUCCS Annual Conference, Orlando, FL, USA, 7–10 October 2018; Association for Computing Machinery: New York, NY, USA, 2018; p. 3. [Google Scholar]
- Giacomin, J. What is human centred design? Des. J. 2014, 17, 606–623. [Google Scholar] [CrossRef]
- Charmaz, K. Constructing Grounded Theory: A Practical Guide through Qualitative Analysis; Sage Publications: Thousand Oaks, CA, USA, 2006. [Google Scholar]
- Crotty, M.J. The Foundations of Social Research: Meaning and Perspective in the Research Process; Sage Publications: Thousand Oaks, CA, USA, 1998; Chapter 1. [Google Scholar]
- Richardson, L.; Pierre, E. Writing: A method for inquiry. In Handbook of Qualitative Research, 3rd ed.; Sage Publications: Thousand Oaks, CA, USA, 2005; pp. 959–978. [Google Scholar]
- Blomberg, J.; Giacomi, J.; Mosher, A.; Swenton-Wall, P. Ethnographic field methods and their relation to design. In Participatory Design; CRC Press: Boca Raton, FL, USA, 2017; pp. 123–155. [Google Scholar]
- Bodker, K.; Kensing, F.; Simonsen, J. Participatory IT Design: Designing for Business and Workplace Realities; MIT Press: Cambridge, MA, USA, 2009. [Google Scholar]
- Holtzblatt, K.; Beyer, H. Contextual Design: Defining Customer-Centered Systems; Elsevier: Amsterdam, The Netherlands, 1997. [Google Scholar]
- Dix, A. Theoretical analysis and theory creation. In Research Methods in Human-Computer Interaction; Cambridge University Press: Cambridge, UK, 2008; pp. 175–195. [Google Scholar]
- Dourish, P. Responsibilities and implications: Further thoughts on ethnography and design. In Proceedings of the 2007 Conference on Designing for User Experiences, Paris, France, 28–31 July 2007; Association for Computing Machinery: New York, NY, USA, 2007; pp. 2–16. [Google Scholar]
- Danielsson, K.; Wiberg, C. Participatory design of learning media: Designing educational computer games with and for teenagers. Interact. Technol. Smart Educ. 2006, 3, 275–291. [Google Scholar] [CrossRef]
- Holstein, K.; McLaren, B.M.; Aleven, V. Co-designing a real-time classroom orchestration tool to support teacher–AI complementarity. J. Learn. Anal. 2019, 6, 27–52. [Google Scholar] [CrossRef]
- Sedlmair, M.; Meyer, M.; Munzner, T. Design study methodology: Reflections from the trenches and the stacks. IEEE Trans. Vis. Comput. Graph. 2012, 18, 2431–2440. [Google Scholar] [CrossRef]
- Dimitriadis, Y.; Martínez-Maldonado, R.; Wiley, K. Human-centered design principles for actionable learning analytics. In Research on E-Learning and ICT in Education: Technological, Pedagogical and Instructional Perspectives; Springer: Berlin/Heidelberg, Germany, 2021; pp. 277–296. [Google Scholar]
- Smith, Q. Prototyping User Experience; I: UXmatters: Boulder Creek, CA, USA, 2019. [Google Scholar]
- Collins, A.; Joseph, D.; Bielaczyc, K. Design research: Theoretical and methodological issues. In Design-Based Research; Psychology Press: London, UK, 2016; pp. 15–42. [Google Scholar]
- Bubenko, J.A. Challenges in requirements engineering. In Proceedings of the 1995 IEEE International Symposium on Requirements Engineering (RE’95), York, UK, 27–29 March 1995; IEEE: New York, NY, USA, 1995; pp. 160–162. [Google Scholar]
- Rudd, J.; Stern, K.; Isensee, S. Low vs. high-fidelity prototyping debate. Interactions 1996, 3, 76–85. [Google Scholar] [CrossRef]
- Mohseni, Z.; Martins, R.M.; Nordmark, S.; Masiello, I. Visual Learning Analytics for Educational Interventions in Primary, Lower and Upper Secondary Schools: A Scoping Review. Under review.
- Viberg, O.; Gronlund, A. Desperately seeking the impact of learning analytics in education at scale: Marrying data analysis with teaching and learning. In Online Learning Analytics; Auerbach Publications: Boca Raton, FL, USA, 2021. [Google Scholar]
- Tan, J.P.L.; Koh, E.; Jonathan, C.; Yang, S. Learner Dashboards a Double-Edged Sword? Students’ Sense Making of a Collaborative Critical Reading and Learning Analytics Environment for Fostering 21st-Century Literacies. J. Learn. Anal. 2017, 4, 117–140. [Google Scholar] [CrossRef]
- Ez-Zaouia, M.; Tabard, A.; Lavoué, E. PROGDASH: Lessons Learned from a Learning Dashboard in-the-wild. In Proceedings of the 12th International Conference on Computer Supported Education-Volume 2: CSEDU, Virtual Event, 2–4 May 2020. [Google Scholar]
- Hege, I.; Kononowicz, A.A.; Adler, M. A clinical reasoning tool for virtual patients: Design-based research study. JMIR Med. Educ. 2017, 3, e8100. [Google Scholar] [CrossRef] [PubMed]
- McGrath, C.; Åkerfeldt, A. Educational technology (EdTech): Unbounded opportunities or just another brick in the wall? In Digital Transformation and Public Services; Routledge: New York, NY, USA, 2019; pp. 143–157. [Google Scholar]
- Liu, L.; Johnson, D.L. Assessing student learning in instructional technology: Dimensions of a learning model. Comput. Sch. 2001, 18, 79–95. [Google Scholar] [CrossRef]
- Molenaar, I.; Knoop-van Campen, C.A. How teachers make dashboard information actionable. IEEE Trans. Learn. Technol. 2018, 12, 347–355. [Google Scholar] [CrossRef]
- Confrey, J.; Toutkoushian, E.; Shah, M. A validation argument from soup to nuts: Assessing progress on learning trajectories for middle-school mathematics. Appl. Meas. Educ. 2019, 32, 23–42. [Google Scholar] [CrossRef]
- Hoyles, C. Transforming the mathematical practices of learners and teachers through digital technology. Res. Math. Educ. 2018, 20, 209–228. [Google Scholar] [CrossRef]
- Svela, A.; Nouri, J.; Viberg, O.; Zhang, L. A systematic review of tablet technology in mathematics education. Int. J. Interact. Mob. Technol. 2019, 13, 139–158. [Google Scholar] [CrossRef]
- Rosmansyah, Y.; Kartikasari, N.; Wuryandari, A.I. A learning analytics tool for monitoring and improving students’ learning process. In Proceedings of the 2017 6th International Conference on Electrical Engineering and Informatics (ICEEI), Langkawi, Malaysia, 25–27 November 2017; IEEE: New York, NY, USA, 2017; pp. 1–5. [Google Scholar]
- Vieira, C.; Parsons, P.; Byrd, V. Visual learning analytics of educational data: A systematic literature review and research agenda. Comput. Educ. 2018, 122, 119–135. [Google Scholar] [CrossRef]
- Sefelin, R.; Tscheligi, M.; Giller, V. Paper prototyping-what is it good for? A comparison of paper-and computer-based low-fidelity prototyping. In CHI’03 Extended Abstracts on Human Factors in Computing Systems; Association for Computing Machinery: New York, NY, USA, 2003; pp. 778–779. [Google Scholar]
- Tao, D.; Or, C. A paper prototype usability study of a chronic disease self-management system for older adults. In Proceedings of the 2012 IEEE International Conference on Industrial Engineering and Engineering Management, Hong Kong, China, 10–13 December 2012; IEEE: New York, NY, USA, 2012; pp. 1262–1266. [Google Scholar]
- Delgado, A.J.; Wardlow, L.; McKnight, K.; O’Malley, K. Educational technology: A review of the integration, resources, and effectiveness of technology in k-12 classrooms. J. Inf. Technol. Educ. Res. 2015, 14, 397–416. [Google Scholar] [CrossRef]
- Farjon, D.; Smits, A.; Voogt, J. Technology integration of pre-service teachers explained by attitudes and beliefs, competency, access, and experience. Comput. Educ. 2019, 130, 81–93. [Google Scholar] [CrossRef]
- Moores, E.; Birdi, G.K.; Higson, H.E. Determinants of university students’ attendance. Educ. Res. 2019, 61, 371–387. [Google Scholar] [CrossRef]
- Chen, Y.; Chen, Q.; Zhao, M.; Boyer, S.; Veeramachaneni, K.; Qu, H. DropoutSeer: Visualizing learning patterns in Massive Open Online Courses for dropout reasoning and prediction. In Proceedings of the 2016 IEEE Conference on Visual Analytics Science and Technology (VAST), Baltimore, MD, USA, 23–28 October 2016; IEEE: New York, NY, USA, 2016; pp. 111–120. [Google Scholar]
- Charleer, S.; Klerkx, J.; Duval, E.; De Laet, T.; Verbert, K. Creating effective learning analytics dashboards: Lessons learnt. In Proceedings of the Adaptive and Adaptable Learning: 11th European Conference on Technology Enhanced Learning, EC-TEL 2016, Lyon, France, 13–16 September 2016; Springer International Publishing: New York, NY, USA, 2016; pp. 42–56. [Google Scholar]
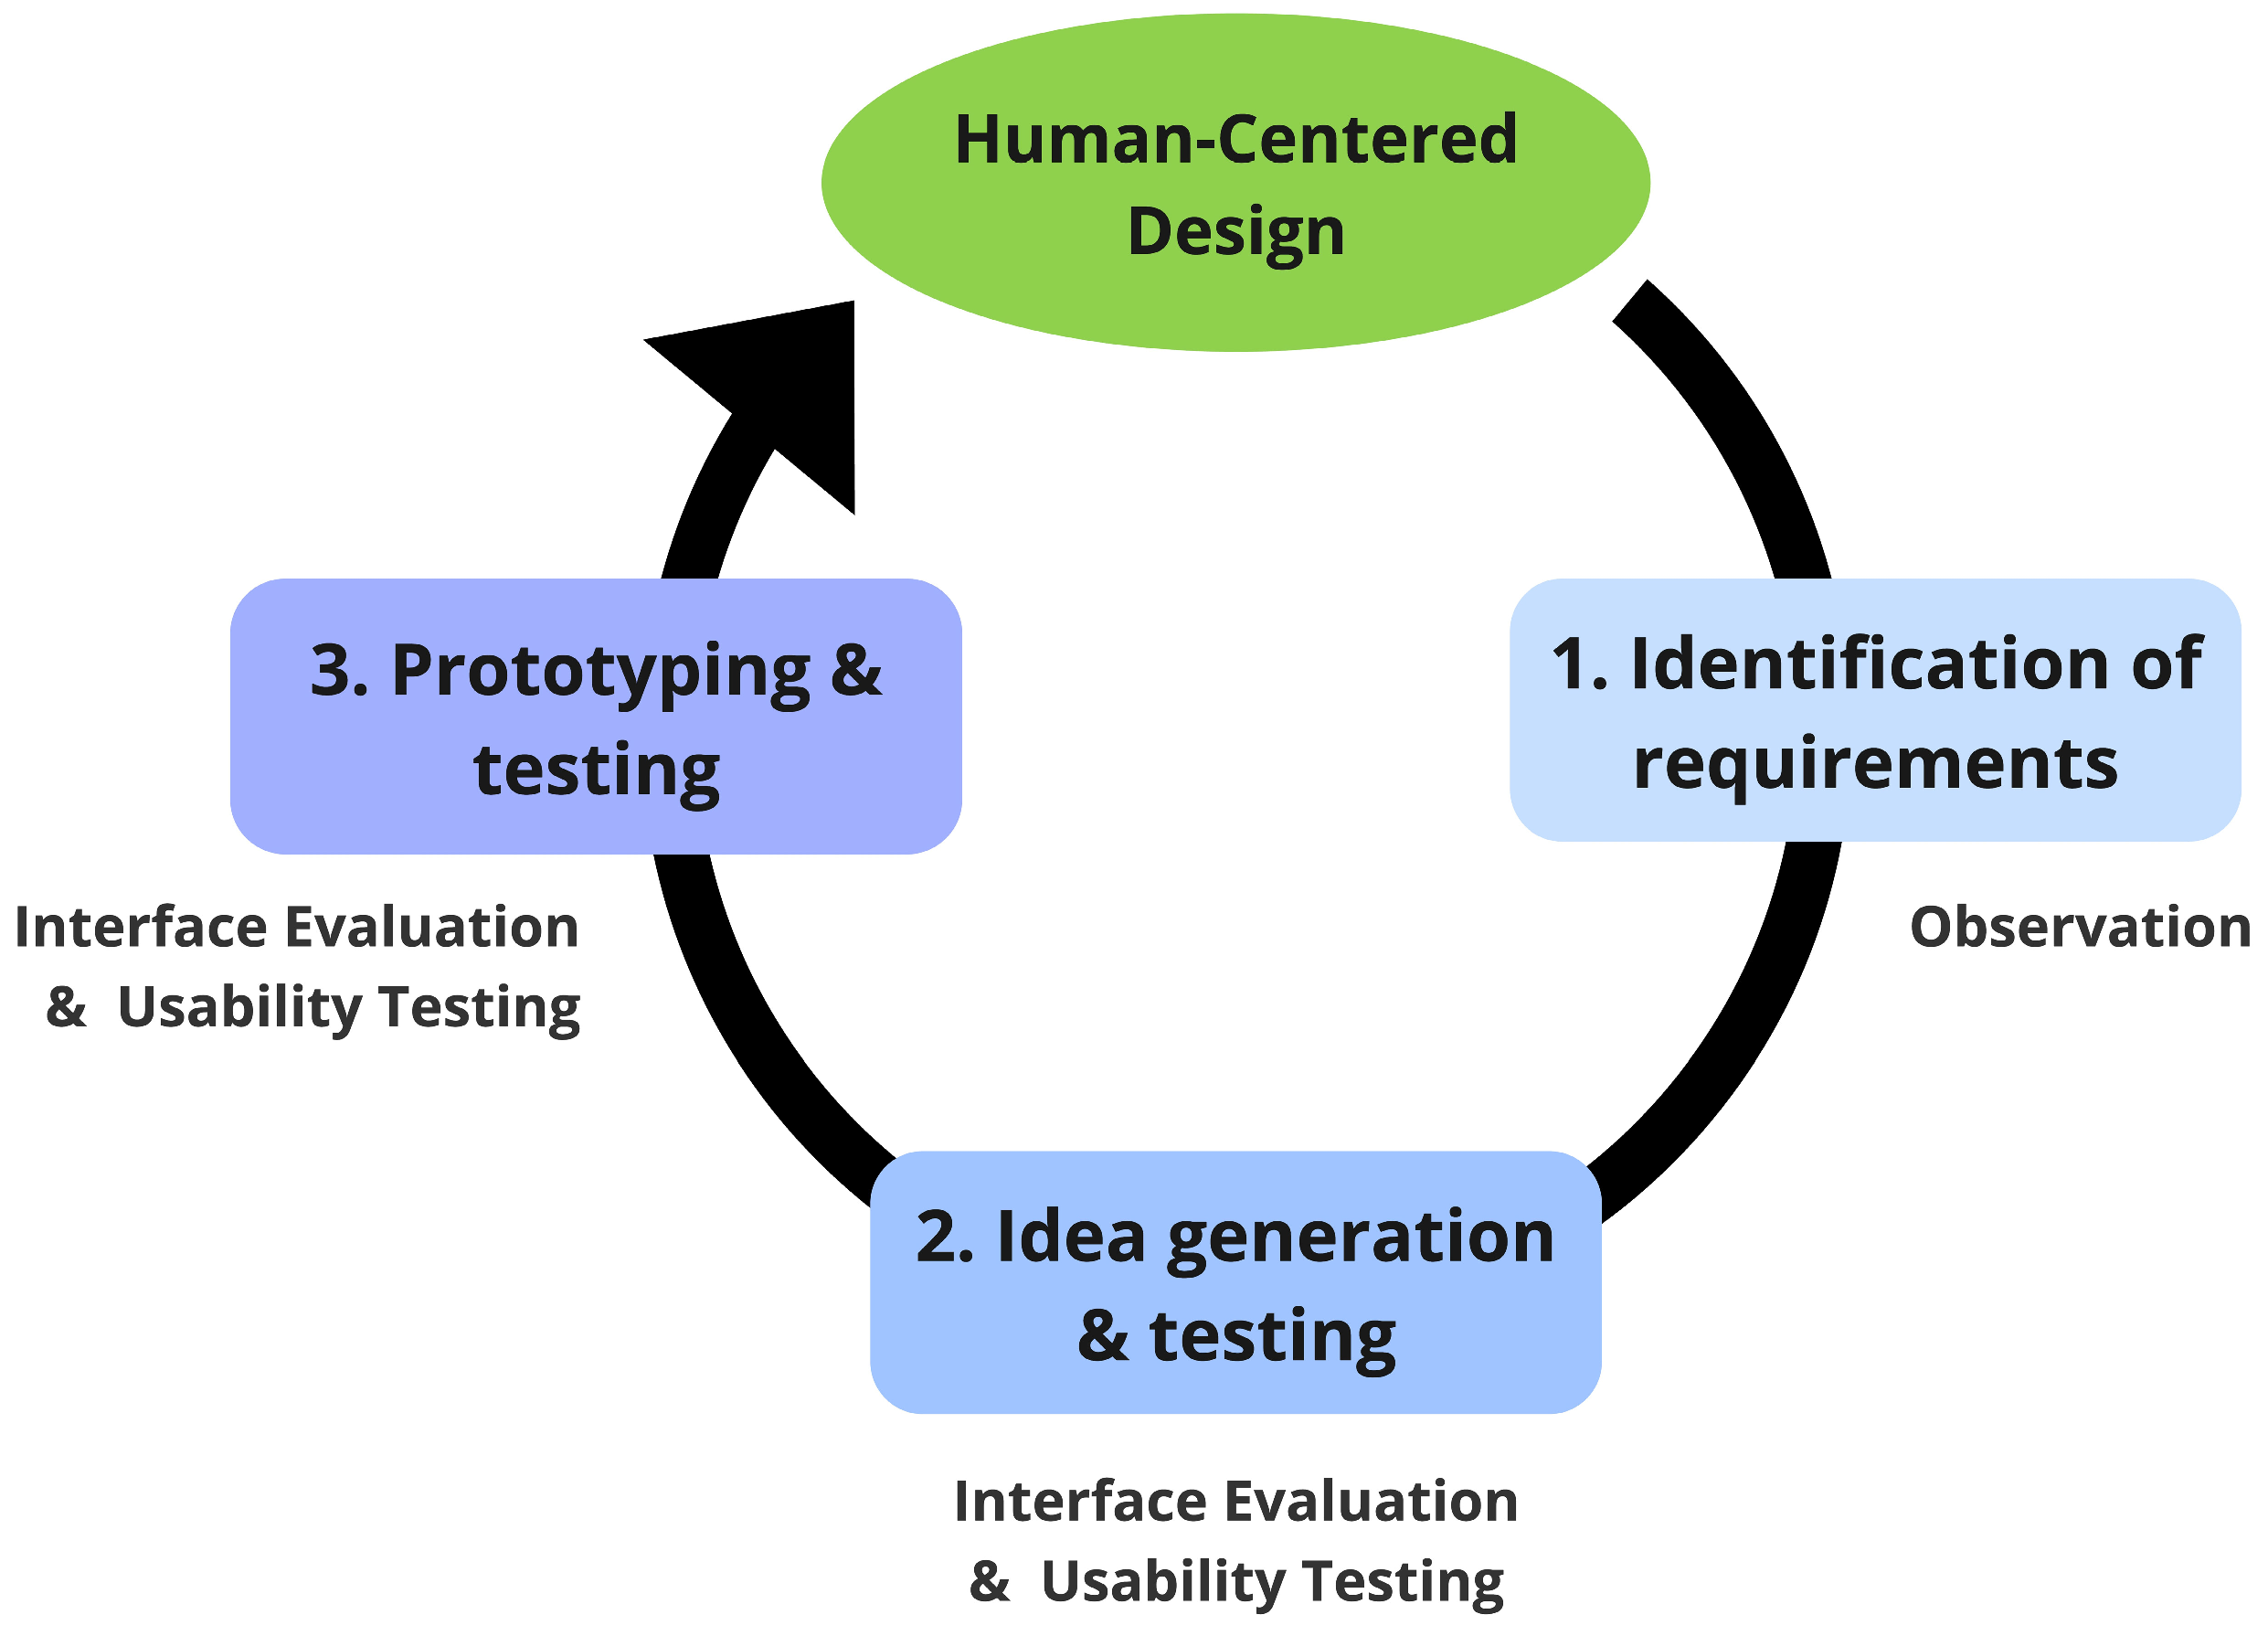
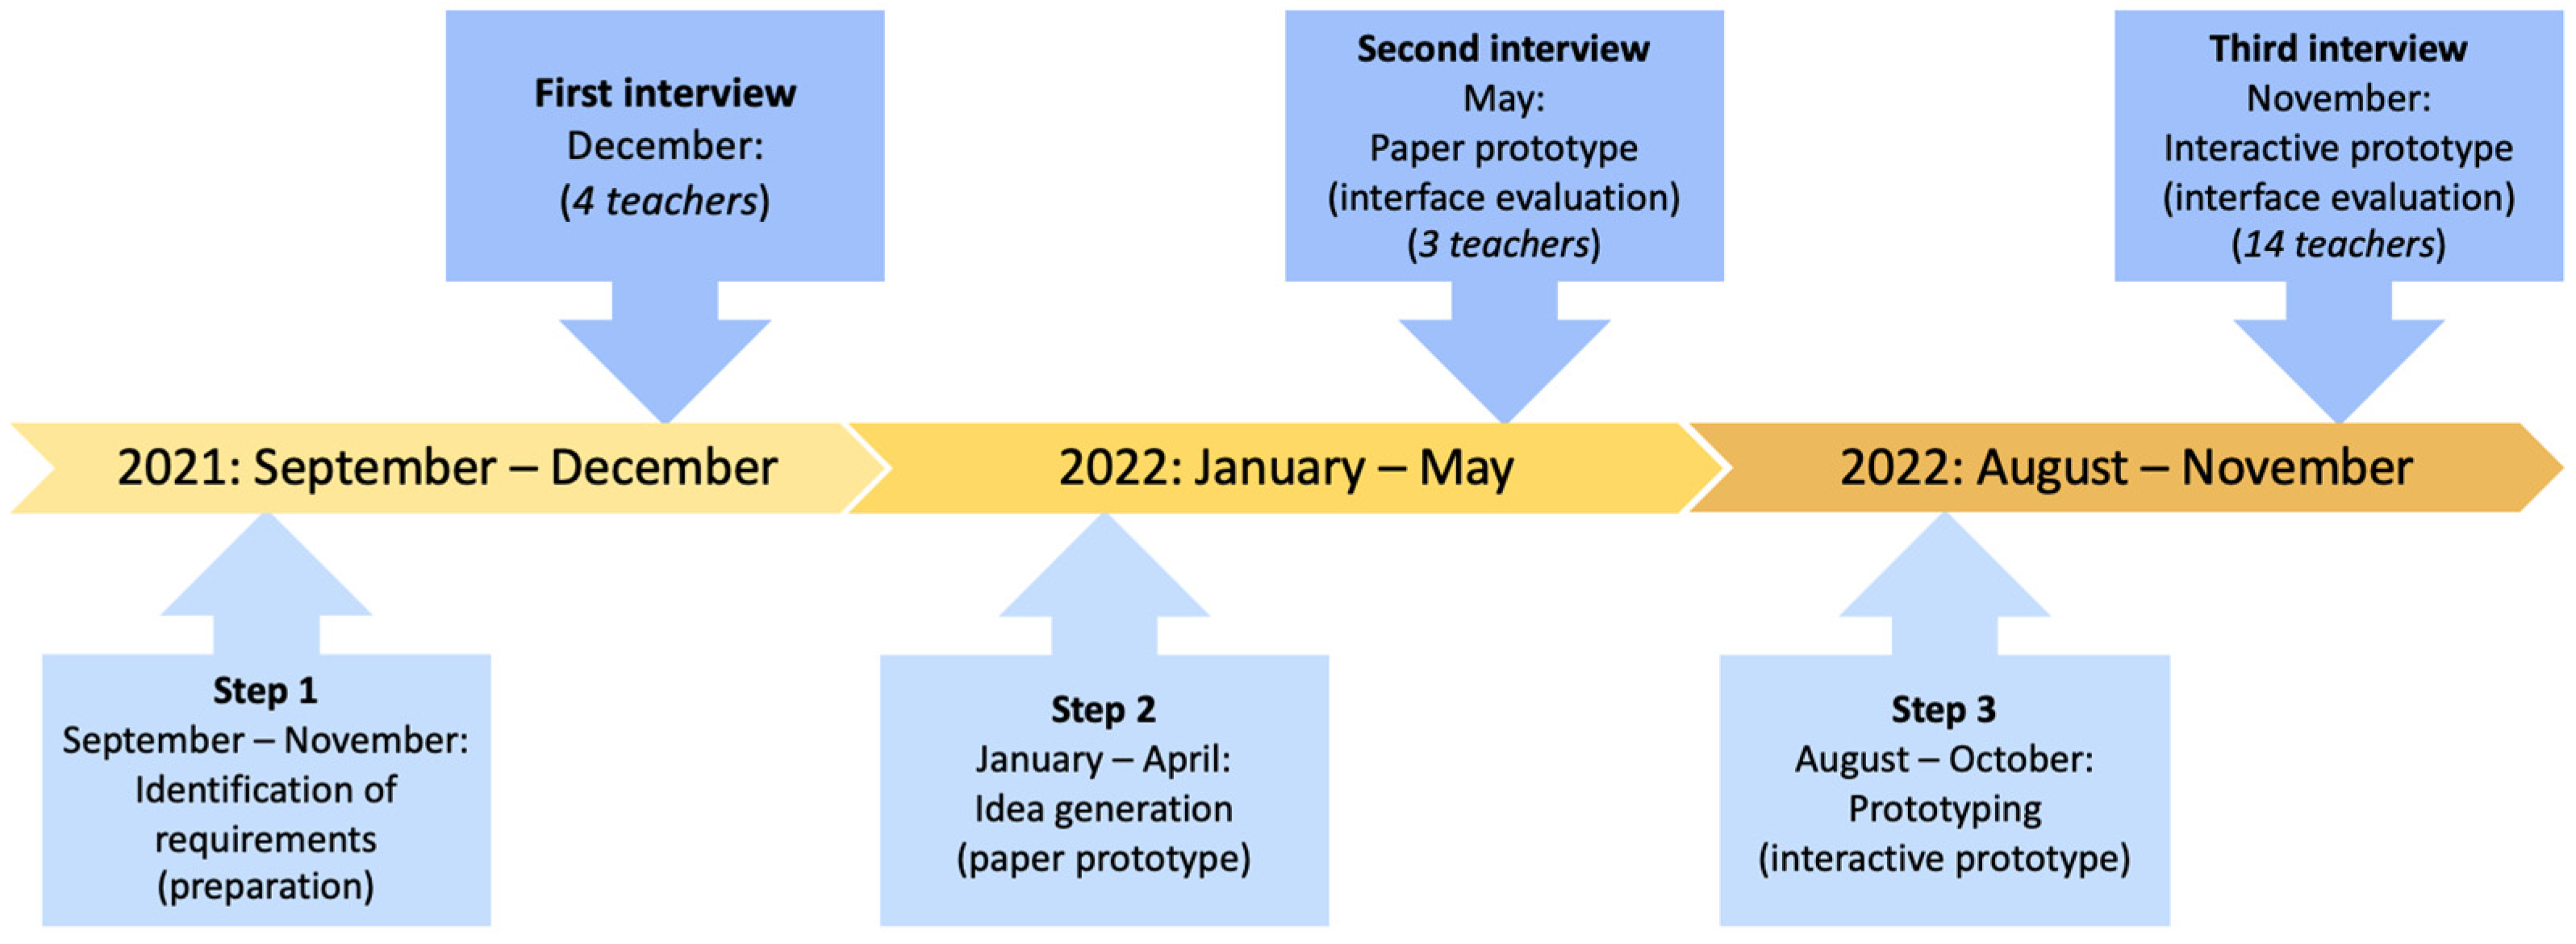
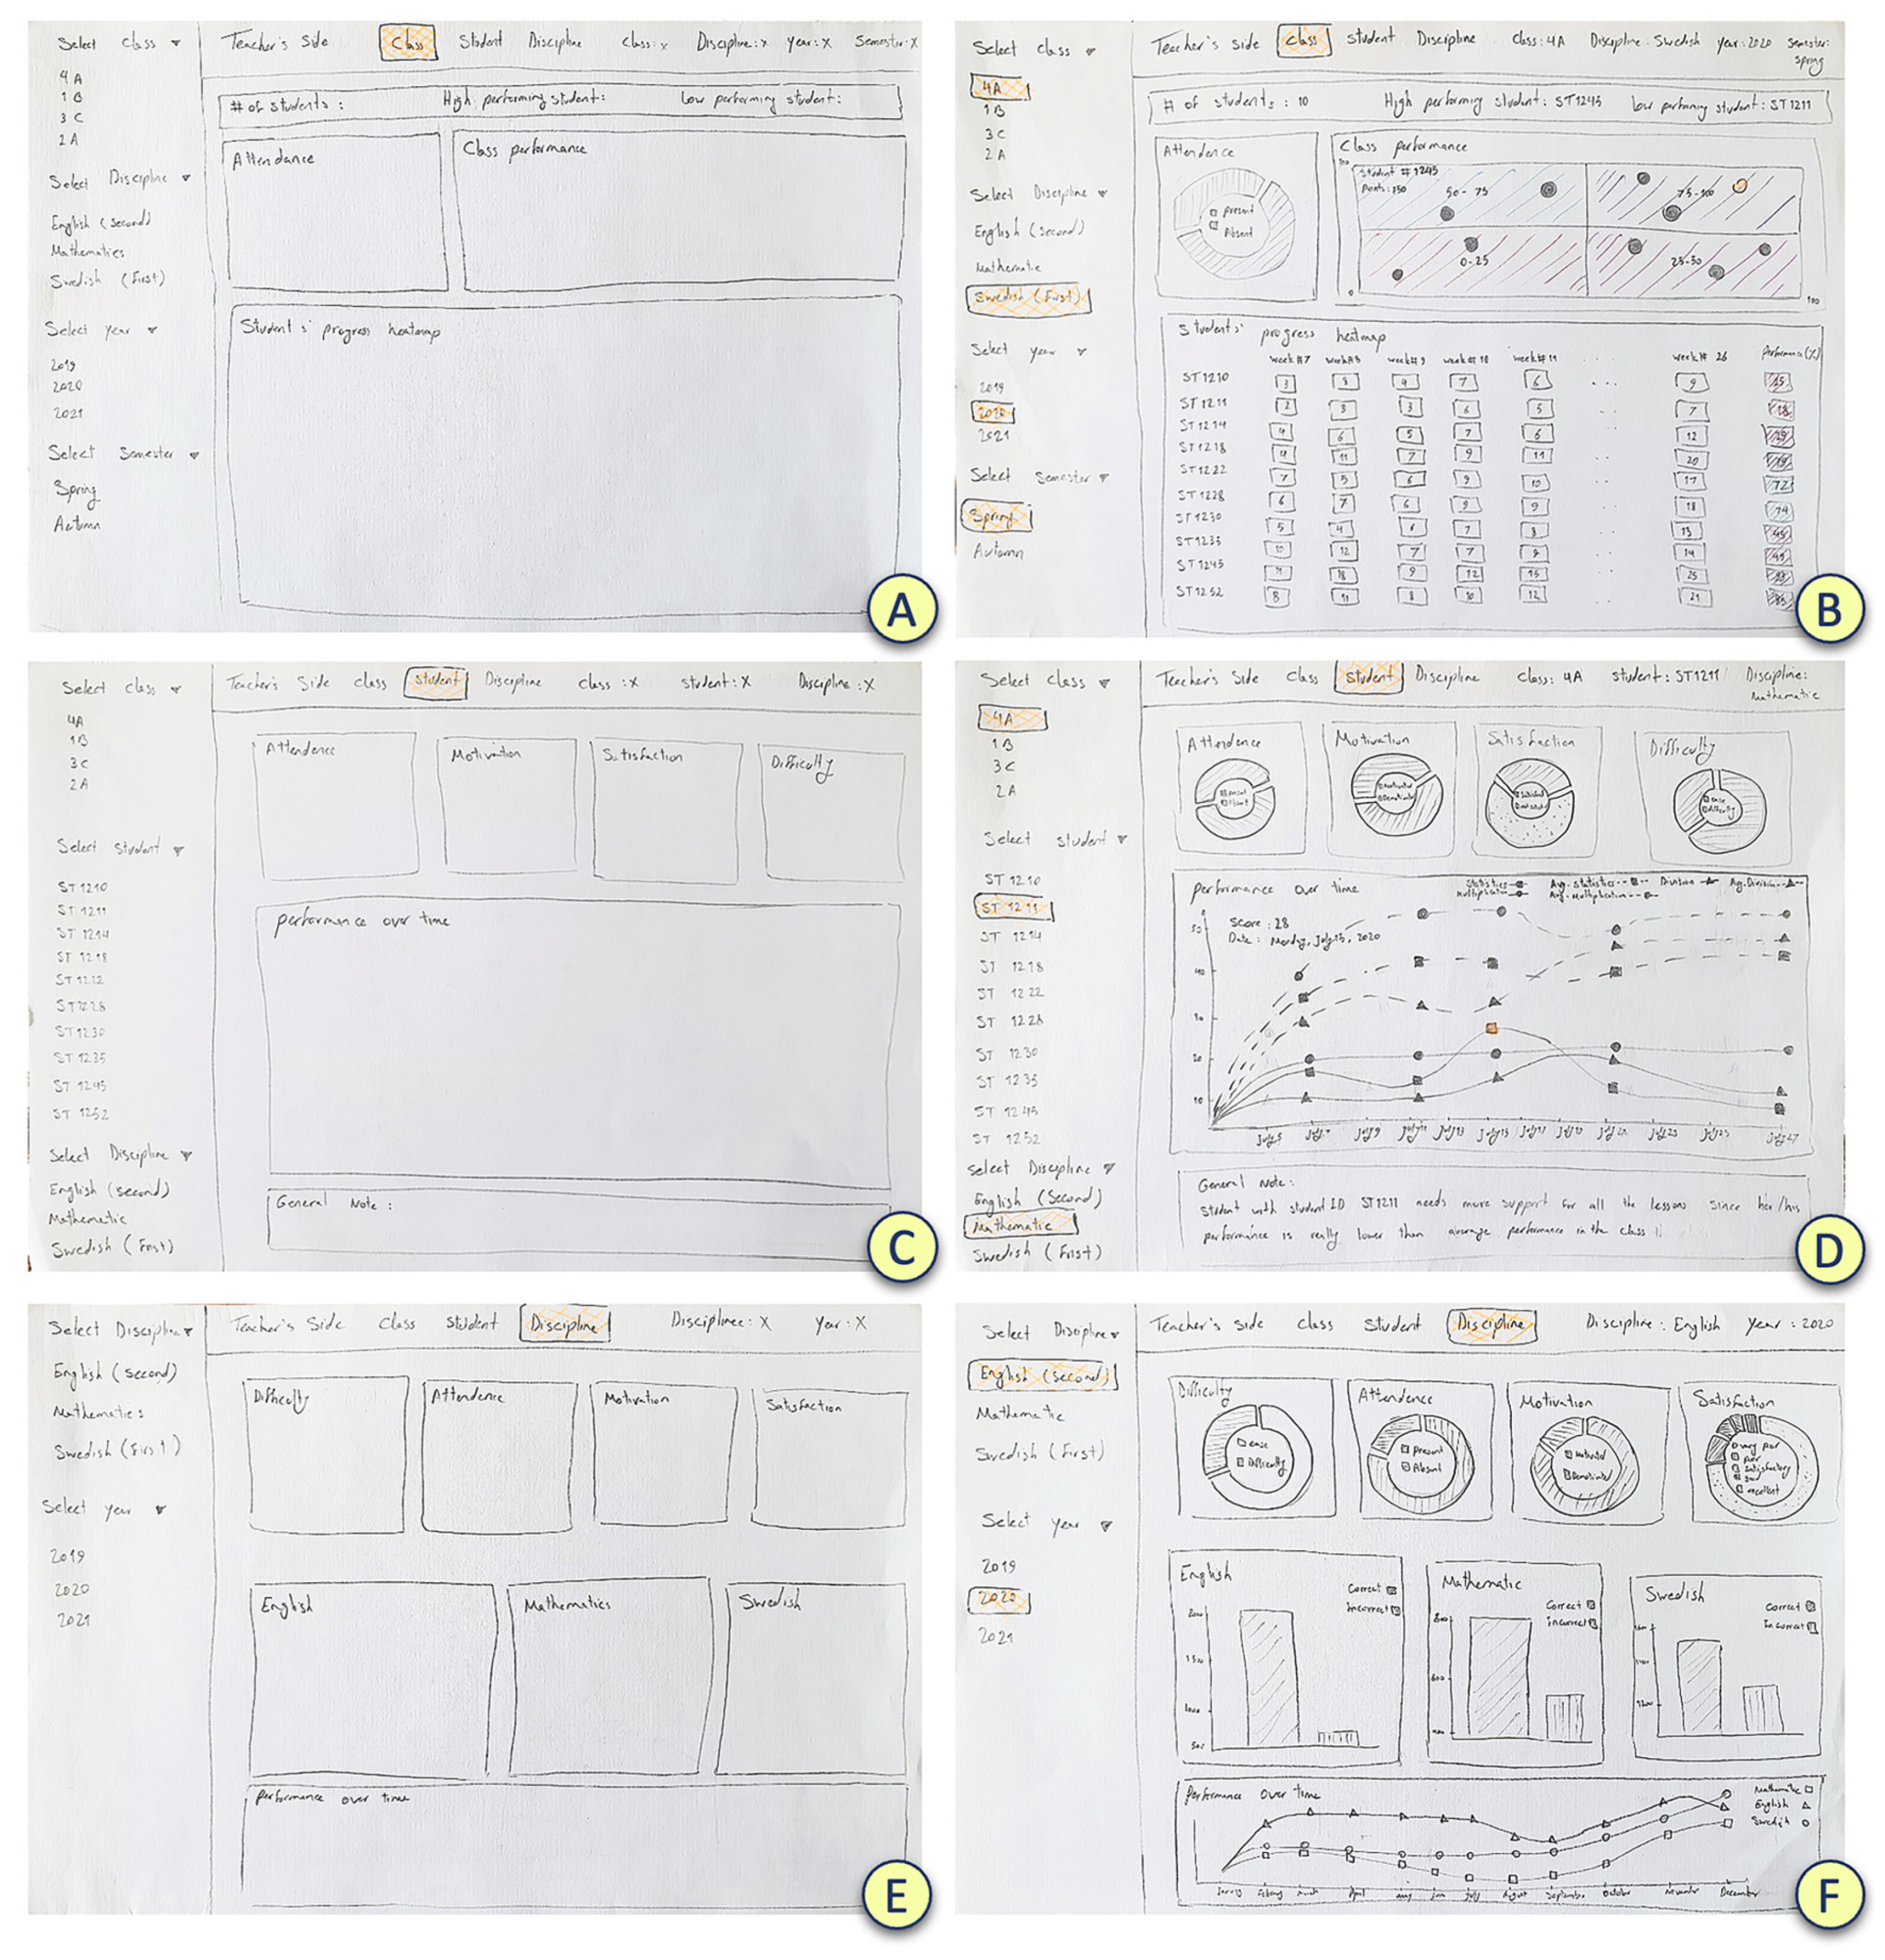
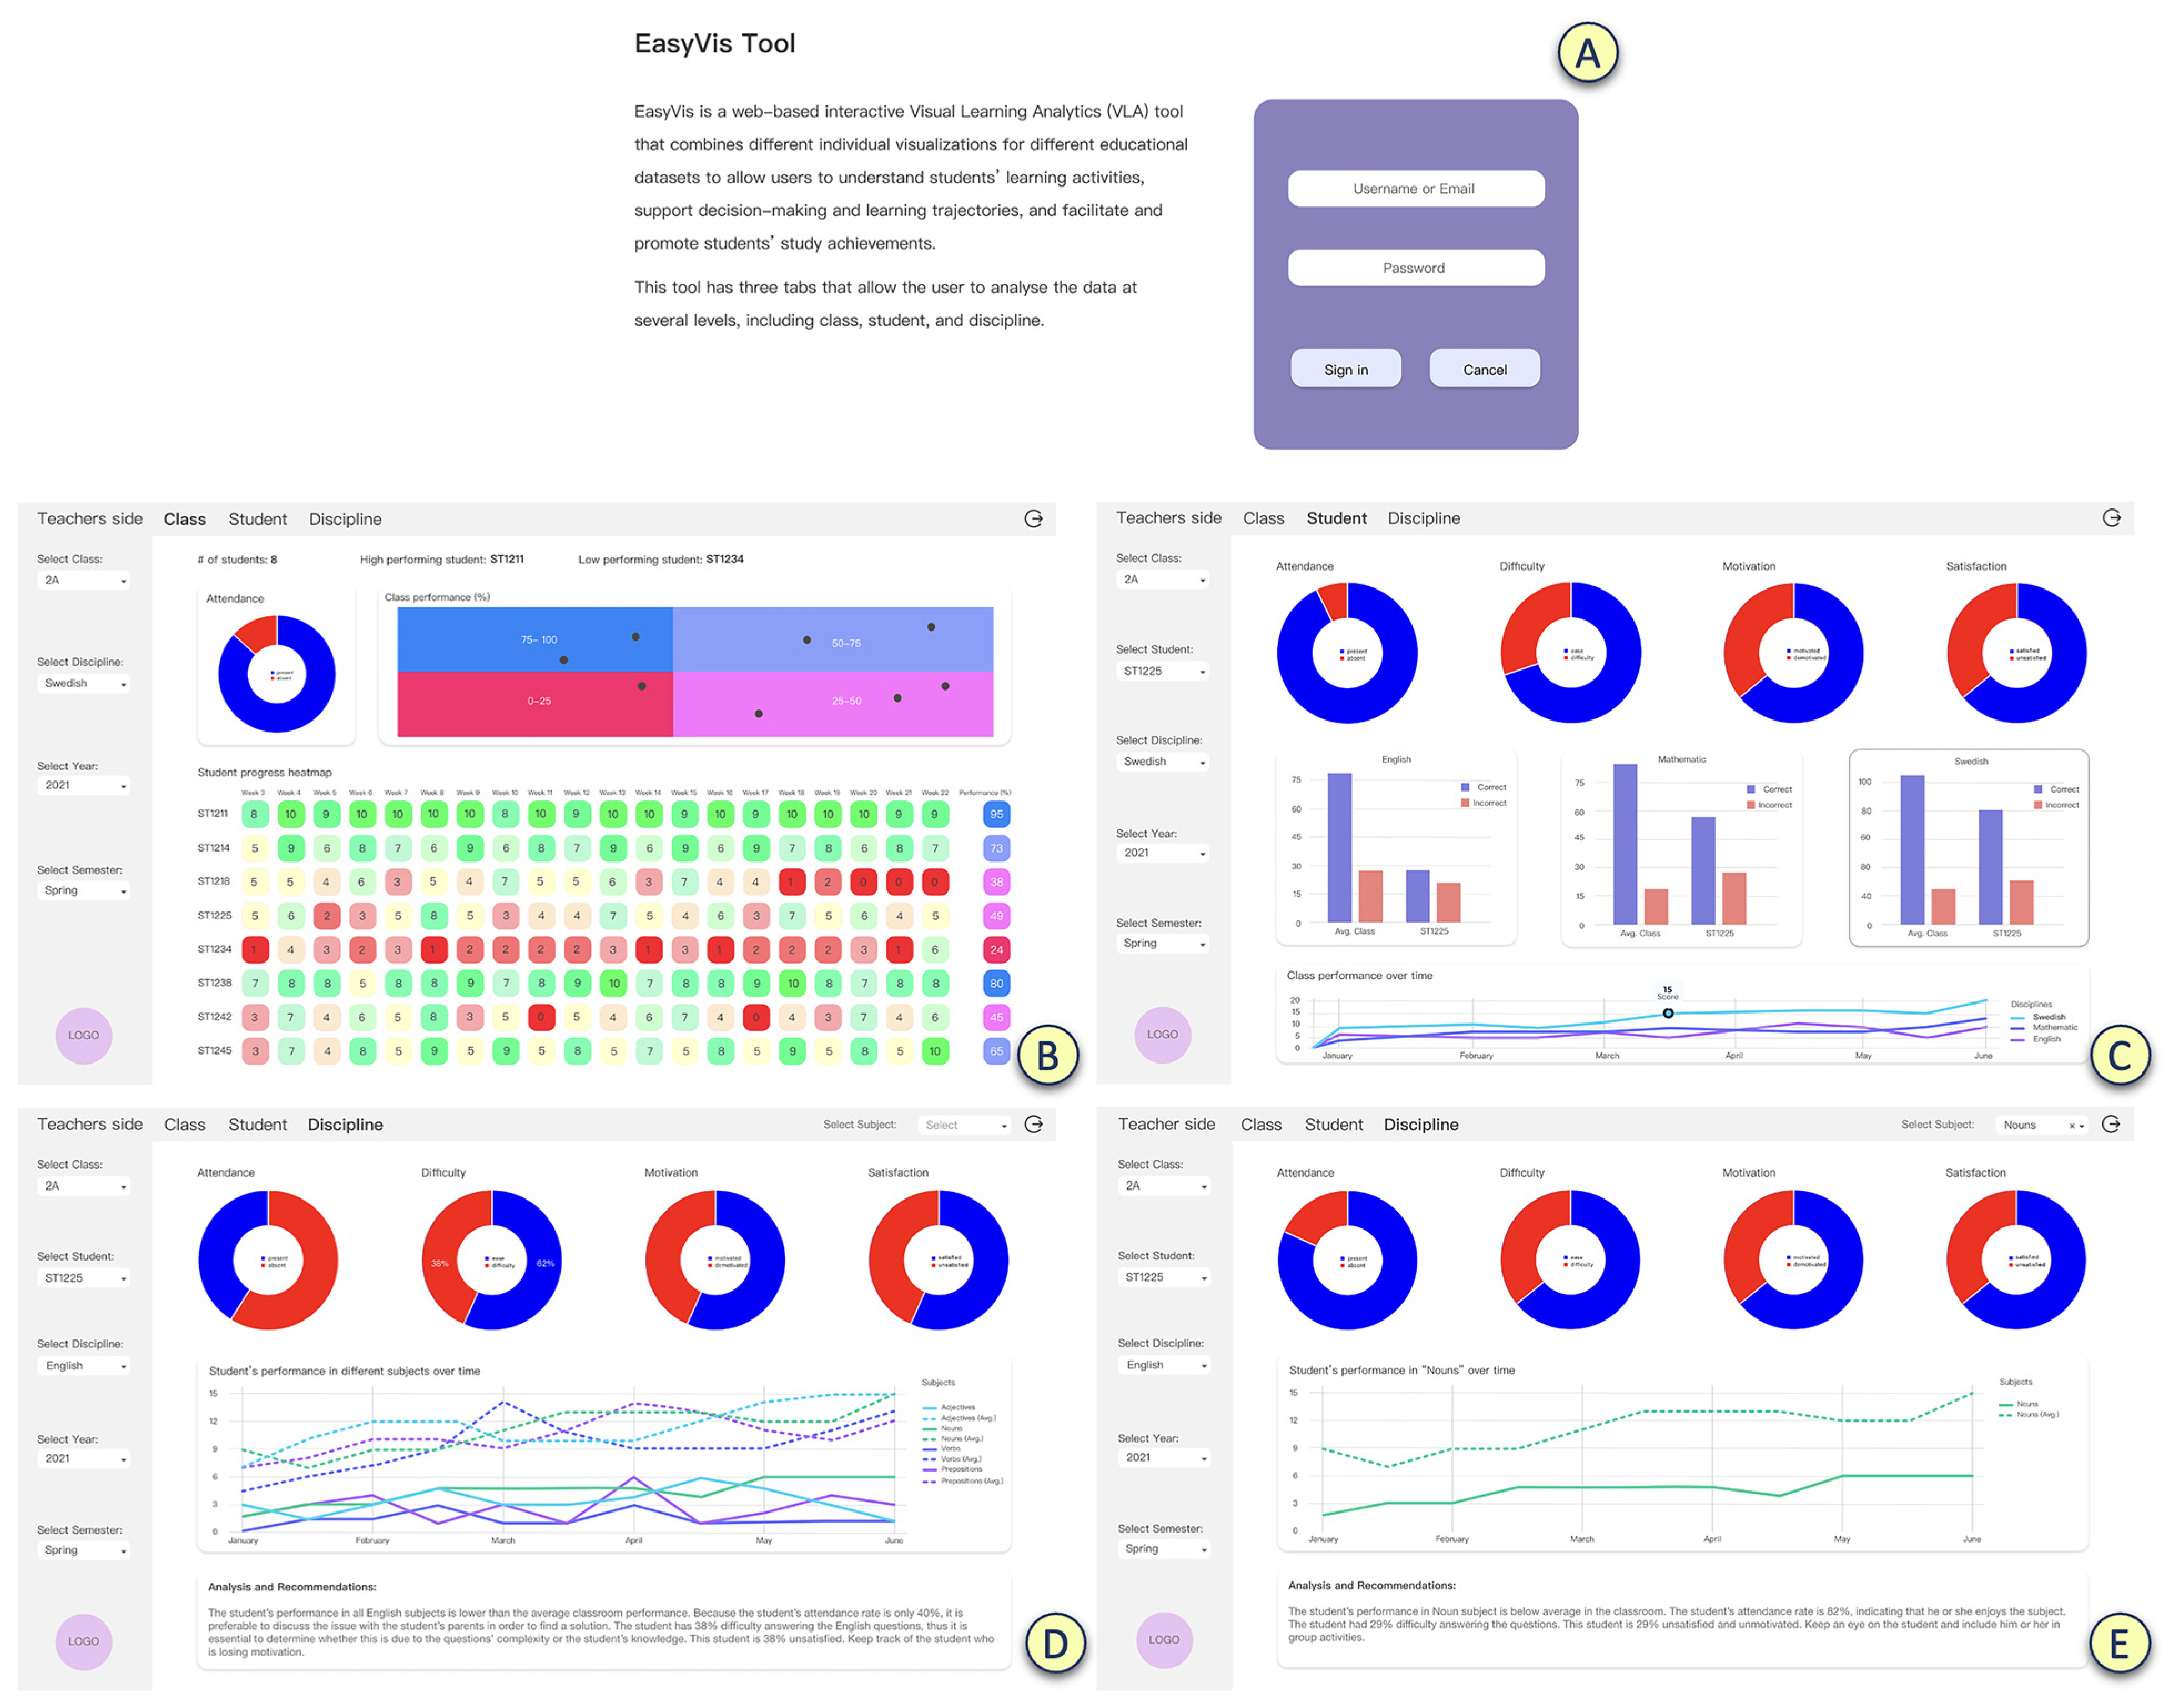
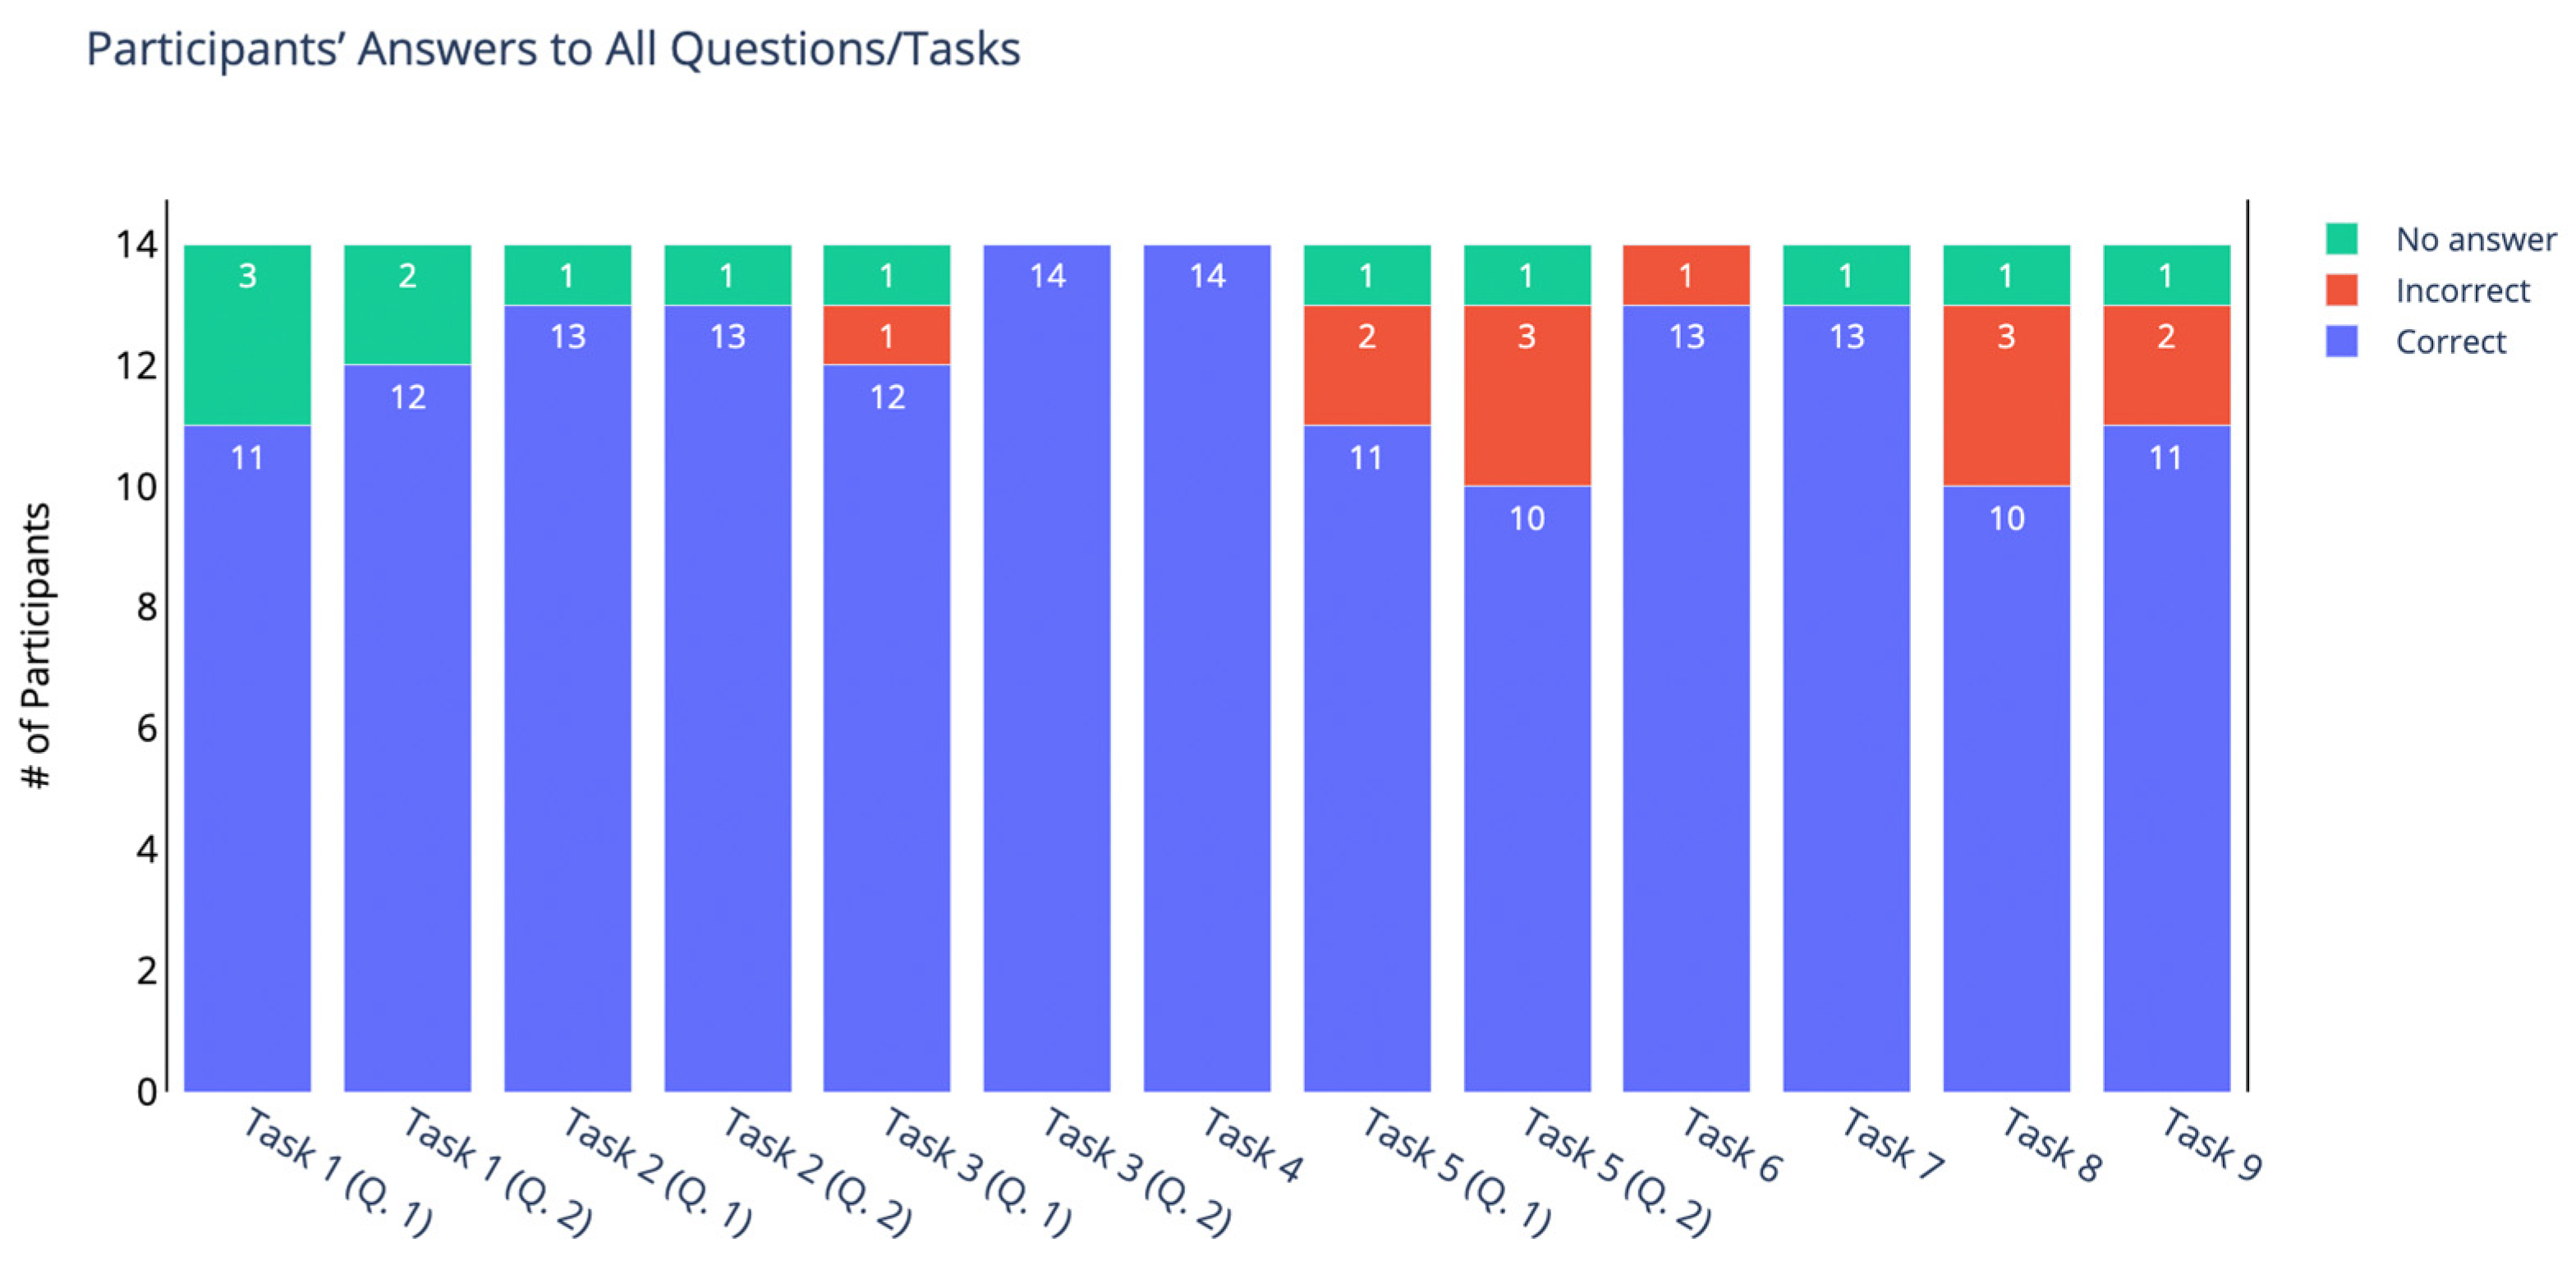
Disclaimer/Publisher’s Note: The statements, opinions and data contained in all publications are solely those of the individual author(s) and contributor(s) and not of MDPI and/or the editor(s). MDPI and/or the editor(s) disclaim responsibility for any injury to people or property resulting from any ideas, methods, instructions or products referred to in the content. |
© 2023 by the authors. Licensee MDPI, Basel, Switzerland. This article is an open access article distributed under the terms and conditions of the Creative Commons Attribution (CC BY) license (https://creativecommons.org/licenses/by/4.0/).