Abstract
Objective: Our goal was to analyze the effects of implementing problem-based learning (PBL) at the Azerbaijan University of Architecture and Construction. Method: We compared students that attended lectures and tutorials using PBL and students that attended lectures and tutorials using traditional teaching methods. In total, 737 students (intervention group) participated in PBL and 2201 in non-PBL (Control group A and Control group B) at the university. Descriptive statistics and a statistical Kruskal–Wallis test were used to analyze the data and determine whether groups could be compared. We used propensity score matching to make groups comparable and analyzed the differences between groups. Results: The results of the statistical analysis and descriptive statistical characteristics for the unmatched samples are presented in this paper. We also present the differences between the PBL group and two non-PBL groups based on the unmatched samples. All calculations were performed on one outcome measure: the final scores of students. The results show that even within a short period of time (one semester or academic year), applying PBL can have promising effects, although these effects are generally not statistically significant. However, after matching, the differences between the PBL and non-PBL groups were significant. Discussion and conclusions: Even a preliminary and limited introduction of PBL appears to have promising impacts on learning outcomes, as demonstrated by students’ final scores on subjects that were taught using the PBL approach. The results suggest that post-Soviet countries with education traditions that differ from Western ones can benefit from PBL. It is advised to prolong the implementation of PBL and advocate for wider dissemination of this method in Azerbaijan and elsewhere in post-Soviet countries.
1. Introduction
After the dissolution of the Soviet Union, the postsocialist countries of Eastern Europe, the Caucasus, and Central Asia began a strategic journey to move from a socialist past to a Western European future. In this journey, education was a mirror, a driver, and a reflection of this drastic transformation and played a major role in the Europeanization, democratization, and market-orientated globalization of the region [1]. As part of this process, international educational tests (Participation in the International Program of Assessment of Educational Achievements (PISA), The Trends in International Mathematics and Science Study (TIMSS), etc.) that serve as measures of national educational quality and benchmarks to develop assessment instruments were also implemented in these countries [2,3,4,5,6]. However, the results of these international tests were not always favorable for ex-Soviet countries. Azerbaijan is not an exemption. For example, PISA results among Azerbaijan pupils demonstrate that progress is being made in the formation of modern competencies, such as creative thinking, independent problem-solving, teamwork, inquisitiveness, intercultural skills, and individual initiative, while some lower scores are still observed [7]. In Azerbaijan, the government has attempted to handle this issue from different sides of the policy spectrum to maximize results [8]. Like any other policy change, these policies will take time to have a real effect on learning outcomes and pupils’ knowledge and skills.
European integration has also become a pillar of higher education development. However, Azerbaijan faces challenges similar to those in other postsocialist countries. The education system and practices in this country have shown considerable path dependence, with teachers continuing to teach and leaders continuing to lead as they did in the Soviet era [1]. The state program on reforms in the higher education system of the Republic of Azerbaijan during the period of 2009–2013 aimed to address these challenges [9]. One of the main challenges is that teaching is primarily based on lectures, which only involve explaining theory. Practical lessons based on an experimental and analytical approaches, laboratory work, problem-based and project-based teaching combined with research work, and exploring real problems and cases are only minor portions of the curriculum and the teaching activities of academic staff members. This traditional teaching model in Azerbaijani universities, among others, does not facilitate interactions between lecturers and students or between students and other students in the educational process. Moreover, top university management pays very little attention to this problem when designing course content and organization. Interactive lessons are not very common, as traditional lectures are still perceived as the main form of teaching and learning. The average age of members in the academic community at most universities is around 65 years (https://www.stat.gov.az/menu/7/?lang=en (accessed on 22 July 2023)). The willingness to change and the ability to implement new methods among academic and administrative staff members varies widely between universities and mainly depends on individual attitudes. Most tutors were educated and grew up in the era of the Soviet Union, when changes and initiatives were not easily accepted or stimulated. It also highly depends on the nature of the proposed changes, the encouragement and motivation to change, and the institutional culture (which is frequently quite traditional). For faculty members, tenured professors, who have established their teaching methods and research agendas many years ago (especially taking into account that some subjects are fundamental ones), may exhibit resistance to changes that they perceive as disruptive and burdensome.
All the reasons mentioned above contribute to difficulties in the implementation of more modern teaching methods, as novel methods typically require a willingness to change and adapt, as well as specific training, which are not generally part of the culture of education [10]. Thus, the research team analyzed the literature to find modern learning approaches to suggest solutions for solving these issues [11]. The previous literature has shown that one of the modern approaches that can be applied in successfully reforming higher education from a more theoretical to a more practical model is PBL [12,13,14,15]. Also, the previous literature has shown that PBL can be effective in teaching medical courses, natural sciences, mathematics, and engineering [12,13,14,15]. For example, some literature reviews indicated that PBL can be effective in studying mathematics in both elementary and higher education [12]. This literature review also emphasizes some challenges in applying PBL in these areas, such as designing the proper assessment criteria. Addressing these areas can contribute to a more comprehensive understanding of how PBL can be effectively implemented in mathematics education (but not only in medical and health sciences). Another literature review [13] highlights the ongoing debate and uncertainty regarding the effectiveness of PBL in medical and dental education. For example, applying PBL in some medical subjects can be challenging for both students and teachers. In summary, the results suggest that PBL has several advantages, including its flexibility, promotion of critical thinking and problem-solving skills, team work, creativity, and the perception of being an enjoyable learning method. However, it may have limitations in terms of assessing factual knowledge through traditional testing methods. The discrepancy in results between studies of the entire curriculum and single PBL interventions highlights the complexity of evaluating PBL’s effectiveness, with factors like assessment methods and the integration of PBL into the curriculum playing significant roles. Another systematic literature review [14] shows that PBL may offer advantages over traditional approaches (lecture-based teaching (LBL)) in surgical education, particularly in terms of clinical competence and student satisfaction. However, the authors emphasize the importance of additional research to validate these results and provide more robust evidence. In one critical review regarding the application of PBL in architectural studies, it is stated that practical studio work and cooperation with both educational and architectural experts are at the core of effectiveness [15]. PBL in architectural sciences has also been successfully applied at the University of Delft and the University of New Castle, Australia [15].
Based on the evidence from previous literature reviews, the Azerbaijan University of Architecture and Construction decided to modernize its teaching methods by introducing PBL in 2020. The PBL approach was selected as a pilot program, as it was deemed to fit the profile of the university, which is mainly oriented toward engineering and applied sciences (www.azmiu.edu.az (accessed on 22 July 2023)).
The aim of this paper is to assess the impact of PBL on academic performance compared with traditional teaching during the entire semester. We achieve this goal by assessing whether PBL increased the formative test scores or not. To assess the effects of the PBL pilot on exam scores, we used a quasi-experimental design with an intervention group (PBL group) and two control groups (non-PBL groups). Statistical analyses were performed using SPSS (https://www.ibm.com/products/spss-statistics (accessed on 22 July 2023)) and STATA software (https://www.stata.com/ (accessed on 22 July 2023)). We first compared the group of students with and without PBL teaching. Next, we used propensity score matching (PSM) to make the two groups more comparable by matching each student from the PBL group to a non-PBL student with similar characteristics.
The results of this study may provide lessons for other universities in Azerbaijan and other countries in the region with a similar heritage. In addition, the results may help suggest if in the post-Soviet countries where education traditions differ from those in Western countries could benefit from a wider implementation of PBL.
2. Methods
The participants in this pilot project include teachers (tutors) and students from the years 2020–2021.The tutors involved were employed in different faculties (schools) and departments (there are 7 faculties and 19 specialty departments at the university). The language of education also differed between participants (the university has three different language sectors: Azerbaijani, English, and Russian). Most of the instructors applied PBL at the bachelor’s level, but some of them also implemented it at the master’s level.
At the beginning, teachers were instructed to formalize their own PBL team of tutors. They were pioneers in this matter as, except for the info sessions, training, methodological materials from the research team, and some support from other members of the PBL group, no other help was provided [10]. The authors visited the university several times for face-to-face workshops. Additionally, seminars were organized online. Materials were mainly based on the open-access resources of Maastricht University.
2.1. The Intervention
The pilot intervention with the PBL approach in AzUAC started in the second semester of 2020 [10]. The tutors who wanted to engage in PBL received additional training: they had three workshops covering topics such as an introduction to problem-based learning (PBL), problem-based learning pillars, and PBL from a student’s perspective, as well as two trainings covering issues such as tips to make cases for PBL and strategies and techniques for effective problem-based learning. Tutors were trained for six weeks. For each course, we developed a unit book for students and a tutor instruction book. On average, each course consisted of 15 lectures and 15 tutorial cases. Each of the tutors tried to apply the main pillars of the PBL approach during their lessons. The PBL approach consisted of cases which were presented to students. In the prediscussion phase, students discussed the cases and derived learning goals for them. In this way, students worked individually. In the postdiscussion tutorial, students shared the answers they found in the learning goals. During this group discussion, they were encouraged to work as a team in order to formulate the most comprehensive answers. This is in accordance with the structure provided by Maastricht University. This process encourages active learning, self-directed inquiry, teamwork, and communication skills, making it a versatile approach to education across various fields and levels of study. In Appendix C, we provide some examples of the teaching materials of one of the courses taught in PBL for illustration.
2.2. Sample Characteristics
Our sample consisted of n = 737 students included in the first semester’s PBL program during the academic year 2020/2021; n = 1610 students who received their education in the traditional way during the first semester of 2019/2020; and n = 591 students who also followed the same courses as the PBL group but completed the academic year 2020/2021 using traditional teaching methods.
PBL was used in different subjects from different faculties. Faculties included Mechanics and Information Systems, Construction Economics, Architecture, Construction, and Water Management and Engineering Systems. Subjects included Linear Algebra and Mathematical Analysis, Information Systems, Multimedia Technologies, Economics, Basics of Management, Marketing Management, Marketing in Construction, Project Management, Experimental Architectural Design, Architectural Complexes, Design, Methods of Building Construction, Strength of Materials, Engineering Systems of Buildings and Settlements, Ventilation and Conditioning Systems, Construction Machines, Integrated Water Resource Use and Protection, Transport Engines, Conflict Areas and Criminal Emergencies, and Life Safety and Civil Defense. The sample included students from all bachelor’s degree years (the bachelor’s degree takes four years to complete, with 240 credit points in total). Groups of master’s students were also included. Almost all students were 17–30 years old.
To assess the effects of PBL on exam scores, we compared students who followed their education using PBL with two different control groups consisting of students who followed their courses using traditional teaching methods. The first group consisted of students who took exactly the same subjects/courses and retained the same tutors as the same semester of the previous year (2019/2020) when PBL was not applied. We refer to these students as Control group B. Here, we compare two different groups of students—one that took a set of courses during the 2019/2020 academic year without PBL (Control B) and one that followed exactly the same courses with the same tutors but with PBL (PBL group) during the first semester of 2020/2021. Using students who took the same courses with the same tutors enabled us to control for course- and tutor-specific effects. At the same time, because these groups involve different time periods and student cohorts, the external factors and circumstances of the students may have changed during the year, which could influence the results. Thus, we also created another control group. The second control group—referred to as Control group A—consists of different students with different tutors (not PBL-group tutors) for the same semester and subject. As we compared only the same courses, the number of students decreased, because not all students had an alternative fulltime lecturer for comparison. By using two different control groups, we sought to better control for tutor-, year-, and subject-specific effects in our results. It should be mentioned that the content of the exam was the same for the PBL and control groups of students.
2.3. Timeline of the Pilot PBL
We applied the pilot PBL during the first semester of the 2020/2021 academic year. This year started on the 15 September 2020 and finished on the 6 January 2021. There were two weeks of forced vacation during the semester, but during this period, special supportive and methodological workshops (training) were organized for the students. This training helped students understand the PBL approach.
The exam period (examination and final evaluation time) regularly begins in January (this academic year was a few days later than regular due to delays, and the semester was prolonged due to the pandemic and war) and finishes in early February (a few days later). During this exam period, we were able to measure three main outcomes:
- Semester scores earned before the exam and during all semesters from the first lesson until the last one;
- Exam scores earned during the exam;
- Formative resultative scores for academic performance, calculated from both the semester scores and the exam scores.
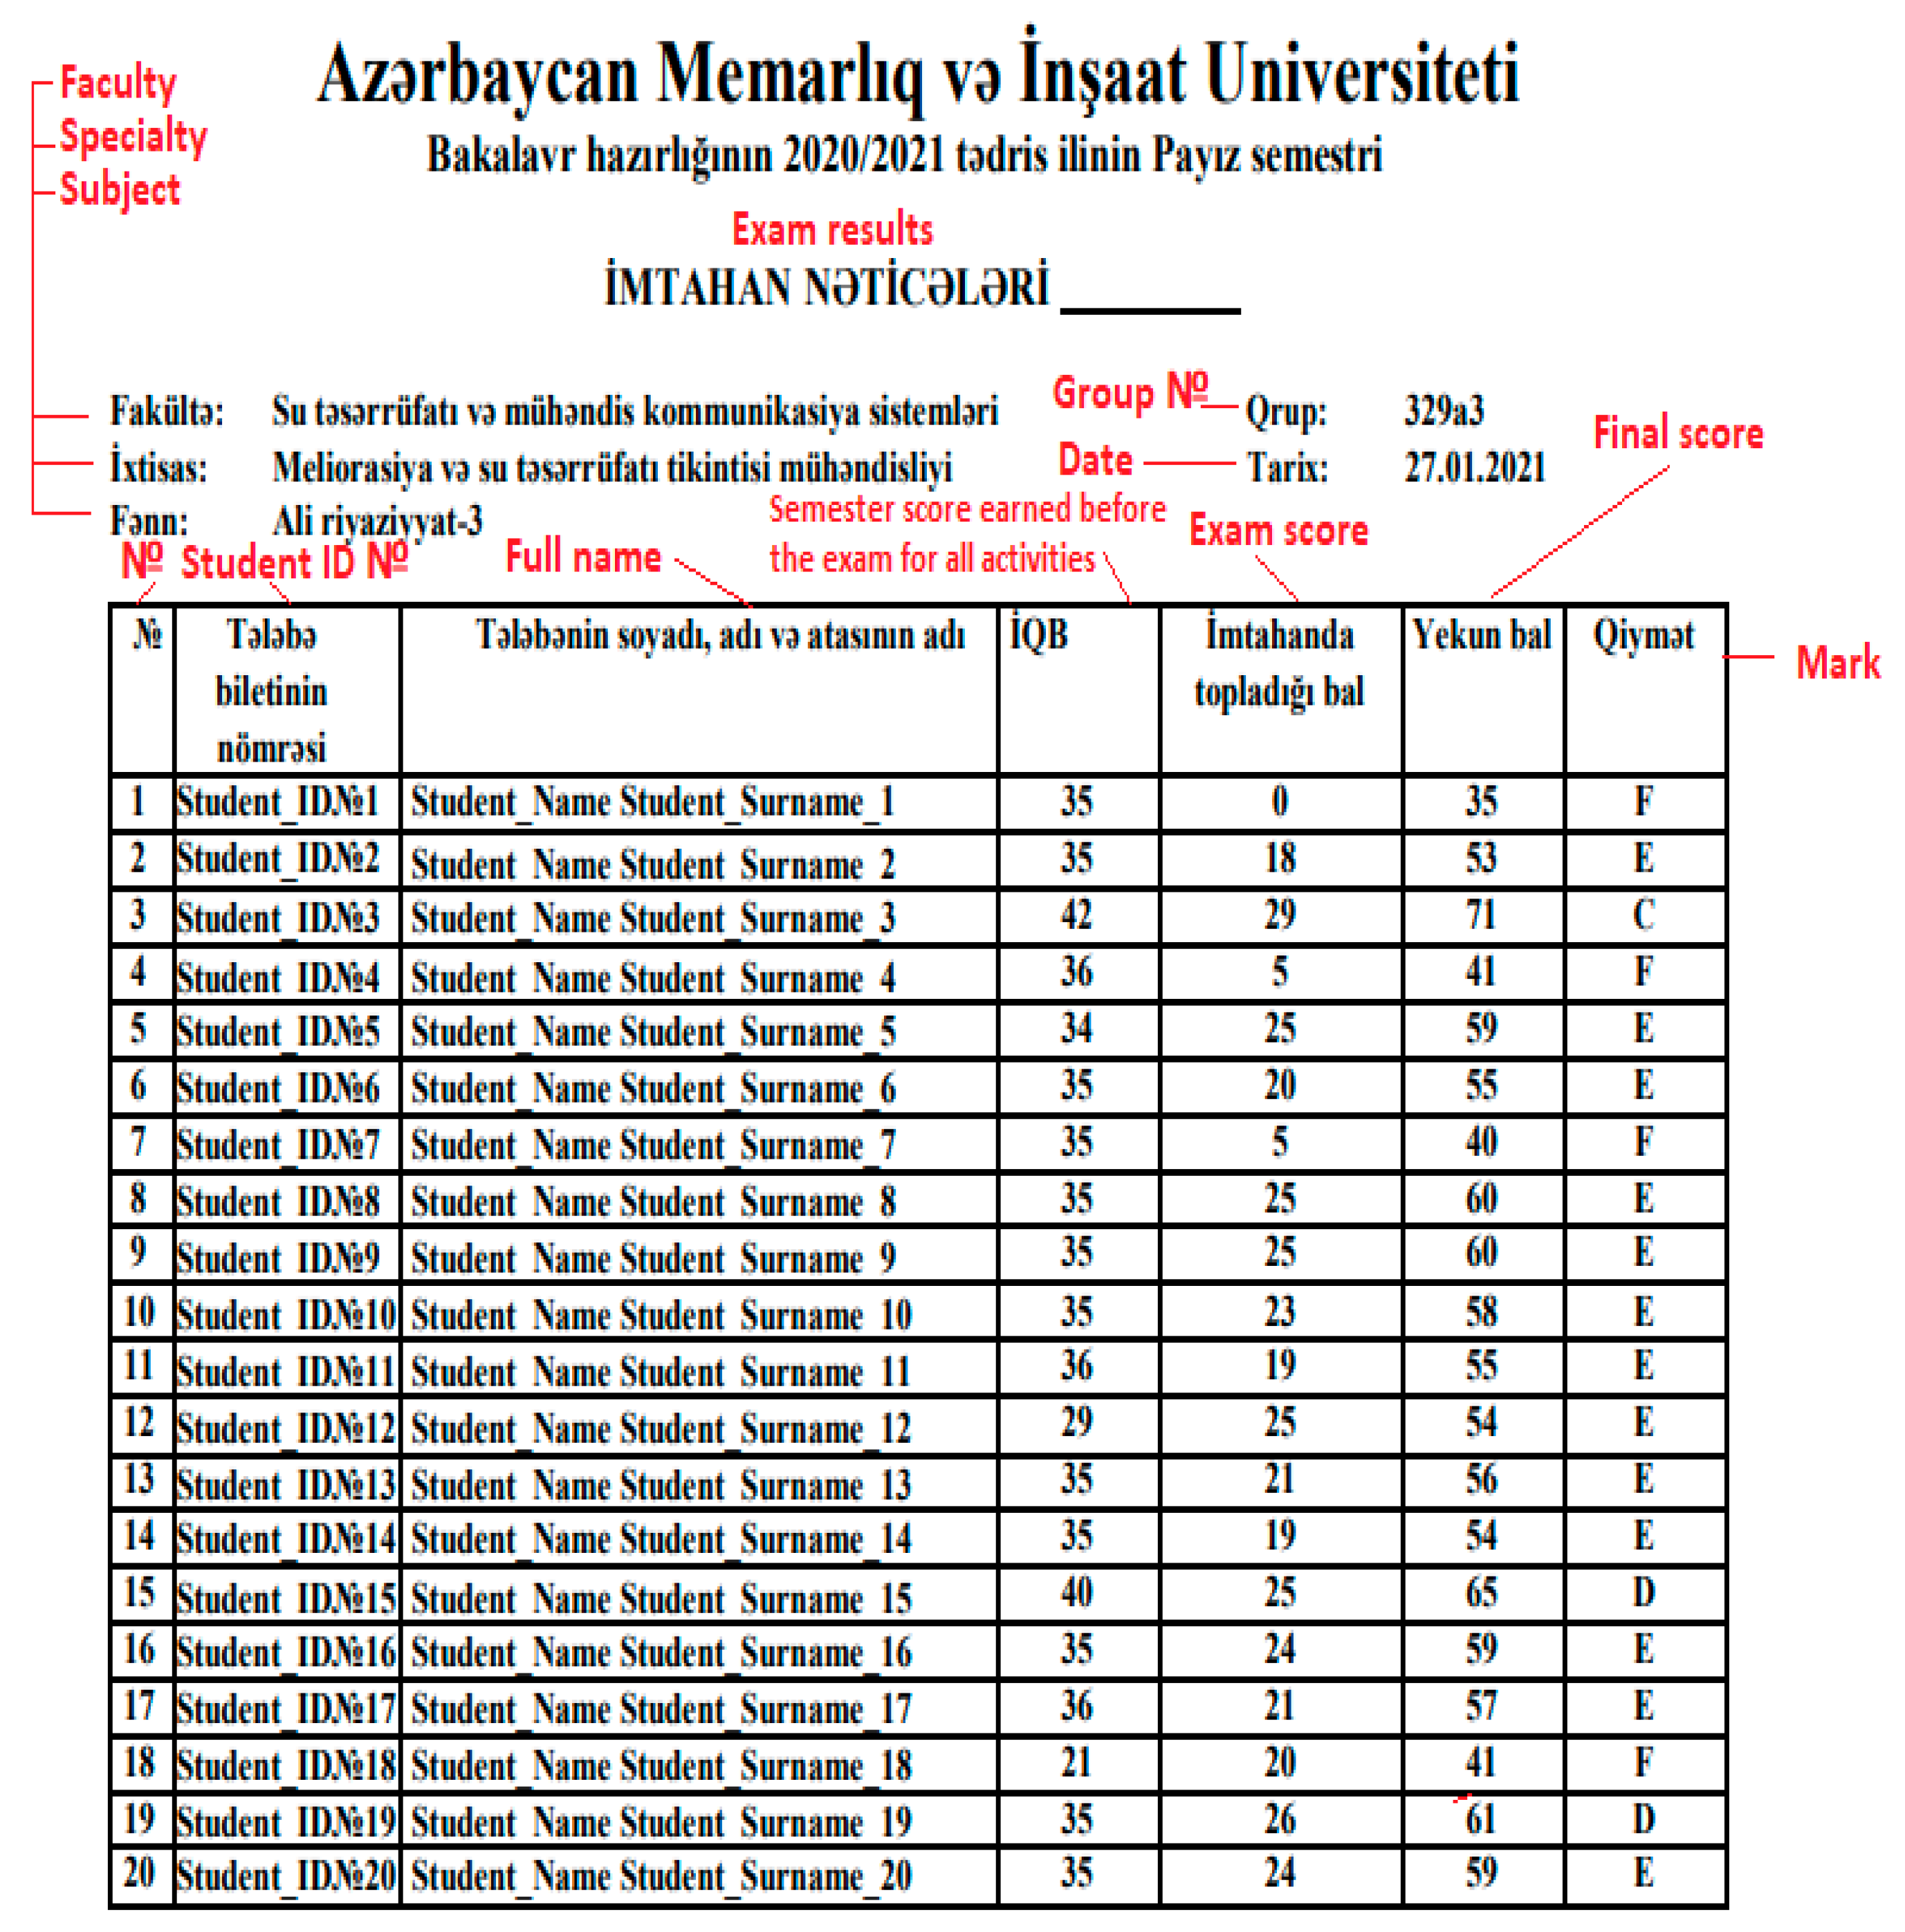
In Appendix A, we include a sheet (statement) of the group after the exam session of the previous year when the PBL approach was not applied (Appendix A, Figure A1). We also present some statistical characteristics related to the age (year of birth) and gender balance among students.
The maximum score within this system is 100 points for each subject, 50 points of which are accumulated during the semester and the other 50 points during the exam [16,17,18]. The maximum semester score (pre-exam) is equal to 50 and includes laboratory work (20/30 scores), free work (10 scores), presence at lessons (10 scores), and course projects (10 if applicable). The maximum exam score is also equal to 50 and includes the answers to 5 questions (mainly written, with the maximum value for each question equal to 10) or the results from a test-based exam. The type of exam depends on the subject, but in both cases, the maximum is equal to 50. The total maximum score is 100. Formative test scores for academic performance are the sum of the semester score and the exam score and are presented using Latin letters A to F. The highest mark is A and represents a score of no less than 91; the lowest mark is E and represents a score of no less than 51. F indicates a grade lower than 51 and indicates failure (not passed) [16].
The first column in Figure A1 (see Appendix A) describes the order of the students in the group list (journal). The second column presents the unique personal IDs of the students in the university database. The third column features randomly generated IDs to anonymize personal data. The fourth column is the semester score (pre-exam score). The fifth column presents the exam score. The sixth and last columns present the final scores and letter grades, respectively.
2.4. Statistical Analysis
To analyze the differences in exam scores between the PBL and non-PBL students, we used the data collected after the examination session and from the examination and quality assurance center at the university. Table 1 presents some descriptive statistics for the PBL and the two control groups, Control group A and Control group B. We also present some t-tests on the differences in means between the intervention group and both of the control groups. Independent sample t-tests were also performed, p-values were compared with Levin’s value, and the Levin’s value was greater than 0.05 for all groups (Appendix B). Thus, this lets us argue that the results do not depend on the age or gender of students in all groups. Based on the results from the Levin’s test, we found it more appropriate to apply the Kruskal–Wallis test. To determine if there were statistically significant differences between groups, we also applied the Kruskal–Wallis test to the grades that were released (see Table 2).

Table 1.
Descriptive statistics.
Table 2.
Kruskal–Wallis test to determine whether there were statistically significant differences between the groups.
Firstly, we compared the percentage distribution of final marks (in letters) of the samples in the PBL and control groups of students (Table 3).
Table 3.
The percentage distribution of final marks (in letters) of the unmatched samples in the PBL and control groups of students.
Since both control groups consisted of different groups of students than the PBL group, selection bias could emerge. To minimize this bias, we analyzed the differences in outcomes using matched samples. This process was completed using propensity score matching analysis (PSM) [19].
PSM allowed us to make the PBL and non-PBL groups more comparable by matching each student from the PBL group to a non-PBL (Control group B) student with similar characteristics. PSM ensures that the non-PBL control group (Control group B) was similar in observable characteristics to the PBL group [20,21]. We matched students based on observable characteristics available in the university learning management system, such as gender, age, and presemester score (score earned before the exam) (Table 4). In this way, PSM corrected for selection bias caused by these observable characteristics. To estimate the average intervention effect on the treated (ATT), we used logistic regression applying the STATA command effects (https://www.stata.com/manuals/teteffectsintro.pdf (accessed on 22 July 2023)) for the analysis using Control group B.
Table 4.
Contribution of covariance for gender, age, and presemester score.
For each subsample, the final score was compared between the matched PBL group of students and Control group B. For this comparison, we estimated the average ATT. In cases where all characteristics of all individuals were equally distributed between the PBL and non-PBL groups, ATT was calculated as the average difference in learning outcomes (in our case, the final score) between the PBL group and non-PBL group of students [22]:
where yi1 is the average outcome of PBL groups, and yi0 is the average outcome of non-PBL Group B, where N is the number of matched individuals. We present the results from PSM in Table 4 and Table 5 below.
Table 5.
(a). ATT Differences between Groups. (b). ATE Differences between Groups.
We also compared the unmatched results (the existing array of data without application PSM or any other methods) between the PBL group students and both control groups of students. Comparative result tables using both matched and unmatched samples are presented below in tables (Table 3, Table 4 and Table 5).
3. Results
The results of the statistical analysis and descriptive statistical characteristics for unmatched samples are presented in Table 1. Here, we also present the differences between the PBL group and two non-PBL groups based on the unmatched samples. All calculations were performed using the three outcome measures: the presemester score, exam score, and final score of students. The number of students in the experimental PBL group was 737, while for Control group A (Traditional 2020), the total was 1610 students, and for Control group B (Traditional 2019), the total was 591 students. Here, F represents the number of females and M represents the number of males among the groups. The statistical characteristics were calculated to validate the data.
The p-value (asymptotic significance) of the mean difference between the intervention and control groups for the unmatched samples is higher than 0.05 for all groups (Table 1, columns 6 and 10), suggesting that there are no statistically significant differences between the unmatched groups. In addition, a nonparametric Kruskal–Wallis test was applied. The results of the Kruskal–Wallis test (Table 2) show that there is no statistically significant difference between the medians of the groups. The Kruskal–Wallis test of the unmatched groups indicates that the differences between the PBL and non-PBL groups of students are also not statistically significant.
The final mark is the letter that expresses a score derived from the total score earned by the student during the entire semester (presemester score and exam score). Table 3 consists of a column with letters that reflect student success during the semester. The columns present the percentage distribution of marks for each group of students (PBL or the control groups). In Table 3, the percentage of high marks (A, B, C) is higher and the percentage of low marks (D) is lower in the PBL group than in the control groups. The percentage of F grades (fail, not passed) is also lower. It should be noted that the percentages were calculated for unmatched samples of students.
As mentioned previously for the PSM analysis, students from the PBL group were matched with students from Control group B only. After PSM, the total number of students in the analysis (PBL and non-PBL) was 1237. Matching was performed based on age, sex, and presemester scores. Table 4 describes the contribution of covariance for gender, age, and presemester score between the PBL and non-PBL (Control group B only) groups of students.
Table 5a,b compares the final scores between the PBL group and Control group B. The ATE (average treatment effect) [22,23] and the ATT (average treatment effect on the treated) show a statistically significant difference in presemester scores between the PBL and Control group B. This result suggests that PBL has an influence on final exam scores. We also recorded results for groups matched by courses/subjects. These results refer to the data provided in Figure A1.
ATT refers to the average intervention effect in the treated, while ATE refers to the average treatment effect and generalizes the results to the entire population. The numbers show that there is a difference between the control group and the intervention group. Here, we have to mention that the ATT is significant at the 0.1 level, while the ATE is significant at the 0.05 level.
4. Discussions and Limitations
The implementation of PBL in post-Soviet countries is difficult because, for example, teaching is emphatically theoretical using ex cathedra methods, and university–industry collaboration is not part of the university culture [21]. The latter factor limits the ability of tutors to develop real-life cases based on the state of the art in the industry. Teaching is mainly based on lectures, which only involve explaining the theory. Practically oriented lessons based on laboratory experiments and project-based lessons with research and analytical work using real problems and cases form only a minor part of the curriculum. Interactive lessons are not used as part of traditional lectures where the lecturer addresses the students. To the best of our knowledge, there are no research papers describing the results of applying PBL in countries from the ex-Soviet Union published during the last few years. Even in neighboring countries, few authors have published research covering the same topic and period. Additionally, the problems and limitations these studies describe in implementing PBL are very similar to those found in our research [24]. This result relates to difficulties in the application of novel teaching methods more generally, as these methods frequently require change, adaptation, and special training, as well as changes in culture for tutors and lecturers [10,25,26].
Previous research has shown positive results on the effectiveness of PBL. Numerous studies have compared traditional teaching methods (classical lecture-based approach) with the PBL approach [26,27,28]. There are different studies that have analyzed learning outcomes and the effectiveness of PBL’s application using different methods and in different contexts, such as research on the pedagogical evaluation of PBL and lecture methods in developing learners’ cognitive abilities in critical thinking and experimental design [26,28,29,30]. For example, a study conducted in [30] on PBL applied in teaching research methods gives results showing both quantitative studies or qualitative studies with data collection, whereby two classes were taught by two different approaches, PBL vs. traditional, and it offers conclusions and recommendations based on research findings regarding the effectiveness of the PBL approach for teaching research methods to postgraduate students [30]. Other research on training doctoral students in critical thinking and experimental design using PBL in the biomedical sciences, where the aim was to develop scientific skills and competencies, demonstrates the effectiveness of using a PBL approach. It emphasizes the shift from traditional didactic methods to active learning and highlights the positive impact of such an approach on students’ learning and preparation for research [28]. PBL led to deeper and more meaningful learning, increased students’ knowledge in their field of specialty and their satisfaction with the learning process, provided more enjoyable and active learning, increased the students’ skills in carrying out their thesis projects, enhanced their autonomy and independence, and also promoted their dignity, stimulating students’ cognitive development over time and enhancing student’s preparation prior to the initiation of their dissertation research and their clinical thinking ability (in medical education) [10,26,27,28,29,30].
Furthermore, there are systematic literature review papers concerning the intervention of the PBL method. These studies demonstrate that the PBL teaching model is more effective than the traditional teaching model regarding students′ satisfaction levels [26]. These studies tried to apply the main pillars of PBL through tutors; however, these researches are limited by funding and circumstances, suggesting further well-designed studies on a bigger scale are needed to confirm their findings [26,27,30].
In Azerbaijan, the PBL approach is new for both the academic and student communities. Despite this consideration, even a short-term intervention using the PBL method with teachers and students used to traditional teaching methods seems to have had a positive influence, although we did not find that the positive effects were always statistically significant. Only after matching did we find that the differences became statistically significant. The absence of a statistically significant effect may be caused by differences between groups, the sample size, the length of the intervention, and/or the novelty of and adjustment to the PBL teaching method.
The results show that even a one-semester-long PBL intervention has promising outcomes on final exam grades. Thus, we recommend supporting tutors with more methodological and training support and to advocate for the wider implementation of this method in universities for subjects where the PBL approach is the most relevant.
This result provides a recommendation for further implementation of PBL. Our main goal was to verify if PBL has potential and whether it might lead to an enhancement in exam outcomes in a post-Soviet country with a completely different education culture and traditions. The results of the present study appear to answer this question in an affirmative way. A reformation of the curriculum in Azerbaijan is necessary, as the current method of teaching does not adequately prepare students for the needs of the labor market. Practical and applied subjects hardly exist in the curriculum or are not sufficiently developed. The curriculum of most programs is almost fully theoretical, with very little attention given to practical knowledge. PBL could help change this situation.
It remains to be seen whether PBL has a positive effect when applied to other higher education programs. Aside from positive learning outcomes, student and tutor satisfaction with PBL is important for the wider implementation of this method [10]. It is therefore advised to broaden interventions using the PBL approach in Azerbaijan.
Although pilot studies are typically small-scale, we suppose that this preliminary investigation is useful to test the feasibility of implementing and studying the effectiveness of PBL in a larger (research) setting. We expect that this can provide more valuable insights and serve as a platform for the wider implementation of PBL at universities in countries with a post-Soviet culture of higher education.
Our study has some other limitations that should also be noted. We were unable to randomize students between the PBL and control groups or compare the same tutors’ student groups during the same period. When the PBL tutors were mastering this approach, it was not possible to demarcate traditional teaching from teaching using the PBL method. Thus, we used two different control groups: students of the same academic year and the same semester taught by other tutors and students from the previous 2019/2020 academic year with the same tutors. The assessment method for PBL students was the same as for students with the traditional approach. In addition, we had limited additional information for students in the learning management system, so we were limited in the observable characteristics used for the matching analysis.
5. Conclusions
In our pilot study, a preliminary and limited introduction of PBL shows promising results and an improvement in learning outcomes, as indicated by students’ final scores on subjects that were taught with the PBL approach; thus, the results suggest that post-Soviet countries where education traditions differ from those in Western countries could also benefit from PBL. It is advised to continue to study this method in similar and other contexts to find out whether or not it is worth advocating for the wider dissemination of PBL in Azerbaijan and elsewhere in post-Soviet countries.
Author Contributions
Conceptualization, U.S., W.G. and J.A.; methodology, W.G. and J.A.; formal analysis, U.S., W.G. and J.A.; investigation, U.S., W.G. and J.A.; resources, U.S., W.G. and J.A.; data curation, U.S.; writing-original draft preparation, U.S., W.G. and J.A.; writing-review and editing W.G. and J.A.; supervision, W.G. and J.A. All authors have read and agreed to the published version of the manuscript.
Funding
This research received no external funding.
Institutional Review Board Statement
The study was conducted in accordance with the Declaration of Helsinki, and approved by the University Ethics Committee (3-29-612-182/2023 and 24 April 2023).
Informed Consent Statement
Informed consent was obtained from all subjects involved in the study.
Data Availability Statement
Data available in a publicly accessible repository.
Conflicts of Interest
The authors declare no conflict of interest.
Appendix A
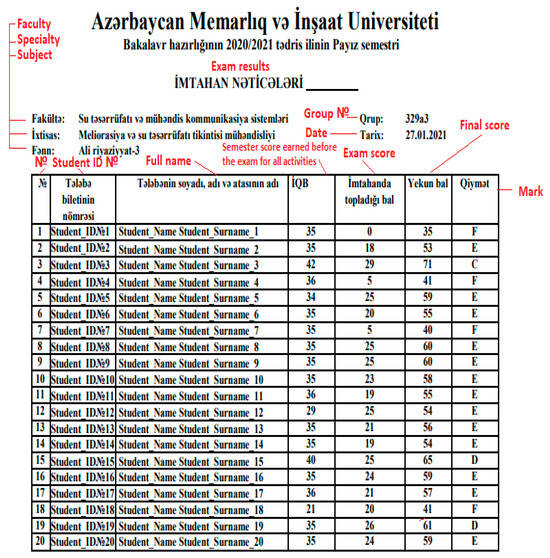
Figure A1.
Final evaluation sheet.
Figure A1.
Final evaluation sheet.
Appendix B
A 5% threshold is commonly used to decide whether this assumption is rejected or not. If a violation occurs, using the nonparametric equivalent of the analysis is more appropriate.
Table A1.
T-test. Group statistics.
Table A1.
T-test. Group statistics.
| Year of Birth Student | ||||
|---|---|---|---|---|
| Equal Variances Assumed | Equal Variances not Assumed | |||
| Levene’s Test for Equality of Variances | F | PBL | 2.514 | |
| Group A | 14.988 | |||
| Group B | 3.393 | |||
| Sig | PBL | 0.113 | ||
| Group A | 0.000 | |||
| Group B | 0.066 | |||
The last column is empty, as the equal variances are not assumed; Sig.—this is the two-tailed p-value associated with the null that the two groups have the same variance; F—this column lists Levene’s test statistic.
Appendix C
Case example from one subject
| MINISTRY OF SCIENCE AND EDUCATION REPUBLIC OF AZERBAIJAN |
 AZERBAIJAN UNIVERSITY ARCHITECTURE AND CONSTRUCTION DEPARTMENT OF “EXPLOITATION AND RECONSTRUCTION OF BUILDINGS AND CONSTRUCTIONS” |
| WORK PLAN ON SUBJECT “SEISMIC RESISTANCE OF BUILDINGS” (syllabus) Specialty (code and name) 050634-Civil Engineering |
| 1. Information about subject Name of subject “Seismic Resistance of Buildings” Language of education English Year of education 2022/2023 Semester II Type of education Full-time Degree Bachelor Group 200i Teaching load Total: 60 h (Lecture—30 h, Laboratory works—30 h)-credits Class days IV, V (according to schedule) Number of weeks 15 Class location № 810 2. Information about instructor Instructor XXXXXX e-mail XXXXXX Telephone number XXXXXX |
| Baku–2023 |
The example of one problem
Topic № 3. Installation of engineering seismometric stations in buildings of various purposes and processing of information received from these stations.
Problem statement. Information about engineering seismometric stations. Devices and transducers used in seismometric stations. Learning goals: Installation of seismometric stations in buildings and facilities of various purposes. Processing of information received from seismometric stations and assessment of the earthquake resistance of buildings.
References
- Silova, I.; Chankseliani, M. Comparing Post-Socialist Transformations Purposes, Policies, and Practices in Education; Symposium Books: Oxford, UK, 2018. [Google Scholar]
- Kasprzhak, A.; Polivanova, K.; Tsukerman, G.; Mitrofanov, K.; Sokolova, O. Russian School Education: A view from outside. Vopr. Obraz. 2004, 1, 190–231. (In Russian) [Google Scholar]
- Kovaleva, G.; Krasnokutskaia, L.; Krasnianskaia, K.; Loginova, O. Results of Russia’s Participation in the International Programme of Assessment of Educational Achievements (PISA) in 2003. Vopr. Obraz. 2004, 1, 181–189. (In Russian) [Google Scholar]
- Piattoeva, N.; Gurova, G. Domesticating International Assessments in Russia: Historical grievances, national values, scientific rationality and education modernization. In Pupil Assessment Cultures in Historical Perspective; Alarcón, C., Lawn, M., Eds.; Peter Lang: Frankfurt am Main, Germany, 2018. [Google Scholar]
- Misarenko, G. On the Way to Educational Standards of the New Generation. Nar. Obraz. 2009, 1, 62–68. (In Russian) [Google Scholar]
- Gurova, G.; Piattoeva, N.; Takala, T. Quality of Education and its Evaluation: An analysis of the Russian academic discussion. Eur. Educ. 2015, 47, 346–364. [Google Scholar] [CrossRef]
- Available online: https://abdigm.meb.gov.tr/meb_iys_dosyalar/2019_12/05140122_OECD_PISA_2018_Raporu_V1.pdf (accessed on 22 July 2022).
- Silova, I.; Kazimzade, E. The Changing Status of the Teaching Profession in Post-Soviet Azerbaijan: Implications for Teacher Education; Arizona State University: Tempe, Arizona; Baku State University: Baku, Azerbaijan, 2010. [Google Scholar]
- Available online: https://edu.gov.az/en/page/299/2553 (accessed on 22 July 2023).
- Sattarova, U.; Groot, W.; Arsenijević, J. Student and Tutor Satisfaction with Problem-Based Learning in Azerbaijan: An Application to the University of Architecture and Construction. Educ. Sci. 2021, 11, 288. [Google Scholar] [CrossRef]
- Sattarova, U.; Groot, W.; Arsenijević, J. Modern learning approaches in higher education: A review of the literature. Zb. Instituta Za Pedagos. Istraz. 2020, 52, 418–478. [Google Scholar] [CrossRef]
- Merritt, J.; Lee, M.Y.; Rillero, P.; Kinach, B.M. Problem-based learning in K–8 mathematics and science education: A literature review. Interdiscip. J. Probl.-Based Learn. 2017, 11, 3. [Google Scholar] [CrossRef]
- Polyzois, I.; Claffey, N.; Mattheos, N. Problem-based learning in academic health education. A systematic literature review. Eur. J. Dent. Educ. 2010, 14, 55–64. [Google Scholar] [CrossRef]
- Zheng, Q.-M.; Li, Y.-Y.; Yin, Q.; Zhang, N.; Wang, Y.-P.; Li, G.-X.; Sun, Z.-G. The effectiveness of problem-based learning compared with lecture-based learning in surgical education: A systematic review and meta-analysis. BMC Med. Educ. 2023, 23, 546. [Google Scholar] [CrossRef]
- Bridges, A. A critical review of problem based learning in architectural education. In Proceedings of the eCAADe Conference, Volos, Greece, 6–9 September 2006; Volume 24, pp. 755–7614. [Google Scholar]
- Available online: https://e-qanun.az/framework/19531 (accessed on 22 July 2023).
- Available online: https://eacea.ec.europa.eu/sites/eacea-site/files/countryfiches_azerbaijan_2017.pdf (accessed on 22 July 2023).
- Available online: http://www.erasmusplus.org.az/images/uploader/175cd-countryfiches_azerbaijan_2017.pdf (accessed on 22 July 2023).
- Austin, P.C. An introduction to propensity score methods for reducing the effects of confounding in observational studies. Multivar. Behav. Res. 2011, 46, 399–424. [Google Scholar] [CrossRef]
- Caliendo, M.; Kopeinig, S. Some practical guidance for the implementation of propensity score matching. J. Econ. Surv. 2008, 22, 31–72. [Google Scholar] [CrossRef]
- Moust, J.; Bouhuijs, P.; Schmidt, H. Introduction to Problem Based Learning 136 Pages; Routledge Publishing: Milton, UK, 2007. [Google Scholar]
- Arsenijevic, J.; Groot, W. Lifestyle differences between older migrants and non-migrants in 14 European countries using propensity score matching method. Int. J. Public Health 2018, 63, 337–347. [Google Scholar] [CrossRef]
- Ali, M.S.; Prieto-Alhambra, D.; Lopes, L.C.; Ramos, D.; Bispo, N.; Ichihara, M.Y.; Pescarini, J.M.; Williamson, E.; Fiaccone, R.L.; Barreto, M.L.; et al. Propensity Score Methods in Health Technology Assessment: Principles, Extended Applications, and Recent Advances. Front. Pharmacol. 2019, 10, 973. [Google Scholar] [CrossRef]
- Dermendzhieva, Z. Emigration from the South Caucasus: Who goes abroad and what are the economic implications? Post-Communist Econ. 2011, 23, 377–398. [Google Scholar] [CrossRef]
- Aslan, A. Problem-Based Learning in Live Online Classes: Learning Achievement, Problem-Solving Skill, Communication Skill, and Interaction. Comput. Educ. 2021, 171, 104237. [Google Scholar] [CrossRef]
- Ssemugenyi, F. Teaching and learning methods compared: A pedagogical evaluation of problem-based learning (PBL) and lecture methods in developing learners’ cognitive abilities. Cogent Educ. 2023, 10, 2187943. [Google Scholar] [CrossRef]
- Schaller, M.; Gencheva, M.; Gunther, M.; Weed, A. Training doctoral students in critical thinking and experimental design using problem-based learning. BMC Med. Educ. 2023, 23, 579. [Google Scholar] [CrossRef]
- Ling, Y.; Zin, Z. The critical thinking-oriented adaptations of problem-based learning models: A systematic review. Front. Educ. 2023, 8, 1139987. [Google Scholar]
- Kaeedi, A.; Esfahani, A.; Sharifian, F.; Moosavipour, S. The Quantitativ and Qualitative Study of the Effectiveness of the Problem-based Learning Approach in Teaching Research Methods. J. Univ. Teach. Learn. Pract. 2023, 20, 1–27. [Google Scholar]
- Feng, Z.; Aiming, S.; Qing, Z.; Qing, W.; Yao, F.; Songhua, M. The impact of an integrated PBL curriculum on clinical thinking in undergraduate medical students prior to clinical practice. BMC Med. Educ. 2023, 23, 460. [Google Scholar]
Disclaimer/Publisher’s Note: The statements, opinions and data contained in all publications are solely those of the individual author(s) and contributor(s) and not of MDPI and/or the editor(s). MDPI and/or the editor(s) disclaim responsibility for any injury to people or property resulting from any ideas, methods, instructions or products referred to in the content. |
© 2023 by the authors. Licensee MDPI, Basel, Switzerland. This article is an open access article distributed under the terms and conditions of the Creative Commons Attribution (CC BY) license (https://creativecommons.org/licenses/by/4.0/).