Abstract
This research work evaluates the use of artificial intelligence and its impact on student’s academic performance at the University of Guayaquil (UG). The objective was to design and implement a predictive model to predict academic performance to anticipate student performance. This research presents a quantitative, non-experimental, projective, and predictive approach. A questionnaire was developed with the factors involved in academic performance, and the criterion of expert judgment was used to validate the questionnaire. The questionnaire and the Google Forms platform were used for data collection. In total, 1100 copies of the questionnaire were distributed, and 1012 responses were received, representing a response rate of 92%. The prediction model was designed in Gretl software, and the model fit was performed considering the mean square error (0.26), the mean absolute error (0.16), and a coefficient of determination of 0.9075. The results show the statistical significance of age, hours, days, and AI-based tools or applications, presenting p-values < 0.001 and positive coefficients close to zero, demonstrating a significant and direct effect on students’ academic performance. It was concluded that it is possible to implement a predictive model with theoretical support to adapt the variables based on artificial intelligence, thus generating an artificial intelligence-based mode.
1. Introduction
Artificial intelligence (AI) has impacted various sectors of society, from replacing rudimentary tasks in factories to tailoring advertisements based on user information. Despite its proven utility, the full-fledged adoption of AI in the educational realm remains nascent. Numerous studies have delved into the application of different forms of AI, such as machine learning and natural language processing, to enhance student performance and engagement. However, these innovations are seldom integrated into prevalent learning management solutions in higher education [1,2,3].
During the COVID-19 era, higher education shifted its focus towards enhancing personalization, monitoring, and assessment in learning [4,5]. Currently, in higher education, AI is rapidly transforming the way we teach and learn thanks to the emergence of new technological tools [6,7]. These AI tools are being used to provide students with personalized instruction, immediate feedback, and targeted practice [8]. This can help students learn at a faster pace and better understand the concepts they are learning [9,10].
AI helps students learn more effectively and improve their academic performance through personalized learning, which is tailored to individual needs [11]. AI can also help students develop skills such as critical thinking, problem-solving, and creativity, creating environments where students can work together to solve problems and develop projects [12,13].
The ability to personalize education allows students to access materials and activities tailored to their specific preferences and needs [14]. Those who learn best through practice can benefit from interactive exercises and simulations, while those who prefer a more theoretical approach can access more detailed academic resources such as books, scientific articles, and technical papers [15]. This adaptability allows each student to optimize their learning experience and improve their academic performance [16,17].
Student performance is better when education is personalized because it allows us to discover individual characteristics and group students [18]. Successful implementation of AI in higher education requires careful planning and adequate training of educational personnel. It is crucial that teachers adapt to new technological advances and learn how to integrate them effectively into their teaching methods [19]. AI does not seek to replace the teacher but rather to be a complementary tool that enriches the educational experience and helps maximize the potential of each student [20,21].
Teachers who use technology effectively can create more personalized, engaging, and effective learning experiences for their students [22]. AI tools are used to help develop adaptive learning systems that adjust the difficulty level of assignments and assessments based on the individual needs and abilities of each student, providing a personalized learning experience, which would also allow educators to accurately assess the learning achievements of individual students [6].
In recent years, there has been a growing interest in the use of predictive studies in education. These studies are used to identify students at risk of dropping out, predict student grades, and improve the accuracy of teaching methodologies. Phan, De Caigny, and Coussement [23] developed a predictive model for a higher education institution in which the results are used by the authorities to make decisions, anticipate, and manage student dropout behaviors. This is why obtaining empirical data serves as a basis for designing effective teaching projects in university education, increasing the results of student performance [24].
Predictive studies can use a variety of data, including academic history, socioeconomic data, and test performance data. In their research, Jiao [25], using a prediction method based on evolutionary computation, proved to be a viable tool for assessing students’ learning performance in online courses. Furthermore, the programming model provides acceptable prediction performance, indicating that the dominant variables in academic performance are knowledge acquisition, class participation, and summative performance.
Another study proposed a neural network model with good prediction results and concluded that it is possible to implement a model with endogenous and exogenous factors to predict student performance [26]. However, a gap remains: current research seldom considers the evolutionary nature of students’ learning progression or provides real-time feedback on procedural learning. To truly harness the potential of AI in education, future research should focus on delivering immediate feedback and actionable insights, bridging the gap between AI predictions and effective educational interventions [27,28].
Based on identity threat and security theory, these theories play a role in determining the academic success of students from underrepresented or negatively stereotyped groups [29]. Women experience identity threats and negative stereotypes regarding their abilities and potential in these fields. However, empirical studies show the opposite. Bowman [30] found that female students performed better relative to male students in college courses such as mathematics, statistics, and computer science. The disadvantages of female students in learning conditions can affect academic performance and career completion, so it is necessary to deepen the understanding of gender disparities to prevent and mitigate this problem [31].
Eccles and Wigfield’s expectancy-value theory of motivation focuses on how students’ expectations and values toward an academic task or activity affect their motivation and performance [32]. Age is linked to this theory, as age can influence students’ expectations and values towards their education. In such a sense, Portillo [33] pointed out that different ages lead to increased diversity in higher education; younger students may have lower expectations of success in higher education than older students. Younger students may have less experience with academic work, which may lead to less confidence in their academic abilities and lower motivation.
Fredricks, Blumenfeld, and Paris’ academic engagement theory focuses on students’ engagement and active participation in their learning and school [34]. The time devoted to academic activities is related to this theory, as it can positively influence students’ academic engagement; the more time devoted to study, the better academic results they tend to achieve [35]. In the technological framework, Dhiman's [36] study revealed that usage time of 30 min to 3 h a day spent on social networking sites and mobile applications negatively affected students’ academic performance; therefore, there is an inverse relationship between the use of social networking sites and their academic performance. However, in the research by Tamura [37], it was shown that students who dedicated more hours to the use of digital platforms to fulfill their academic activities improved their academic performance, demonstrating the direct relationship between the time spent using technological tools and performance.
The theory of meaningful learning by David Ausubel, mentioned by Neroni [38], is related to the use of educational tools, such as virtual rooms, digital books, and libraries, the same that are used to succeed in studies. Currently, owning technological tools and applications based on AI helps to improve the academic performance of students. Such is the case of De Jesús Araiza and García [39], who corroborated that the use of technological tools such as Red Canvas and Learning Management System (LMS) platforms have a significant impact on the performance of higher education students.
In relation to the study by Sinchigalo [40] and Arroba [41], who prioritized a more proactive and effective approach to their student’s academic development, we move towards a more personalized, efficient, and student-centered higher education. Therefore, this study aims to contribute to the understanding and improvement of higher education through the appropriate use of artificial intelligence, offering a new tool to anticipate and enhance the academic performance of students.
The goal of the research is to develop a predictive model for the academic performance of college students. The model will be based on student data such as gender, age, hours using AI-based tools, days per week using these tools, number of applications, and their grades. The model will be used to identify students who are at risk of missing out and to provide them with additional support.
A correlational–predictive research design will be adopted in the research. The focus will be on the analysis of higher education student data, with the implementation and evaluation of a multiple linear regression model specifically designed to predict academic performance. This will involve the collection and analysis of several variables. The selection of variables for a study should be based on sound theoretical foundations to ensure that the variables chosen are relevant, meaningful, and supported by the academic literature [42]. Variables will be selected based on theoretical foundations supported by academic literature and relevant theories.
2. Materials and Methods
2.1. Design
The study adopted a cross-sectional, non-experimental design since a questionnaire distributed among students enrolled at the University of Guayaquil was used. Data collection was carried out in the year 2023. According to Hernández and Mendoza [43], the present research is quantitative, relational, descriptive, and cross-sectional in scope, with a non-experimental design since its purpose was to determine the level of association between variables and to characterize its results.
2.2. Participants
Students were chosen using a convenience sampling technique. All students who participated had to meet the following requirements be enrolled in the current semester and be able to fill out the consent form freely and voluntarily. The university provided the necessary data to distribute the questionnaire through institutional mail.
The minimum sample size was calculated using Slovin’s method (n = N/(1 + N e2)), where n is the number of participants, N is the total population, and e is the margin of error (0.05). Given that there are 70,000 students enrolled at the University of Guayaquil, 398 university students were required as the minimum sample size.
2.3. Data Collection Procedure
Data were collected through self-administered questionnaires uploaded on the Google Forms platform. The research processes were given to the assistant deans in each faculty of the university. They were provided full details regarding the study and were asked for their help in distributing the questionnaire.
The assistant deans invited students to participate, and participating students were given ten days to answer the completed questionnaire anonymously. In the first instance, 1000 questionnaires were distributed to obtain several responses higher than the calculated sample size. A total of 911 responses were obtained. Subsequently, after validation of the prediction model, the questionnaire was sent to 100 students who had not participated before to use the model and predict their grades.
2.4. Questionnaire
A measurement instrument was utilized based on a self-developed questionnaire derived from the studies of the authors [26,44,45], which is detailed in Appendix A. This instrument incorporates demographic items, multiple-choice questions structured on a Likert scale, open-ended responses, and of a quantitative nature. For the conceptualization and design of the predictive model in question, the focus was on questions 15 to 18 due to their high relevance and alignment with the predictor variables of the study.
The self-administered questionnaire consists of three sections: demographics, knowledge of artificial intelligence, and factors influencing academic performance.
Dimensions of the AI variable: ethics and responsibility, social impact, economic impact, safety, and risk. Dimensions of the academic performance variable: study habits, participation, emotional well-being, and commitment–motivation.
The score obtained in academic performance corresponds to the dependent or explained variable. It is affected by the independent or explanatory variables: gender, age, hours of use of AI-based technological tools, number of days using these tools, and number of applications.
2.5. Data Analysis Plan
Gretl is an open-source software for econometric analysis, ideally suited for estimating linear regression models. It allows for data importation, the calculation of descriptive statistics, the specification and estimation of models using ordinary least squares, the conduct of diagnostics and fit tests, and model validation with split datasets. Upon validation, Gretl simplifies the interpretation of results and the documentation of the process, culminating in the formulation of recommendations based on the findings [46].
Gretl version 1.9.4 was used to analyze the data. The demographics of the sample were established using descriptive statistics. A multiple linear regression model using ordinary least squares was used, and fit tests were performed to determine the significant associated factors. The treatment of the data was carried out in three phases: first, the validation of the model using the data set of the first 100 students, the 398 students corresponding to the calculated sample, and the 911 students who responded to the survey. The metrics used were the mean error, the root mean square error, the mean absolute error, the mean percentage error, and the mean absolute percentage error.
Secondly, the multiple linear regression model was run:
= Observed value of the dependent variable;
= Common magnitude or constant value of the equation;
= Coefficients of the independent variables;
= Values of the variables within the equation;
= Error term of the equation.
Multiple regression model for academic performance:
Observed value of the dependent variable;
= Common magnitude or constant value of the equation;
= Coefficients of the independent variables;
= Values: 1 Females − 2 Males;
= Values of the age of the students measured in years;
= Values of the hours used by students using AI tools;
= Values for the number of days used by students using AI tools;
= Values of the number of AI applications used by students;
= Error term of the equation.
Finally, the predictive model was run using data from the last 100 students who completed the questionnaire.
3. Results
Using the wide variety of statistical tools available in Gretl 1.9.4 and taking advantage of its graphical interface, we proceed to present the values obtained and the corresponding graphs for the three sets of students. These visualizations and results allow us to validate the prediction model used in the study.
The Table 1 shows the accuracy metrics of the prediction model; as a result, it was obtained that the mean error, root mean square error, mean absolute error, and mean absolute percentage error decrease as the number of students increases. This suggests that the model becomes more accurate as the sample size increases. As argued by Floryan and Graham [47], data are the main factor limiting the performance of statistical models and mathematical learning systems. They argue that as the amount of data increases, the accuracy and complex patterns in the data also increase. In other words, the results indicate that the model performs well overall on all three data sets. The fact that the mean error and the other accuracy metrics are close to zero suggests that the model can make reasonably accurate predictions.

Table 1.
Prediction model validation.
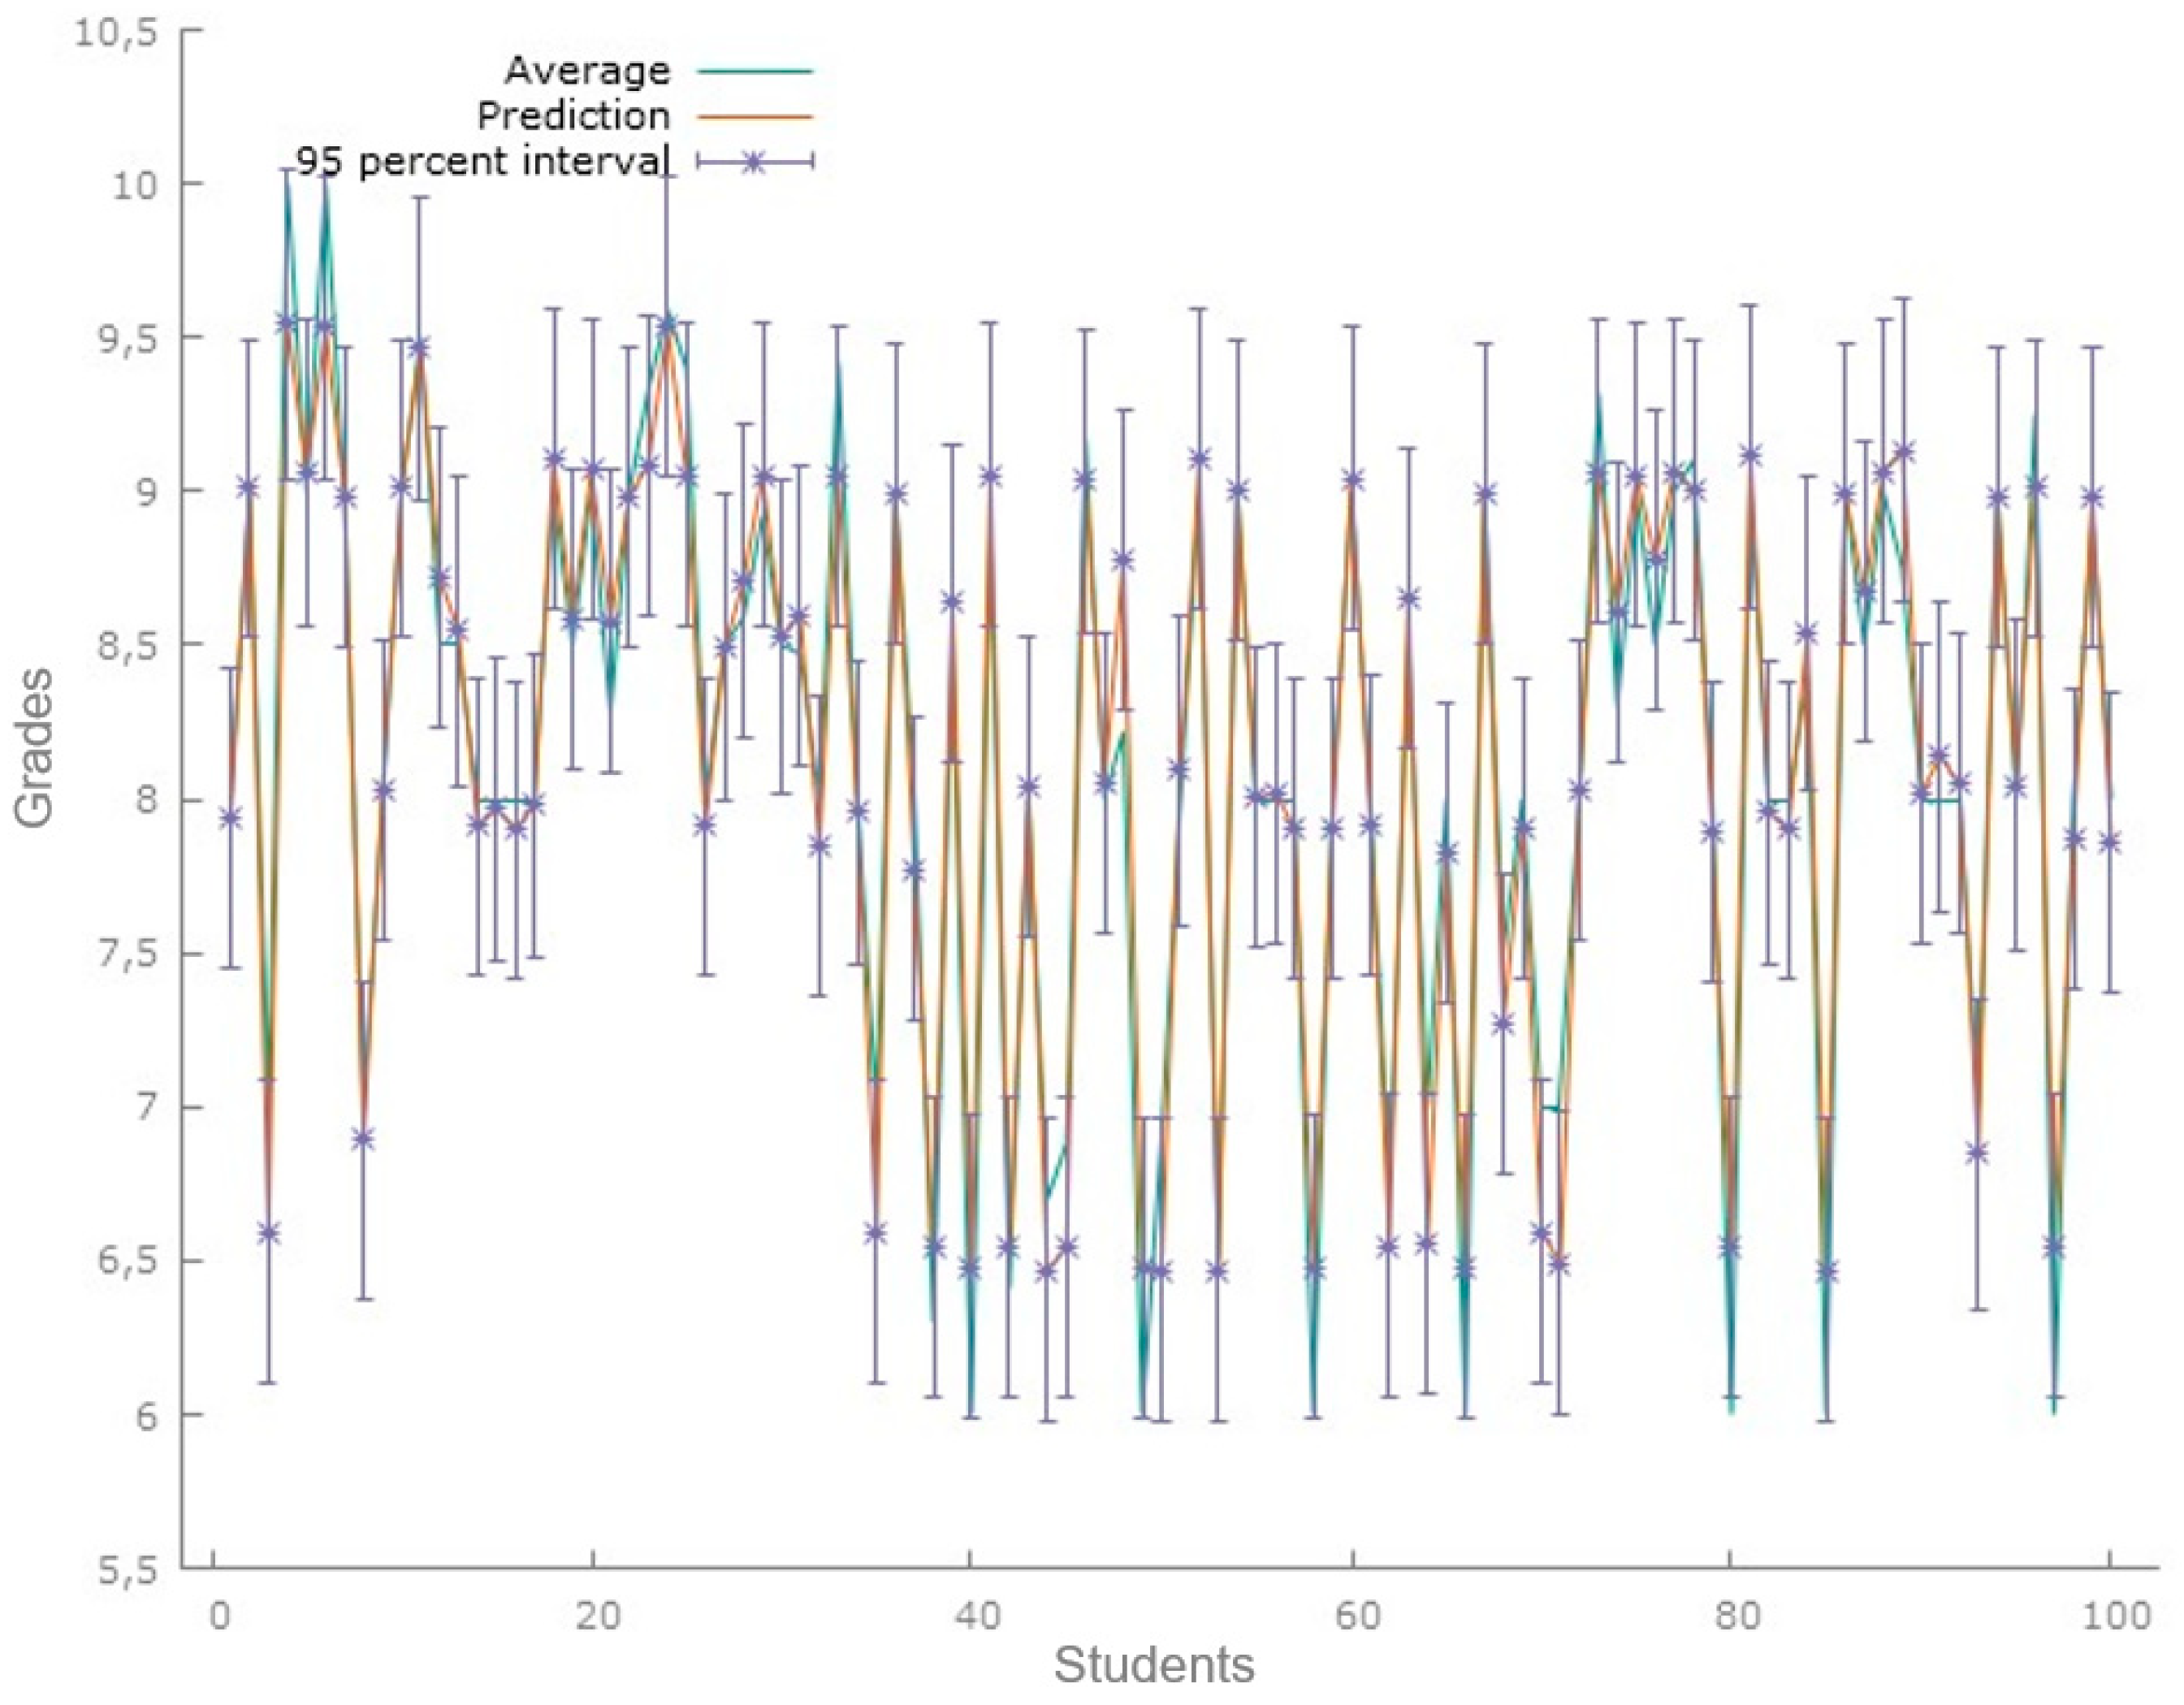
Figure 1 displays the predictions made by the model for a sample of 100 students. There is a standard deviation of less than 1 between the observed mean and the estimate provided by the model, with a 95% confidence interval.
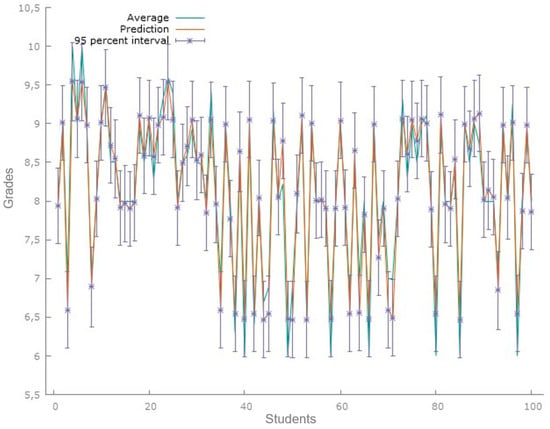
Figure 1.
Predictions of grade point average first data set. Figure 1 corresponds to the model predictions for the data set of 100 students. Source: Gretl Software 1.9.4.
Prediction plots are tools that can be used to visualize the results of a multiple regression statistical model [48]. The regression model data for this data set show an R-squared of 0.9429, and the significant variables are hours, days, and AI-based tools or applications. In this case, for the analysis of predictions, a Theil’s U1 coefficient of 0.014244 was obtained, a measure of inequality in the distribution of the data, which suggests that there is low inequality in the distribution analyzed.
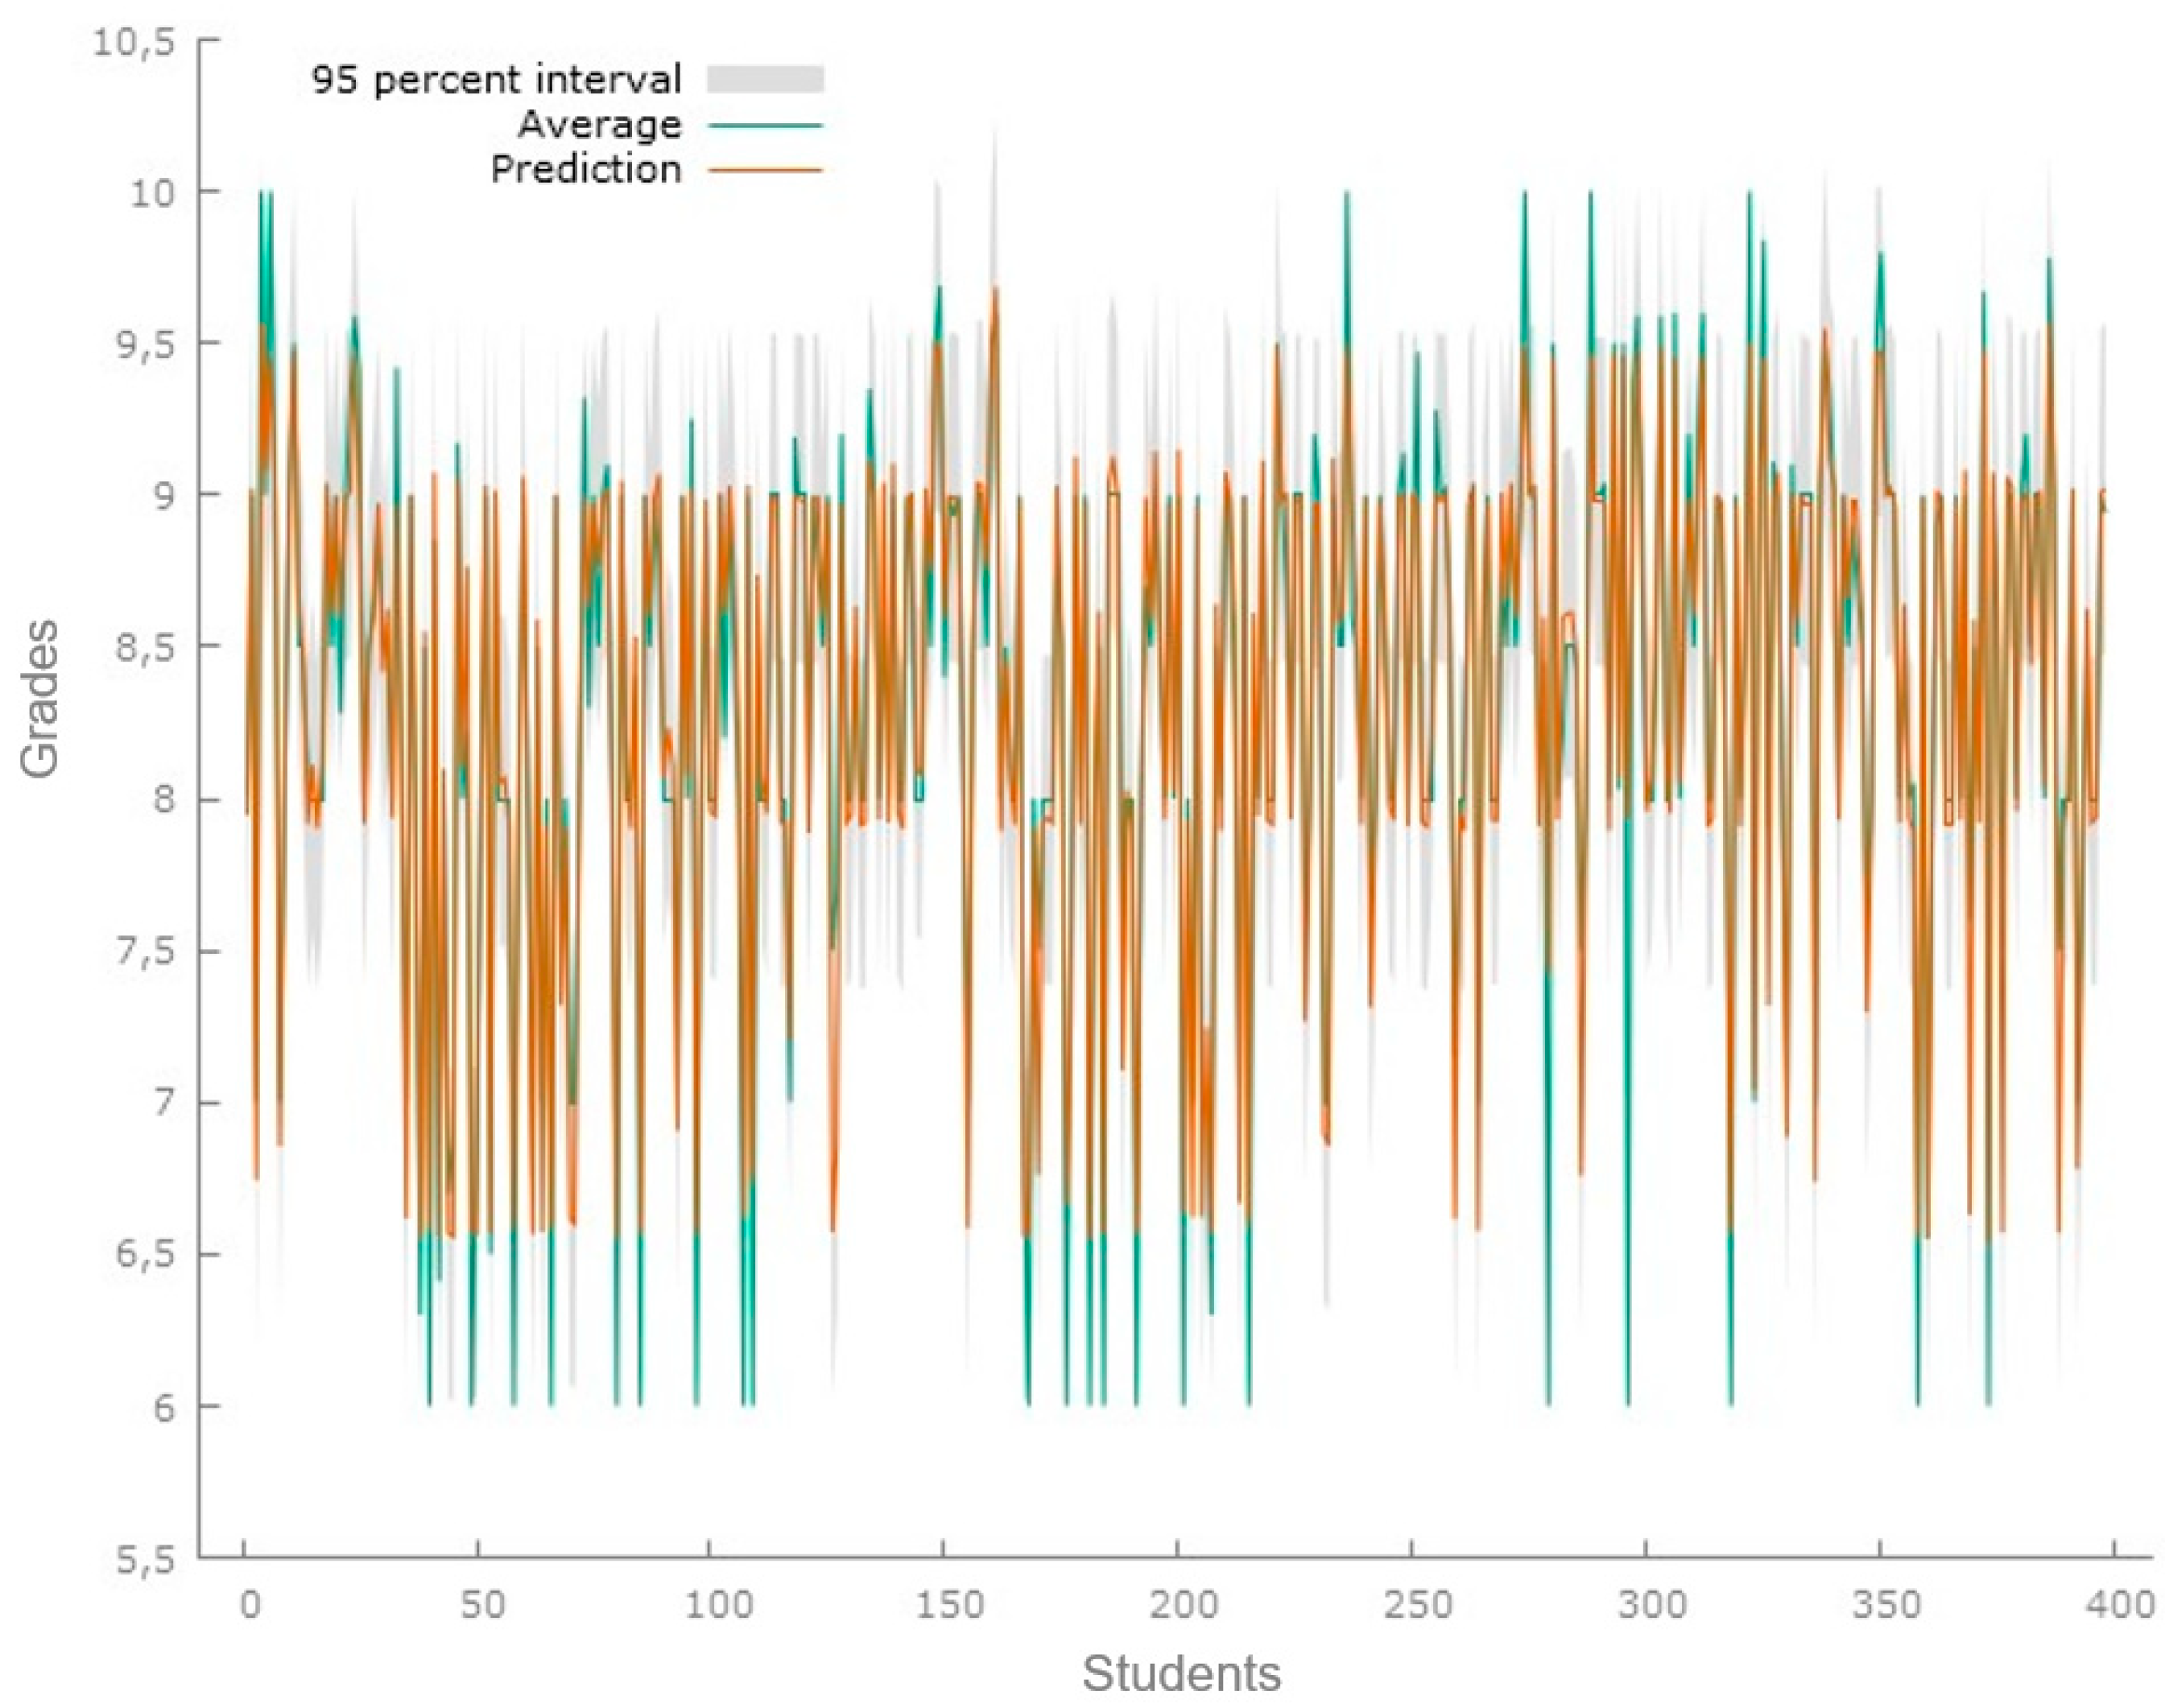
Figure 2 illustrates the predictions derived from the model for a sample consisting of 398 students.
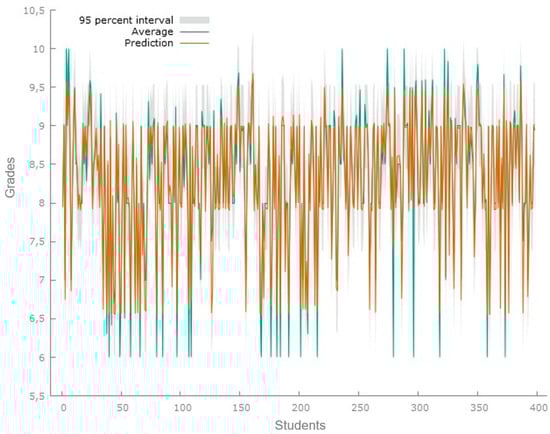
Figure 2.
Predicted grade point average second set. Predictions of the model applied to the data set of 398 students. Source: Gretl Software 1.9.4.
The results of the regression model for this data set show an R-squared of 0.9069; for this model, there are already four significant variables: age, hours, days, and tools or applications based on artificial intelligence. In this case, for the analysis of the predictions, a Theil’s U1 coefficient of 0.01628 was obtained, which suggests that there is low inequality in the analyzed distribution.
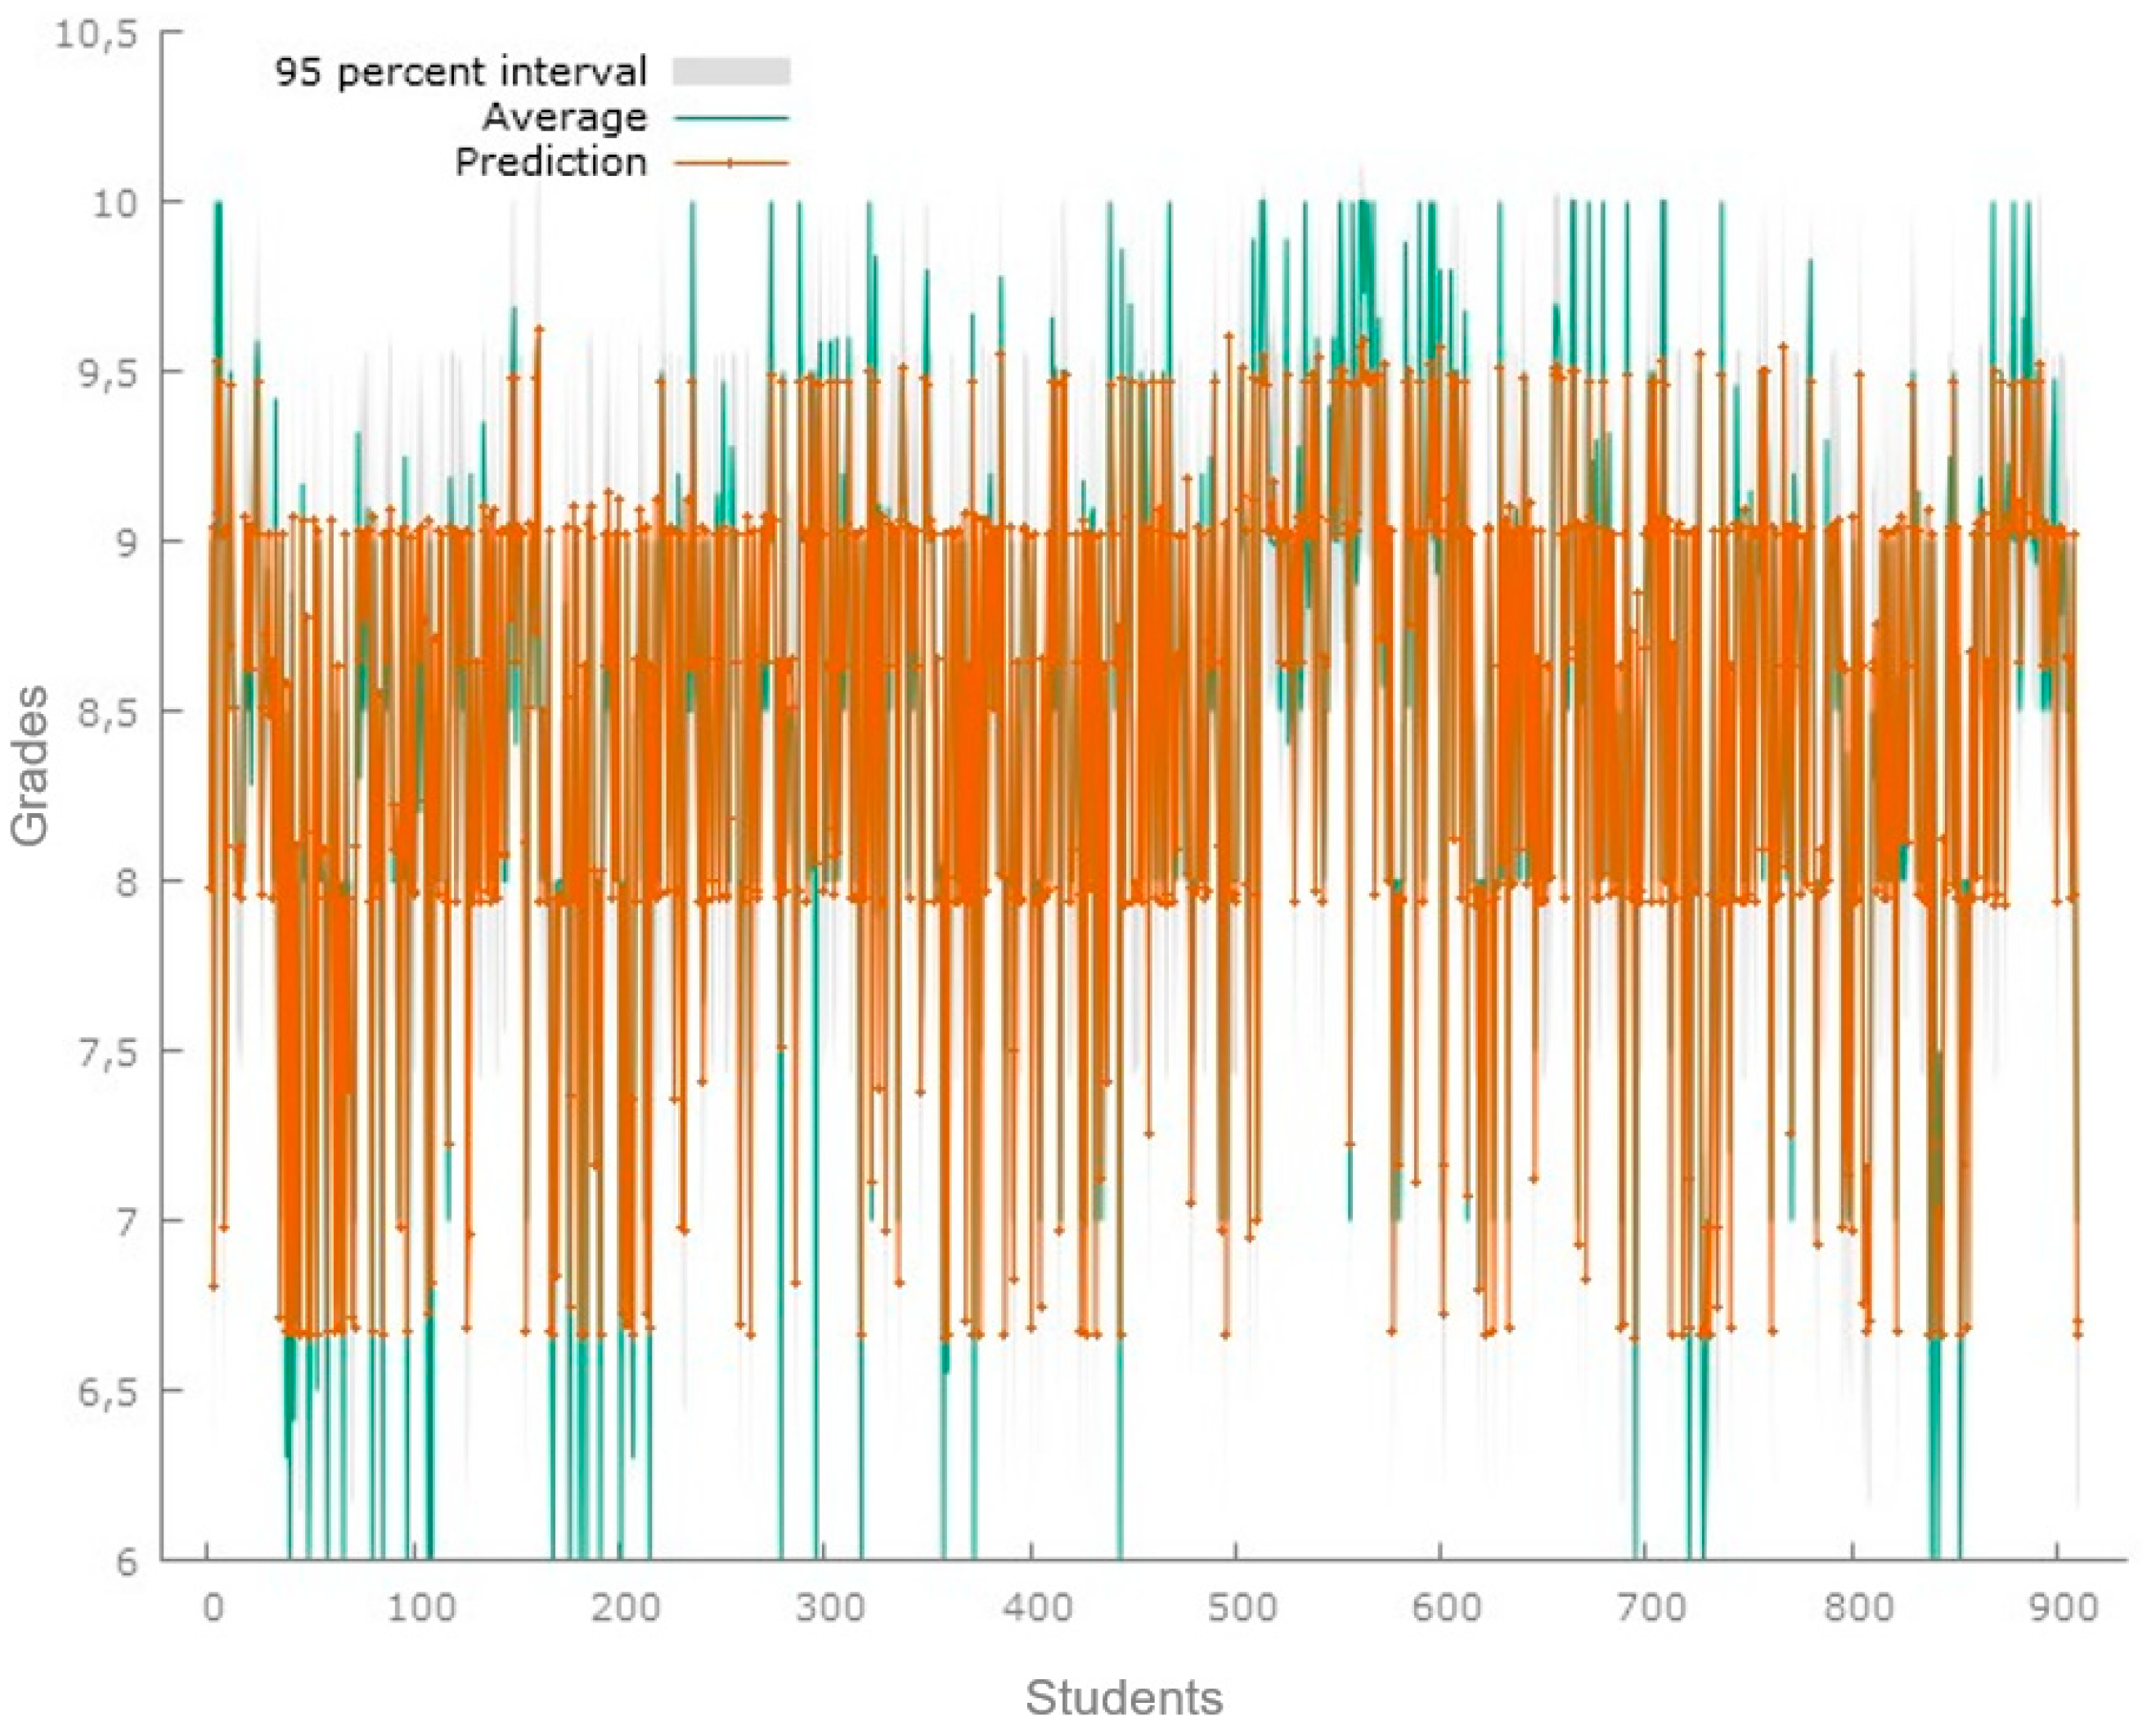
Figure 3 showcases the predictions produced from the model for a sample of 911 students. The results of the regression model for this data set show an R-squared of 0.9075; for this model, the significant variables are age, hours, days, and tools or applications based on artificial intelligence. In this case, for the analysis of the predictions, a Theil’s U1 coefficient of 0.0156 was obtained, which suggests that there is a low inequality in the analyzed distribution.
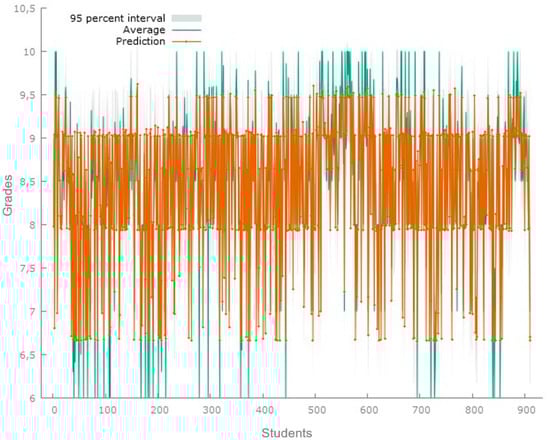
Figure 3.
Predicted grade point average third set. Predictions of the applied model for the data set of 911 students. Source: Gretl software 1.9.4.
The corresponding graphs for the three sets of students evaluate the accuracy of the model and show the actual values and the predicted values. The trend line fits the actual values, and the predicted values of the model are shown close to the trend line. The graphs allow us to identify the bias of the model; in this model, the values tend to underestimate the actual values, the predicted points are below the trend line, and the model is biased downward.
The model identifies the significant values for each of the five explanatory variables. The variables age, hours, days, and tools or applications, with a significance of 0.001%, are the variables that best fit the model, and their coefficients are positive, i.e., they are directly proportional to the average score (Table 2).
Table 2.
Multiple linear regression model.
When analyzing each of the variables, the coefficient of the constant is 5.88627, which suggests that when all other independent variables are zero, the dependent variable has a value of approximately 5.89 points. For the gender variable, the values indicate that there is no significant effect of gender on the dependent variable; this is because the p-value is greater than 0.05. However, since it has a negative coefficient, it is inverse to the assigned values; therefore, women are the best performers in the model.
On the other hand, the variable age presents a p-value of 0.0012. This suggests that the variable has a significant effect on academic performance since the p-value is less than 0.05. Thus, its associated coefficient is 0.0049758, which means that if the age variable is increased by one unit, on average, academic performance will increase by 0.0049758 units in response to that increase in age, keeping all other variables constant.
Similarly, the hours variable with a p-value < 0.0001 indicates that it has a highly significant effect on academic performance. Therefore, with an increase of one unit in the hours variable, on average, performance will increase by 0.248434 units due to the increase of one hour, keeping all other variables constant.
Similarly, the days variable presents a value of p < 0.0001, indicating a highly significant effect on academic performance. For this reason, with an increase of one unit in the days variable, on average, the performance will increase by 0.138942 units due to the increase of one day, keeping all other variables constant.
Finally, the tools and applications variable show a p-value < 0.0001, indicating it has a highly significant effect on academic performance. The increase of one unit in the tools and applications variable, on average, increases academic performance by 0.305412 units due to the increase of one tool or application, keeping all other variables constant.
Prediction Model Results
After ensuring that the model implemented was effective in prediction, a random selection of 100 students from the same university who had not previously participated in the research was carried out. The purpose was to predict the possible averages they would achieve at the end of their academic semester. The results of this projection are presented in Figure 4 and Table 3.
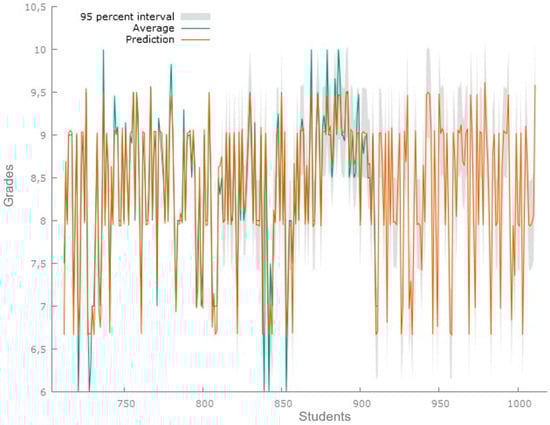
Figure 4.
Graph of actual averages and predicted averages using the prediction model. The prediction uses data from 100 final students, numbered 912 to 1012. Source: Gretl Software 1.9.4.
Table 3.
Prediction of student averages.
The analysis of the predictive model indicates a good predictive capacity. The mean error metrics, RMSE, and MAE presented values of −0.0089583, 0.33496, and 0.17996, respectively, highlighting an acceptable accuracy in the predictions. The mean percentage error and mean absolute percentage error showed −0.25107% and 2.3225%, evidencing a slight average underestimation. The Theil coefficient (U1) of 0.019655 reflected a low inequality in the distribution analyzed, i.e., the model shows a good fit.
4. Discussion
AI-assisted education encompasses intelligent education, innovative virtual learning, and data analysis and prediction. AI is taking on an increasingly pivotal role in education as learning demands are amplified. Smart educational systems offer tailored and timely instruction and feedback for educators and learners, aiming to enhance the value and efficiency of learning through computational technologies, particularly those related to machine learning, which closely ties with statistical models and the cognitive theory of learning. These systems incorporate various techniques for learning analysis, recommendations, and knowledge understanding, drawing on machine learning, data mining, and knowledge models. Typically, an AI education system consists of teaching content, data, and smart algorithms and can be divided into two parts: the system model (which includes the learner model, teaching model, and knowledge model) and smart technologies. These models are crucial in AI systems, as they establish structures and association rules for the gathered educational data, serving as the system’s core and being amplified by advanced technologies [49,50].
In the prediction model, gender does not have a significant effect on academic performance, but a negative coefficient was observed, suggesting that women tend to perform better in the proposed model. It is important to note that, although the effect did not reach statistical significance, this tendency towards better performance of women may be a relevant indication for future research. On the other hand, the results of Bowman [30] suggest that female students perform particularly favorably in mathematics, statistics, and computer science courses compared to male students. In addition, female students appear to benefit more when they have a female instructor. The data underscore the significance of gender representation in higher education and the associated implications of advancing gender equity and fostering female engagement in traditionally male-centric fields. In Matzavela and Alepis’ study, it was discerned that among students with outstanding grades, there was a higher proportion of females, and the majority hailed from high-income households [51]. For those with average and below-average grades, a significant influence of the parent’s educational level and income, as well as the student’s employment status, was noted on academic performance.
Regarding the results of Posso [31], they found that women face disadvantages compared to men in terms of access to technological resources and adequate spaces for study. This finding highlights the importance of addressing these barriers and ensuring equitable access to resources and technologies for all students, regardless of their gender. It can be identified that all studies suggest that gender may have some impact on students’ academic performance. These disadvantages could be contributing to the academic achievement gap between genders, even in contexts where no significant differences were found.
In the prediction model, the increase in age was found to have a significant and positive effect on students’ academic performance; however, Portillo [33] found the opposite result, where the increase in age negatively affected student performance. This discrepancy in the results could be due to several reasons. The differences are related to students’ learning and adaptive strategies as they age. In the Portillo [33] study, older students faced additional challenges in their process of adapting to the assessment system or academic content, resulting in a negative effect on their academic performance.
When compared to other studies, such as that by Waheed and colleagues [52], which utilized demographic and geographic features, and Ahmad and Shahzadi [53], which assessed study habits and learning skills, it was affirmed that these characteristics significantly impact students’ academic performance. Further, Costa-Mendes [54] and Cruz-Jesus [55] predicted student academic performance based on variables such as income, age, employment, cultural level indicators, place of residence, and socioeconomic information. Therefore, predictive models offer institutions and educators a valuable opportunity to implement more tailored and successful educational strategies.
Comparing the results of Dhiman [36] and Gonzales [56], it is evident that variable hours have a highly significant impact on students’ academic performance. The results of the prediction model denote that hours have a significant effect on academic performance; this observation aligns with Gonzalez’s assertions [56] pointed out in their study, where they found that only a relatively low percentage of students reviewed the studied material from 4 to 8 h and a large proportion of students waited until the exam date was set to start studying. These findings indicate that many students could not be devoting enough time to study outside the classroom, which could negatively affect their academic performance.
The results obtained are consistent with what Dhiman [36] found in his study on the negative impact of the use of social networks and mobile applications on academic performance. When considering that the increase in the use of social networks could decrease the time students dedicate to study, it is reasonable to infer that this phenomenon could be related to a reduction in academic performance. These results indicate that the time dedicated to study outside the classroom, represented by the variable hours, is a highly significant factor in the academic performance of students. Increasing the time spent studying can have a positive impact on academic performance and help improve academic outcomes.
When comparing the results of Faura [57] with the findings obtained, it is noteworthy that both studies corroborate that the variable days have a highly significant impact on students’ academic performance. In the predictive model, the average academic performance will increase by 0.138942 units for each additional day dedicated to studying, keeping all the other variables of the model constant. This is consistent with what Faura [57] noted in their study during the COVID-19 pandemic, where students faced an unprecedented online learning situation. In this context, the increase in days spent studying could have been a response to the need to adapt to the new virtual learning environment and the search for better academic results. Combining the results of both studies suggests that time spent studying is a key factor for academic success, regardless of the context in which students find themselves. Increasing study time can lead to improved academic performance if it is accompanied by effective study strategies and good time management.
The results obtained in the research show that the tools and applications variable have a highly significant impact on students’ academic performance. These results are consistent with the findings of Zamora [58] and De Jesús Araiza and García [39], who also highlighted the positive impact of technological tools on students’ academic performance. In particular, the study by Zamora [58] showed that virtual reality tools generate improvements in academic performance, while De Jesús Araiza and García [39] found that LMS platforms, which can include various tools and applications, have a significant impact on academic performance.
The increase in academic performance associated with the tools and applications variable may be related to several factors. The use of educational technologies can provide more interactive learning experiences, allow faster and easier access to educational resources, and facilitate communication between students and teachers. These aspects can contribute to greater student engagement and motivation, which in turn translates into better academic performance.
The results obtained in the prediction model are supported by and coincide with the findings of Jiao [25] and Incio and Capuñay [26], strengthening the validity and relevance of the predictions. Jiao [25] identified that the dominant variables in academic performance are knowledge acquisition, class participation, and summative performance. These findings support the results, where the variables hours, days, and tools or applications probably reflect knowledge acquisition and dedication to the learning process. The positive relationship between these variables and academic performance is consistent with the importance that Jiao [25] assigned to these variables in their prediction model.
In the same vein, Jiao [25] mentions that prior knowledge seems to play a key role in academic performance. This is also reflected in the results obtained, where the age variable shows statistical significance, indicating that prior knowledge, indirectly represented by age, has a direct effect on academic performance.
On the other hand, the results of Incio and Capuñay [26] reinforce the effectiveness of the predictive model in using endogenous and exogenous factors to predict students’ academic performance. The consideration of the mean square error and weighted correlation coefficient during model training, validation, and testing demonstrates a rigorous approach to model evaluation and fitting. The results obtained on the model accuracy metrics show a consistent pattern as the number of students in the sample increases. A mean square error of 0.26 was obtained in agreement with the predictive model fit of Incio and Capuñay [26], who performed it considering the mean square error of 0.27 and the weighted correlation coefficient during training, validation and testing of 0.92. This pattern is consistent with the statistical principle that a larger sample size tends to provide more accurate and representative estimates of the population. It is important to note that while increasing the sample size may improve the accuracy of the model, it is critical to ensure that the sample is representative and diverse.
5. Conclusions
The predictive model used shows that academic performance is significantly influenced by the variables age, hours, days, and tools or applications. In addition to statistical significance, the magnitude and direction of the coefficients were evaluated, revealing that their relationship is directly proportional to academic performance. The p-values, all very low, indicate high statistical significance, suggesting that these variables have a significant impact on academic performance, and changes in them translate into changes in performance.
In general, the predictive model used shows an ability to explain the variability of academic performance across the independent variables considered. It has been confirmed that the variables age, hours, days, and tools or applications have a significant impact on academic performance. These findings highlight the importance of adequately considering and valuing the variables that really influence academic performance, thus providing a solid basis for future research and the development of more effective and personalized educational strategies.
The predictive model implemented in this research was based on solid theoretical foundations, which provides greater validity as it is framed by previous research. Thanks to this foundation, the model has demonstrated its ability to accurately predict the academic performance outcomes of students at the University of Guayaquil. By considering relevant endogenous and exogenous factors, the model provides a reliable and effective tool to anticipate students’ academic performance, which offers an invaluable opportunity to implement more personalized and successful educational strategies in higher education.
Despite the predictive model’s demonstrated ability to explain the variability in academic performance based on variables such as age, hours, days, and tools or applications, it is essential to acknowledge its inherent limitations. These stem from its reliance on specific theoretical underpinnings and its focus on the University of Guayaquil, which might limit its generalizability to other contexts. Nevertheless, this study sets a valuable precedent and establishes a benchmark for future research aiming to expand and adapt the model to different educational settings.
Author Contributions
Conceptualization, S.P.-M.; methodology, C.G. and A.M.-A.; software, S.P.-M. and C.G.; validation, S.P.-M., C.G. and J.F.-E.; formal analysis, S.P.-M., A.M.-A. and J.F.-E.; investigation, S.P.-M., C.G., A.M.-A. and J.F.-E.; resources S.P.-M. and C.G.; data curation, C.G.; writing—original draft preparation, S.P.-M. and A.M.-A.; writing—review and editing, S.P.-M., C.G. and A.M.-A.; visualization, C.G. and J.F.-E.; project administration, S.P.-M.; funding acquisition, C.G. All authors have read and agreed to the published version of the manuscript.
Funding
This study was supported by Universidad Tecnológica Indoamérica from Ecuador.
Institutional Review Board Statement
The study was conducted in accordance with the Declaration of Helsinki, and approved by the Ethics Committee of Comité de Ética Universidad Indoamérica (protocol code: Office UTI-IIDI-143-2021; date of approval: 20 September 2021).
Informed Consent Statement
Informed consent was obtained from all subjects involved in the study.
Data Availability Statement
Not applicable.
Conflicts of Interest
The authors declare no conflict of interest.
Appendix A
Table A1.
Questionnaire.
Table A1.
Questionnaire.
| A. Age |
| B. Gender |
| Are you familiar with or have you heard about artificial intelligence? |
| ○ Yes |
| ○ No |
| ○ Maybe |
| Do you use applications or tools with artificial intelligence in your daily life? |
| ○ Yes |
| ○ No |
| ○ Maybe |
| Do you believe that artificial intelligence aids in the progress and efficiency of individuals? |
| ○ Yes |
| ○ No |
| ○ Maybe |
| Are the outcomes and decisions generated by artificial intelligence systems easily understandable and explainable? |
| ○ Strongly disagree |
| ○ Disagree |
| ○ Neither agree nor disagree |
| ○ Agree |
| ○ Strongly agree |
| Am I well-informed about how the artificial intelligence models used in my field of study function? |
| ○ Strongly disagree |
| ○ Disagree |
| ○ Neither agree nor disagree |
| ○ Agree |
| ○ Strongly agree |
| Should measures be taken to ensure that artificial intelligence is used ethically and, in a manner, respectful of fundamental rights and values? |
| ○ Strongly disagree |
| ○ Disagree |
| ○ Neither agree nor disagree |
| ○ Agree |
| ○ Strongly agree |
| Should the existing ethical principles and regulations that apply to the development and use of artificial intelligence be disseminated in my field of study? |
| ○ Strongly disagree |
| ○ Disagree |
| ○ Neither agree nor disagree |
| ○ Agree |
| ○ Strongly agree |
| Do artificial intelligence systems respect my autonomy and allow me to have control over decisions that directly affect me? |
| ○ Strongly disagree |
| ○ Disagree |
| ○ Neither agree nor disagree |
| ○ Agree |
| ○ Strongly agree |
| Is it important to evaluate the benefits associated with the use of artificial intelligence in my field of study? |
| ○ Strongly disagree |
| ○ Disagree |
| ○ Neither agree nor disagree |
| ○ Agree |
| ○ Strongly agree |
| Has artificial intelligence allowed for process optimization and more efficient task completion in contexts where it has been implemented? |
| ○ Strongly disagree |
| ○ Disagree |
| ○ Neither agree nor disagree |
| ○ Agree |
| ○ Strongly agree |
| Has artificial intelligence enabled me to achieve more accurate and reliable outcomes compared to traditional or previous methods? |
| ○ Strongly disagree |
| ○ Disagree |
| ○ Neither agree nor disagree |
| ○ Agree |
| ○ Strongly agree |
| Has artificial intelligence been a useful tool in supporting decision-making in complex situations or with large data sets in my educational context? |
| ○ Strongly disagree |
| ○ Disagree |
| ○ Neither agree nor disagree |
| ○ Agree |
| ○ Strongly agree |
| Have I had the opportunity to participate in artificial intelligence technology research or development projects funded by external bodies or academic institutions during my higher education studies? |
| ○ Yes |
| ○ No |
| Do you believe that tools with artificial intelligence influence your academic performance? |
| ○ Yes |
| ○ No |
| How many days a week do you use artificial intelligence tools for academic activities? |
| ○ 1 day |
| ○ 2 days |
| ○ 3 days |
| ○ 4 days |
| ○ 5 days |
| ○ 6 days |
| ○ 7 days |
| How many hours a week do you use artificial intelligence tools for academic activities? |
| ○ 1–5 |
| ○ 5–10 |
| ○ 10–20 |
| ○ More than 20 |
| How many artificial intelligence tools or applications do you use for your academic activities? |
| ○ 1 |
| ○ 2 |
| ○ 3 |
| ○ 4 |
| ○ 5 or more |
| What is your grade average for the current academic cycle? |
| ………………………… |
References
- Salas-Pilco, S.Z.; Yang, Y. Artificial intelligence applications in Latin American higher education: A systematic review. Int. J. Educ. Technol. High. Educ. 2022, 19, 21. [Google Scholar] [CrossRef]
- Khan, I.; Ahmad, A.R.; Jabeur, N.; Mahdi, M.N. An artificial intelligence approach to monitor student performance and devise preventive measures. Smart Learn. Environ. 2021, 8, 17. [Google Scholar] [CrossRef]
- Bonilla-Jurado, D.; Zambrano, R.; Moncayo, H. Desarrollo profesional continuo de docentes para actividades en los Institutos Tecnológicos: Una revisión literaria. Rev. Científica UISRAEL 2023, 10, 27–39. [Google Scholar] [CrossRef]
- Hwang, G.J.; Xie, H.; Wah, B.W.; Gašević, D. Vision, challenges, roles and research issues of Artificial Intelligence in Education. Comput. Educ. Artif. Intell. 2020, 1, 100001. [Google Scholar] [CrossRef]
- Stadlman, M.; Salili, S.M.; Borgaonkar, A.D.; Miri, A.K. Artificial Intelligence Based Model for Prediction of Students’ Performance: A Case Study of Synchronous Online Courses during the COVID-19 Pandemic. J. STEM Educ. 2022, 23, 39–46. Available online: https://www.proquest.com/docview/2680630973/4E92CB5712D34224PQ/2?accountid=142712 (accessed on 6 September 2023).
- Alqahtani, T.; Badreldin, H.A.; Alrashed, M.; Alshaya, A.I.; Alghamdi, S.S.; bin Saleh, K.; Alowais, S.A.; Alshaya, O.A.; Rahman, I.; Al Yami, M.S.; et al. The emergent role of artificial intelligence, natural learning processing, and large language models in higher education and research. Res. Soc. Adm. Pharm. 2023, 19, 1236–1242. [Google Scholar] [CrossRef]
- Mora, E.; Bonilla-Jurado, D.; Núñez, L.; Sarmiento, J. Inadaptabilidad de los Docentes al Manejo de Plataformas Virtuales: Caso EducarEcuador. Rev. Conrado 2018, 14, 83–90. Available online: http://conrado.ucf.edu.cu/index.php/conrado (accessed on 8 September 2023).
- Dai, Y.; Liu, A.; Lim, P.C. Reconceptualizing ChatGPT and generative AI as a student-driven innovation in higher education. Procedia CIRP 2023, 119, 84–90. [Google Scholar] [CrossRef]
- Al Ka’bi, A. Proposed artificial intelligence algorithm and deep learning techniques for development of higher education. Int. J. Intell. Netw. 2023, 4, 68–73. [Google Scholar] [CrossRef]
- Gordillo-Tenorio, W.; Meléndez-Flores, C.; Sierra-Liñan, F.; Cabanillas-Carbonell, M. Information Technologies that Help Improve Academic Performance, A Review of the Literature. Int. J. Emerg. Technol. Learn. 2023, 18, 262–279. [Google Scholar] [CrossRef]
- Hanaysha, J.R.; Shriedeh, F.B.; In’airat, M. Impact of classroom environment, teacher competency, information and communication technology resources, and university facilities on student engagement and academic performance. Int. J. Inf. Manag. Data Insights 2023, 3, 100188. [Google Scholar] [CrossRef]
- Alfalah, A.A. Factors influencing students’ adoption and use of mobile learning management systems (m-LMSs): A quantitative study of Saudi Arabia. Int. J. Inf. Manag. Data Insights 2023, 3, 100143. [Google Scholar] [CrossRef]
- Melo, E.; Silva, I.; Costa, D.G.; Viegas, C.M.D.; Barros, T.M. On the Use of eXplainable Artificial Intelligence to Evaluate School Dropout. Educ. Sci. 2022, 12, 845. [Google Scholar] [CrossRef]
- Barvinski, C.; Ferreira, G.; Machado, L.; Longhi, M.; Behar, P. Construction of a socio-affective profile model of students in a virtual learning environment. In Smart Education and e-Learning; Smart Innovation, Systems and Technologies; Uskov, V.L., Howlett, R.J., Jain, L.C., Eds.; Springer Science and Business Media Deutschland GmbH: Porto Alegre, Brazil, 2019; pp. 159–168. [Google Scholar] [CrossRef]
- Palacios, A.; Pascual, V.; Moreno-Mediavilla, D. The role of new technologies in STEM education. Bordon. Rev. De Pedagog. 2022, 74, 11–21. [Google Scholar] [CrossRef]
- Tauber, Z.; Lacey, H.; Lichnovska, R.; Erdosova, B.; Zizka, R.; Sedy, J.; Cizkova, K. Students’ preparedness, learning habits and the greatest difficulties in studying Histology in the digital era: A comparison between students of general and dental schools. Eur. J. Dent. Educ. 2021, 25, 371–376. [Google Scholar] [CrossRef]
- Hinojo-Lucena, F.J.; Aznar-Díaz, I.; Cáceres-Reche, M.P.; Romero-Rodríguez, J.M. Artificial intelligence in higher education: A bibliometric study on its impact in the scientific literature. Educ. Sci. 2019, 9, 51. [Google Scholar] [CrossRef]
- Díaz-Serrano, J.; Alfageme-González, M.B.; Cutanda-López, M.T. Interacción del rendimiento académico con los estilos de aprendizaje y de enseñanza. Rev. Electrónica Interuniv. De Form. Del Profr. 2022, 25, 145–160. [Google Scholar] [CrossRef]
- Wang, Y. Artificial Intelligence Technologies in College English Translation Teaching. J. Psycholinguist. Res. 2023, 52, 1525–1544. [Google Scholar] [CrossRef]
- Jeon, J.; Lee, S. Large language models in education: A focus on the complementary relationship between human teachers and ChatGPT. Educ. Inf. Technol. 2023, 1–20. [Google Scholar] [CrossRef]
- Lin, H. Influences of Artificial Intelligence in Education on Teaching Effectiveness. Int. J. Emerg. Technol. Learn. 2022, 17, 144–156. [Google Scholar] [CrossRef]
- Rodríguez, M.d.L.F.; Suelves, D.M.; Méndez, V.G.; Mas, J.A.R.-L. Profesorado universitario. ¿Consumidor o productor de contenidos digitales educativos? Rev. Electrónica Interuniv. De Form. Del Profr. 2023, 26, 13–25. [Google Scholar] [CrossRef]
- Phan, M.; De Caigny, A.; Coussement, K. A decision support framework to incorporate textual data for early student dropout prediction in higher education. Decis. Support Syst. 2023, 168, 113940. [Google Scholar] [CrossRef]
- Roselló, L.A.; Rodicio, C.I.F.; Suarez, D.C.R. Diferencias en las percepciones del alumnado universitario sobre apoyos docentes según metodología, grado de estudios y edad. Rev. Electrónica Interuniv. De Form. Del Profr. 2023, 26, 193–205. [Google Scholar] [CrossRef]
- Jiao, P.; Ouyang, F.; Zhang, Q.; Alavi, A.H. Artificial intelligence-enabled prediction model of student academic performance in online engineering education. Artif. Intell. Rev. 2022, 55, 6321–6344. [Google Scholar] [CrossRef]
- Flores, F.A.I.; Sanchez, D.L.C. Factores endógenos y exógenos para el modelado y predicción del rendimiento académico de estudiantes universitarios. Rev. Electrónica Interuniv. Form. Profr. 2023, 26, 233–247. [Google Scholar] [CrossRef]
- Ouyang, F.; Wu, M.; Zheng, L.; Zhang, L.; Jiao, P. Integration of artificial intelligence performance prediction and learning analytics to improve student learning in online engineering course. Int. J. Educ. Technol. High. Educ. 2023, 20, 4. [Google Scholar] [CrossRef]
- Xing, W.; Du, D.; Bakhshi, A.; Chiu, K.; Du, H. Designing a Transferable Predictive Model for Online Learning Using a Bayesian Updating Approach. IEEE Trans. Learn. Technol. 2021, 14, 474–485. [Google Scholar] [CrossRef]
- Verdugo-Castro, S.; García-Holgado, A.; Sánchez-Gómez, M.C. The gender gap in higher STEM studies: A systematic literature review. Heliyon 2022, 8, e10300. [Google Scholar] [CrossRef]
- Bowman, N.A.; Logel, C.; LaCosse, J.; Jarratt, L.; Canning, E.A.; Emerson, K.T.U.; Murphy, M.C. Gender representation and academic achievement among STEM-interested students in college STEM courses. J. Res. Sci. Teach. 2022, 59, 1876–1900. [Google Scholar] [CrossRef]
- Posso-Yépez, M.; León-Ron, V.; Narváez-Olmedo, G.; Posso-Astudillo, M. Perspectivas de género y condiciones de aprendizajes virtuales en pandemia. Rev. Electron. Interuniv. Form. Profr. 2022, 25, 27–41. [Google Scholar] [CrossRef]
- Wang, Q.; Xue, M. The implications of expectancy-value theory of motivation in language education. Front. Psychol. 2022, 13, 992372. [Google Scholar] [CrossRef] [PubMed]
- Portillo-Tarragona, P.; Marín-Vinuesa, L.M.; Scarpellini, S. La Edad y el Rendimiento Académico Universitario. In La Innovación Docente Como Misión del Profesorado. Actas del IV Congreso Internacional Sobre Aprendizaje, Innovación y Competitividad, CINAIC; Universidad de Zaragoza: Zaragoza, Spain, 2017; pp. 28–33. [Google Scholar] [CrossRef]
- Mao, Z.; Lee, I. Researching L2 Student Engagement with Written Feedback: Insights from Sociocultural Theory. TESOL Q. 2022, 56, 788–798. [Google Scholar] [CrossRef]
- Alonso-Tapia, J.; Merino-Tejedor, E.; Huertas, J.A. Academic engagement: Assessment, conditions, and effects-a study in higher education from the perspective of the person-situation interaction. Eur. J. Psychol. Educ. 2023, 38, 631–655. [Google Scholar] [CrossRef]
- Dhiman, B. Use and impact of social media on academic performance of kurukshetra university students: A case study. SSRN Electron. J. 2022, 2–11. [Google Scholar] [CrossRef]
- Tamura, N.; Komada, Y.; Inoue, Y.; Tanaka, H. Social jetlag among Japanese adolescents: Association with irritable mood, daytime sleepiness, fatigue, and poor academic performance. Chronobiol. Int. 2022, 39, 311–322. [Google Scholar] [CrossRef] [PubMed]
- Neroni, J.; Meijs, C.; Gijselaers, H.J.M.; Kirschner, P.A.; de Groot, R.H.M. Learning strategies and academic performance in distance education. Learn. Individ. Differ. 2019, 73, 1–7. [Google Scholar] [CrossRef]
- De Jesús Araiza, M.; García, M. Impact of an LMS Platform on the academic performance of postgraduate students: A study from data analytics. Int. J. Technol. Learn. 2021, 28, 75–91. [Google Scholar] [CrossRef]
- Sinchigalo, R.; Guzmán, B.; Bonilla-Jurado, D. Bienestar emocional y rendimiento académico en estudiantes universitarios: Relación bidimensional y su impacto en las estrategias de apoyo. J. Sci. Res. 2022, 7, 71–95. [Google Scholar] [CrossRef]
- Arroba-Freire, E.; Bonilla-Jurado, D.; Guevara, C.; Ramírez-Casco, A. Factor Analysis: An Application of the Digital Competencies Questionnaire in Students of the Business Administration Career of the Instituto Tecnológico Superior España (ISTE). J. High. Educ. Theory Pract. 2022, 22, 201. Available online: https://www.proquest.com/openview/af6b578412f4d52d45ee53e344ed429a/1?pq-origsite=gscholar&cbl=766331 (accessed on 12 September 2023).
- Cressie, N.; Moores, M.T. Spatial Statistics. In BT-Encyclopedia of Mathematical Geosciences; Sagar, B.S.D., Cheng, Q., McKinley, J., Agterberg, F., Eds.; Springer International Publishing: Cham, Switzerland, 2020; pp. 1–11. [Google Scholar] [CrossRef]
- Hernández-Sampieri, R.; Mendoza, C. Metodología de la Investigación: Las Rutas Cuantitativa, Cualitativa y Mixta; MacGraw Hill Education: Mexico City, Mexico, 2018. [Google Scholar]
- Hamoud, A.; Salah, A.; Aqeel, W. Predicting Student Performance in Higher Education Institutions Using Decision Tree Analysis. Int. J. Interact. Multimed. Artif. Intell. 2018, 5, 26–31. [Google Scholar] [CrossRef]
- Mensah, R.O.; Quansah, C.; Oteng, B.; Nettey, J.N.A. Assessing the effect of information and communication technology usage on high school student’s academic performance in a developing country. Cogent Educ. 2023, 10, 2188809. [Google Scholar] [CrossRef]
- Ionescu, R.V.; Zlati, M.L.; Antohi, V.M.; Stanciu, S. Reduced inequalities as factor of sustainable development: The analysis under econometric models. Sustainability 2018, 10, 3523. [Google Scholar] [CrossRef]
- Floryan, D.; Graham, M.D. Data driven discovery of intrinsic dynamics. Nat. Mach. Intell. 2022, 4, 1113–1120. [Google Scholar] [CrossRef]
- Saha, S.; Gao, J.; Gerlach, R. A survey of the application of graph-based approaches in stock market analysis and prediction. Int. J. Data Sci. Anal. 2022, 14, 1–15. [Google Scholar] [CrossRef]
- Chen, L.; Chen, P.; Lin, Z. Artificial Intelligence in Education: A Review. IEEE Access 2020, 8, 75264–75278. [Google Scholar] [CrossRef]
- Popenici, S.A.D.; Kerr, S. Exploring the impact of artificial intelligence on teaching and learning in higher education. Res. Pract. Technol. Enhanc. Learn. 2017, 12, 22. [Google Scholar] [CrossRef]
- Matzavela, V.; Alepis, E. Decision tree learning through a Predictive Model for Student Academic Performance in Intelligent M-Learning environments. Comput. Educ. Artif. Intell. 2021, 2, 100035. [Google Scholar] [CrossRef]
- Waheed, H.; Hassan, S.U.; Aljohani, N.R.; Hardman, J.; Alelyani, S.; Nawaz, R. Predicting academic performance of students from VLE big data using deep learning models. Comput. Hum. Behav. 2020, 104, 106189. [Google Scholar] [CrossRef]
- Ahmad, Z.; Shahzadi, E. Prediction of Students’ Academic Performance using Artificial Neural Network. Bull. Educ. Res. 2018, 40, 157–164. Available online: https://eric.ed.gov/?id=EJ1209686 (accessed on 7 September 2023).
- Costa-Mendes, R.; Oliveira, T.; Castelli, M.; Cruz-Jesus, F. A machine learning approximation of the 2015 Portuguese high school student grades: A hybrid approach. Educ. Inf. Technol. 2021, 26, 1527–1547. [Google Scholar] [CrossRef]
- Cruz-Jesus, F.; Castelli, M.; Oliveira, T.; Mendes, R.; Nunes, C.; Sa-Velho, M.; Rosa-Louro, A. Using artificial intelligence methods to assess academic achievement in public high schools of a European Union country. Heliyon 2020, 6, e04081. [Google Scholar] [CrossRef] [PubMed]
- Gonzales, E.; Tafur, A.; Figueroa, M.; Ames, E. Academic Performance and Study Habits in Higher Educa. Rev. Conrado 2021, 17, 17–27. Available online: http://scielo.sld.cu/pdf/rc/v17n81/1990-8644-rc-17-81-17.pdf (accessed on 8 September 2023).
- Faura-Martínez, U.; Lafuente-Lechuga, M.; Cifuentes-Faura, J. Sustainability of the Spanish university system during the pandemic caused by COVID-19. Educ. Rev. 2022, 74, 645–663. [Google Scholar] [CrossRef]
- Zamora-Antuñano, M.A.; Barros-Baertl, R.; Tovar-Luna, B.; González-Gutiérrez, C.A.; Mendez-Lozano, N.E.; Cruz-Perez, M.Á. The use of augmented reality to strengthen competence in data analysis and problem solving in engineering students at the Universidad del Valle de México. Educ. Sci. 2022, 12, 755. [Google Scholar] [CrossRef]

Disclaimer/Publisher’s Note: The statements, opinions and data contained in all publications are solely those of the individual author(s) and contributor(s) and not of MDPI and/or the editor(s). MDPI and/or the editor(s) disclaim responsibility for any injury to people or property resulting from any ideas, methods, instructions or products referred to in the content. |
© 2023 by the authors. Licensee MDPI, Basel, Switzerland. This article is an open access article distributed under the terms and conditions of the Creative Commons Attribution (CC BY) license (https://creativecommons.org/licenses/by/4.0/).