Article

Understanding Influencers of College Major Decision: The UAE Case

1
College of Interdisciplinary Studies, Zayed University, Abu Dhabi P.O. Box 144534, United Arab Emirates
2
College of Technological Innovation, Zayed University, Abu Dhabi P.O. Box 144534, United Arab Emirates
3
College of Computer and Information Sciences, Princess Nourah bint Abdulrahman University, Riyadh 11671, Saudi Arabia
*
Author to whom correspondence should be addressed.
Educ. Sci. 2023, 13(1), 39; https://doi.org/10.3390/educsci13010039
Submission received: 20 October 2022 / Revised: 17 December 2022 / Accepted: 26 December 2022 / Published: 30 December 2022
(This article belongs to the Special Issue Transition to Higher Education: Challenges and Opportunities)

Abstract

:
This study aims to understand and analyze what influences female students to choose a college major in the United Arab Emirates (UAE). To accomplish our target, we conducted a survey with mostly female first-year undergraduate students (N = 496) at Zayed University to understand the personal, social, and financial factors influencing students’ major choices. Further, this study also asked students to specify their actions before deciding on their major and assessed the information that could be helpful for future students to decide on their majors. Last, the study investigated how Science, Technology, Engineering, and Mathematics (STEM) students differ from other students in their major decision. The results show that financial factors such as income and business opportunities related to the major are crucial. Further, gender suitability for the job and passion are influential. Students conduct internet searches, use social media, and read brochures in the process of major decisions. Moreover, students think job alignment with the UAE vision and information related to job availability, income, and skills are critical for future students to decide on their major. Finally, STEM students are more influenced by business opportunities, prestige, and career advancement than others.

1. Introduction

Higher education (HE) continues to grow globally. Indeed, a recent study projects the global demand for HE to grow through 2040. Further, the study predicts that nearly 600 million students will be enrolled in universities worldwide by 2040 [1]. The demand for HE comes as no surprise since it contributes to economic growth by enhancing individuals’ productivity, thereby increasing their human capital stock [2,3]. In the United Arab Emirates (UAE), HE has tremendously grown since founding its first university in 1976 [4], as the country has actively supported and invested in HE [5]. Further, the UAE has attracted several well-reputed foreign universities to establish campuses [6]. The UAE’s investment in HE aligns with its commitment to a knowledge-based society [7].
Despite the growing demand for HE globally and in the UAE, some students find selecting a college major stressful [8]. Research suggests that many students base their decision on college majors on assumptions rather than facts [9,10]. Students’ inability to successfully select what and where to study may greatly impact returns of higher education [10], and the labor market [11]. Thus, understanding how students choose their majors and what influences them will allow policymakers to define appropriate measures and incentives for labor supply adjustments based on market needs and other strategic goals [12].
Several studies have investigated what influences students’ decisions of major and university. For instance, a study in Poland has found that social factors are influential [13], while a study conducted in Canada identified earnings as an essential factor [14]. Other studies determined that gender, personal interest [15], and enrollment criteria [16], are crucial in the major selection process. In general, there is an agreement on the impact of gender and earnings on major selection. However, varied findings are available on the effect of social factors and students’ abilities [12].
Despite abundant global studies on major choice determinants, only a few studies approached the topic in the UAE context. The UAE context is unique as the country has rapidly developed over the last few decades and is now transitioning into a knowledge-based economy. Thus, the UAE seeks to provide an educated and qualified workforce, which will resume the economic development of the country [17]. Amongst the few relevant studies conducted in the UAE is a study completed by Davies et al. [18], who assessed the motives behind students’ choices of business majors in multiple countries, including the UAE. The findings point to parental pressure and reputation, among other motives. Another study by Makhmasi et al. [19] discussed factors influencing students’ choice of Science, Technology, Engineering, and Mathematics (STEM) fields. The study cites passion and expected earnings as influential motives. Hammour studied the correlation between UAE students’ intentions to major in accounting and their attitudes towards and perceived behavioral control [20]. While these studies have contributed to the body of literature, they concentrated on specific majors [18,19,20]. Further, rather than analyzing the factors influencing the students’ major decisions, the studies had a specific objective in mind, such as comparing students from different countries [18] or correlating students’ attitudes with intentions of majoring [20].
This study analyzes, explains, and evaluates the major choice of mostly female students at Zayed University. This study uses descriptive and inferential statistics to assess the personal, social, and financial influences on students’ major choices. Further, the study explores the actions and data required by students to make well-informed major decisions. Moreover, the study uncovers information helpful for future students to decide their majors. Last, the study assesses how STEM students differ in what influences their major selection decision.

2. Literature Review

Several researchers discussed how students select their college major. The literature sheds light on the various factors influencing students’ major decisions.

2.1. Social Pressure and Self-Motivation

We define social pressure as the influence of family members, friends, or teachers’ opinions on students’ major decisions. Research regarding family and peer pressure shows different trends. For instance, according to a survey conducted in Saudi Arabia [21], peer and family pressure has little influence on students in selecting their majors. Interestingly, two studies conducted in the U.S. [22] and Sri Lanka [23] also found that parents and guardians are less influential than other factors. However, a study conducted in Poland [13] highlighted that the opinion of family members influences students.
In addition to social pressure, motivation plays a significant role in students’ major choices. For instance, a study by [24] reported that self-motivation to choose a college major significantly predicts academic decisions and well-being outcomes. Teachers and parents may encourage such motivation, which affects students’ interest and enrollment in certain majors such as STEM [25] and accounting [26].

2.2. Expected Earnings

Research shows that students consider the salary [21] and job market before selecting their college major [26]. Some students may not have realistic income expectations despite the importance of expected earnings in major selection decisions. For instance, community college students in California believe that salaries are 13% higher than they actually are, and students underestimate the probability of being employed by almost 25% [27]. As another example, a large-scale survey of Chilean college applicants found that students overestimate the earnings of the alums of their preferred college major by 39.3% [10].

2.3. Socio-Economic Status (SES)

The choice of college major and its related knowledge varies with students’ backgrounds. Students from low socioeconomic backgrounds tend to be influenced by the program’s cost and finances. In terms of program-related knowledge, low-SES background students are more inclined to gather information from advertisements and less inclined to find program-related information on government websites or in their schools [10]. Low SES students are more likely to have large errors in estimating the probability of employment than their high SES peers [27].

2.4. Demographics

Research shows that demographics such as gender and race can play a crucial role in students’ major decisions. For example, a study conducted in Chile [28] found that fathers influence the decisions of male students, while both parents influence female students. Further, female students are more likely to be influenced to change their major decision than their male counterparts [22]. Gender also plays a role concerning earnings. For instance, a study [14] found that male students, in particular, are more sensitive than their female counterparts about the initial income of a prospective profession, while women are more sensitive than men to the earnings’ rate of growth variations. Female students are generally less influenced by expected earnings compared to men [29].
Research shows that female students are still reluctant to choose STEM majors. For instance, female, first-generation college students were less likely to be certain about choosing an engineering major than their male counterparts [30]. In contrast, male, Asian, and high-SAT Math students dislike humanities [31] and prefer STEM-related majors [32]. Male students generally opt for math, science, and business-related fields, while female students are in the majority in humanities, social science, and education fields [33], and are more likely to apply to health majors and less likely to apply to civil engineering and technology. The tendencies of male and female students to gravitate around certain majors could be explained by the phenomenon that higher interaction with students of a certain gender increases the probability of following the application pattern of that gender [28].
Choosing a major affects the career path differently for females and males. For instance, a study by [34] found that 43% of women leave full-time STEM employment after their first child compared to 23% of new fathers. Indeed, recent research also shows that women who succeed in pursuing STEM careers frequently abandon the industry for various reasons, including hostile or unpleasant working conditions, unequal pay, a lack of mentoring and coaching, and rigid work schedules that conflict with family duties [35]. Similar concerns have been reported in [36].

2.5. Interest and Self Efficacy

Research shows that for students to function optimally in college, the choice of major must be based on personal interest or identification [24]. Several studies show that personal interest in the major is very influential in students’ major decisions [22,25,37,38]. For example, in a study in Chile, students reported that they found the jobs associated with their prospective majors enjoyable [10]. Similar results can be found in a study conducted at King Fahad University, where newly admitted students made their major choices based on interest in the major [21].
Interest alone does not explain students’ major choices. Indeed, students’ perceptions of their abilities play a role in their major choice. For example, a study explains how male and female students in Chile select their college major based on their academic performance [28]. Additionally, a study investigated the relationship of mathematics self-efficacy expectations to the selection of science-based majors. Results indicated that mathematics self-efficacy expectations were significantly related to the extent to which students selected science-based college majors [39]. However, research shows that students need guidance to help them align their self-perceived abilities with their goals when selecting their majors [8,21,23,37].

2.6. Major Selection Surveys

Table 1 shows an overview of various surveys conducted to investigate students’ major decisions. A study conducted in Saudi Arabia analyzed the factors that affected newly admitted students’ college decisions. The study concluded that several factors influence students’ decisions, including job opportunities, prospective salary, and social status. Likewise, job opportunities are crucial for students in Chile [37] and the U.S. [21], where business students also listed job opportunities and expected earnings. Still, students’ interest in the subject was the most crucial factor. Further, subject interest has been identified as a crucial deciding factor in a study conducted in the U.S. [40] and another in Qatar [37]. On the other hand, two studies conducted in Pakistan [41,42] revealed the societal influence on students’ major decisions, while a study in Estonia [43] identified prior experience with the field influences students’ major decisions. At last, a study in the UAE [20] identified a correlation between students’ attitudes and their intentions to major in accounting.
All these studies in Table 1 have shed light on understanding how students select their majors. However, there remain some gaps to be bridged. First, the existing studies mainly assess what influences the students’ decisions, but they do not examine the major decision process itself. For example, students may collect information or conduct an internet search to help them decide on their major. Second, the existing studies have not attempted to answer how future students could be helped to decide their major better. Third, the existing studies were conducted in various countries. However, in the context of the UAE, there is a lack of studies conducted to investigate the personal, social, and financial factors influencing students in deciding their decision.
This study identifies the factors influencing mostly the intentions of mostly female students at Zayed University to choose college majors. Further, the study examines students’ actions while deciding on their college majors. Finally, the study identifies the information that could be useful for future students desiring to select their majors.

3. The Development of Research Hypotheses

To arrive at a deep analysis of how female students at Zayed University choose their college majors, we developed various hypotheses grounded in the related existing literature. Since STEM fields have been considered a high priority [46] and are the main drivers of the economy, some hypotheses focused on students choosing STEM majors. Other hypotheses were formulated simply due to several parameters that could potentially influence the major decision, such as students’ gender, the influence of social factors, and skills.
According to the extant literature, students declaring a STEM major had a higher school Grade Point Average (GPA) and American College Testing (ACT) score and earned more credit hours than those who declared a non-STEM major [47]. Similarly, another study found that the intent to major in STEM is directly affected by 12th-grade math achievement, exposure to math and science, and math self-efficacy beliefs [48]. Similar findings were reported by a study where students with disabilities who enrolled in STEM majors showed higher high school GPAs in math compared to non-STEM students with disabilities [49]. Based on this discussion, we hypothesize:
H1. 
The 12-Year GPA affects students’ decision to choose STEM majors.
Students will likely select majors offering high future earnings streams [50]. Research shows that students exposed to higher unemployment rates during typical schooling years select majors that earn higher wages, have better employment prospects, and more often work in a related field [51]. Further, STEM fields such as computer science and engineering fields are chosen by some students as they believe their expected earnings will be higher than job prospects related to humanities and arts [31]. Thus, we hypothesize:
H2. 
Expected earnings affect students’ decision to choose STEM majors.
A study calls for more research to understand what drives students to become entrepreneurs [52]. Research shows that STEM university students will likely become entrepreneurs if they select a more specialized study plan [53]. Similar findings are reported in [54]. Interestingly, a recent study conducted in Canada has found that international students, especially those specializing in STEM-related degrees, are more likely to become entrepreneurs [55]. Based on the discussion, we hypothesize:
H3. 
Business Opportunities affect students’ decision to choose STEM majors.
According to a recent study, undergraduate students consider STEM fields such as engineering and natural sciences highly prestigious and well-respected fields in society. Further, the students associate STEM majors with high-income and status jobs [56]. Indeed, the prestige attached to the profession is among several factors that affect students’ career choices [38]. Accordingly, we hypothesize:
H4. 
Prestige affects students’ decision to choose STEM majors.
Research shows that engineering students, in particular, indicate that career upgrading is among the reasons for selecting their majors [57]. Another study shows that career advancement, particularly for male students, is among the influential factors in major selection [22]. Based on this discussion, we hypothesize:
H5. 
Career advancement affects students’ decision to choose STEM majors.
Research shows that women are likely to leave jobs where long hours leave less time for family considerations [58]. Similar findings can be found in [59]. Similarly, another study found that women with college degrees value flexible jobs [60]. As such, we hypothesize:
H6. 
Career flexibility affects female students’ major decisions.
Research shows that students’ beliefs about their skills overlap with their major choices [61]. For instance, students who considered themselves engineers had perceptions of themselves as capable mathematics learners [30]. Belief in one’s skills and academic performance predicted students’ major choices, particularly in STEM [62]. Thus, we hypothesize:
H7. 
Students who are passionate about a certain major also tend to have the right skills for it.

4. Methodology

This section gives a brief background about the institution where the survey was conducted. After that, the section presents the objective of the survey and tersely presents its questions.

4.1. Study Background

The study was conducted at Zayed University, a public UAE-based university. The university was founded in 1998, features campuses in Dubai and Abu Dhabi, and welcomes national and international students. The university offers graduate and undergraduate programs across different colleges, including interdisciplinary studies, humanities and social sciences, business, communication and media sciences, natural and health sciences, technological innovation, and art and creative sciences.
This study aims to identify what motivates UAE students to choose college majors. A total of 497 students (22 males and 475 females) in the UAE participated in this study. The gender ratio of 95.6% female versus 4.4% male. As such, the sample represents UAE female students more than male students. The students were 481 first-year students and four second-year undergraduate students. Further, there were 4% international students and 96% local students.
We distributed online questionnaires to students so they could respond electronically using an online survey platform. Before conducting the study, we obtained ethical clearance for conducting the study from the University research ethics committee. The questionnaire was administered from August 2021 to November 2021. The questionnaire included a cover letter explaining the purpose of the survey at the beginning. Informed consent was obtained from the students before participating in the study. Further, participation was voluntary, and the questionnaire was anonymous and confidential. The researchers conducting this study are diverse in terms of countries of origin, cultures, and genders. When the team analyzed the data, they had internal discussions amongst themselves to maintain objectivity.

4.2. Questionnaire Design

The questionnaire used in this study collected students’ demographic information such as gender, high school average score, the language of instruction in school, type of school (private/government), and emirate of residence. Figure 1 shows the influential factors, actions, and decision-support information asked in the questionnaire. The influential factors included personal, social, and financial factors. The students were asked to rate each of the factors using a Five-point Likert scale where 4 is very influential and 0 is not at all influential. Further, the questionnaire asked the students to specify whether they performed certain actions during the major selection process. Students rated each item using a Six-point scale as follows: 5: I did this, and it highly influenced my major choice, 4: I did this, and it influenced my major choice to a certain degree, 3: I did this, and it moderately influenced my major choice, 2: I did this, but it barely influenced my major choice, 1: I did this, but it did not influence my major choice, 0: I did not do this.
Moreover, students were required to rate on a 5-Likert scale several decision-support information that could help future students decide on their college major, where 4 is very helpful, and 0 is not helpful. At last, the questionnaire allowed students in free-text fields to add factors, actions, and decision-support information that might not have been included in the questionnaire. The questionnaire can be found online [63].
We used Cronbach’s Alpha value to measure the reliability of the scales used in the questionnaire. The result indicates that the coefficient value is 0.904 (no. of items: 31 and acceptance of the Normality distribution assumption by the Kolmogorov–Smirnov test whose SPSS p-value equaled 0.26), indicating the high inner reliability of the scales used.

5. Results

5.1. Descriptive Results

5.1.1. Population Analysis

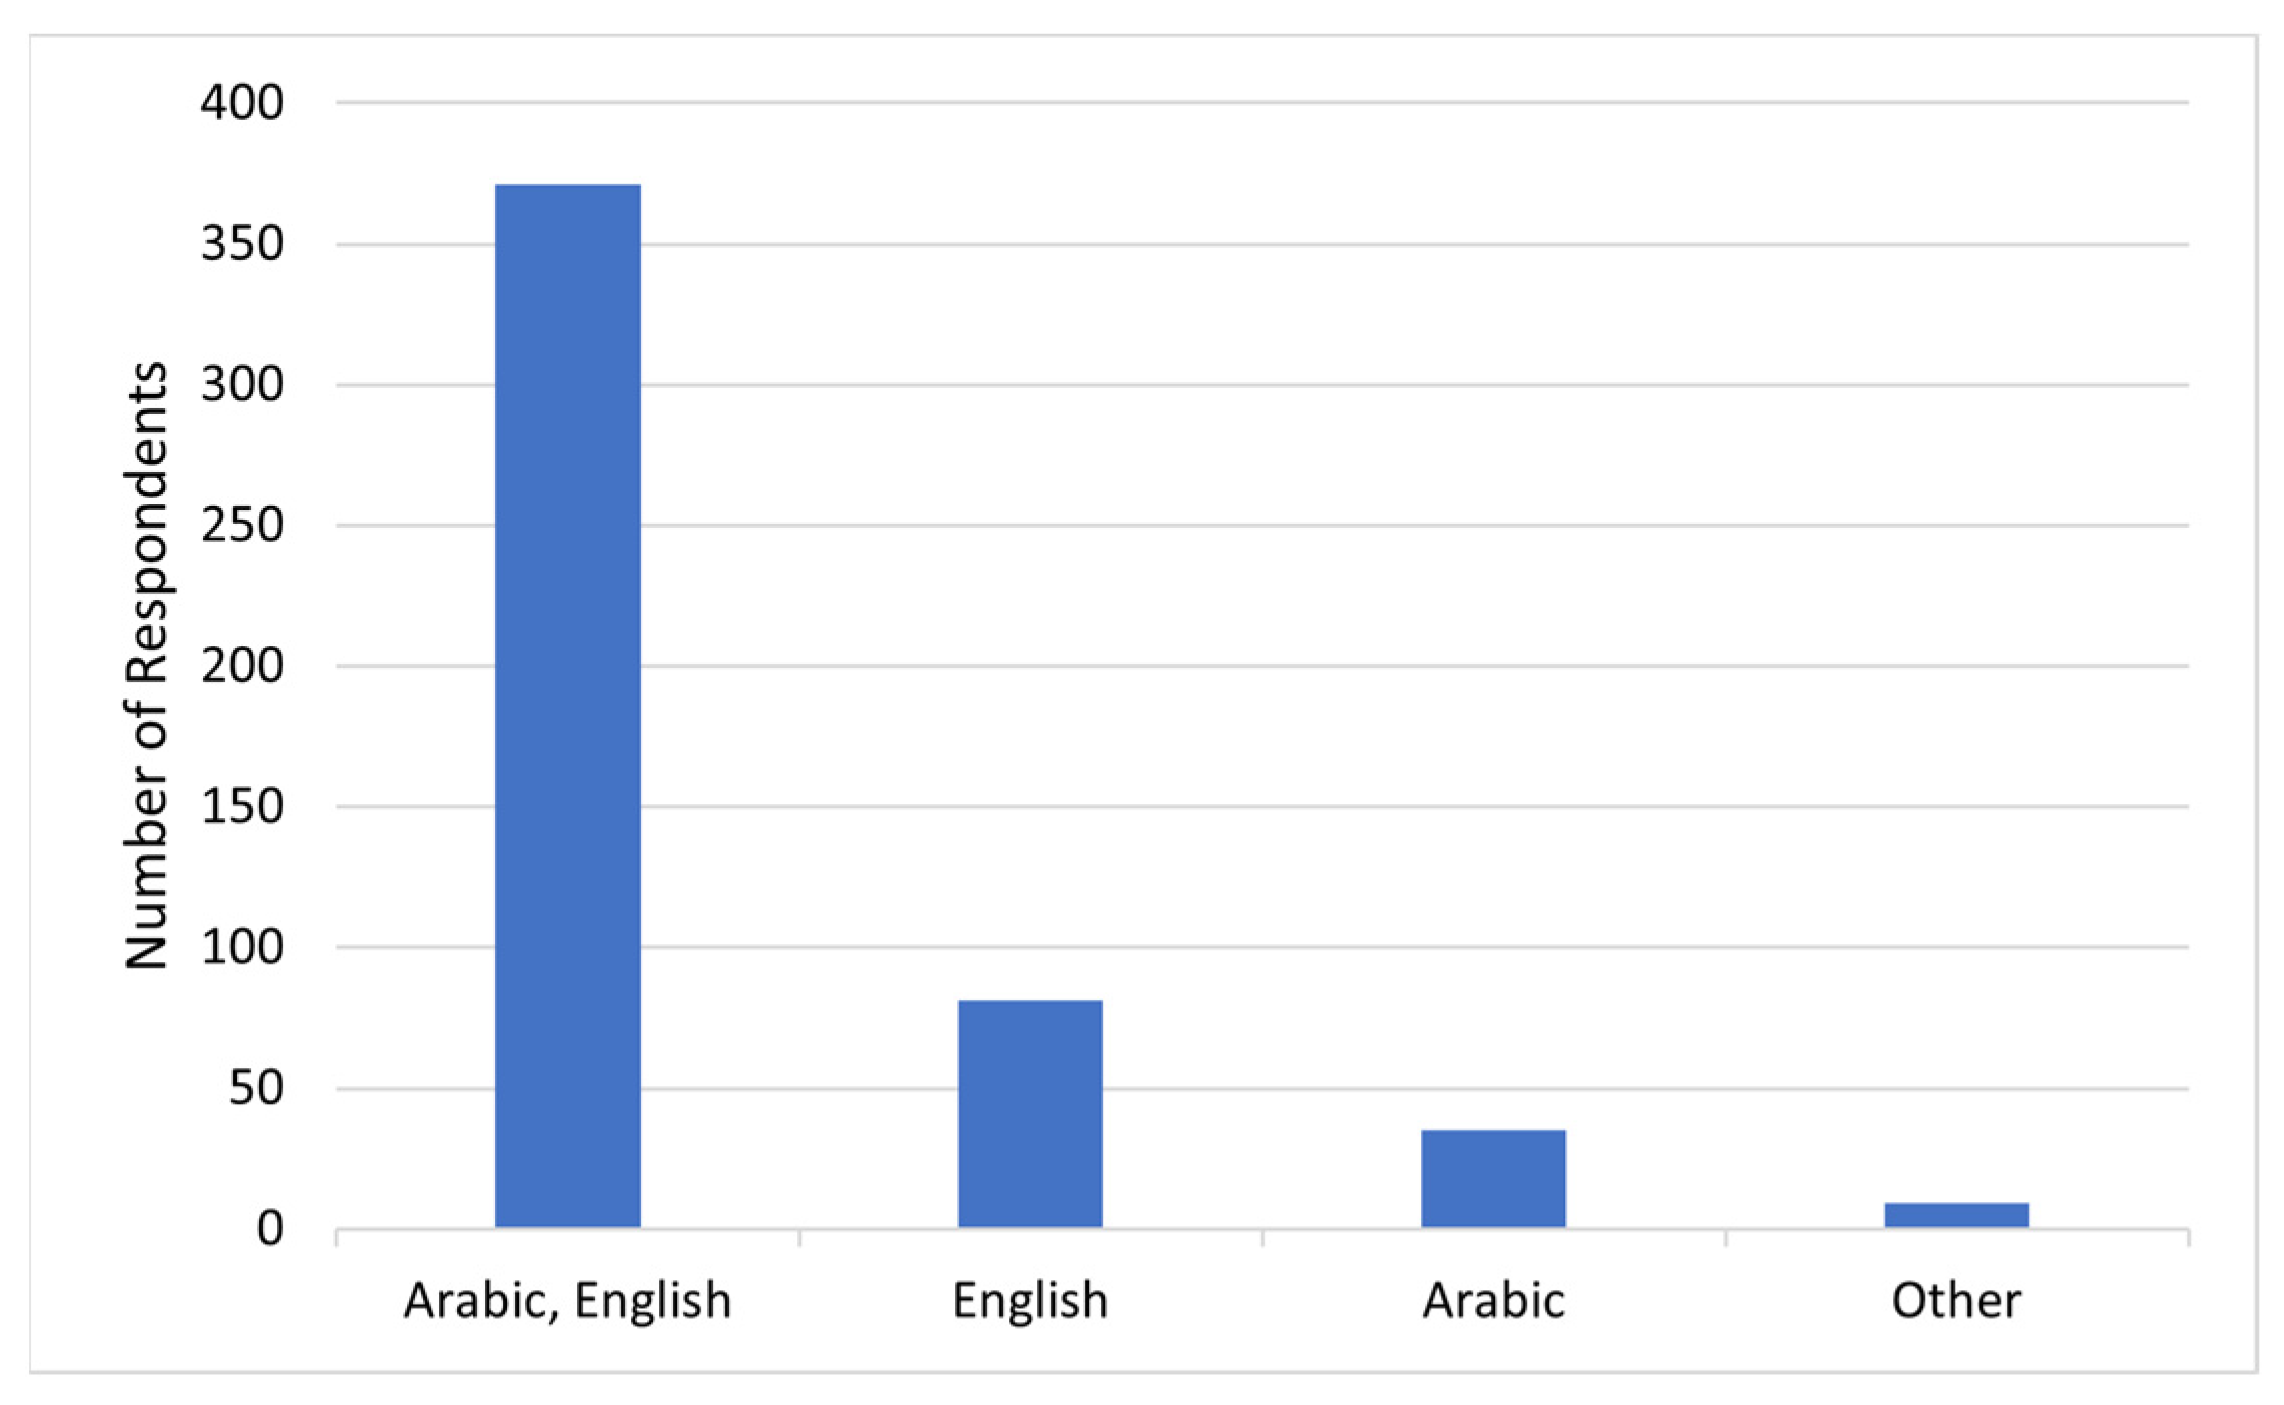
As stated previously, a major survey was given to 497 first and second-year students at Zayed University in Abu Dhabi and Dubai, UAE. Regarding gender, it is a high skewness distribution of 4.445 since 475 were females. A total of 75% of the students are bilingual (Arabic and English) according to the primary language of education (Figure 2). Just over a third (38%) of the students studied in private schools, while the remaining attended governmental ones. Interestingly, the Kurtosis (peakedness) regarding “Have you decided your major when in high school? [1—not sure … 5—very sure]” was −0.895 (a flat distribution with thin tails).
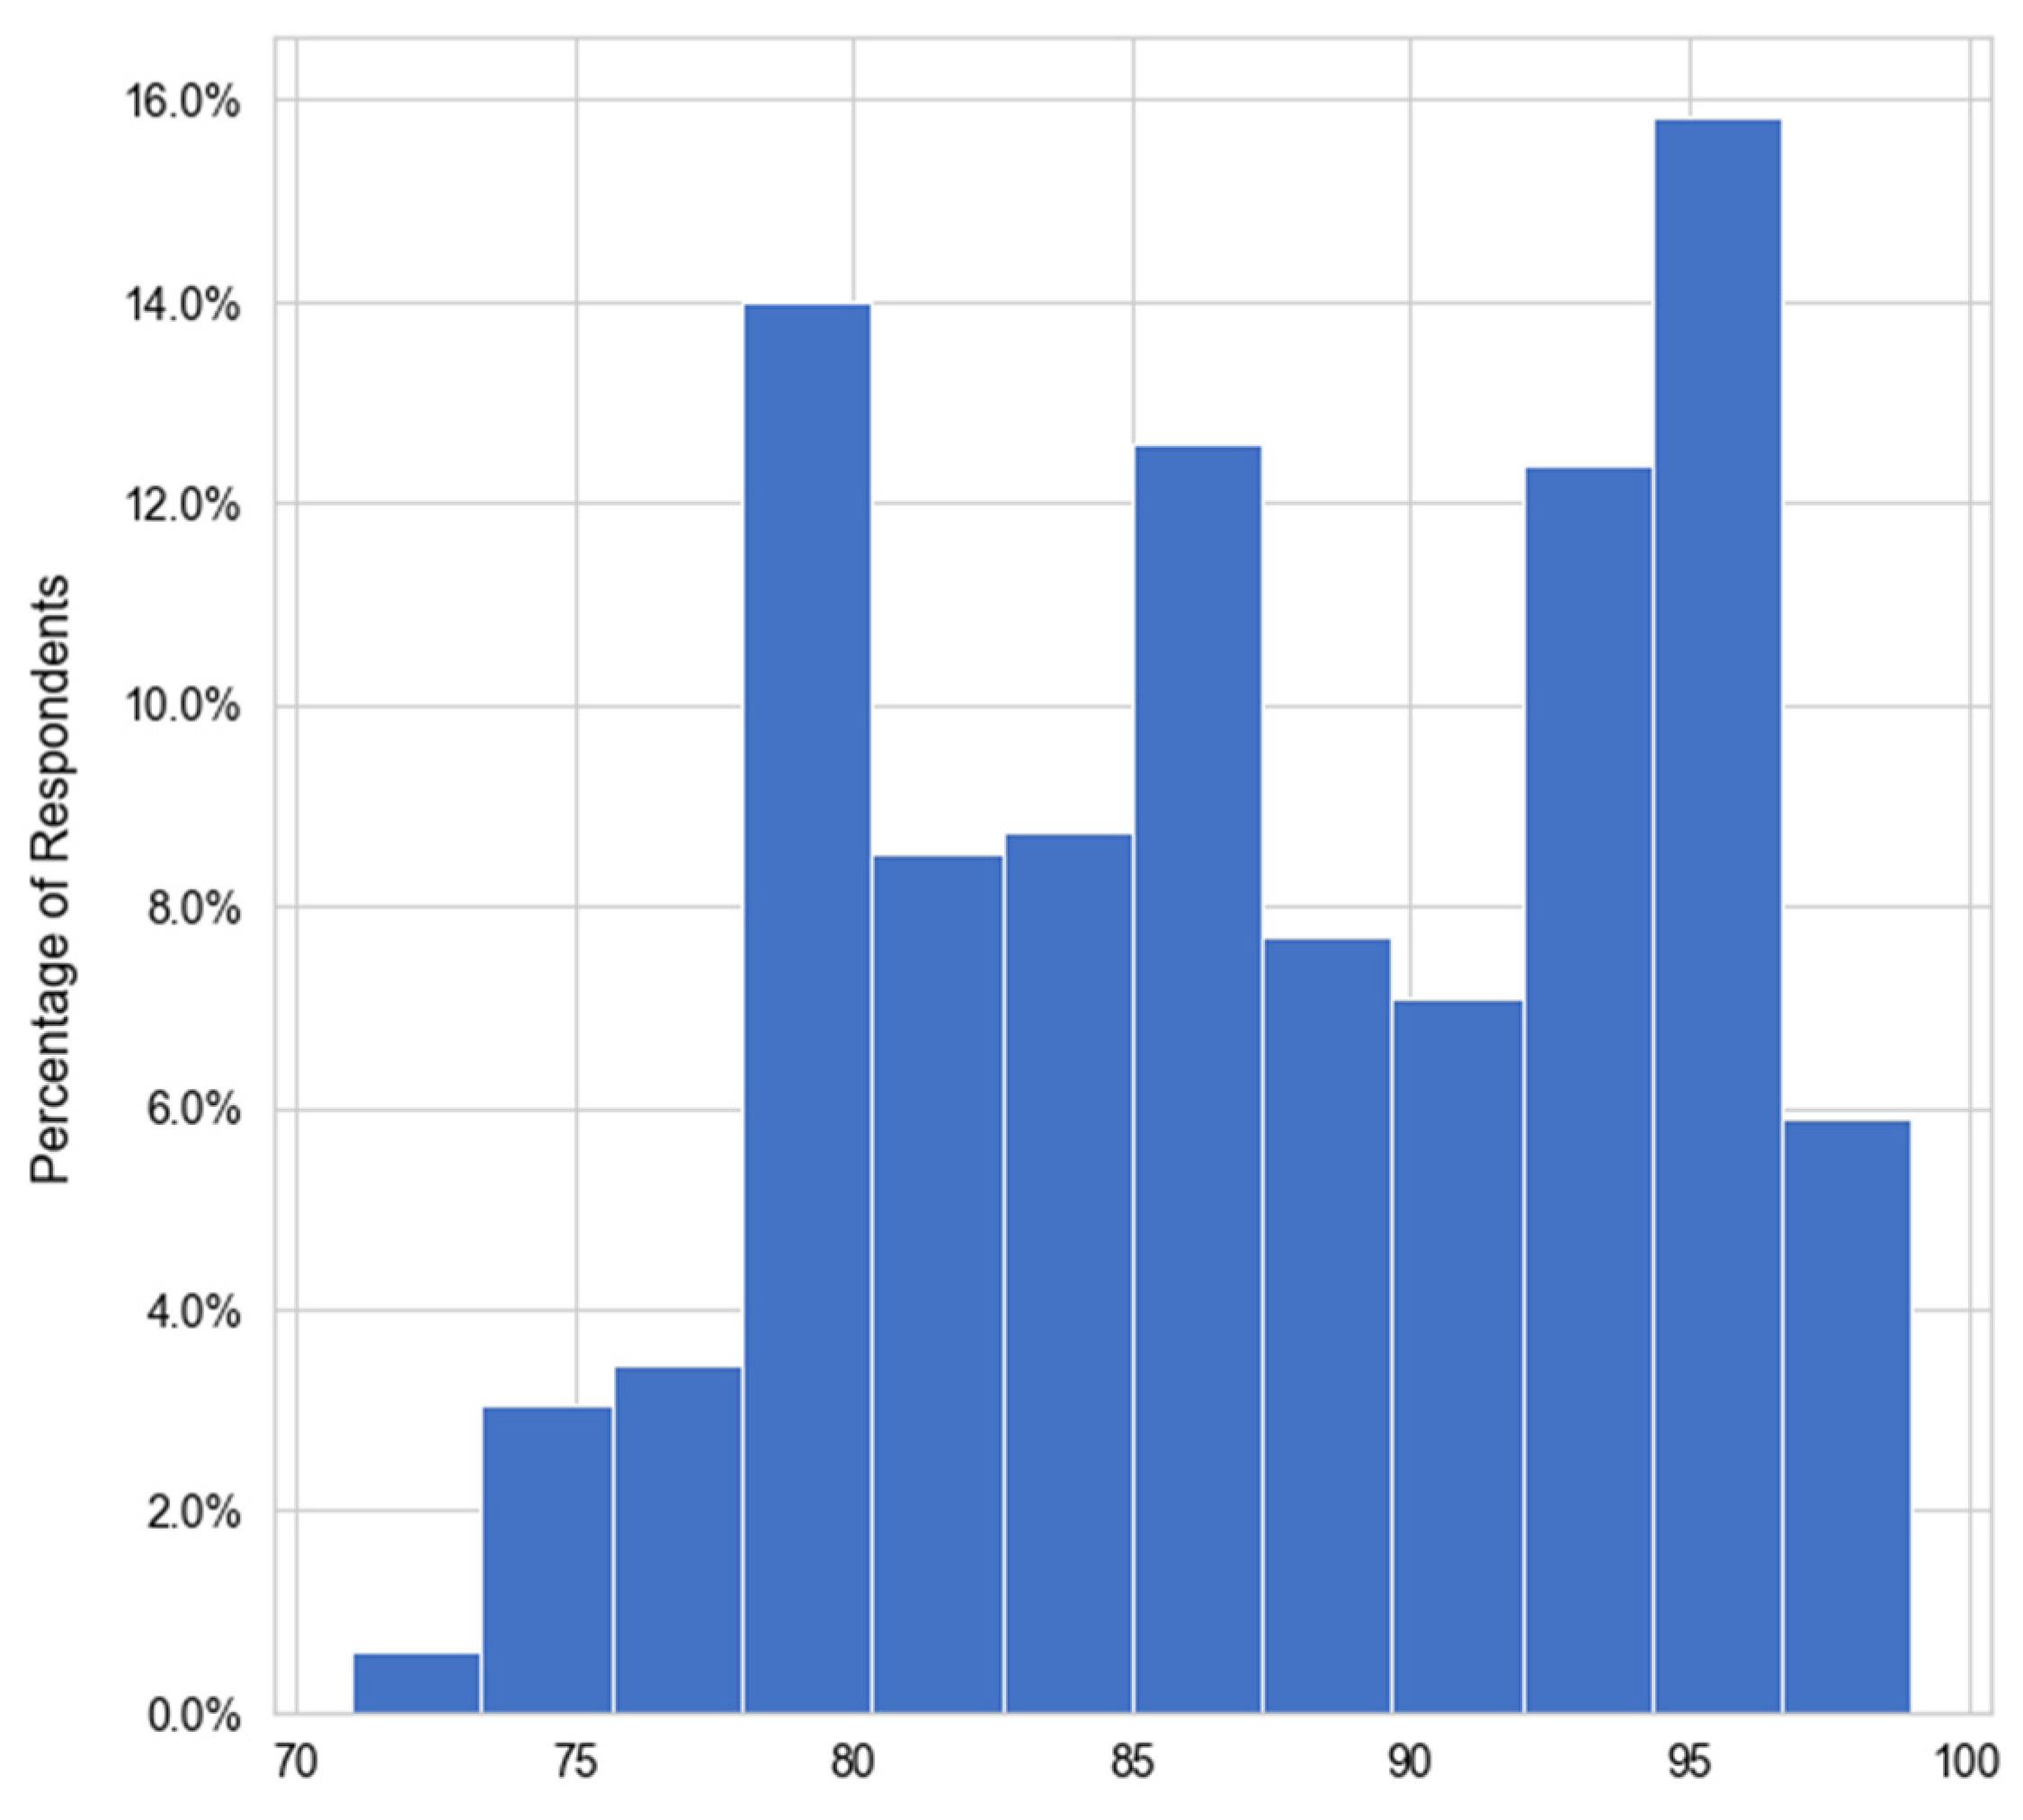
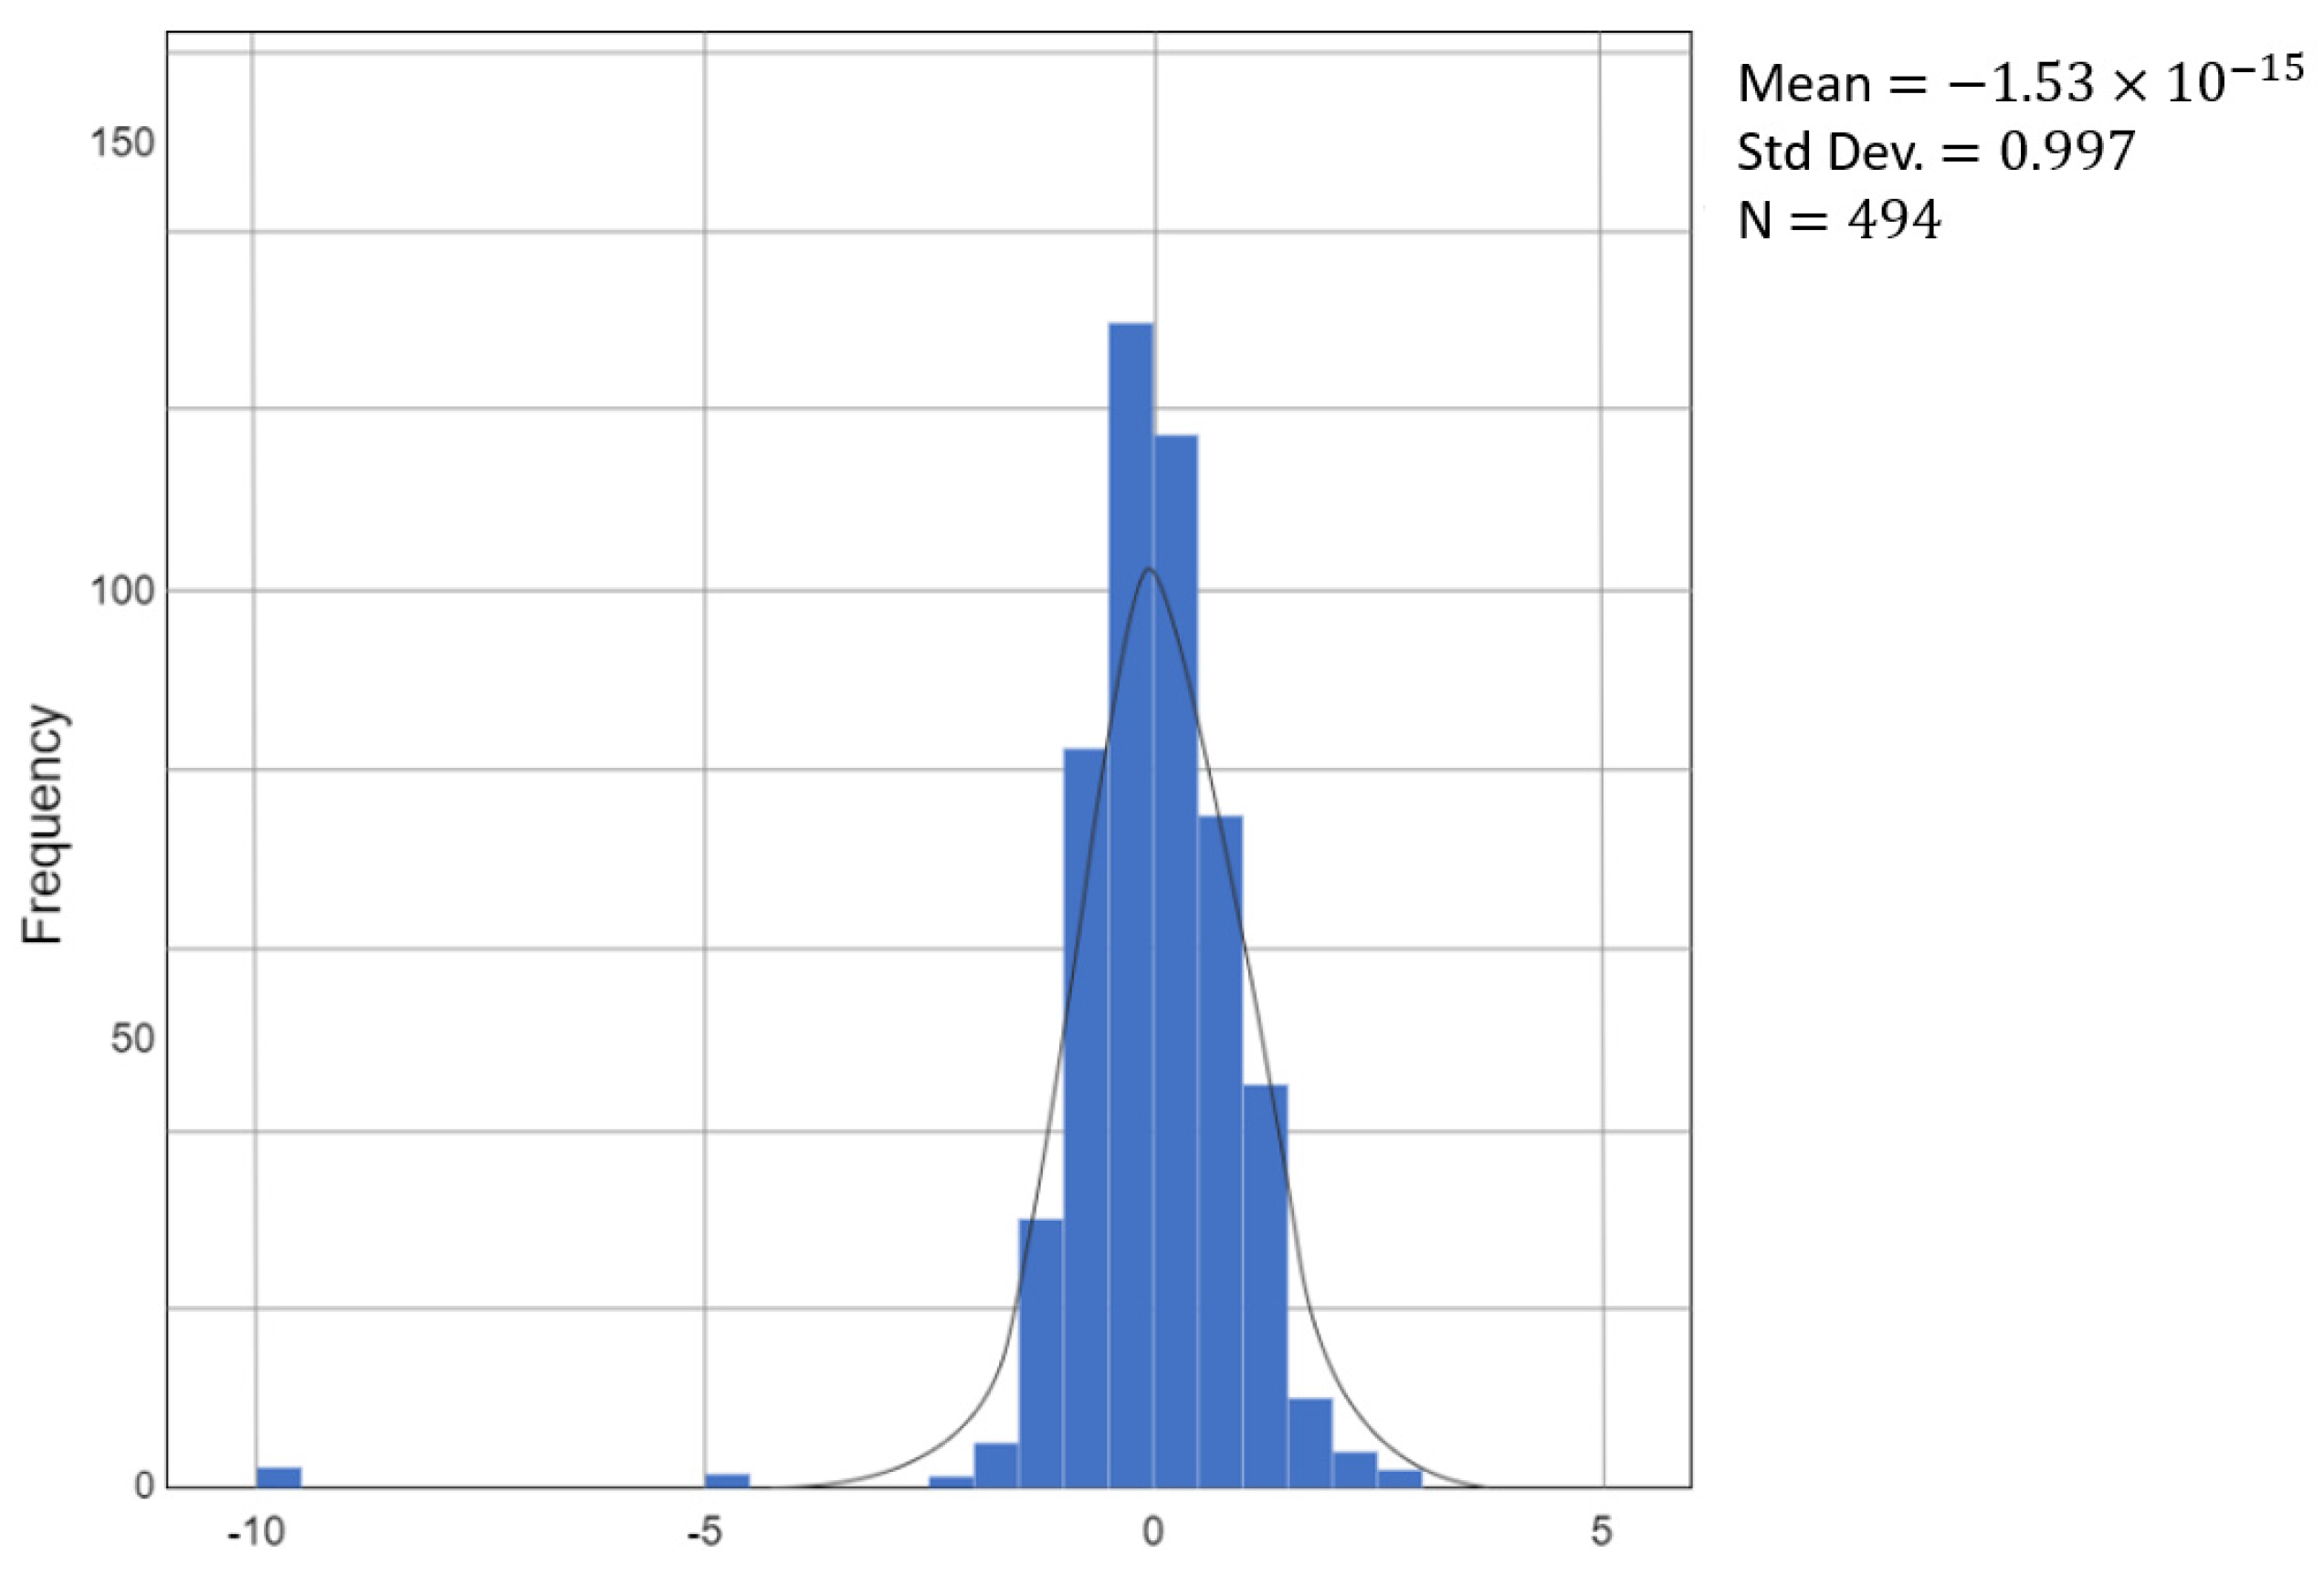
Figure 3 shows the distribution of the students’ 12-year GPA in school. The GPAs vary between 75% and 99%. Further, we conducted an OLS (Ordinary least squares) regression analysis to understand the population (Figure 4). The year-12 GPA (dependent variable) estimation based on the independent variables of Gender, Main Language of Education, and School Type (public or private) holds a fair R 2 of 33.9%: Year-12 GPA = 93.5 − 5.22 × Gender − 2.19 × MainLanguage − 9.24 × SchoolType. No multicollinearity (VIF) was found among these independent variables; thus, globally, this is an acceptable model as the F statistics is high (85.438). All T-independent tests for each beta were also significant for a 95% confidence level.
Moreover, as we move along in the main language of education set (Arabic-English-0, English-1, Arabic-2, Others-4), the average 12-year GPA worsens by 2.199 points. At last, students studying in private schools achieved higher scores than their counterparts in government schools by 9.249 points, on average.

5.1.2. Influential Factors

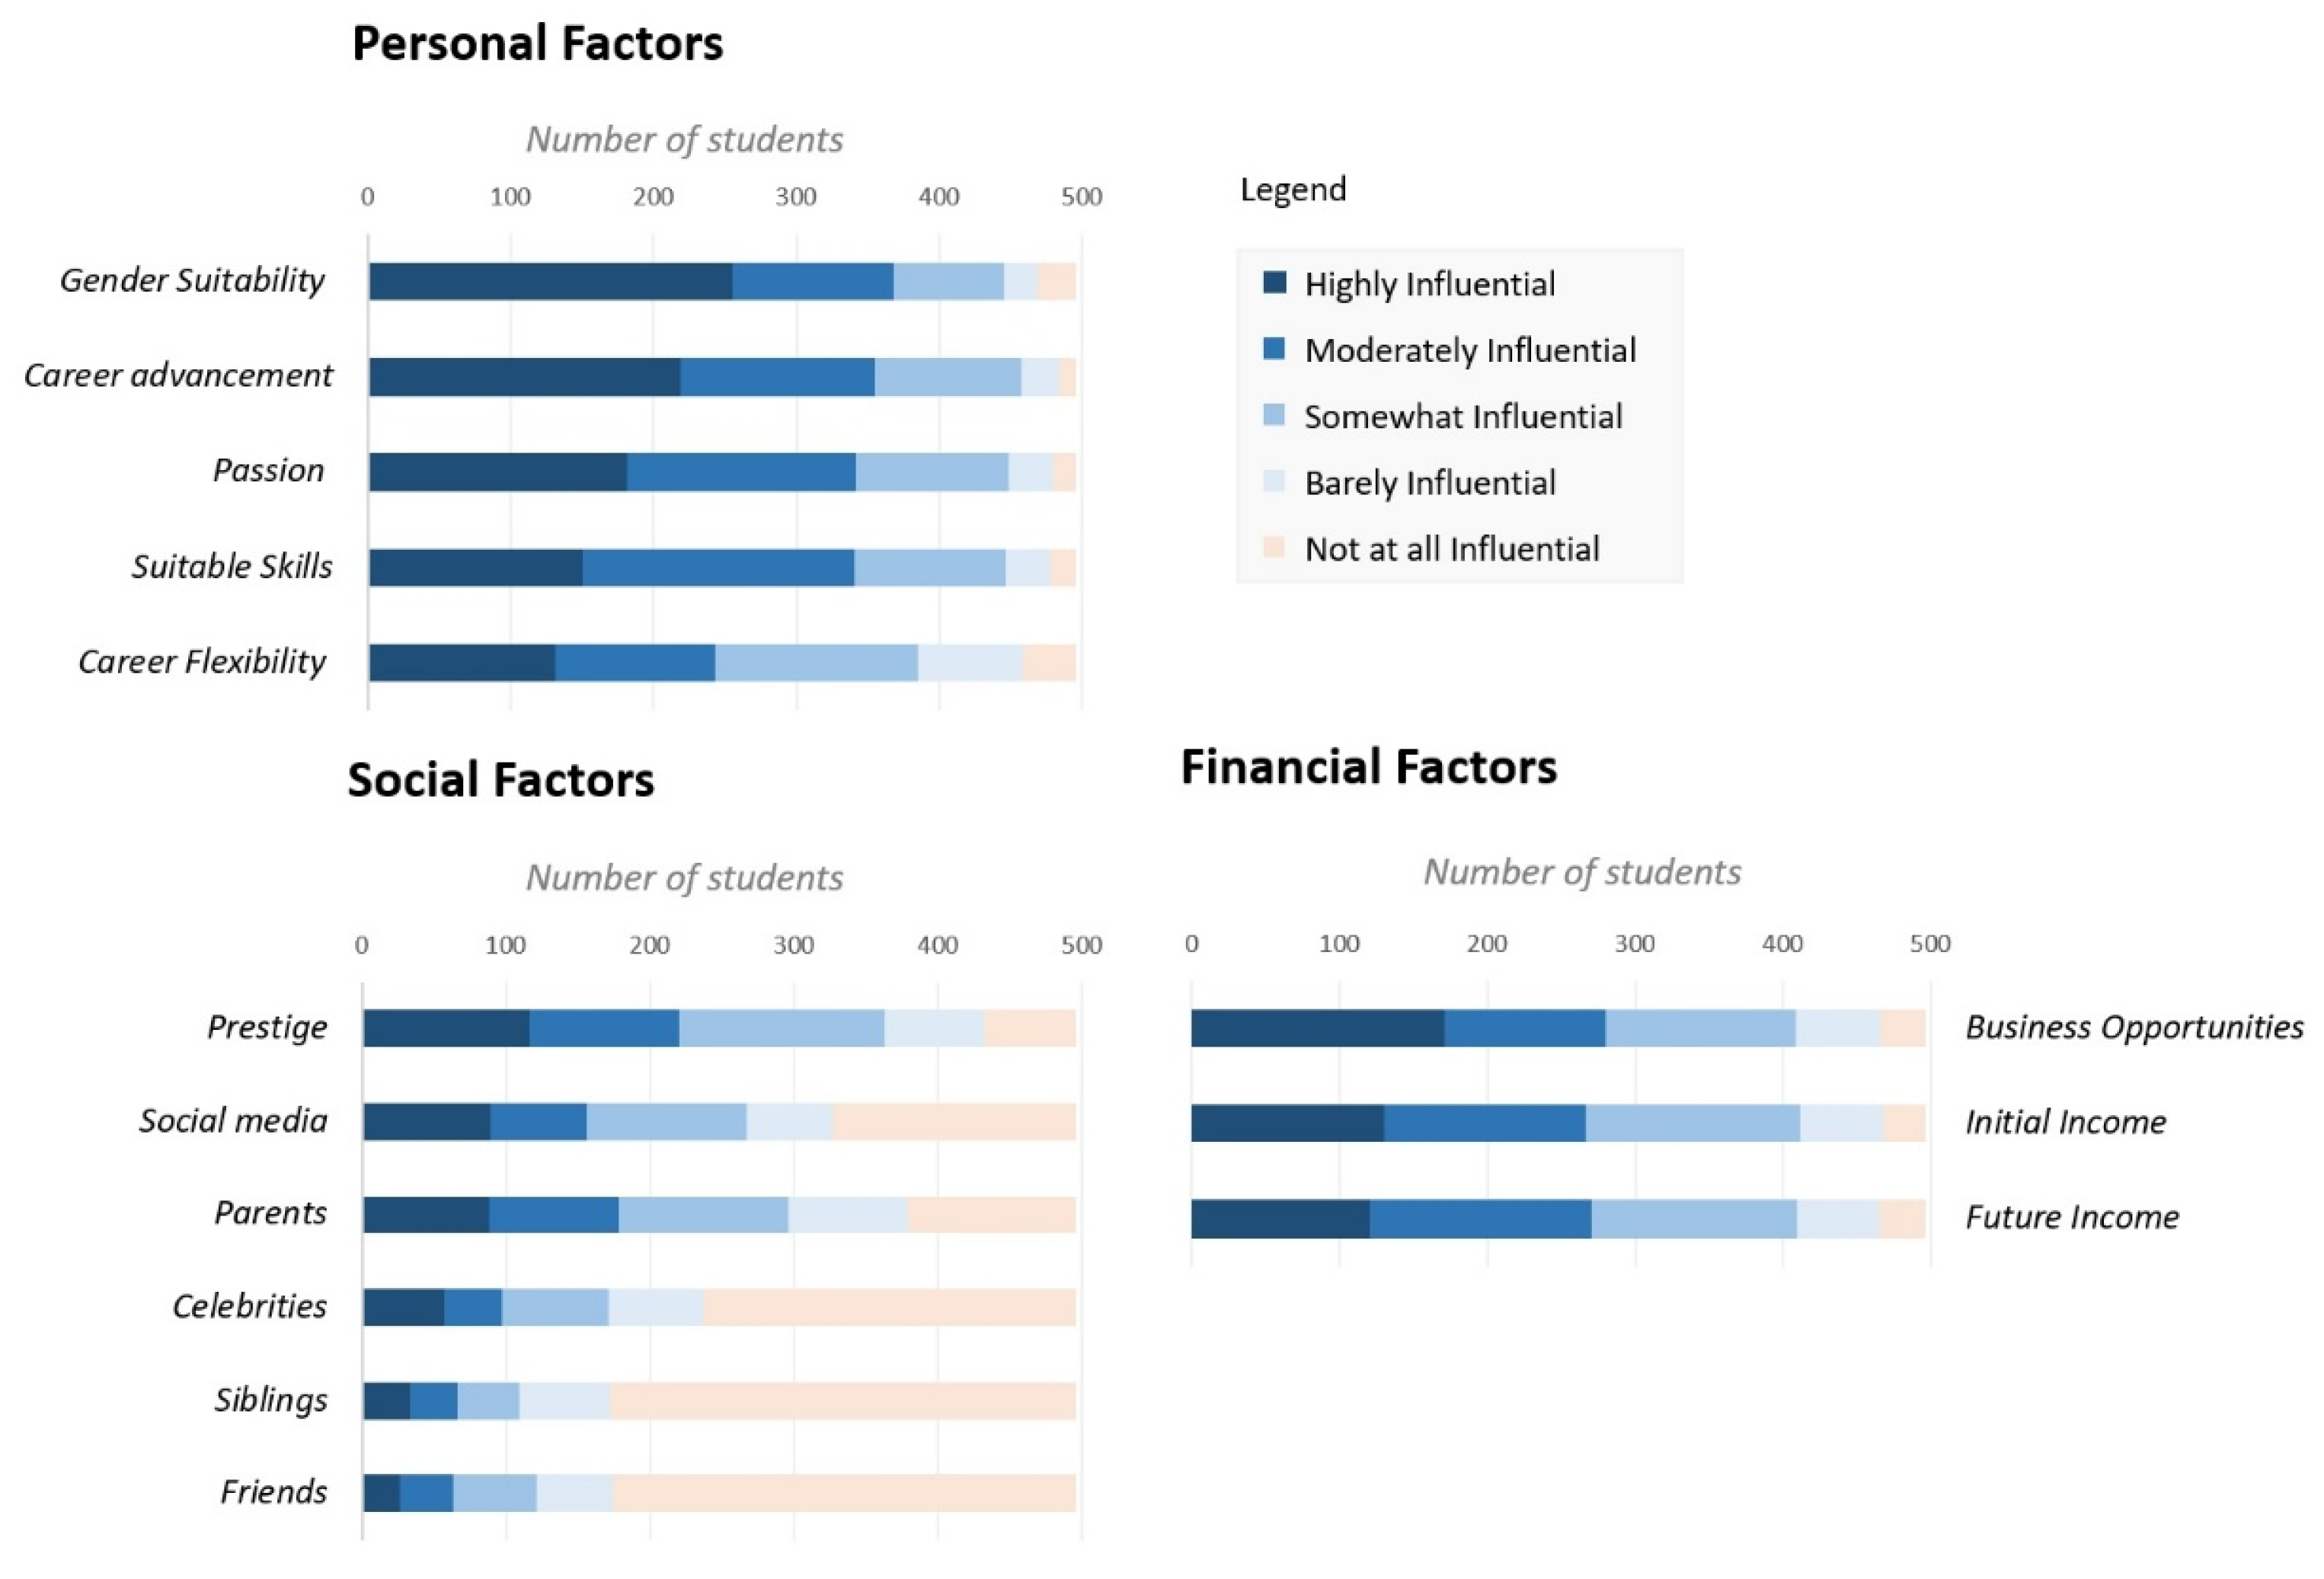
Figure 5 shows how the students rated the personal, social, and financial factors on how influential they are to their college major decision. Additionally, Table 2 depicts statistical data about the influential factors. Concerning personal factors, 74.2% of the students cited that gender suitability is highly influential or moderately influential in their college major decision. In comparison, 71.6% of the students considered career advancement highly or moderately influential. The remaining factors, passion, skill suitability, and career flexibility, were less influential in major selection decisions.
Socially, 44.4%, 35.9%, and 31.5% of the students considered prestige, parents, and social media, respectively, highly or moderately influential. In contrast, celebrities, siblings, and friends are much less influential in college major decisions.
Financially, 56.5%, 54.43%, and 53.62% of the students considered business opportunities, future income, and initial income, respectively, highly or moderately influential.
When asked if there were factors influencing students’ major choices other than the ones suggested by the questionnaire, only a few students (N = 16) indicated that they chose a certain major because they were restricted by what is offered, and a few others (N = 5) cited that they chose a major close to what they desired.

5.1.3. Influential Actions

Figure 6 shows the actions that students performed before deciding on their major. Most students (85%) performed an internet search, with 32.8% and 19.8% finding it highly and moderately influential, respectively. Similarly, 90.1% of students discussed their prospective major with their families, but only 23.4% and 18.9% found the discussions highly and moderately influential, respectively. In comparison, 81.9% of the students consumed social media content related to their major, with 24% and 15.5% finding social media highly and moderately influential, respectively. Other actions such as reading brochures, discussing the major with an expert, or attending workshops were performed by fewer students. These actions were less influential in deciding the major.
When asked if there were actions other than the ones suggested by the questionnaire, only a few students (N = 3) pointed out that they read the major requirements.

5.1.4. Decision Support

Figure 7 shows the students’ ratings of the information that could help future students decide on their major. Most students found all the provided options helpful to varying degrees. However, more than half of the students thought it would be very helpful to know how the prospective major aligns with the UAE vision and the demand for jobs relevant to the major. Skills, job responsibilities, and the flexibility of the prospective jobs were found to be very helpful by 48.5%, 47.3%, and 44.7% of the students, respectively. The remaining pieces of information such as income, job nature, alum interview, related businesses, and related research were perceived as very helpful by fewer students.
When asked if there was decision-support information other than what was suggested by the questionnaire, only a few students (N = 3) pointed out that internship information about the major would be helpful.

5.2. Correlative Analysis

To test the correlations amongst the influential factors, actions, and decision support factors, we used Pearson Correlation and ±0.5 as a cutoff indicating the minimum value to be considered as a significant correlation.

5.2.1. Influential Factors

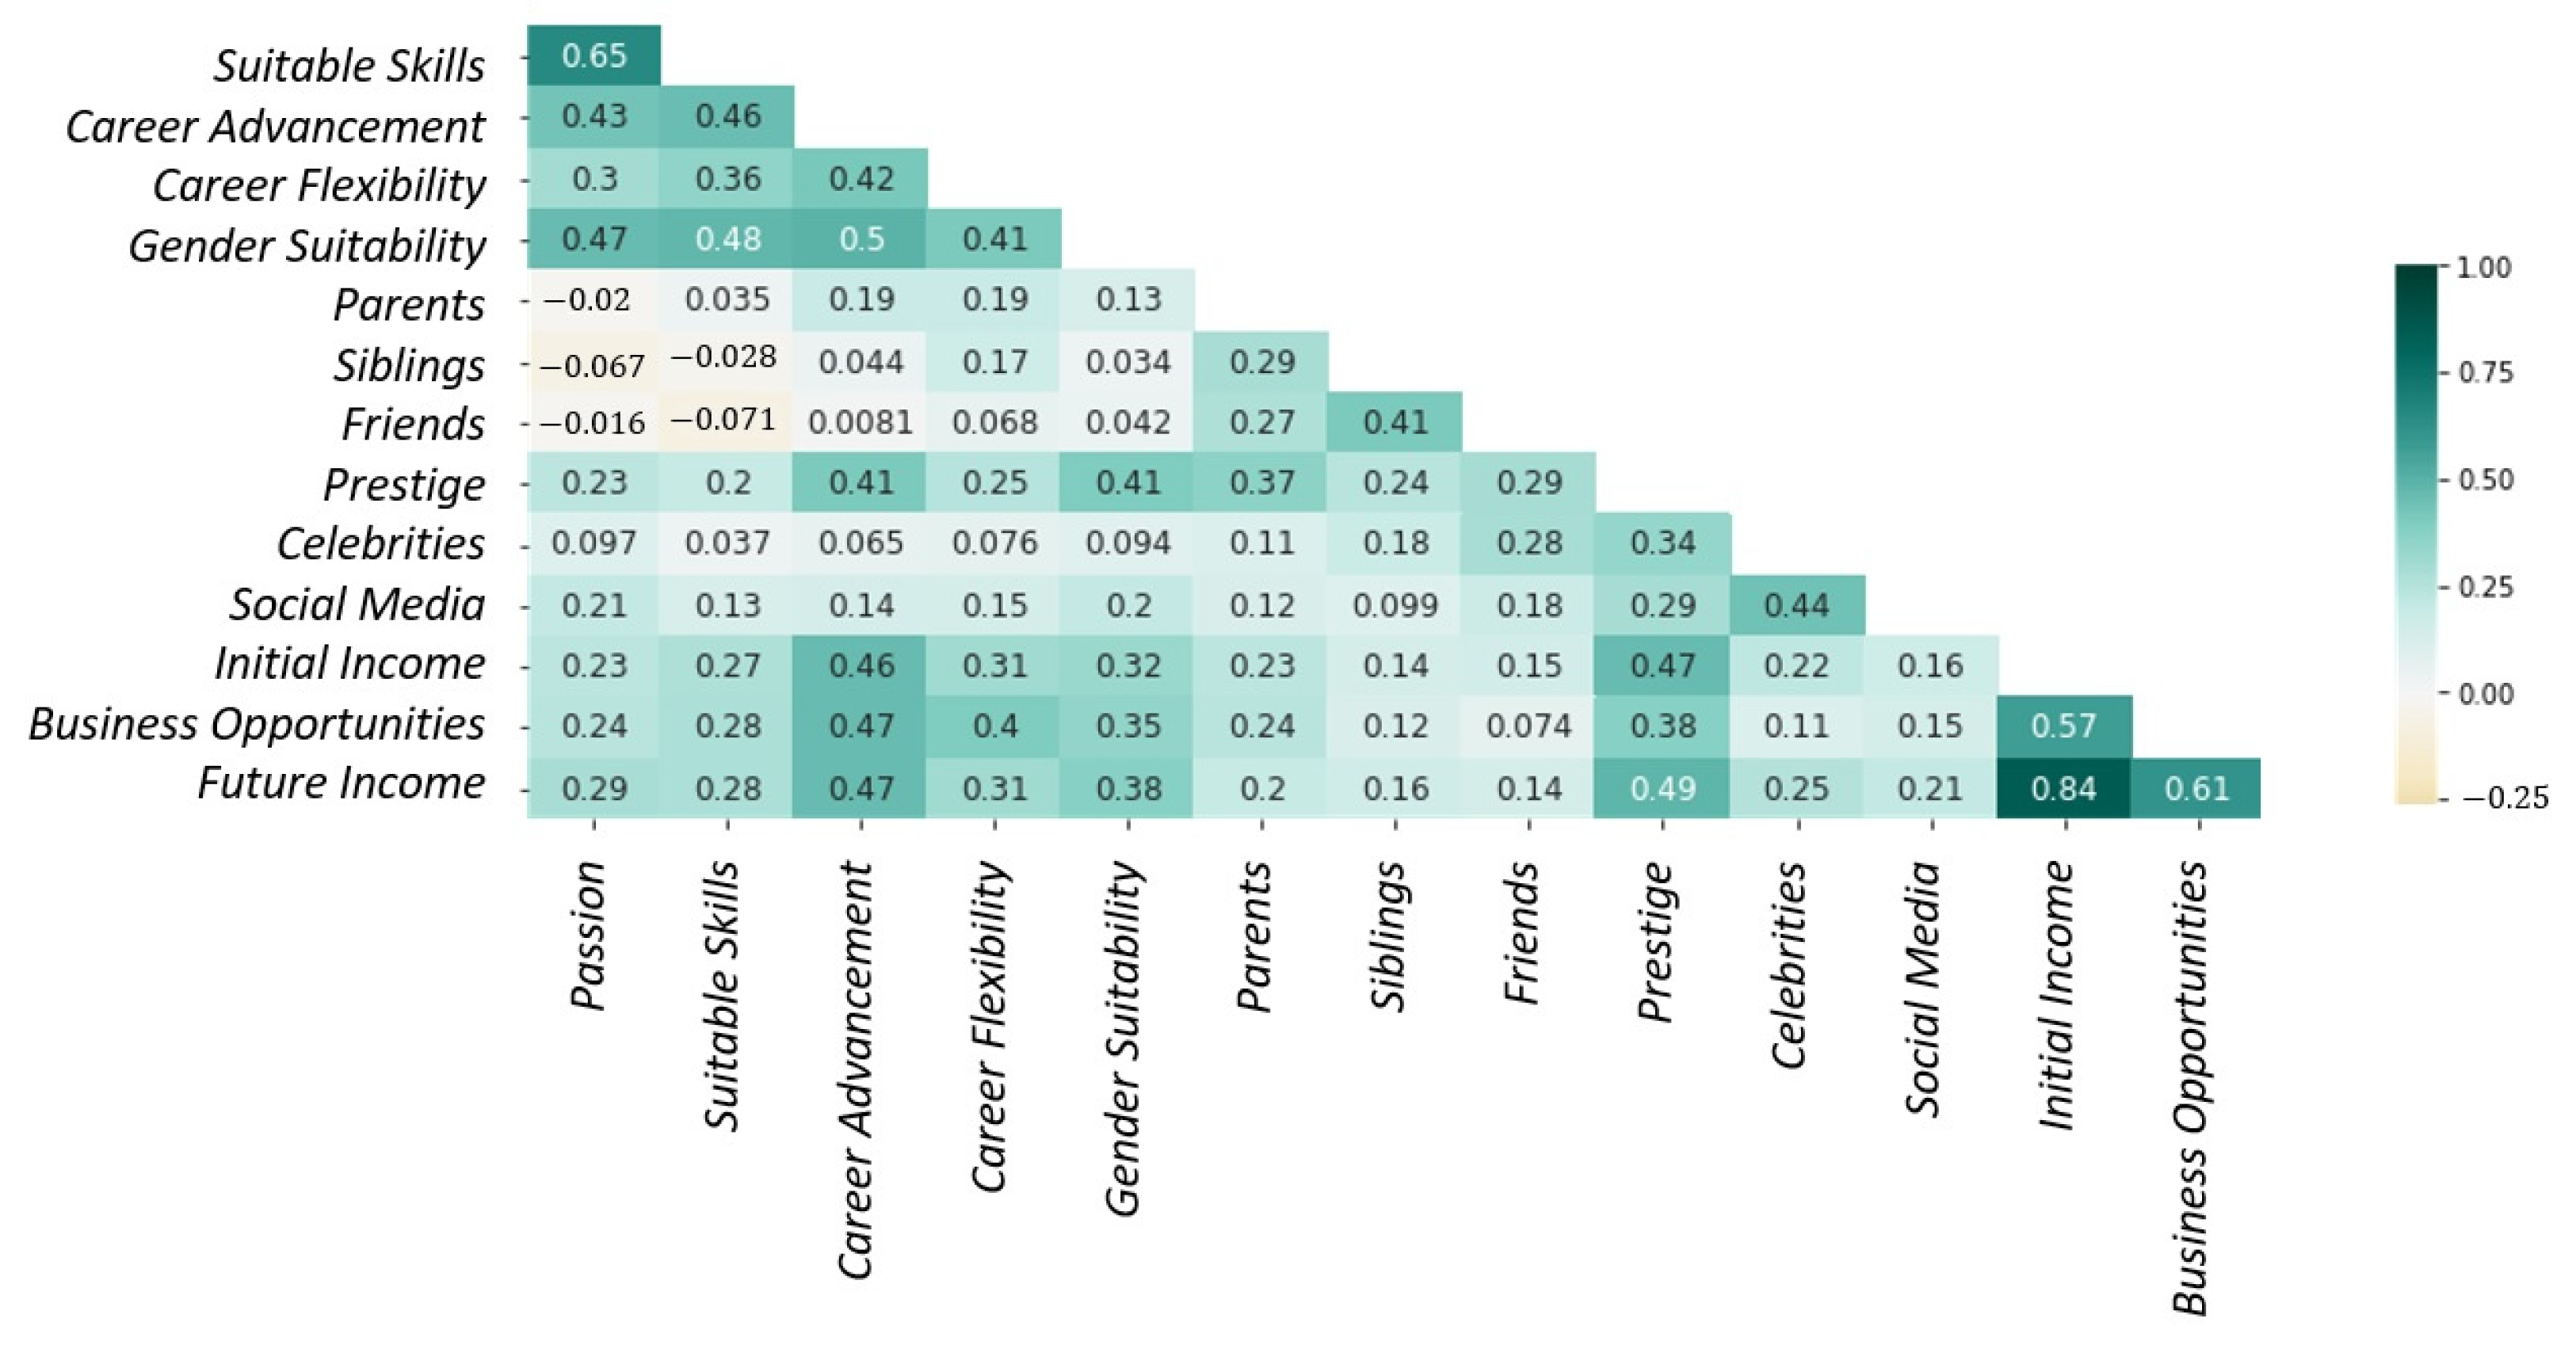
Figure 8 shows the correlation heatmap amongst the 14 influential factors. Most correlations were generally weak (i.e., less than 0.5 and greater than −0.5). However, a few strong correlations emerged. The correlation between Initial Income and Future Income is 0.84, indicating that many students who choose a major because of its initial income also think the income will steadily grow. Further, the correlation between Passion and Suitable Skills is 0.65, suggesting that some students choose a major for which they have skills and passion. Finally, Business Opportunities and Future Income are highly correlated (0.61), showing that some students choose their majors because of the business opportunities and the growing income in the future.

5.2.2. Influential Actions

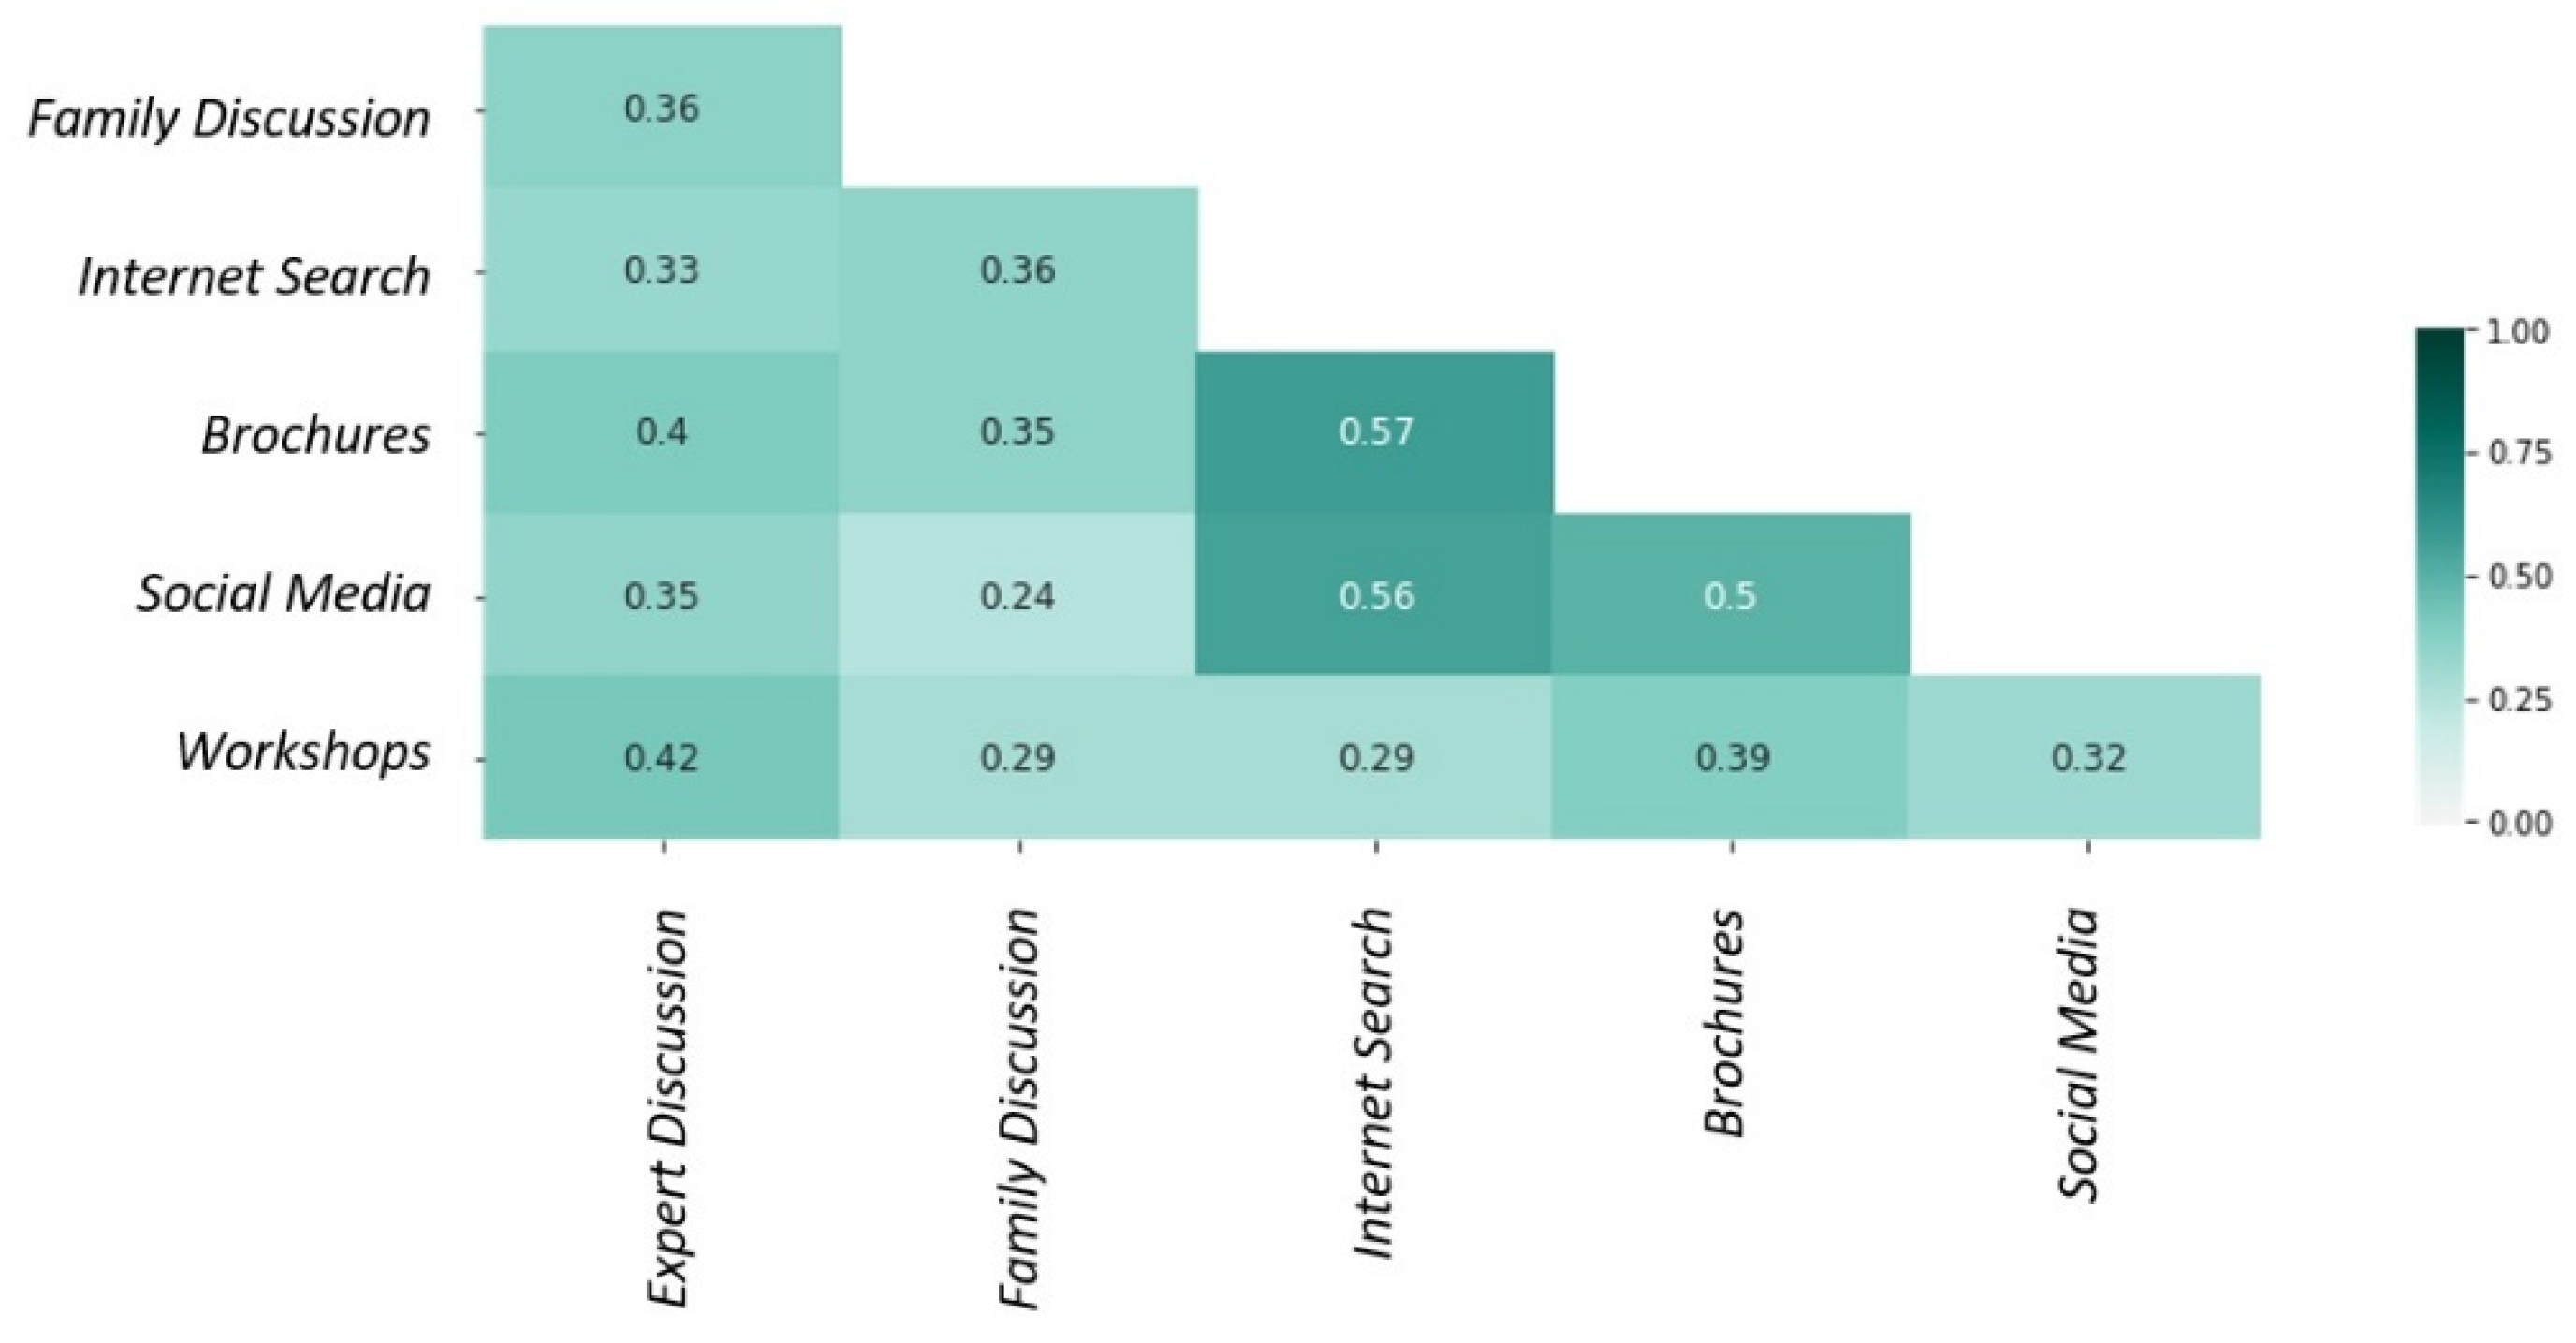
Concerning the influential actions students performed before deciding on their major (Figure 9), Internet Search and Brochures are strongly correlated (0.57), signaling that some students conducting an internet search to obtain information about college majors also read related brochures. Similarly, Internet Search is strongly correlated with Social Media (0.56), indicating that an internet search can be done in parallel with browsing social media content.

5.2.3. Decision Support

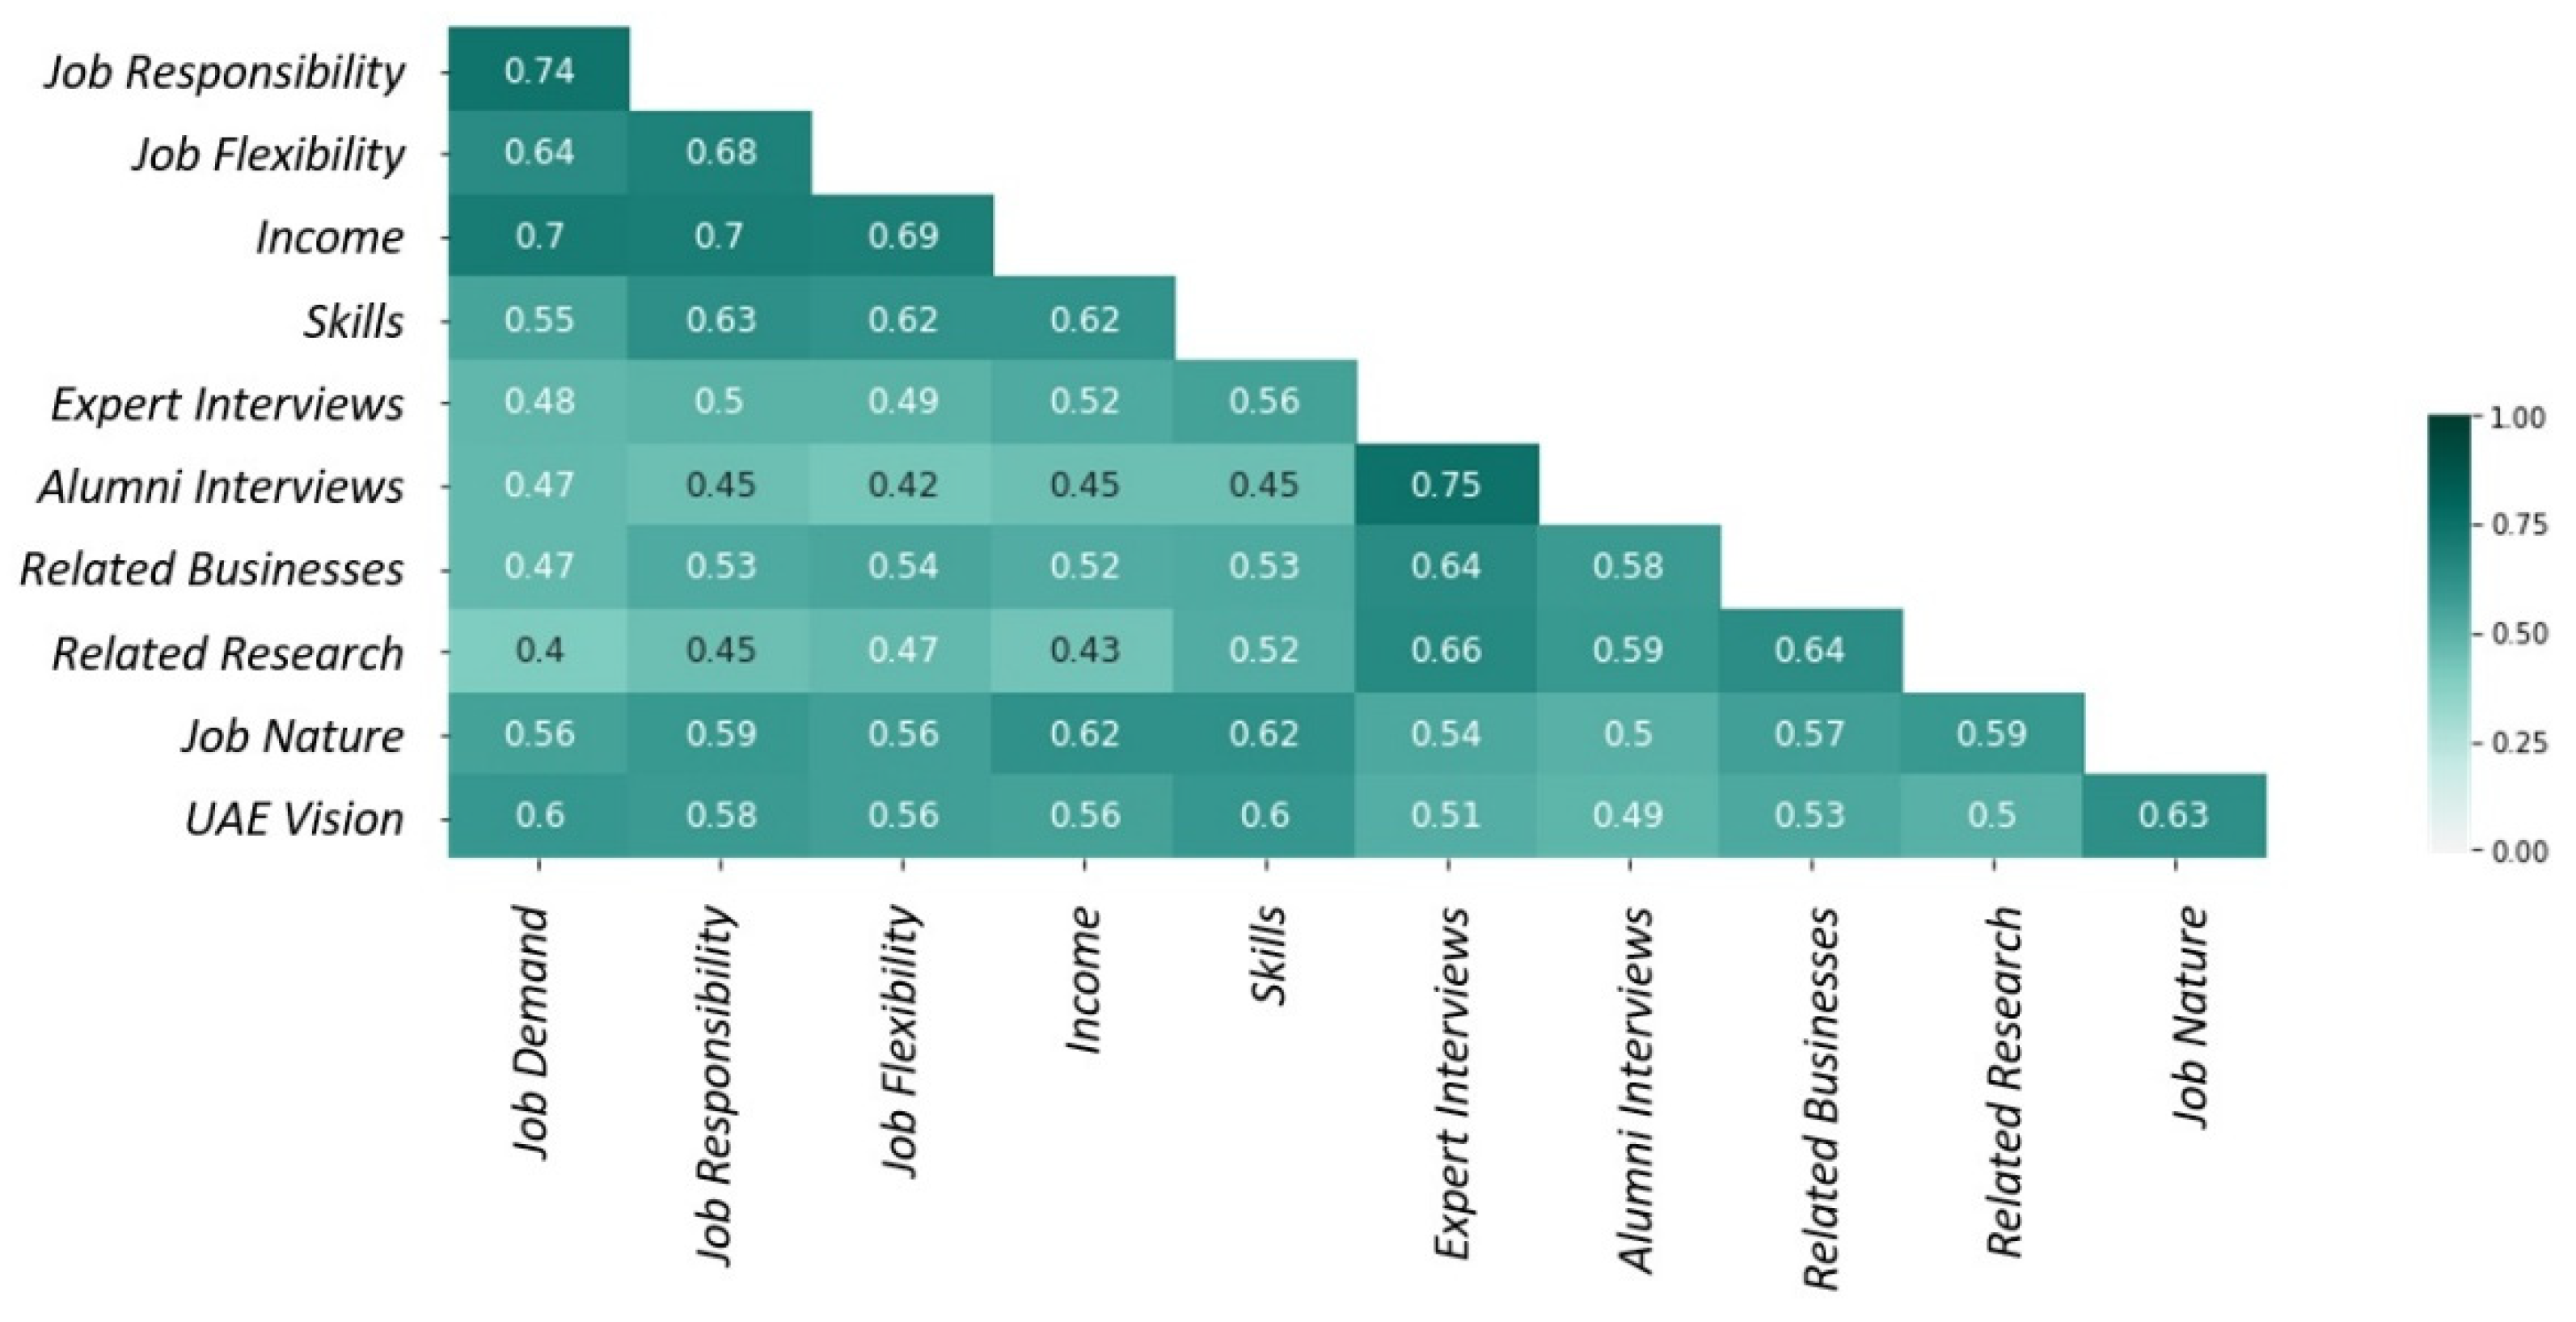
At last, almost all the eleven-decision support information exhibited a moderate to a strong positive correlation, and some factors featured strong positive correlations of 0.7 and above (Figure 10). For instance, Job Demand strongly correlates with Job Responsibilities (0.74) and Income (0.7), indicating that many students desiring to know about job demand also want to know about job responsibilities and expected income. Further, Expert Interviews are highly correlated with Alumni Interviews, implying that many students who would like to view interviews with experts in the major domain also prefer to view interviews with alums of that major. It could be argued that some experts are also alums. However, in the survey, we defined alums as fresh graduates from the university.

5.3. Confirmatory Factor Analysis (CFA)

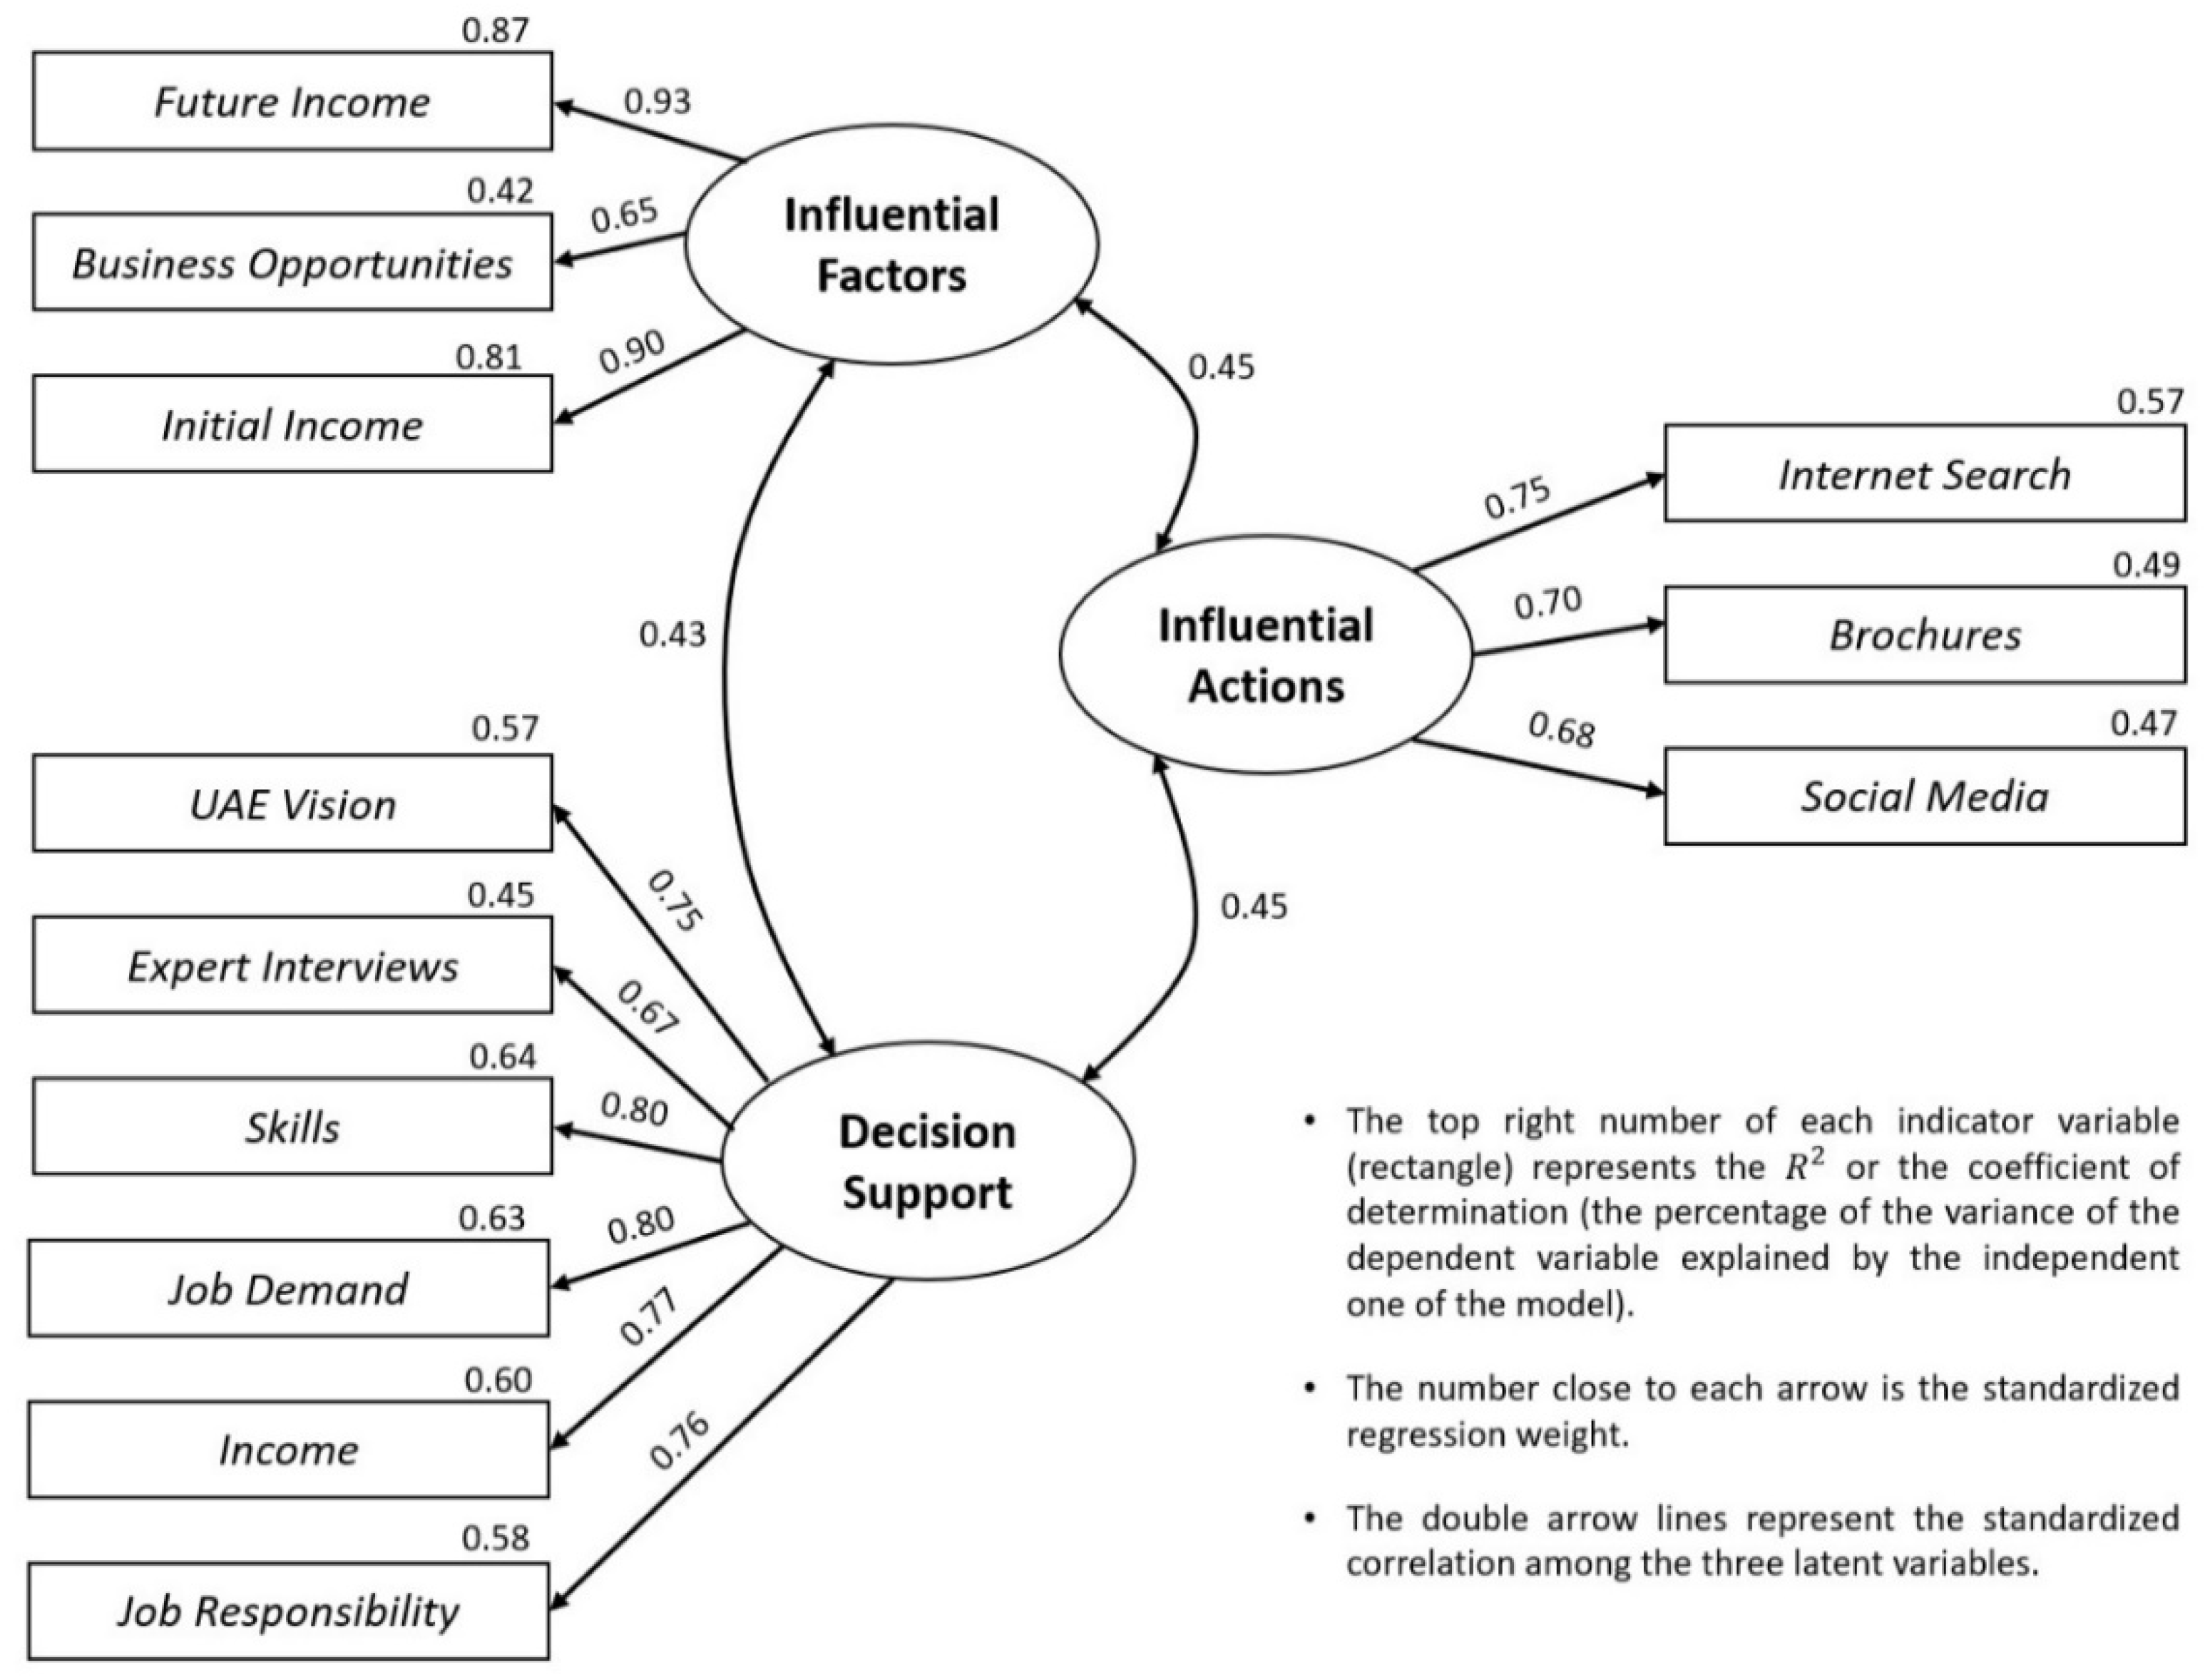
We conducted a Confirmatory Factor Analysis (CFA) using SPSS AMOS to examine the relationship among three latent categories (influential factors, influential actions, and decision support) and their 31 initial, observable variables. As part of CFA, factor loadings (standardized regression weights) were assessed for each item with a 99% significance (p-value = 0.000). Numerous model revisions were performed from the original full model to fit the data. In the end, only 12 essential variables remained in the model, and 19 were removed (Figure 11) due to low factor loadings (<0.6). Further, Figure 11 demonstrates that three latent categories (influential actions, influential actions, and decision support) hold similar correlations, indicating no clear predominance of any category over the other two about college major decisions.
Our analysis yielded a Chi-square value of 116.777 with 50 degrees of freedom and a p-value of 0.000. Since it does not exceed the alpha value of 0.05, the null hypothesis is rejected, indicating that the model does not fit the data adequately. It should be noted that problems with Chi-square, that is, it is sensitive to sample size, possibly leading to the null hypothesis rejection as the sample size increases. Therefore, additional testing was done before concluding the model fit. The result of our testing indicates that the Goodness of Fit (GFI = 0.963) and Tucker Lewis Index (TLI = 0.971) respect the 0.9 cutoff value revealing that the present data fits quite well with the proposed measurement model (Table 3). In conclusion, the three-factor model (Influential Factors, Influential Actions, and Decision Support) yielded a good fit for the data (Figure 11).
We assessed the construct reliability using Composite Reliability (C.R.), a measure of internal consistency in scale items, similar to Cronbach’s alpha. According to Table 4, their values range from 0.755 to 0.891, above the 0.70 benchmarks, indicating internal consistency. The convergent validity of scale items (the extent to which a measure relates to other measures of the same phenomenon) was estimated using Average Variance (AVE), whose threshold value is 0.50. Therefore, the scales used for the present study hold the required convergent validity.

5.4. Principal Component Analysis (PCA)

We conducted Principal Component Analysis (PCA) to arrive at a concise summary of the findings in this study. Table 5 shows the result of our analysis. Concerning the influential factors (personal, social, and financial factors) latent category, only the second component of PCA is key where all standardized regression weights are greater than 0.6. As such, Business Opportunities, Initial and Future income are the most critical reasons for students’ major decisions. The remaining four PCA components (third, fourth, fifth, and sixth) associated with these unobservable variables of our measurement model are irrelevant. Concerning the influential factors, we considered the fourth PCA component, which indicated that Internet Search, Brochures, and Workshops are critical variables. At last, we considered component one of PCA to assess decision support variables. However, further analysis with SPSS AMOS reduced the variable from 11 to 6, where Skills and Job Demand hold the highest loading factors (0.8). Further, how the major aligns with the UAE vision is critical for the students to decide on their major.

5.5. Hypothesis Testing

Independent Samples t-tests were conducted to test the first five hypotheses. While for the last two hypotheses, the bivariate Pearson Correlation was used to measure the relationship strength and direction between the two variables. Moreover, we used an alpha level of 0.05 for all statistical tests.

5.5.1. Testing H1 (12-Year GPA Affects Students’ Decision to Choose STEM Majors)

To examine the first hypothesis, we classified the college majors as either STEM (N = 188 respondents) or non-STEM (N = 303). STEM majors were defined as those belonging to: Engineering, Information Technology, Natural Science, Life Science, and Medicine. The major variable was then assigned a value of 1 if the student selected a STEM major and a value of 0 if they chose otherwise. After that, we calculated the average GPA score for each group. The H1 hypothesis’s test results showed no statistically significant difference (t492 = 1.623, p = 0.105) between the average score (GPA) of students who selected STEM majors (M = 87.52, SD = ±8.80) and students who selected non-STEM majors (M = 86.14, SD = ±9.47).

5.5.2. Testing H2 (Expected Earning Affects Students’ Decision to Choose STEM Majors)

The result of the test does not support the hypothesis (t495 = 1.214, p = 0.225) since there is no significant difference between the means of Future Income (one of the influential factors) of STEM students (M = 2.65, S.D. = ±1.13 Avg. score) and students of other majors (M = 2.52, S.D. = ±1.18 Avg. score).

5.5.3. Testing H3 (Business Opportunities Affect Students’ Decision to Choose STEM Majors)

The result of testing the hypothesis shows that the availability of business opportunities is essential for students choosing STEM majors (M = 2.87, S.D. = ±1.19 Avg. score) compared to students of other majors (M = 2.55, S.D. = ±1.24 Avg. score), t495= 2.825, p = 0.005). Since the p-values for the hypothesis are smaller than the significance level, the H3 result has strengthened our hypotheses.

5.5.4. Testing H4 (Prestige Affects Students’ Decision to Choose STEM Majors)

The result of the test strongly supports (t376.014 = 2.237, p = 0.026) the hypothesis that there is a statistically significant difference between STEM students’ answers about prestige importance (M = 2.45, S.D. = ±1.36 Avg. score) compared to students of other majors (M = 2.17, S.D. = ±1.28 Avg. score).

5.5.5. Testing H5 (Career Advancement Affects Students’ Decision to Choose STEM Majors)

The result of testing H5 supports the impact of career advancement on STEM students. There is a statistical difference (t495 = 3.823, p = 0.001) in students choosing STEM majors expecting career advancement (M = 3.28, SD = ±1.03 Avg. score) than other students of different majors (M = 2.92, SD = ±1.02 Avg. score).

5.5.6. Testing H6 (Career Flexibility Affects Female Students’ Major Decisions)

The T-test results of the H6 show no difference (t495 = 0.167, p = 0.867) in the Career Flexibility factor between female students (M = 2.45, SD = ±1.24 Avg. score) and male students (M =2.50, SD = ±1.34 Avg. score).

5.5.7. Testing H7 (Students Who Are Passionate about a Certain Major Also Tend to Have the Right Skills for It)

In testing the hypothesis, we found a correlation between students’ passion for the college major (M = 2.93, S.D. = ±1.06 Avg. score) and the skills needed for that major (M = 2.85, S.D. = ±1.04 Avg. score). The correlation is moderately positive and statically significant (r = 0.654, p < 0.001).

6. Discussion

6.1. What Factors Influence Students’ Major Decisions?

This study aimed to investigate the factors influencing female students to choose their majors. The results show that most students (>70%) cited choosing a major suited for their gender and one where they expect career advancement. Concerning gender, our results are consistent with various studies showing that male and female students prefer different majors [30,31,33]. Indeed, some majors, such as nursing, are female-dominated [64], while STEM majors tend to be favored more by male students [32]. However, contrary to the extant literature on women desiring a flexible career, we did not find a significant indication for female students to choose their major based on career flexibility. This finding is a novel insight that must be investigated in future research.
Concerning career advancement, most studies shied away from addressing students’ career aspirations when selecting their majors. A recent study showed that students understand the connection between majors and careers. However, less than half of them have a career plan when they select their major [65]. However, our results provide fresh insight into the relationship between projected career growth and major selection.
The results also show that students’ passion and belief in their skills somewhat influence college major decisions. Intriguingly, our correlative analysis shows most students who choose their major based on passion also do so because they believe they have the right skills for the major. This finding is consistent with previous studies showing that students’ interest in the major is a major driver for choosing that major [22,25,37,38]. Similarly, students’ perception of their abilities has been cited as a crucial factor in college major decisions [28,39]. However, it is crucial to help students align their self-perceived skills with their goals when selecting their majors [8,21,23,37].
This research shows that financial factors are highly influential in students’ college majors. Indeed, more than half of the students thought that initial income, growth of income, and availability of business opportunities were highly to moderately influential in their major decision. Unsurprisingly, the three factors (initial income, growth of income, and business opportunities) were highly correlated. Further, our Confirmatory Factor Analysis and Principal Component Analysis have shown that financial factors significantly influence students’ major decisions. Our results are consistent with the literature, where students contemplate income [14,21], although they may not have realistic expectations about it [27]. However, according to our analysis, some personal factors (e.g., gender, career advancement, passion) were not significant
This research shows that social factors such as friends are not highly influential for most students. However, some moderate influence was found for the influence of prestige and social media. Concerning friends’ influence, our results are in line with a study conducted in Saudi Arabia, a neighboring country [21], and other relevant studies conducted in the U.S. [22] and Sri Lanka [23]. However, our results differ from the findings reported in a study conducted in Poland [13], highlighting the influence of family members’ opinions. Concerning prestige, our results agree with findings in other studies indicating that social status has a high impact on students joining a medical school in China [66] as well as undergraduate students in Saudi Arabia [21].

6.2. How Do the Students Choose Their Majors?

The study shows that by far, most students conduct an internet search and use social media to help them decide on their major and that it highly or moderately influences more than half of the students. Existing research on this topic is scarce. However, a recent study cites that students likely use social media and search for college major information on the internet [67]. Interestingly, our correlative analysis also indicates a high correlation between internet searches, social media, and brochures. The correlative analysis is supported by the Confirmatory Factor Analysis and Principal Component Analysis, which identified brochure reading, social media, and internet search as influential activities that students engage in before major-selection decisions. We found it surprising that brochures, a relatively old marketing method, are still impactful amongst Z-generation students.
In comparison, other activities, such as expert discussions and workshops, are less influential for most students. This insight could be helpful to decision-makers to invest in activities deemed significant for z-generation students. Consequently, the availability of college major information online is crucial for students. Future researchers are invited to investigate how students engage in major-selection decisions as some of our results are unique and could be challenged.

6.3. How Can We Support Future Students in Choosing Their Major?

This study shows that students value the availability of information to help them decide on their major. Most students rated most decision support options highly or moderately influential (Figure 7). However, our Confirmatory Factor Analysis and Principal Component Analysis show that students particularly appreciate information about major-related jobs in terms of demand, skills, income, and responsibilities. The correlative analysis reinforces the results as job demand and responsibilities are highly correlated with income. Further, students would also benefit from knowing how their jobs align with the UAE vision, and finally, interviews with experts in the domain are also considered helpful by many students. A study attempted to design a tool showing such information to the students [68], although the tool focused on IT students. Nevertheless, most students found the tool helpful. As such, future researchers are encouraged to study more closely what information is reliable and helpful for future students to decide on their major.

6.4. Influencers of STEM Students’ Major Decisions

This research has focused on the factors influencing STEM students’ major decisions and uncovered five findings. First, we did not find concrete evidence for the 12-year GPA affecting students’ decision to choose STEM majors. This finding contradicts various studies highlighting that high GPAs are associated with STEM majors, such as [45,69]. Second, no statistical evidence was found for the effect of expected earnings on STEM majors. This finding is inconsistent with an existing study citing that an increase in expected wages for average graduates from STEM fields by ten percent raises the probability of choosing a STEM major by about four percent [70]. Third, we found significant statistical evidence showing that students choosing STEM majors rated business opportunities differently than others. We could not find a study that tested this hypothesis. Still, a related study has found that engineering (a branch of STEM) students exhibited more favorable attitudes toward entrepreneurship than other students [71]. Nevertheless, further investigation is needed to tackle this topic. Fourth, our results show that students choosing STEM degrees consider prestige more important. Existing studies such as [21] have cited prestige as a fact that students generally consider. However, this study contributes a unique insight into the relationship between social status and the desire to join STEM degrees. Fifth, our results point to significant evidence for the relationship between the expectation of career growth and the STEM degree choice. We find it unsurprising that students associated STEM majors with career advancement, considering the market demand for such majors and their possibilities for career growth.

7. Study Limitations

Several limitations may have affected the results of our study. First, the study was conducted at one university in the UAE at two campuses (Abu Dhabi and Dubai). As such, the surveyed students may not represent all the students at the same level in the UAE. Second, the study sample is dominated by female students. Despite the presence of a minority of male students in the survey, this study mostly represents female students. As such, future researchers may replicate the study with a more balanced number of female and male participants. Third, most of the participants are Emirati nationals, and only a few are international UAE-based students. Consequently, this study is not representative of all UAE-based students. Despite the limitations, the findings of the study should still be considered a valuable case study because of the interesting findings for decision-makers.

8. Conclusions

This research investigated the factors influencing mostly female UAE students at Zayed University to select their majors. Further, the study explored students’ actions to help them form a major decision. Last, the study evaluated what information could be helpful to support future students with college major decisions. Our findings are as follows. Students are mainly influenced by financial factors such as initial and future income and business opportunities that their future major could unfold. Further, there is some influence of personal factors such as gender suitability and passion for the career. On the other hand, social factors such as parents, siblings, or friends are less influential for most students.
This research also identified that most students conduct internet searches, use social media, and read brochures, and such actions greatly influence most students. On the other hand, workshops and discussions with experts are mostly uninfluential or not done at all. In terms of information that could be helpful for college major decisions, students cited major alignment with the UAE vision and job-related information such as income, skills, and responsibilities.
This research uncovered interesting findings about students who chose STEM majors. Those students seem to be more influenced by the availability of business opportunities than others. Further, they cited prestige as a more important influencer on their decision than others. Finally, they are more influenced by the potential for career growth than others.

Author Contributions

Conceptualization, M.A.K., J.N. and H.A.K.; Methodology, M.A.K. and J.N.; Software, M.A.K. and J.N.; Formal analysis, M.A.K. and J.N.; Investigation, M.A.K., J.N., H.A.K., S.K. and S.A.; Data curation, M.A.K., H.A.K., S.K. and S.A.; Writing—original draft, M.A.K., J.N., H.A.K. and S.K.; Writing—review & editing, M.A.K., J.N., H.A.K., S.K. and S.A.; Visualization, M.A.K., J.N., S.K. and S.A.; Supervision, M.A.K., J.N. and H.A.K.; Project administration, M.A.K.; Funding acquisition, M.A.K. All authors have read and agreed to the published version of the manuscript.

Funding

This work was supported by Zayed University, UAE, under grant number R20131.

Institutional Review Board Statement

The study was approved by the Research Ethics Committee of Zayed University (Application No. ZU21_004_F).

Informed Consent Statement

Informed consent was obtained from the participants of this study.

Data Availability Statement

The datasets generated during and/or analyzed during the current study are available from the corresponding author on reasonable request.

Conflicts of Interest

The authors declare no conflict of interest.

References

  1. Calderon, A. Massfication of Higher Education Revisited; RMIT University: Melbourne, Australia, 2018. [Google Scholar]
  2. Hanushek, E.; Woessmann, L. Education and economic growth. Econ. Educ. 2010, 60, 67. [Google Scholar]
  3. Peterson, P.L.; Baker, E.; McGaw, B. International Encyclopedia of Education; Elsevier: Amsterdam, The Netherlands, 2010; pp. 245–252. [Google Scholar]
  4. Regulatory Authorities of Higher Education. The Official Portal of the UAE Government, 14 June 2022. Available online: https://u.ae/en/information-and-services/education/higher-education/regulatory-authorities-of-higher-education (accessed on 17 June 2022).
  5. McMinn, M.; Dickson, M.; Areepattamannil, S. Reported pedagogical practices of faculty in higher education in the UAE. High. Educ. 2020, 83, 395–410. [Google Scholar] [CrossRef]
  6. Ashour, S. Quality higher education is the foundation of a knowledge society: Where does the UAE stand? Qual. High. Educ. 2020, 26, 209–223. [Google Scholar] [CrossRef]
  7. Emirates Competitiveness Council. The Heart of Competiveness: Higher Education Creating the UAE’s Future; Policy in Action; Emirates Competitiveness Council: Dubai, United Arab Emirates, 2014. [Google Scholar]
  8. Galotti, K.M. Making a “major” real-life decision: College students choosing an academic major. J. Educ. Psychol. 1999, 91, 379. [Google Scholar] [CrossRef]
  9. Freedman, L. The developmental disconnect in choosing a major: Why institutions should prohibit choice until second year. Mentor Acad. Advis. J. 2013, 2. Available online: https://journals.psu.edu/mentor/article/view/61278/60911 (accessed on 25 December 2022).
  10. Hastings, J.S.; Neilson, C.A.; Ramirez, A.; Zimmerman, S.D. (Un) informed college and major choice: Evidence from linked survey and administrative data. Econ. Educ. 2016, 51, 136–151. [Google Scholar] [CrossRef] [Green Version]
  11. Altonji, J.G.; Blom, E.; Meghir, C. Heterogeneity in human capital investments: High school curriculum, college major, and careers. Annu. Rev. Econ. 2012, 4, 185–223. [Google Scholar] [CrossRef] [Green Version]
  12. Bartolj, T.; Polanec, S. College major choice and ability: Why is general ability not enough? Econ. Educ. Rev. 2012, 31, 996–1016. [Google Scholar] [CrossRef] [Green Version]
  13. Sojkin, B.; Bartkowiak, P.; Skuza, A. Determinants of higher education choices and student satisfaction: The case of Poland. High. Educ. 2012, 63, 565–581. [Google Scholar] [CrossRef] [Green Version]
  14. Boudarbat, B.; Montmarquette, C. Choice of fields of study of university Canadian graduates: The role of gender and their parents’ education. Educ. Econ. 2009, 17, 185–213. [Google Scholar] [CrossRef]
  15. Mahani, S.; Molki, A. Factors influencing female Emirati students’ decision to study engineering. Glob. J. Eng. Educ. 2011, 13, 26–31. [Google Scholar]
  16. Šorgo, A.; Virtič, M.P. Engineers do not grow on trees. Glob. J. Eng. Educ. 2020, 22, 168–173. [Google Scholar]
  17. Fernandes, C.; Ross, K.; Meraj, M. Understanding student satisfaction and loyalty in the UAE HE sector. Int. J. Educ. Manag. 2013, 27, 613–630. [Google Scholar] [CrossRef]
  18. Davies, M.A.; Tikoo, S.; Ding, J.L.; Salama, M. Motives underlying the choice of business majors: A multi-country comparison. Int. J. Manag. Educ. 2016, 14, 50–61. [Google Scholar] [CrossRef]
  19. Makhmasi, S.; Zaki, R.; Barada, H.; Al-Hammadi, Y. Students’ interest in STEM education: A survey from the UAE. In Proceedings of the 2012 IEEE Global Engineering Education Conference (EDUCON), Marrakesh, Morocco, 17–20 April 2012. [Google Scholar]
  20. Hammour, H. Influence of the attitudes of Emirati students on their choice of accounting as a profession. Account. Educ. 2018, 27, 433–451. [Google Scholar] [CrossRef]
  21. Aldosary, A.S.; Assaf, S.A. Analysis of factors influencing the selection of college majors by newly admitted students. High. Educ. Policy 1996, 9, 215–220. [Google Scholar] [CrossRef]
  22. Charles, A.M.; Martha, A.H.; Priscilla, A.B. Influences on students’ choice of college major. J. Educ. Bus. 2005, 80, 275–282. [Google Scholar]
  23. Saranapala, I.S.; Devadas, U.M. Factors Influencing on Career Choice of Management and Commerce Undergraduates in National Universities in Sri Lanka. Kelaniya J. Hum. Resour. Manag. 2020, 15, 108. [Google Scholar] [CrossRef]
  24. Yu, S.; Zhang, F.; Nunes, L.D.; Levesque-Bristol, C. Self-determined motivation to choose college majors, its antecedents, and outcomes: A cross-cultural investigation. J. Vocat. Behav. 2018, 108, 132–150. [Google Scholar] [CrossRef]
  25. Sahin, A.; Waxman, H.C.; Demirci, E.; Rangel, V.S. An investigation of harmony public school students’ college enrollment and STEM major selection rates and perceptions of factors in STEM major selection. Int. J. Sci. Math. Educ. 2020, 18, 1249–1269. [Google Scholar] [CrossRef]
  26. Tan, L.M.; Laswad, F. Understanding students’ choice of academic majors: A longitudinal analysis. Account. Educ. Int. J. 2009, 18, 233–253. [Google Scholar] [CrossRef]
  27. Baker, R.; Bettinger, E.; Jacob, B.; Marinescu, I. The effect of labor market information on community college students’ major choice. Econ. Educ. Rev. 2018, 65, 18–30. [Google Scholar] [CrossRef] [Green Version]
  28. Bordón, P.; Canals, C.; Mizala, A. The gender gap in college major choice in Chile. Econ. Educ. Rev. 2020, 77, 102011. [Google Scholar] [CrossRef]
  29. Montmarquette, C.; Cannings, K.; Mahseredjian, S. How do young people choose college majors? Econ. Educ. Rev. 2002, 21, 543–556. [Google Scholar] [CrossRef] [Green Version]
  30. Verdín, D.; Godwin, A. Confidence in Pursuing Engineering: How First-Generation College Students’ Subject-Related Role Identities Supports their Major Choice. In Proceedings of the 2021 IEEE Frontiers in Education Conference (FIE), Lincoln, NE, USA, 13–16 October 2021. [Google Scholar]
  31. Wiswall, M.; Zafar, B. Determinants of college major choice: Identification using an information experiment. Rev. Econ. Stud. 2015, 82, 791–824. [Google Scholar] [CrossRef]
  32. Lowinger, R.; Song, H.A. Factors associated with Asian American students’ choice of STEM major. J. Stud. Aff. Res. Pract. 2017, 54, 415–428. [Google Scholar] [CrossRef]
  33. Speer, J.D. The gender gap in college major: Revisiting the role of pre-college factors. Labour Econ. 2017, 44, 69–88. [Google Scholar] [CrossRef]
  34. Cech, E.A.; Blair-Loy, M. The changing career trajectories of new parents in STEM. Proc. Natl. Acad. Sci. USA 2019, 116, 4182–4187. [Google Scholar] [CrossRef] [Green Version]
  35. Peters, D. The Engineering Gender Gap: It’s More than a Numbers Game. Available online: https://www.universityaffairs.ca/features/feature-article/the-engineering-gender-gap-its-more-than-a-numbers-game/ (accessed on 17 December 2022).
  36. Sterling, A.D.; Thompson, M.E.; Wang, S.; Kusimo, A.; Gilmartin, S.; Sheppard, S. The confidence gap predicts the gender pay gap among STEM graduates. Soc. Sci. 2020, 117, 30303–30308. [Google Scholar] [CrossRef]
  37. Shaaban, K. Investigating the reasons for choosing a major among the engineering students in Qatar. In Proceedings of the IEEE Global Engineering Education Conference (EDUCON), Abu Dhabi, United Arab Emirates, 10–13 April 2016. [Google Scholar]
  38. Ogowewo, B.O. Factors Influencing Career Choice Among Secondary School Students: Implications for Career Guidance. Int. J. Interdiscip. Soc. Sci. 2010, 5, 451–460. [Google Scholar] [CrossRef]
  39. Betz, N.E.; Hackett, G. The relationship of mathematics self-efficacy expectations to the selection of science-based college majors. J. Vocat. Behav. 1983, 23, 329–345. [Google Scholar] [CrossRef]
  40. Cho, J.; Jones, S.; Olsen, D. An exploratory study on factors influencing major selection. Issues Inf. Syst. 2008, 9, 168–175. [Google Scholar]
  41. Gómez, J.; Tayebi, A.; Delgado, C. Factors That Influence Career Choice in Engineering Students in Spain: A Gender Perspective. IEEE Trans. Educ. 2021, 65, 81–92. [Google Scholar] [CrossRef]
  42. Abbasi, M.N.; Sarwat, N. Factors inducing career choice: Comparative study of five leading professions in Pakistan. Pak. J. Commer. Soc. Sci. 2014, 8, 830–845. [Google Scholar]
  43. Sharif, N.; Ahmad, N.; Sarwar, S. Factors influencing career choices. IBT J. Bus. Stud. 2019, 15, 33–46. [Google Scholar] [CrossRef]
  44. Kori, K.; Altin, H.; Pedaste, M.; Palts, T.; Tõnisson, E. What influences students to study information and communication technology. In Proceedings of the 8th International Technology, Education and Development Conference, Valencia, Spain, 10–12 March 2014; pp. 1477–1486. [Google Scholar]
  45. Moakler, M.W., Jr.; Kim, M.M. College major choice in STEM: Revisiting confidence and demographic factors. Career Dev. Q. 2014, 62, 128–142. [Google Scholar] [CrossRef]
  46. Gonzalez, H.B.; Kuenzi, J.J. Science, Technology, Engineering, and Mathematics (STEM) Education: A Primer; Congressional Research Service, Library of Congress: Washington, DC, USA, 2012. [Google Scholar]
  47. Mau, W.C.J. Characteristics of US Students That Pursued a STEM Major and Factors That Predicted Their Persistence in Degree Completion. Univers. J. Educ. Res. 2016, 4, 1495–1500. [Google Scholar] [CrossRef]
  48. Wang, X. Why students choose STEM majors: Motivation, high school learning, and postsecondary context of support. Am. Educ. Res. J. 2013, 50, 1081–1121. [Google Scholar] [CrossRef]
  49. Lee, A. Students with Disabilities Choosing Science Technology Engineering and Math (STEM) Majors in Postsecondary Institutions. J. Postsecond. Educ. Disabil. 2014, 27, 261–272. [Google Scholar]
  50. Berger, M.C. Predicted future earnings and choice of college major. ILR Rev. 1988, 41, 418–429. [Google Scholar] [CrossRef]
  51. Blom, E.; Cadena, B.C.; Keys, B.J. Investment over the business cycle: Insights from college major choice. J. Labor Econ. 2021, 39, 1043–1082. [Google Scholar] [CrossRef]
  52. Åstebro, T.; Bazzazian, N.; Braguinsky, S. Startups by recent university graduates and their faculty: Implications for university entrepreneurship policy. Res. Policy 2012, 41, 663–677. [Google Scholar] [CrossRef]
  53. Ucbasaran, D.; Lockett, A.; Wright, M.; Westhead, P. Entrepreneurial founder teams: Factors associated with member entry and exit. Entrep. Theory Pract. 2003, 28, 107–128. [Google Scholar] [CrossRef]
  54. Colombo, M.G.; Piva, E. Start-ups launched by recent STEM university graduates: The impact of university education on entrepreneurial entry. Res. Policy 2020, 49, 103993. [Google Scholar] [CrossRef]
  55. Breznitz, S.M.; Zhang, Q. Determinants of graduates’ entrepreneurial activity. Small Bus. Econ. 2020, 55, 1039–1056. [Google Scholar] [CrossRef]
  56. Pitt, R.N.; Zhu, L. The Relationship between College Major Prestige/Status and Post-baccalaureate Outcomes. Sociol. Perspect. 2018, 62, 325–345. [Google Scholar] [CrossRef]
  57. Bray, S.; Palmer, S. Reasons stated by commencing students for studying engineering and technology. Australas. J. Eng. Educ. 2006, 1–18. Available online: https://typeset.io/papers/reasons-stated-by-commencing-students-for-studying-2bdsd4vllt (accessed on 25 December 2022).
  58. Kahn, S.; Ginther, D. Women and Science, Technology, Engineering, and Mathematics (STEM): Are Differences in Education and Careers Due to Stereotypes, Interests, or Family? Averett, S.L., Ed.; Oxford Handbooks Online: Oxford, UK, 2017. [Google Scholar]
  59. Frome, P.M.; Alfeld, C.J.; Eccles, J.S.; Barber, B.L. Why don’t they want a male-dominated job? An investigation of young women who changed their occupational aspirations. Educ. Res. Eval. 2006, 12, 359–372. [Google Scholar] [CrossRef]
  60. Flabbi, L.; Moro, A. The effect of job flexibility on female labor market outcomes: Estimates from a search and bargaining model. J. Econom. 2012, 168, 81–95. [Google Scholar] [CrossRef]
  61. Jiang, S.; Simpkins, S.D.; Eccles, J.S. Individuals’ math and science motivation and their subsequent STEM choices and achievement in high school and college: A longitudinal study of gender and college generation status differences. Dev. Psychol. 2020, 56, 2137. [Google Scholar] [CrossRef]
  62. Heilbronner, N.N. Stepping onto the STEM pathway: Factors affecting talented students’ declaration of STEM majors in college. J. Educ. Gift. 2011, 34, 876–899. [Google Scholar] [CrossRef]
  63. Forms, G. Understanding How UAE Students Select Their Majors. Available online: https://docs.google.com/forms/d/e/1FAIpQLSfhgKA3QZRyznVN5ZwZx2XBaYNJ4542jiPL7doT9s7Gp9S1iw/viewform (accessed on 2 September 2022).
  64. McDowell, J.; Schaffner, S. Football, it’s a man’s game: Insult and gendered discourse in The Gender Bowl. Discourse Soc. 2011, 22, 547–564. [Google Scholar] [CrossRef]
  65. Lehmann, C.R. The Influence of Career Motivation on College Major Choice; Rowan University: Glassboro, NJ, USA, 2019. [Google Scholar]
  66. Yang, C.; Jin, X.; Yan, J.; Zhang, J.; Chen, C.; Cheng, Y.; Deng, G. An investigation of the intention and reasons of senior high school students in China to choose medical school. BMC Med. Educ. 2021, 21, 1–10. [Google Scholar] [CrossRef]
  67. Pharr, J.M. Facilitating the Choice of College Major Using the Consumer Decision Process, Content Marketing, and Social Media; Georgia Southern University: Statesboro, GA, USA, 2022. [Google Scholar]
  68. Kuhail, M.A.; Al Katheeri, H.; Negreiros, J. MyMajor: Assisting IT students with major selection. Glob. J. Eng. Educ. 2021, 23, 197. [Google Scholar]
  69. Vaarmets, T. Gender, academic abilities and postsecondary educational choices. J. Appl. Res. High. Educ. 2018, 10, 380–398. [Google Scholar] [CrossRef]
  70. Osikominu, A.; Feifer, G. Perceived Wages and the Gender Gap in Stem Fields. 2018, p. 11321. Available online: https://www.iza.org/publications/dp/11321/perceived-wages-and-the-gender-gap-in-stem-fields (accessed on 25 March 2022).
  71. Dao, T.K.; Bui, A.T.; Doan, T.T.T.; Dao, N.T.; Le, H.H.; Le, T.T.H. Impact of academic majors on entrepreneurial intentions of Vietnamese students: An extension of the theory of planned behavior. Heliyon 2021, 7, e06381. [Google Scholar] [CrossRef] [PubMed]
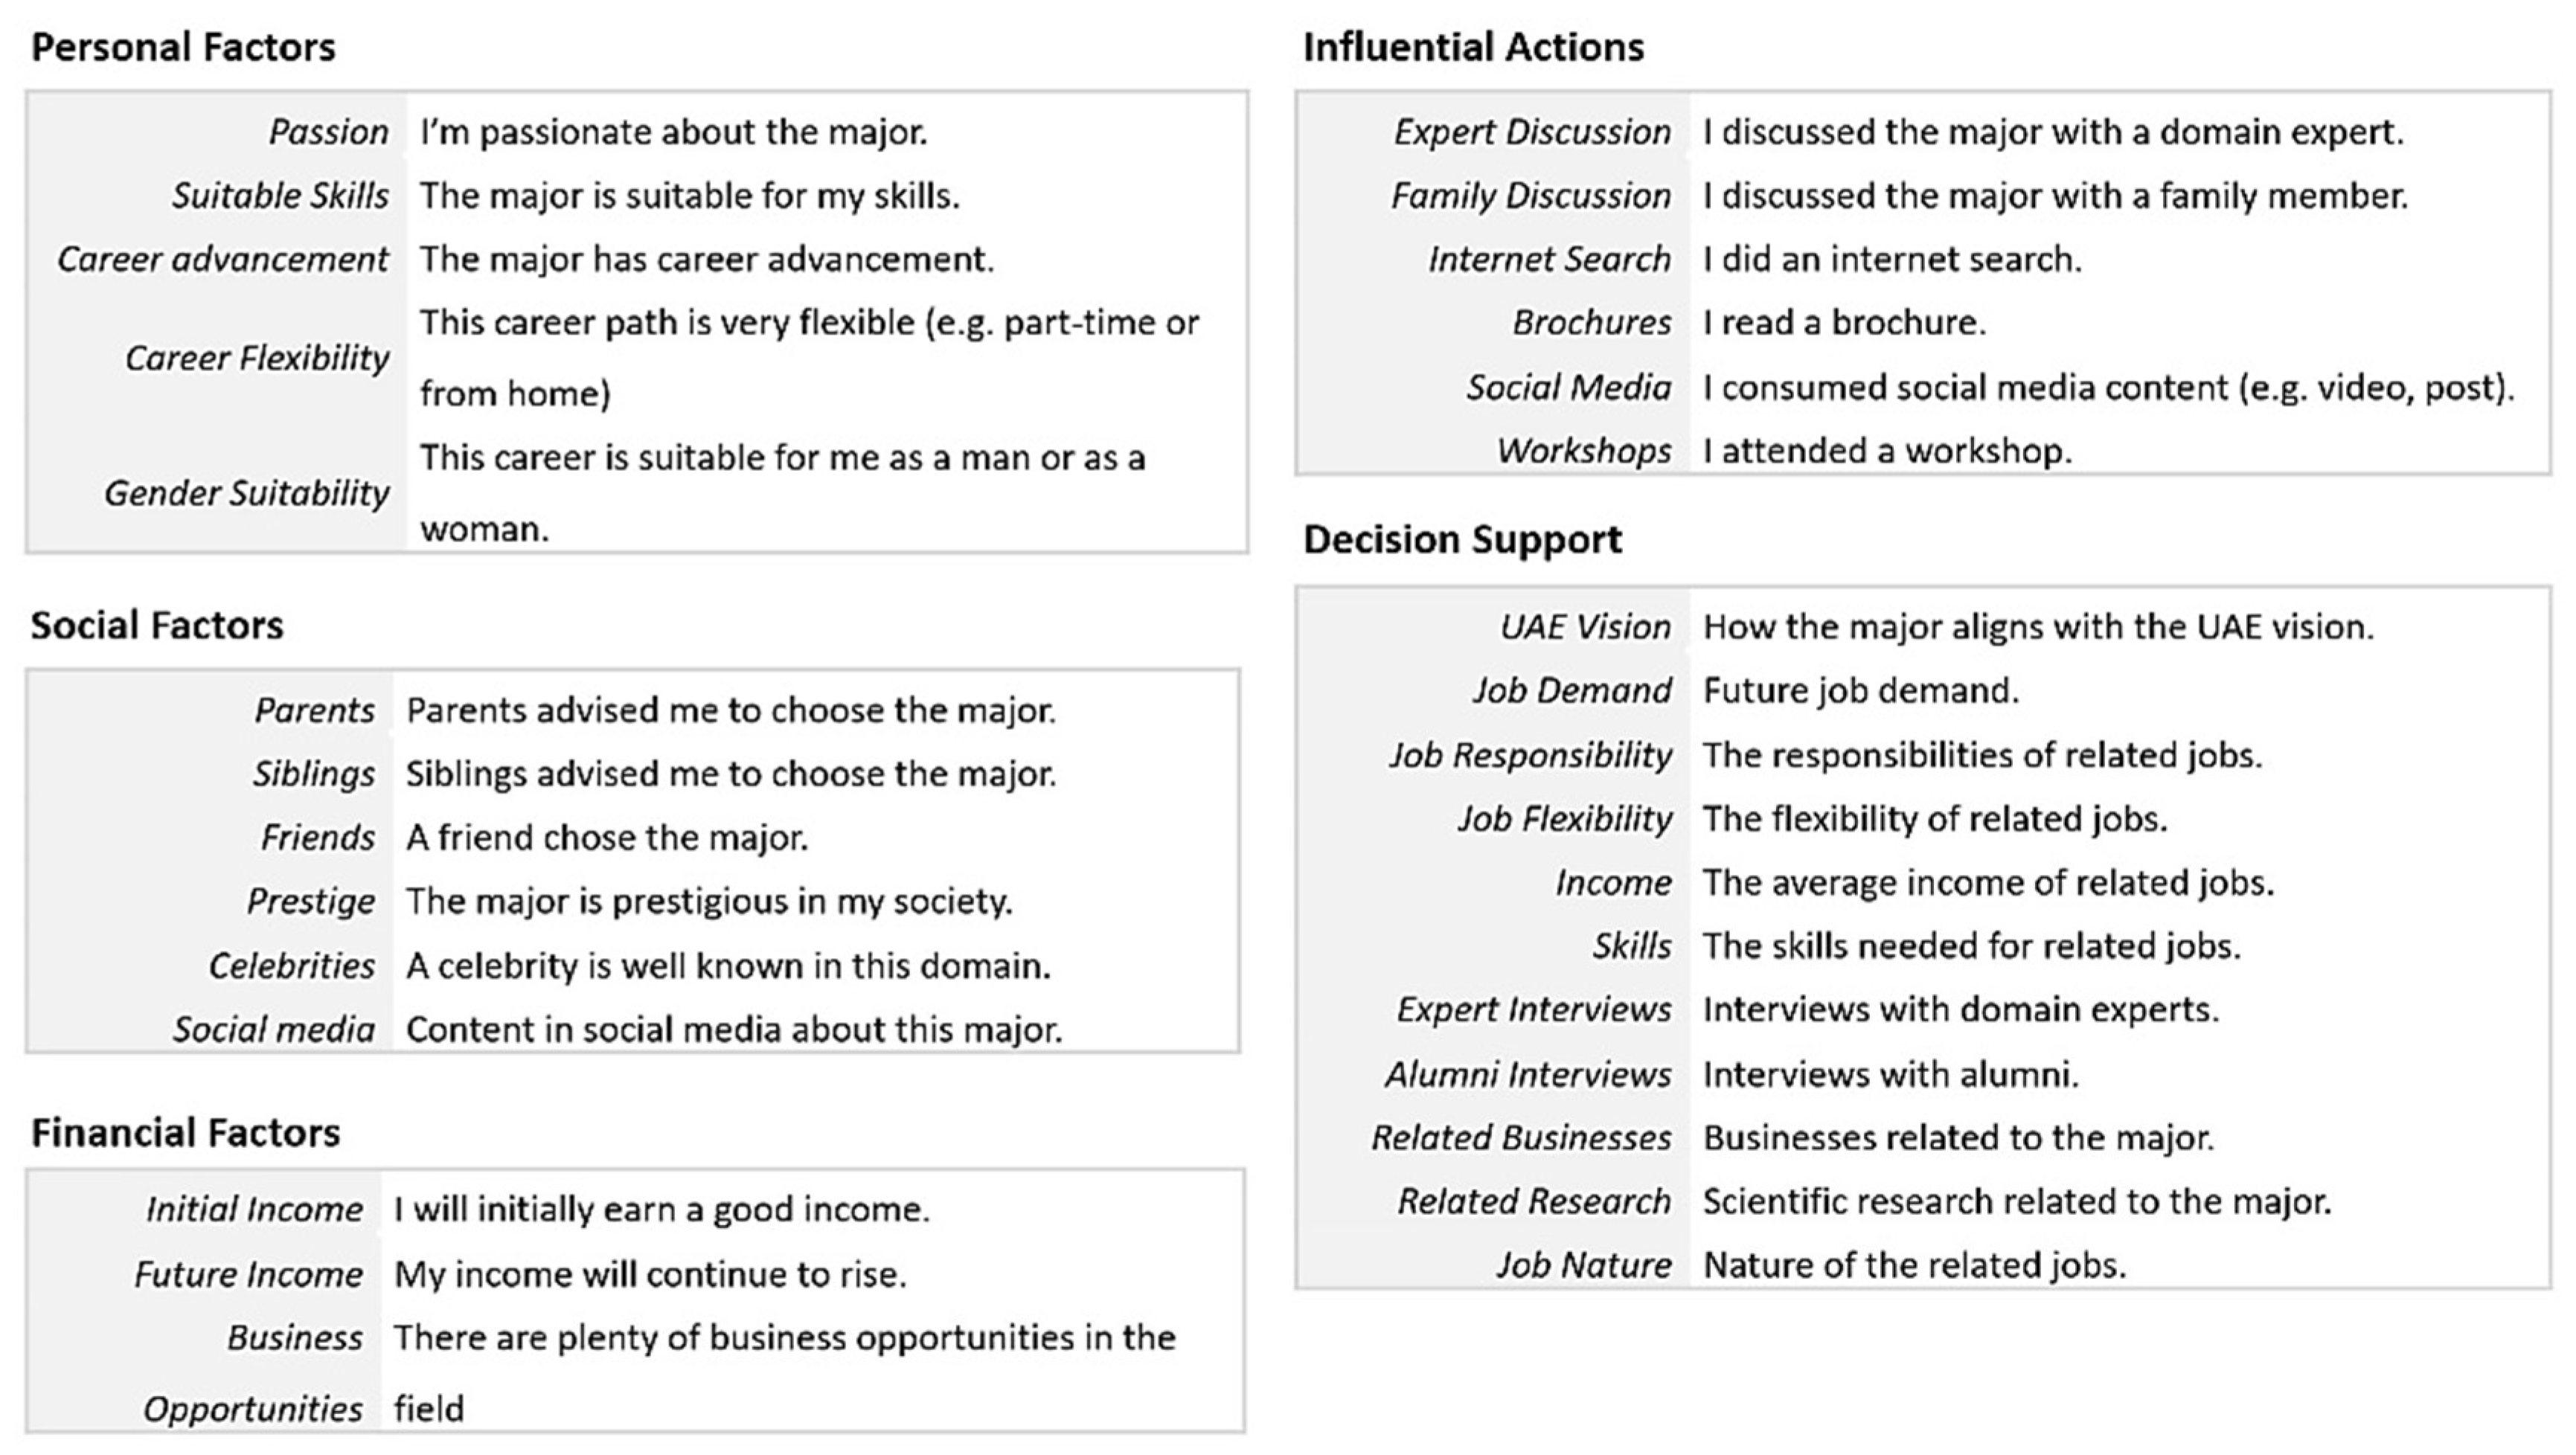
Figure 1. Questionnaire Influential Factors, Actions, and Decision Support Information.
Education 13 00039 g001
Figure 2. Students’ primary languages of education.
Education 13 00039 g002
Figure 3. Distribution of Students’ Year-12 GPA.
Education 13 00039 g003
Figure 4. The residuals follow a Gaussian distribution confirmed by the Durbin-Watson test of 2.117.
Education 13 00039 g004
Figure 5. Students’ ratings of the influential factors of major choice.
Education 13 00039 g005
Figure 6. Actions students performed before deciding on their major.
Education 13 00039 g006
Figure 7. Information that could help future students decide on their major.
Education 13 00039 g007
Figure 8. Influential Factors Correlation Heatmap.
Education 13 00039 g008
Figure 9. Influential Actions Correlation Heatmap.
Education 13 00039 g009
Figure 10. Decision Support Information Correlation Heatmap.
Education 13 00039 g010
Figure 11. Confirmatory Factor Analysis Model.
Education 13 00039 g011
Table 1. An overview of the major selection surveys.
StudyLocationYearAimParticipantsData Analysis (Statistical Tool)Main Findings
[10]Chile2016Explore how students form beliefs about earnings and cost outcomes at different institutions and majors and how these beliefs relate to degree choice and persistence.7382 studentsSignificance tests (for the difference between values for high-SES relative to low-SES);
linear probability models
Interest in jobs associated with the major is a highly influential factor.
[20]UAE2018Assess the association between students’ attitudes and their intentions to major in accounting442 undergraduate studentsMultivariate analysisA strong correlation between students’ attitudes and their intentions to major in accounting.
[21]Saudi Arabia1996Analyze the factors influencing the selection of college majors by newly admitted students.412 new orientation year studentsImportance indexImportant factors:
Job opportunities, expected earnings, social status, and prestige of the major.
[22]The U.S.2005Examine why students initially select majors and which positive and negative factors relate to later changes in those choices.788 business studentsANOVAStudents’ interest in the subject is highly important, followed by job opportunities, and expected earnings.
[37]Qatar2016Investigate the selection of an engineering major in the gulf region440 university studentsManual and Thematic Analysis.Passion for the subjects in the major was the main reason for choosing a major (30.9%), followed by family influence and business opportunities.
[40]The U.S.2008Examine factors influencing students’ selection of a college major and students’ perceptions of the Information Systems major429 responses from students who enrolled in on-campus and high school concurrent enrollment collegeIndependent T-test
between college-aged respondents and high school-age respondents.
Students’ genuine interest in the subject, long-term earning
potential, and job market stability were highly influential.
[41]Spain2022Explore the main factors influencing students to choose engineering studies in Spain, analyzing gender differences.624 UG engineering students from eight different universitiesIndependent sample T-tests were used to determine significant differences between the answers of male and female students.Four factors influence students’ major choices such as: “Interest and development”, “Career advice and previous contact”, “Outcome expectations”, and “Social influences”.
[42]Pakistan2014Assess major factors which influence Pakistani graduates to
make career choices.
370 students from eight different universitiesT-test/ANOVA to determine significant differences between gender and the career-choices.Graduates consider factors such as growth opportunities, occupational charm, societal inspiration, and self-esteem.
[43]Pakistan2019Explore the roles of mothers, fathers, tutors, future income, future status, and societal
in the career choice of young students
167 University of Karachi studentsOne sample t-test and one-way repeated Measure ANOVA by employing SPSS statistical package.Students consider future status, future income, and societal and family influence.
[44]Estonia2014This study explores what has influenced first-year students
to study ICT (Information and communication technology)
517 first-year students from three different universitiesA chi-square testSeveral factors affected students’ choices: owning a computer, computer lessons, family pressure, and earning expectations.
[45]The U.S.2014Understanding pre-college factors that influence students to pursue STEM disciplines335,842 students from 617
institutions
Logistic RegressionThe authors confirmed the effects of academic self-confidence and mathematics self-confidence on engineering major choice.
Table 2. Influential Factors Statistical Data.
Personal FactorsSocial FactorsFinancial Factors
PassionSuitable SkillsCareer AdvancementCareer FlexibilityGender SuitabilityParentsSiblingsFriendsPrestigeCelebritiesSocial MediaInitial IncomeFuture IncomeBusiness Opportunities
Mean2.932.853.062.463.101.900.770.782.281.131.692.572.552.67
Median3.003.003.002.004.002.000.000.002.000.002.003.003.003.00
Mode43424200200234
StdDev1.0601.0441.0401.231.1641.411.251.221.3161.411.4981.1581.1561.229
Skew−0.834−0.846−0.923−0.319−1.2320.0551.471.37−0.2470.9010.243−0.437−0.479−0.524
Kurtosis0.1110.3210.177−0.8720.658−1.260.8790.621−0.991−0.600−1.350−0.593−0.517−0.739
Table 3. Results of the Confirmatory Factor Analysis.
MeasureEstimateThresholdInterpretationCutoff Criteria
CMIN116.777------
DF50------MeasureTerribleAcceptableExcellent
CMIN/DF2.336Between 1 and 3ExcellentCMIN/DF>5>3>1
CFI0.978>0.95ExcellentCFI<0.90<0.95>0.95
SRMR0.041<0.08ExcellentSRMR>0.10>0.08<0.08
RMSEA0.052<0.06ExcellentRMSEA>0.08>0.06<0.06
PClose0.382>0.05ExcellentPClose<0.01<0.05>0.05
CMIN: Chi-square value, DF: Degree of freedom, CFI: comparative fit index, SRMR: standardized root mean square, RMSEA: Square Error of. Approximation, PClose: a statistical significance test of the RMSEA.
Table 4. Discriminant Validity of the Latent Variables.
CRAVEDecision SupportInfluential ActionsInfluential Factors
Decision Support0.8910.5780.761
Influential Actions0.7550.5080.447 ***0.7120.454 ***
Influential Factors0.8730.7020.434 *** 0.838
CR: Composite Reliability, AVE: Average Variance. *** Level of confidence of 99%.
Table 5. Principal Component Analysis (PCA) of the study variables.
Component
123456
Personal Factors
Passion0.185 0.040 0.750 0.196 −0.148 0.122
Suitable Skills0.232 0.046 0.778 0.158 −0.083 −0.037
Career Advancement0.208 0.473 0.581 0.063 0.056 −0.079
Career Flexibility0.101 0.203 0.601 0.049 0.208 0.038
Gender Suitability0.157 0.273 0.708 −0.019 0.083 0.104
Social Factors
Parents0.074 0.205 0.047 0.238 0.636 −0.205
Siblings0.008 0.033 0.027 0.021 0.749 0.118
Friends0.017 0.036 −0.049 0.048 0.686 0.320
Prestige0.142 0.352 0.218 0.170 0.507 0.247
Celebrities0.071 0.155 −0.053 0.193 0.217 0.716
Social Media0.072 0.095 0.162 0.232 0.064 0.694
Financial Factors
Initial Income0.182 0.801 0.140 0.211 0.068 0.120
Future Income0.194 0.806 0.177 0.166 0.068 0.185
Business Opportunities0.152 0.662 0.266 0.180 0.102 −0.033
Influential Actions
Expert Discussions0.067 0.145 0.048 0.583 0.253 0.081
Family Discussions0.152 0.297 0.138 0.493 0.386 −0.275
Internet Search0.237 0.175 0.220 0.631 −0.148 0.127
Brochures0.144 0.196 0.096 0.727 −0.015 0.159
Social Media0.163 0.046 0.226 0.587 −0.109 0.427
Workshops0.035 0.019 −0.036 0.638 0.267 0.105
Decision Support
Job Demand0.751 0.337 0.055 −0.079 0.030 −0.086
Job Responsibilities0.765 0.298 0.114 0.025 0.036 −0.122
Job Flexibility0.743 0.259 0.130 0.027 −0.005 −0.036
Income0.754 0.375 0.072 −0.007 −0.005 −0.062
Skills0.728 0.135 0.268 0.136 −0.016 −0.088
Expert Interviews0.785 −0.120 0.101 0.210 0.034 0.081
Alumni Interviews0.738 −0.127 0.065 0.147 0.043 0.135
Related Businesses0.757 0.020 0.074 0.132 0.086 0.146
Related Research0.708 −0.080 0.138 0.254 0.032 0.184
Job Nature0.764 0.132 0.121 0.116 −0.016 0.086
UAE Vision0.738 0.154 0.158 0.011 0.064 0.077
Disclaimer/Publisher’s Note: The statements, opinions and data contained in all publications are solely those of the individual author(s) and contributor(s) and not of MDPI and/or the editor(s). MDPI and/or the editor(s) disclaim responsibility for any injury to people or property resulting from any ideas, methods, instructions or products referred to in the content.