1. Introduction
Education is intended to be a bridge builder, the great equalizer and the avenue that provides individuals the capacity to make wealth. Horace Mann “declared schools the great balance wheel of society by providing graduates equality of opportunity to pursue wealth” [
1]. This, then, assumes that all students will be in high-performing schools that enable each student to make adequate yearly progress and prepares each of them for college and careers. In light of this, the goals of the No Child Left Behind Act (2002) included raising academic standards for all students, measuring student academic achievement and holding schools accountable for the academic progress of students. States were to establish challenging standards and develop assessments aligned with these standards. These yearly assessments were mostly in reading and mathematics and schools that failed to meet the goals of adequate yearly progress were subject to sanctions [
2]. In line with this, North Carolina created standards and student/school progress are reported via the North Carolina Schools Report Cards. Based on the North Carolina Schools Report Cards, there are several low-performing and failing schools at all levels, schools designated by the State of North Carolina as D or F in the Report Card. Jensen [
3] pointed out that failing schools are often located in poor areas and serve a disproportionate number of students with language needs. (p. 4) A Legislative Analyst Office Report [
4] indicated that on average, educationally disadvantaged students consistently “achieve below federal and state standards and at lower levels than their NED peers. On average, California’s ED students have lower scores than their peers on state assessments at all grade levels. They also drop out of school at much higher rates than their peers.” (p. 4). In their study on Australian schools, Perry and McConney [
5] reported that “all students, regardless of their individual SES, perform considerably less well on measure of academic achievement in school contexts characterized in the aggregate, as low on the SES continuum”. (p. 81). In the same manner, an Organization for Economic Cooperation and Development [
6] study reported that “Students from low socio-economic background are twice as likely to be low performers, implying that personal or social circumstances are obstacles to achieving their educational potential” (p. 9).
There are long term implications for students who are in poorly performing schools and are performing poorly themselves, both for the individual and society. According to an Organization for Economic Cooperation and Development Report, “students who scored in the bottom quartile in the PISA reading assessment were much more likely to drop out of secondary school and less likely to have completed a year of schooling beyond grade 12 than those in the top quartile” [
7].
On the other hand, there are advantages for students and society for turning around low-performing schools. For one, there is the issue of equity in educational opportunities and social justice. Secondly, according to Jensen [
3], a high-performing education system ensures students “leave schools equipped to enter higher education and the labour market. …Poor education, leading to low-wage jobs and unemployment, is of concern for the national economic interest. Knowledge economies rely on good education to develop the key skills and aptitudes that employers require.”. (p. 6).
2. Literature Review
2.1. School Readiness and Achievement
School readiness has been found to be associated with a variety of positive school related outcomes [
8,
9,
10]. According to Furlong and Quirk [
8] “school readiness at kindergarten entry was the most significant factor in predicting children’s later academic success. The effects of age at kindergarten entry, gender, and preschool experience on later achievement was negligible” (p. 88). Continuing this theme, UNICEF [
11] indicated that “School readiness has been linked with positive social and behavioural competencies in adulthood as well as improved academic outcomes in primary and secondary school, both in terms of equity and performance” (p. 4). Majzub and Rashid [
12] pointed out that the variations in pupil school readiness affects human capital development “as academic achievement and future career success can be predicted based on their readiness” (p. 3524). They concluded that children who are more ready “will show higher achievement than children with lower levels readiness “(p. 3525). Valiente, Doane, Clifford, Grimm and Lemery-Chalfant [
13] indicated that students high in school readiness are not “only active contributors to their own academic success, but they may also evoke high-levels of positive feedback from teachers and peers, high-quality instruction, and they may be selected to participate in more advanced activities that provide further opportunities for accelerated growth in academics” (p. 2). In line with the need to improve school readiness for all students, Xu and Arment [
9] found that for low-income children there was positive long-term effects of a summer intensive literacy program on pre-school aged children’s language and literacy skills. In addition, school readiness has been garnering attention as a strategy for economic development. At the middle school level, Kearney and Garfield [
14] reported that “students’ readiness to learn and teacher competence are linked”. (p. 3). They also indicated that other factors—lower school involvement and the absence of teachers who provided a meaningful context for the student—may all impact readiness to learn.
2.2. Economically Disadvantaged and Academic Performance
2.2.1. Economically Disadvantaged Students in North Carolina Schools
In the Final Report to the Joint Legislative Program Evaluation Oversight Committee of North Carolina’s General Assembly [
15], the writers of the report indicated the following based on their study of North Carolina schools:
A student’s economic background is a strong predictor of their academic performance.
The gap in achievement between predominantly disadvantaged districts and more advantaged districts is already present by third grade.
Economically disadvantaged students tend to face increased challenges stemming from their home or community environments and also face heightened challenges at school. The report then recommended that the General Assembly should require districts that are low performing to create an early childhood learning improvement plan to support and serve disadvantaged children before they are of school age (pp. 32–33).
According to the North Carolina Report Card, for 2017-2018 [
16] “schools with a higher percentage of economically disadvantaged students, when compared to the state level results, earned fewer A’s and B’s and more C’s, D’s and F’s than schools with lower percentage of economically disadvantaged students” (p.11). In a 2019 study, WestEd [
17] reported that “More than 400,000 students—over a quarter of the students in North Carolina—attend the 843 high-poverty schools in the state, which represent roughly a third of schools statewide. High poverty schools are schools in which 75% or more of the students are eligible for federally subsidized free or reduced-cost school meals because of their families’ low income”. (p. 95). The WestEd study therefore recommended that more resources need to be put on low-achieving schools and schools in low wealth counties.
2.2.2. Other Relevant Studies on Economically Disadvantaged Students Globally
OECD (2016) pointed out that students who are low performers and from socio-economically disadvantaged backgrounds “may have a more difficult time learning, as not all teachers are adequately trained to handle high concentrations of such students. PISA 2012 found that more than half of the variation in mathematics scores between schools was associated with the socio-economic profile of the school.” (p. 138). The OECD Report concluded that
On average across OECD countries, a student who attends a disadvantaged school is 17 times more likely to be a low performer in mathematics than a student who attends a school with an advantaged student body (i.e., a school in the top quarter of the ESCS index). After the student’s socio-economic status is taken into account, the student in the disadvantaged school is 11 times more likely to be a low performer. This means that while a student’s own background has a significant influence on the likelihood of their being a low achiever in mathematics, the school’s socio-economic profile has an even stronger impact (p. 141).
Papanastasiou [
18] found that the socio-economic status together with the educational background of a student’s family were significantly related. In a 2009 study by the Center for American Progress [
19], they reported that when poverty is combined with ineffective teaching and disorganized schools, then many low-income students struggle to achieve academically (p. 4). In a review of factors associated with poor academic performance of disadvantaged students in Science and Mathematics, Banerjee [
20] found that the main causes included lack of student’s positive attitude towards school and learning, that students in the lowest SES quantile often did not attend school because of their teacher’s expectations of success and finally lack of parental academic involvement, authoritative parenting and lower maternal education (pp. 4–9) were all contributing factors.
3. Purpose of Study
The study aimed to find out the following:
Is there a relationship between incoming readiness and school performance in NC public middle schools?
Is there a relationship between economically disadvantaged students and school performance in NC public middle schools?
4. Method
Participants
Data used in our study come from the NC School Report Cards (SRC) datasets (NCDPI, [
21]. Each public school in the state earns an SRC that contains a grade for the school’s overall performance along with information related to teachers and students. SCR datasets are commonly used sources of data in the empirical literature [
22].
Our analysis sample contains 2 years of data, namely for 2018 and 2017. The dataset is a perfectly balanced panel set and includes 850 observations for 425 middle schools. Since there are 465 public middle schools in NC, our dataset contains over 91% of all middle schools in the state. In total, 40 schools were excluded from the final dataset because they had missing data.
5. Measures and Analysis
5.1. Primary Output Variable
Our dependent variable of interest is a complex measure of school performance. SRCs in NC assign public schools in the state a score ranging from 100 to 0. Similar to student grades, these numeric scores have a related letter grade ranging from A to F. A school’s final score is determined by two inputs. In total, 80% of the score is determined by a school’s achievement scores, which incorporate grade level evaluations, EOG test scores, among other assessments. The remaining 20% of the final score is determined by the academic growth of a school’s students, compared to the statewide average.
5.2. Explanatory Variables of Interest
There are two explanatory variables of interest for our study. The first measures the percentage of children entering the 6th grade who were considered proficient in both math and reading at the end of elementary school. The second explanatory variable of interest measures percent of children attending a school that come from economically disadvantaged households, meaning their households are below the poverty line.
5.3. Other Explanatory Variables
We incorporate other explanatory variables into our analysis, specifically as additional covariates in the estimated regression models. The set of additional covariates includes variables measuring levels of teacher experience at a school, the percentage of teachers with advanced degrees and full licenses, teacher turnover rates, student attendance, the number of books available in the library per student, and average class sizes. We control for these additional variables because they have been identified in the literature as factors that influence school and student performance [
22].
6. Analysis and Results
The analysis and results are presented as follows: First, the frequencies of particular performance grades earned by NC middle schools are presented. Second, we provide descriptive statistics and data visuals for the variables associated with our specific research questions a and b, followed by the hypotheses. Third, the hypotheses are tested with the results from the linear regression and ordered logit.
6.1. Middle School Performance in North Carolina
Table 1 presents the frequency of performance grades earned by middle schools in 2018 and 2017. In 2018, approximately 3% of schools earned As, and in the previous year, that percentage was around 3.5. The percentage of middle schools that received Bs in 2018 dropped compared to 2017. Only 16% of schools earned Bs in 2018, while under 20% received Bs in 2017. A slightly higher percentage received Cs in 2018, around 48%, which is up from the 43% it was in 2017. Around 26% of middle schools earned Ds in 2018, which is less that what it was in the previous year. In 2018, 7% of schools received Fs. In 2017, the percentage was closer to 5.7. Thus, a larger percentage of schools in 2018 earned Cs relative to 2017.
Table 2 displays descriptive statistics for the dependent variable, for both 2018 and 2017. Middle schools performed roughly the same in both years, having average performance scores of approximately 59.
6.2. Incoming Readiness
Question (a) Is there a relationship between incoming readiness and school performance in NC public middle schools?
H1,N: There is not a relationship between incoming readiness and school performance in NC public middle schools.
H1,A: There is a relationship between incoming readiness and school performance in NC public middle schools.
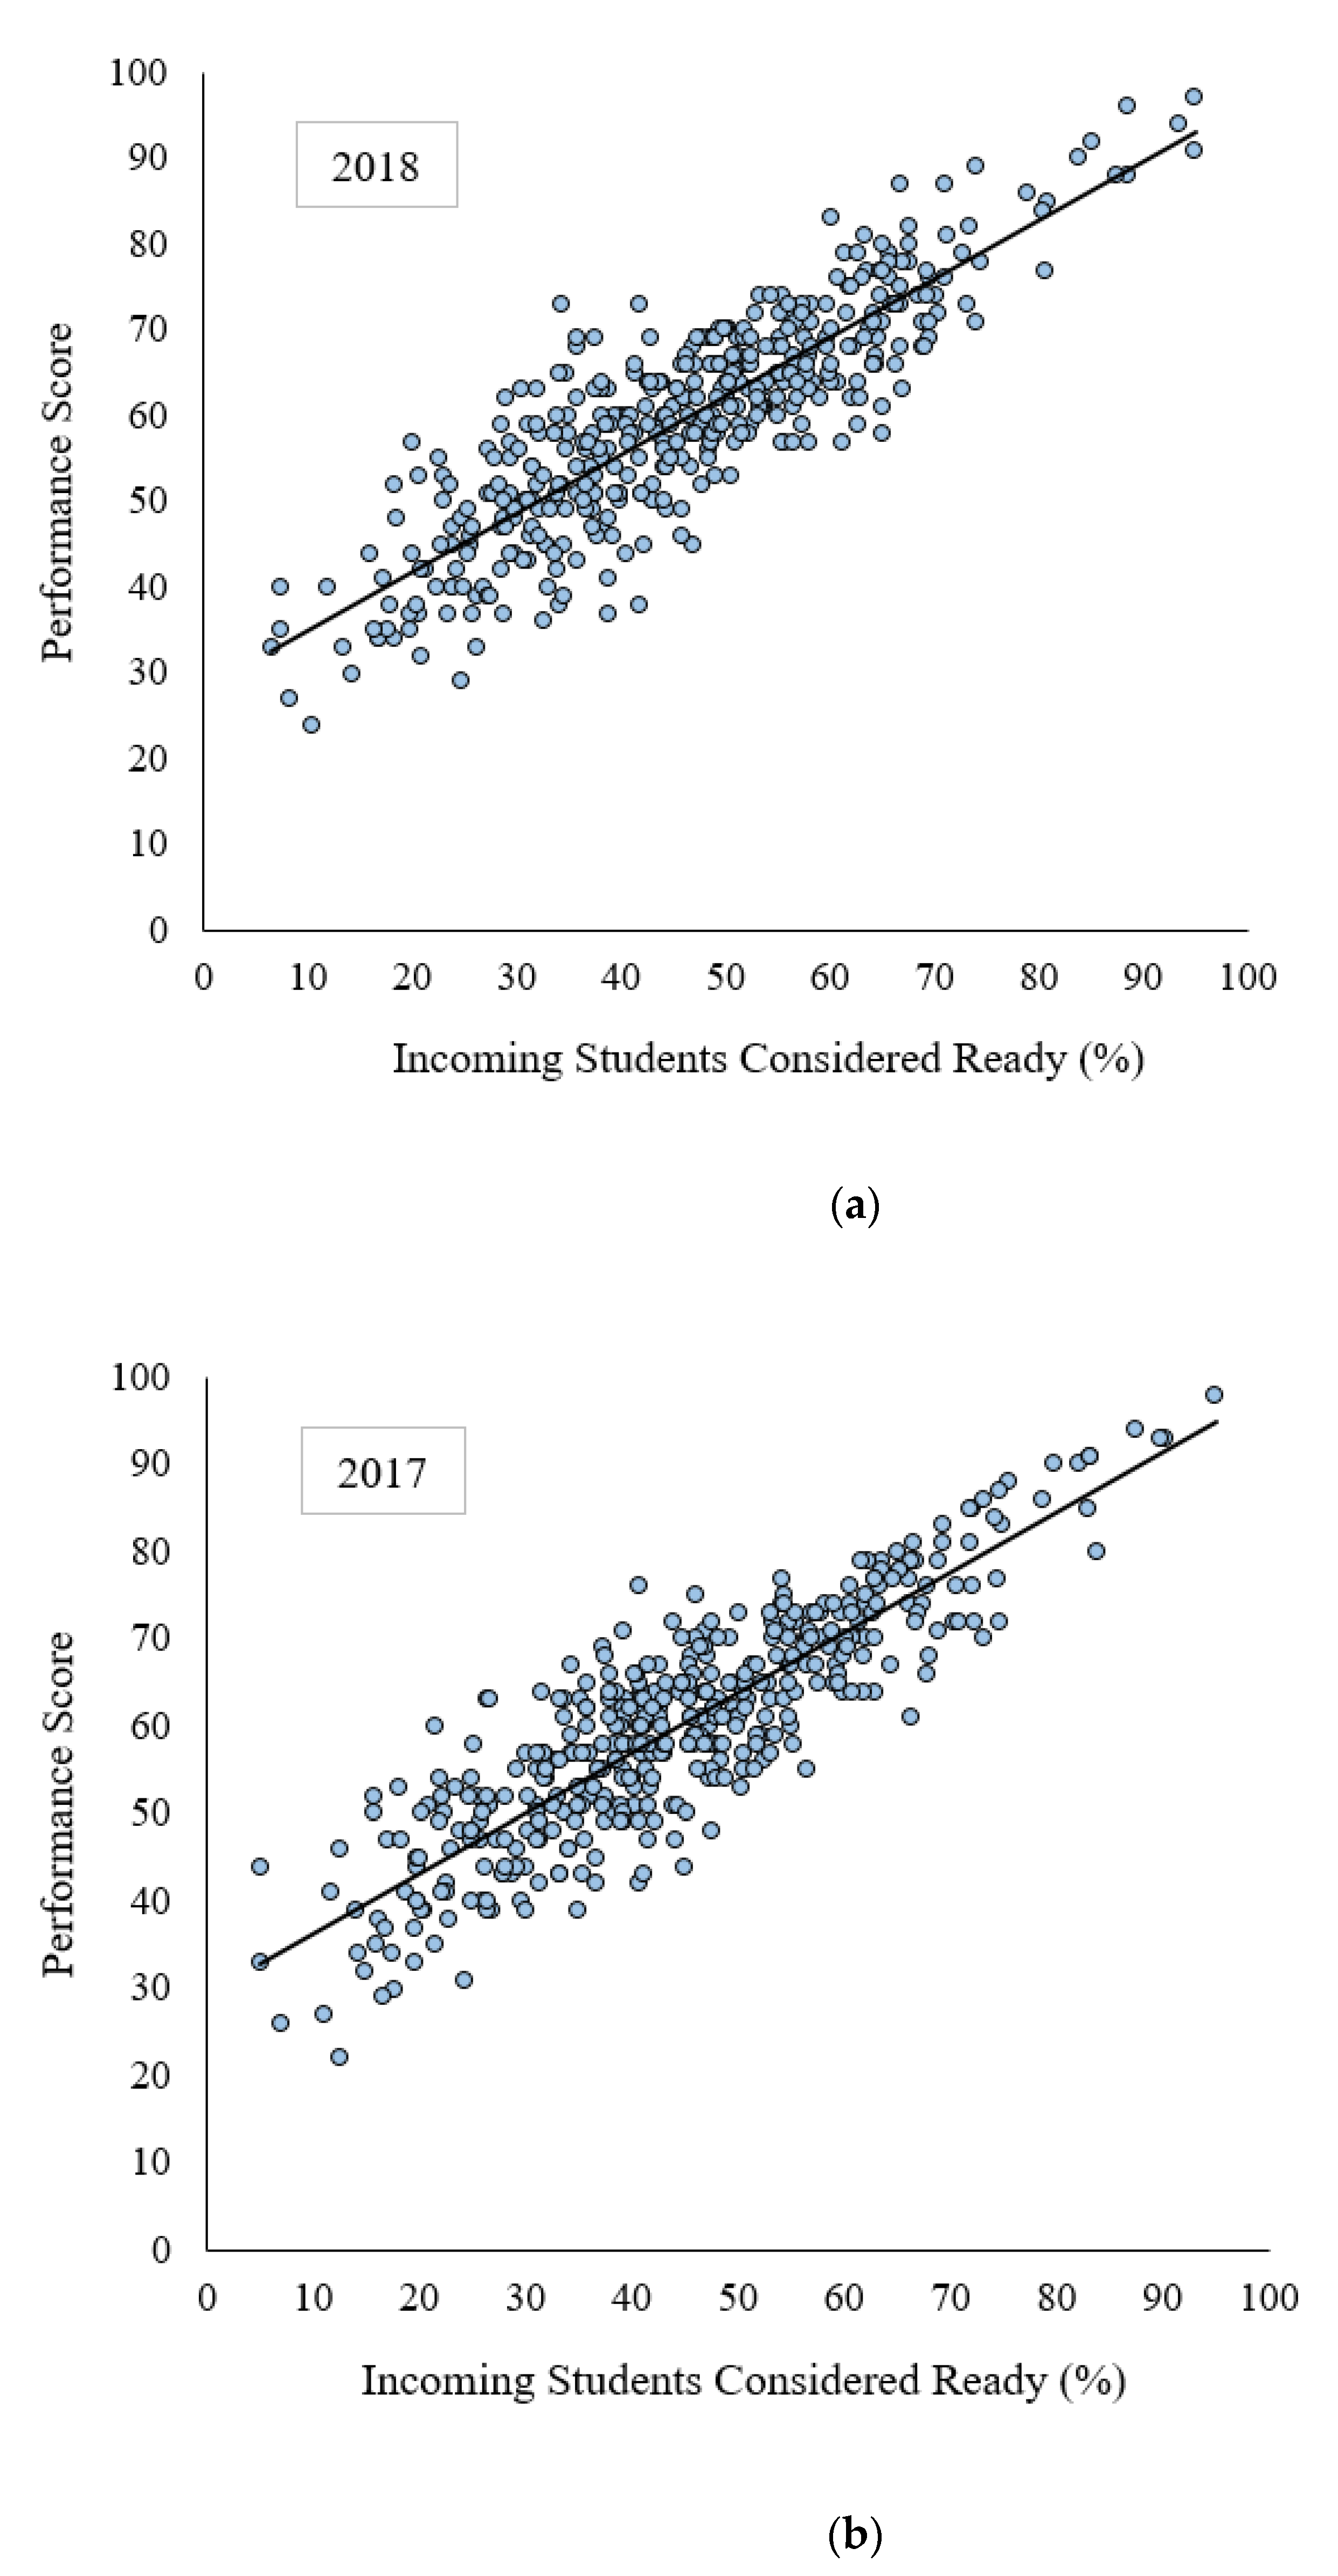
Table 3 shows the descriptive statistics for the incoming readiness variable, for both 2018 and 2017. On average, a larger share of incoming students were considered ready for middle school in 2018 compared to 2017 (45.71% versus 44.12%).
Figure 1a,b shows the share of incoming students considered ready for middle school plotted against the performance score, for NC middle schools in 2018 and 2017, respectively. Both plots show an increasing and linear relationship between the share of incoming students considered ready for middle school and school performance.
7. Economically Disadvantaged Students
Question (b) Is there a relationship between economically disadvantaged students and school performance in NC public middle schools?
H2,N: There is not a relationship between economically disadvantaged students and school performance in NC public middle schools.
H2,A: There is a relationship between economically disadvantaged students and school performance in NC public middle schools.
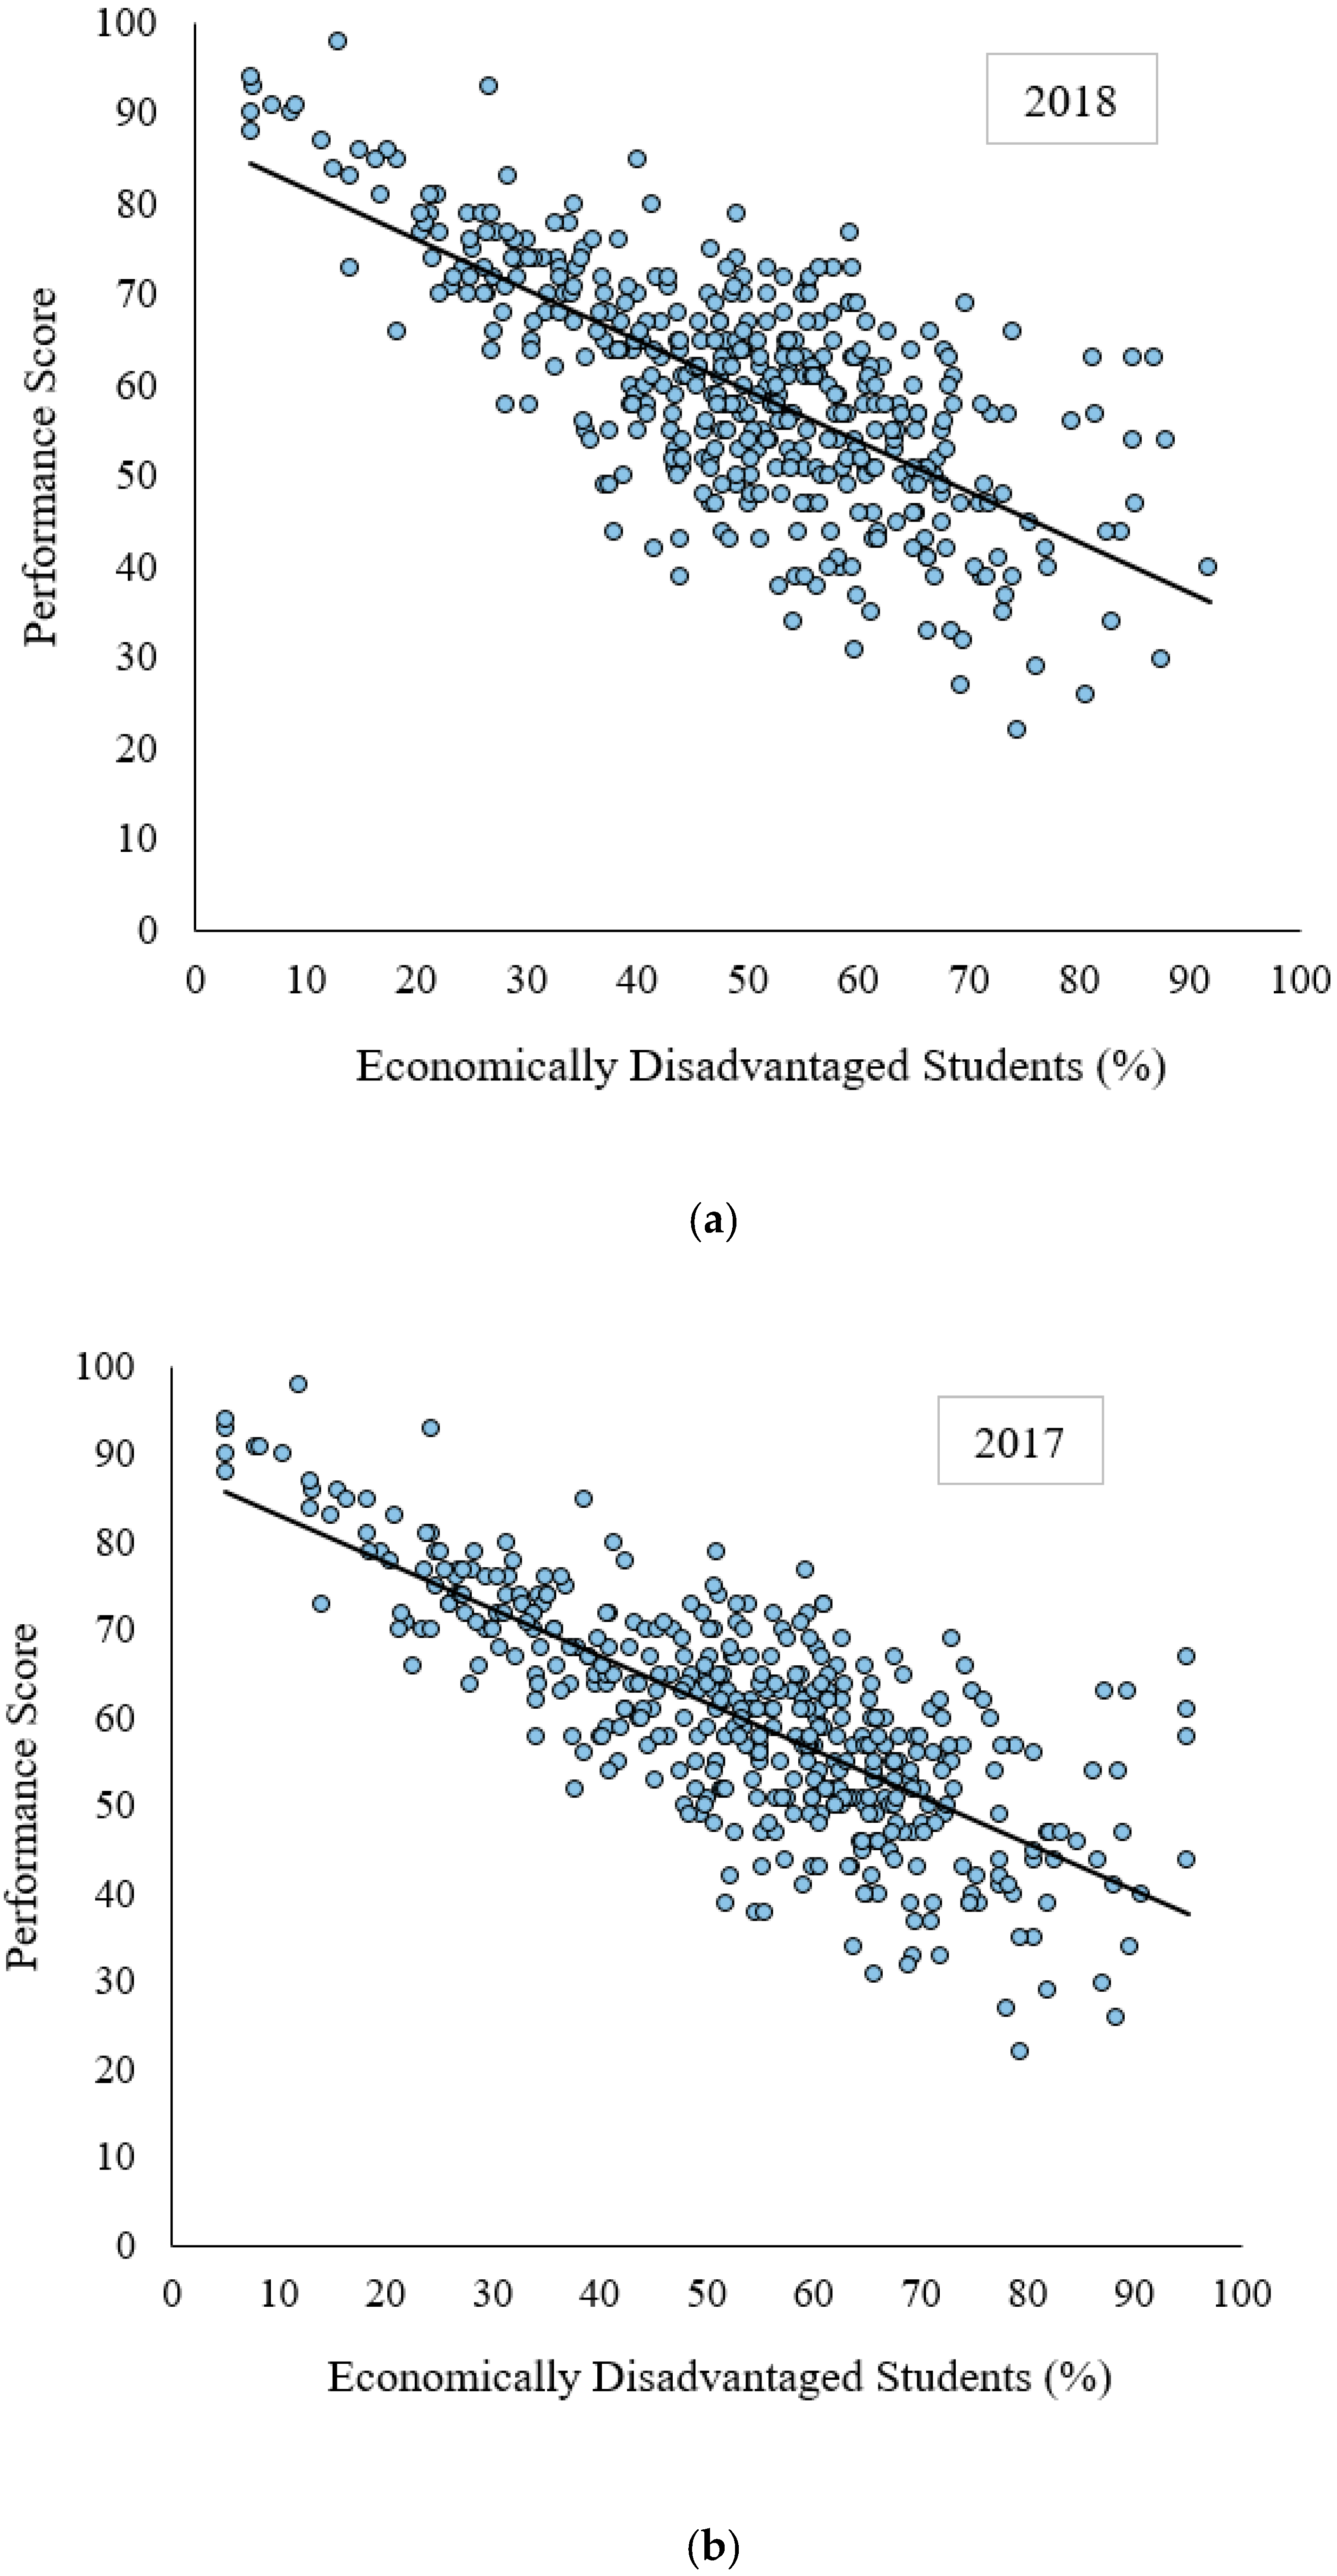
Table 4 displays the descriptive statistics for the economically disadvantaged students variable, for both 2018 and 2017. On average, a smaller share of students were considered economically disadvantaged in 2018 compared to 2017 (49.32% versus 53.65%).
Figure 2a,b shows the percentage of economically disadvantaged students plotted against performance score for NC middle schools in 2018 and 2017. Both plots show a decreasing relationship between percentage of economically disadvantaged students and school performance.
8. Regression Analysis Plan
To examine the relationship between school performance and key variables of interest, we estimate the following model:
where
is the performance score of the
ith middle school.
is the share of students at the
ith middle school that are considered economically disadvantaged.
is the share of incoming students at the
ith middle school that are considered ready for middle school.
is an array of other control variables for the
ith middle school including year, percentage of teachers with 4 to 10 years of experience, percentage of teachers with over 10 years of experience, percentage of teachers with advanced degrees, percentage of teachers with full licenses, rate of teacher turnover, unique book titles per student, and average class size.
is the intercept term and
is the error term. The remaining
s are the slope coefficients. The primary slope coefficients of interest are
and
, which correspond to the primary independent variables of interest.
Model 1 is estimated under two econometric frameworks. First, it is estimated as a multiple linear regression and second, it is estimated as an ordered logit. For the linear regression, the dependent variable of Model 1, , is treated as a continuous variable ranging from 100 to 0. For the ordered logit, is treated as an ordinal variable corresponding to the letter grade a school receives, A, B, C, D, and F (A = 5, B = 4, C = 3, D = 2, and F = 1). The ordered logit allows us to obtain the marginal effect of the change in a covariate on the probability that a school receives a particular letter grade.
Regression Results
Table 5 presents the key results from the multiple linear regression estimation of Model 1. We offer interpretations of the key variables of interest. The economic disadvantage variable is significantly and negatively related to school performance. The coefficient estimate is statistically significant at the 1% level. When the share of students considered economically disadvantaged increases by 1 percentage point, school performance score decreases by 0.126 points, holding all else constant. The incoming readiness variable is statistically and positively related to school performance. The coefficient estimate is statistically significant at the 1% level. When the share of incoming students considered ready for middle school increases by 1 percentage point, school performance score increases by 0.470 points, holding all else constant.
Table 6 displays selected results from the ordered logit estimation of Model 1. The table presents the untransformed estimated logit coefficients. We interpret the results for the key variables. For the logit coefficients, economically disadvantaged students are decreasing with earned performance grade. The logit coefficient estimate is statistically significant at the 1% level. The coefficient estimate for incoming readiness is increasing with earned performance grade. The estimate is statistically significant at the 1% level. Hence, the logistic regression results support the results from the linear regression.
Table 7 displays key results from the ordered logit estimation of Model 1. The table presents the estimated marginal effects (
in the tables) associated with earning an A and earning an F (denoted with a subscript
or subscript
). We begin by interpreting the marginal effects associated with earning an A for the key variables. Economically disadvantaged students score is negatively related to the probability that a school earns an A and the estimate is significant at the 1% level. When the share of students considered economically disadvantaged increases by 1 percentage point, the probability that a school earns an A decreases by 0.00063, holding all other covariates constant at their means. Incoming Students Considered Ready is positively related to the probability that a school earns an A and the estimate is significant at the 1% level. When the share of incoming students considered ready increases by 1 percentage point, the probability that a school earns an A increases by 0.00233, holding all other covariates constant at their means.
We now interpret the marginal effects associated with earning an F for the key variables. Economically disadvantaged students is positively related to the probability that a school earns an F and the estimate is significant at the 1% level. When the share of students considered economically disadvantaged increases by 1 percentage point, the probability that a school earns an F increases by 0.00145, holding all other covariates constant at their means. Incoming Students Considered Ready is negatively related to the probability that a school earns an F and the estimate is significant at the 1% level. When the share of incoming students considered ready increases by 1 percentage point, the probability that a school earns an F decreases by 0.00524, holding all other covariates constant at their means.
To summarize the statistical results, the linear regression and ordered logit estimates complement one another.
We reject H1,N. Hence, we find evidence of a relationship between incoming student readiness and school performance in NC public middle schools. Larger shares of incoming students considered ready significantly predicts school performance. Larger shares of incoming students considered ready leads to higher performance scores.
We reject H2,N. We find evidence of a relationship between economically disadvantaged students and school performance in NC public middle schools. Having larger shares of economically disadvantaged students significantly predicts school performance. The results suggest that having larger shares of economically disadvantaged students decreases a school’s performance score.
9. Discussion
In this study, we found that the incoming readiness variable is statistically and positively related to school performance. The coefficient estimate is statistically significant at the 1% level. When the share of incoming students considered ready for middle school increases by 1 percentage point, school performance score increases by 0.470 points, holding all else constant. We also found that out that when the share of students considered economically disadvantaged decreases by 1 percentage point, school performance score decreases by 0.126 points, holding all else constant.
9.1. Incoming Readiness: Policy Implications
In a study of entering community college students, Li et al. [
23] found that “Math readiness showed strong direct effects on posttest knowledge as well as indirect effects on course success via course behavior” (p. 19). Based on this study, they recommended that each entering student be assessed from “both academic and behavioral risk perspectives” (p. 20) and referred to resources for academic and behavioral skill development. The middle school is a period of transition for many early adolescents. They are challenged academically and socially and according to Goldstein, Boxer and Rudolph [
24] “The difference in the social and academic climates of elementary versus middle school have been implicated as at least partially responsible for students’ decline in motivation and achievement during early adolescence”. (p. 22). Better screening of students entering middle grades, especially those entering low performing schools should be carried out early in the academic year to ensure that students can receive interventions early on. Schools also need to employ more highly qualified teachers to engage students so that their interests and motivation does not taper off in middle school. This tapering off of interests and motivation will lead to lower academic performance. Additional resources are also necessary to allow for improved performance of students who come into middle schools not ready for the grade level.
9.2. Economically Disadvantaged Students: Policy Implications
In the Final Report to the Joint Legislative Program Evaluation Oversight Committee of North Carolina’s General Assembly [
15] authors recommended that the General Assembly should require districts that are low performing to create an early childhood learning improvement plan to support and serve disadvantaged children before they are of school age. Students from economically disadvantaged environments face additional challenges [
20,
21]. One way to help economically disadvantaged students is through the establishment of early childhood learning programs which will allow students to begin acquiring academic and social skills that will enable future success in school. At the university level, Yue, Rico, Vang and Giuffrida [
25], reported that the performance gaps between disadvantaged and advantaged students closed with supplemental instruction (p. 23). This strategy can be modified and used in middle school classrooms to help improve student performance for economically disadvantaged students. A second issue is that many economically disadvantaged students are in less supportive schools with less supportive teachers [
20,
26]. Banerjee [
20] pointed out that teacher’s understanding of student perceptions, favorable relationships and better classroom dynamics all helped to improve attainment of lower socio-economic strata pupils in schools (p. 6). Carlisle, Jackson and George [
27] indicated that research shows the strong impact of teacher expectations on student achievement. They also pointed out that “ Copious research demonstrates that students’ academic success is directly correlated to social identity-based expectations, and that these effects are cumulative when students embody multiple marginalized identities “(p. 58) Moreover, studies by Darling-Hammond [
26] pointed out that many lower SES students were taught by less qualified teachers. So, to improve performance in schools with a high economically disadvantaged student population, not only is there a need to improve the quantity and quality of highly qualified teachers, there is also the need to equip teachers with strategies to improve better classroom dynamics. These teachers will also be able to teach to the needs of all learners, including those needing specific academic interventions. More money spending for educationally disadvantaged students in low wealth districts should also help in improving achievement. Childress [
28] pointed out that in North Carolina, there was great disparity in per pupil spending between urban and rural counties. This disparity caused low-wealth districts to be at a “great disadvantage when it comes to the recruitment and retention of teachers because they can’t compete with the higher supplements paid in wealthier districts.” According to Baker [
29], several national longitudinal studies found that states with greater overall investment in education resulting in more intensive staffing per pupil tend to have higher “outcomes for children from low- income families, higher performance in schools serving children from low-income families and smaller disparities between schools serving children from low-income families and schools serving more advantaged populations” (p. 7).
10. Conclusions
This study showed that the incoming readiness variable is statistically and positively related to school performance. The coefficient estimate is statistically significant at the 1% level. When the share of incoming students considered ready for middle school increases by 1 percentage point, school performance score increases by 0.470 points, holding all else constant. This study also showed that when the share of students considered economically disadvantaged increases by 1 percentage point, school performance score decreases by 0.126 points, holding all else constant. If we are to build high-quality schools for all students, then, every effort should be expended by educators and the school system to get students ready for middle school. Moreover, once in middle school, teachers, parents and the school system should ensure that students are making the adequate yearly progress towards high school. This may call for better assessment of students early in their middle school education so that interventions can be implemented for poor-performing students. There is also the need to have more highly qualified teachers who are properly trained to work with diverse and low-performing students. There is also the need for introducing extended learning during the school day and summers for students not performing at grade level. For economically disadvantaged students, apart from more resources provided for the schools with a high percentage of these students, the teacher factor cannot be underestimated. These teachers will also be able to teach to the needs of all learners, including those needing specific academic interventions.
11. Limitations of the Study
This study is limited to data from the North Carolina Schools Report Card for public schools in North Carolina in 2017. There will be the continued need for further studies for several states to make generalizable conclusions.


