Abstract
Assessing student mathematical knowledge is an important factor in the mathematics learning process because students obtain important feedback to improve their knowledge and learning. Despite the importance of student assessment, several researchers have shown that student grades comprise noncognitive and metacognitive factors and teachers’ prejudices and beliefs. One method to obtain a more objective view of student mathematical knowledge is through standardized assessments. In this paper, we analyze two methods of assessing student mathematical knowledge by considering their written and oral grades and achievements on the Italian National Assessment of Knowledge (INVALSI). The final grade was produced using the fuzzy logic inference system. It was tested on a sample of 2279 Grade 13 Italian high school students, who had both an oral and written grade in mathematics and who took the INVALSI assessment in the school year 2020–2021. Both tested fuzzy-logic-based assessment methods lowered the mean grades.
1. Introduction
Although the assessment of student knowledge is a key element of the pedagogical process [1,2], student grades do not reflect only student academic knowledge; they include information on students’ noncognitive, metacognitive, and affective elements, and their participation in class, attendance, frequency and readiness in delivering homework, and teachers’ prejudices [3,4,5]. In this case, unobjective grades could lead educators and school authorities to have a distorted or even a false picture of the quality of the students’ real knowledge and abilities [6]. For this reason, it is important to develop more objective techniques to assess student knowledge [7].
Another problem related to grades is grade inflation (i.e., the phenomenon that occurs when teachers tend to grade student knowledge with higher grades than those students would obtain in standardized tests of knowledge) [8]. Some researchers [1,9] have proposed using a standardized assessment of student knowledge to normalize excessively high grades and provide a more objective picture of student learning. A study [1] compared teacher-given mathematics grades to student achievements on standardized national assessments of mathematical knowledge, finding that the hypothetical grades students would obtain by considering only their achievements on the national mathematics assessment differ from their actual grades. Similarly, other studies compared teacher-given mathematics grades to student achievements on standardized assessments, finding that these two variables are correlated but not very strongly [3,10]. Similar results have also been reported for Italy, where teacher-given grades weakly correlate with student achievements on the Italian national assessment of mathematical knowledge [11].
From the mentioned research, we understand that teacher-given grades are a subjective measurement of student mathematical competencies, whereas national assessments represent a more objective method of evaluating student mathematical knowledge. Both measures should be considered to determine a more objective method of determining student grades in mathematics [1,9]. However, the current literature has not yet extensively investigated how to implement these two achievements to reduce grade inflation and normalize student grades. To this end, in this paper, we explore a novel method of assessing student mathematical knowledge by considering both teacher-given grades and student achievements on standardized mathematical tests. We use the mathematical theory of fuzzy logic, which is briefly described in the following sections. The results are discussed, and suggestions for educators and policymakers are also presented.
Background
When Italian students finish middle school (i.e., Grade 8), they can choose to continue their secondary education (high school) between four school typologies: scientific lyceums (SLs), other lyceums (OLs), technical schools (TSs), and vocational schools (VSs). The main aim of these four school typologies is to provide students with different knowledge and abilities; thus, the school curriculum differs between the four school types. There is a common curriculum that each school typology must follow, and it is determined on a national basis. Lyceums provide a higher-level academic education specializing in humanities, sciences, arts, and languages, whereas TSs provide more general education and more qualified technical specialization. Moreover, VSs offer students working knowledge, preparing them for the job market [12]. Thus, the different focuses of these four kinds of high schools differentiate the school mathematics programs. In particular, mathematics represents the leading subject in SLs, and it is studied for at least four hours weekly. In OLs (e.g., linguistic), it is not the main subject, and the number of weekly hours is reduced (e.g., two or three [13]).
In Italian high schools, grades are numerical and range from 1 to 10, with 1 being the lowest possible grade and 10 the highest, representing excellency. All grades from 1 to 5 are failing grades, and those from 6 to 10 are passing grades [14]. According to Italian law [14,15], the final student grades are determined by the Class Council, comprising all teachers that teach in a specific class, based on the suggestions of the subject teacher.
Moreover, the School Council, comprising all teachers from a school, decides how grades are obtained [14]. There are two main categories of grades: written and oral [16]. Written grades comprise all grades of the so-called “compiti in classe” (class tests), which are written tests and are protected by special laws. Oral grades comprise all oral assessments, portfolios, assignments, and other written tests not legally recognized as compiti in classe. In some schools, students receive two grades in mathematics at the end of the first semester (i.e., written and oral grades), whereas students receive one grade (e.g., only a written or oral grade) in other schools. However, at the end of the school year, students receive only one grade, a weighted average of all available grades [17].
The Italian national assessment of mathematical knowledge is a standardized assessment, which is prepared, organized, and corrected by the National Institute to evaluate the instruction, formative, and educative system (INVALSI). All students must take a compulsory test of knowledge of Italian (or another minority language), mathematics, and English in Grades 2, 5, 8, 10, and from the school year 2018–19 on in Grade 13 [14]. In particular, the tests for students in Grades 8, 10, and 13 are computer-based tests [14,18]. The mathematical topics assessed by the INVALSI are present in the “Indicazioni per la scuola secondaria di secondo grado” (Indications for high schools), which is a document that presents the topics that teachers should teach in high schools. The INVALSI tests include several questions, varying each year, that are closed-ended (e.g., multiple-choice questions) or open-ended questions (e.g., short answers and long answers). As high school students solve computer-based tests, the questions are chosen randomly from a database; nevertheless, all tests are equally difficult and are comparable [18]. Each student is assessed with a numerical value on a quantitative scale (Rasch), where the average of all Italian students is 200, and the standard deviation is 40 [19,20]. The method is also used by several international standardized tests (e.g., the PISA and TIMSS) and is detailed in the official documents [21,22]. The INVALSI assessment is believed to be an objective measure of student knowledge [23], although it cannot measure some factors, especially metacognitive and cognitive ones, involved in learning mathematics [18].
2. Review of Literature
2.1. Fuzzy Logic
Fuzzy logic is part of mathematical logic, developed by the Iranian mathematician Lofti A. Zadeh in 1965 [24]. Fuzzy logic represents a mathematically precise way to deal with uncertain quantities, normally verbal descriptions [25]. One of the main concepts in fuzzy logic is fuzzy sets and, related to this, membership functions. A membership function is a function that determines the level of membership of a certain element in a set. In classical logic, an element x might be part of set A (for which we write x ∈ A) or not (x ∉ A); there is no other possibility. In fuzzy logic, such sharp boundaries are “softened,” and we consider the possibility that an element is partially an element of set A. The membership function determines the membership level to a set [26].
Formally, we define a fuzzy set in the following way. We let U be the universal set (of all considered elements) and be the membership function associated with each element of the universal set of its grade of membership in set A. Then, set is called a fuzzy set. The membership function is defined by the user [27]. Several families of membership functions are used frequently:
- triangular function ([26]; a < b < c):
- trapezoidal function ([26]; a < b < c < d):
- Gaussian function [28]:
If we want to use fuzzy logic in real-life applications, we follow three phases, which are known as the “fuzzy process” ([26]; see Figure 1):
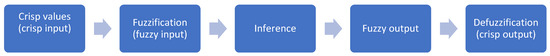
Figure 1.
The fuzzy process.
- fuzzification: We convert clear (crisp) values into fuzzy values via the membership function;
- inference: We use a set of inference rules set by the user, permitting conversion of the fuzzy input values into fuzzy output values; and
- defuzzification: We convert fuzzy output values into clear (crisp) output values using some defuzzification methods.
The fuzzification of crisp values represents the first step in the fuzzy process. This process comprises two steps [25]: determine the membership function for both the input and output data and convert crisp data into verbal variables. Membership functions have different shapes and are chosen by the user, basing the decision on the output. For instance, Gaussian functions are used when greater precision is needed, whereas trapezoidal and triangle functions are used in some rapidly changing dynamic systems [25]. After the fuzzification of crisp data, the inference rule must be defined. It is a logical sequence of the form IF-THEN. The user defines these rules based on everyday experience [25]. The last step is the defuzzification of the data. The result of the inference step combines fuzzy input data and must be converted into crisp data again. Several methods of defuzzification exist. The most used methods are the following [25]:
- Mean of maximum (MOM) is defined as follows:where is the set of all data x which have the maximal grade of membership, and |T| is the cardinality of the set (i.e., the number of elements that composes the set T);
- Center of Gravity (COG) is defined as follows:if the value x is discrete and as:if the value x is continuous.
2.2. Assessing Students’ Knowledge with Fuzzy Logic
The reasons to use fuzzy logic for the assessment are presented by several authors [27,29], summarized as follows. We consider a grading criterion where students obtain a “sufficient” (or “passing”) grade at 50% of the points of a test. We consider two students who achieved 50.1% and 49.9%. Considering the difference in percentages, students have very similar achievements; nevertheless, the first student passes the exam, whereas the second does not. Hence, considering the classical discrimination between passing and not passing might be unfair [27]. Fuzzy logic might soften the boundary between passing and not passing. Another problem in several countries is that the final student grades are determined by averaging all student grades. In most cases, grades are ordinal variables, and no average should be computed [30]. Thus, fuzzy logic represents a solution to this problem because it can be inferred from verbal data.
Fuzzy logic for assessing student work has been studied worldwide, and several models have been proposed. For instance, ref. [31] presented an example of determining the final student grade by considering two written exams and a practical exam. Through a fuzzification of the two written exams and the practical exam with triangular membership functions, ref. [31] inferred the first fuzzy student grade from the two written exams and combined it with the fuzzified grade of the practical exam by defining an inference rule, considering five levels of student achievements. Moreover, they considered the achievements of 20 students and analyzed their final grades, which were obtained using the fuzzy process. The results indicated that the fuzzy process produced lower grades for better-achieving students, whereas it graded lower-achieving students more leniently.
Similarly, ref. [32] proposed a model of assessing student knowledge by considering several factors that influence the final grade. In particular, the author considered four factors. Student achievements were fuzzified using generalized bell-shaped curves, and final grades were obtained using the COG method. In the study, ref. [32] found that, in an experiment conducted with 33 students, grades obtained using the fuzzy process were similar to those grades students obtained using the classical grading methods.
In addition, ref. [26] used student grades from the middle and end terms (i.e., the first and second semesters) to determine the final student grade. Student grades were fuzzified with triangle membership functions, and three levels were considered (i.e., low, middle, and high). After defining the inference rule, they used the continuous COG defuzzification method.
Furthermore, ref. [33] considered a method of assessing student knowledge considering three elements (i.e., student attendance of lectures, internal examination, and external examination (end-of-term examination)). Researchers found that in a sample of 54 students, no statistically significant differences exist between traditional grades and those obtained with the fuzzy process.
Similar research, including student grades and lecture attendance, was proposed by [34]. This research found that students graded using the fuzzy process had significantly higher grades than those graded using the traditional method.
Similar results were found by [29], who found that the average grade of the students graded using the fuzzy process was significantly higher than the average of the students graded using the traditional methods. Nevertheless, these two variables are positively and statistically significantly correlated. In contrast, ref. [35] found the opposite: it lowers student achievements. Moreover, ref. [29] also presented some negative aspects of using fuzzy logic for the assessment of student knowledge:
- inference rules are defined based on experience;
- it is impossible to predict the final result; and
- experience is again used to define membership functions.
Thus, considering these limitations, the major issue with the assessment using fuzzy logic is the subjectivity of the definition of the inference rules and membership functions. Nevertheless, fuzzy logic permits teachers to assess students more objectively because several factors are included [36].
2.3. The Proposed Model
According to the discussed research, assessing student knowledge using fuzzy logic is possible, and several models have been proposed. In the present work, we aim to extend the literature concerning student assessment with fuzzy logic by considering a model that aims to normalize student grades and lower the grade-inflation issue.
The model of assessing student knowledge we propose considers two teacher-given grades and student achievements on the Italian national assessment of mathematical knowledge INVALSI. Final student grades (also “hypothetical grades”) are the combination of the written and oral grades and their achievements on the INVALSI test (Figure 2). We transformed the written and oral grades into fuzzy grades using inference Rule 1 (Fuzzy logic 1). Then, we retrieved the final fuzzified grades through a final inference rule (Fuzzy logic 2).
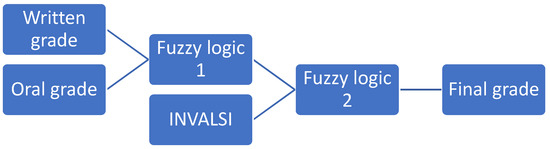
Figure 2.
Proposed model.
3. Materials and Methods
3.1. Aims of the Research
The present paper aims to analyze a novel method of assessing student mathematical knowledge through fuzzy logic. The goal is to generate final student grades from three inputs: (1) written grades; (2) oral grades; and (3) achievements on the Italian national assessment of mathematical knowledge INVALSI. The research questions are the following:
- RQ1: How are the COG hypothetical grades different from school grades?
- RQ1.1: Are the COG, student grades, and INVALSI scores correlated?
- RQ1.2: Is there a difference between COG hypothetical grades and student grades?
- RQ1.3: Do the COG grades differ between the four high school typologies?
- RQ2: How are the MOM hypothetical grades different from the school grades?
- RQ2.1: Are the MOM, student grades, and INVALSI scores correlated?
- RQ2.2: Is there a difference between MOM hypothetical grades and student grades?
- RQ2.3: Do the MOM grades differ between the four high school typologies?
- RQ3: Is there any difference between the COG and MOM hypothetical grades?
3.2. Methodology
To answer the research questions, we used the nonexperimental quantitative research method.
3.3. Sample
In this study, we considered a sample of all Grade 13 Italian students who took the compulsory national assessment of mathematical knowledge INVALSI in the school year 2020–2021. The original sample was retrieved from the INVALSI Statistical Office web page [37] with the previous registration. The official INVALSI sample comprised 20,281 Grade 13 Italian high school students, among which 18,726 (92.3%) had an oral grade in mathematics, 1555 (8.7%) students had a missing oral grade in mathematics; 2500 (12.3%) students had a written grade in mathematics, and 17,781 (87.8%) had a missing written grade in mathematics. From the initial sample, we included only those students with both a written and oral grade in mathematics at the end of the first semester. The sample comprised 2279 Grade 13 Italian high school students, among which 1242 (54.5%) were females and 1037 (45.5%) were males. Moreover, 290 (12.7%) of the sample were students of a SL, 767 (33.7%) were students of an OL, 623 (27.3%) were students of a TS, and 599 (26.3%) were students of a VS.
3.4. Data Collection
In the official sample retrieved from the Servizio Statistico web page [37], several pieces of information are available:
- school typology (i.e., SL, OL, TS, and VS);
- oral and written grades in mathematics; and
- achievement on the INVALSI mathematics test.
These are the only variables of interest. The data were analyzed by the INVALSI Institute and represent a reliable source [20,38]. There is still a slight possibility that the retrieved data contain minor errors, such as in the transcription of oral or written mathematics grades, which is normally the duty of the school [39].
3.5. Procedure
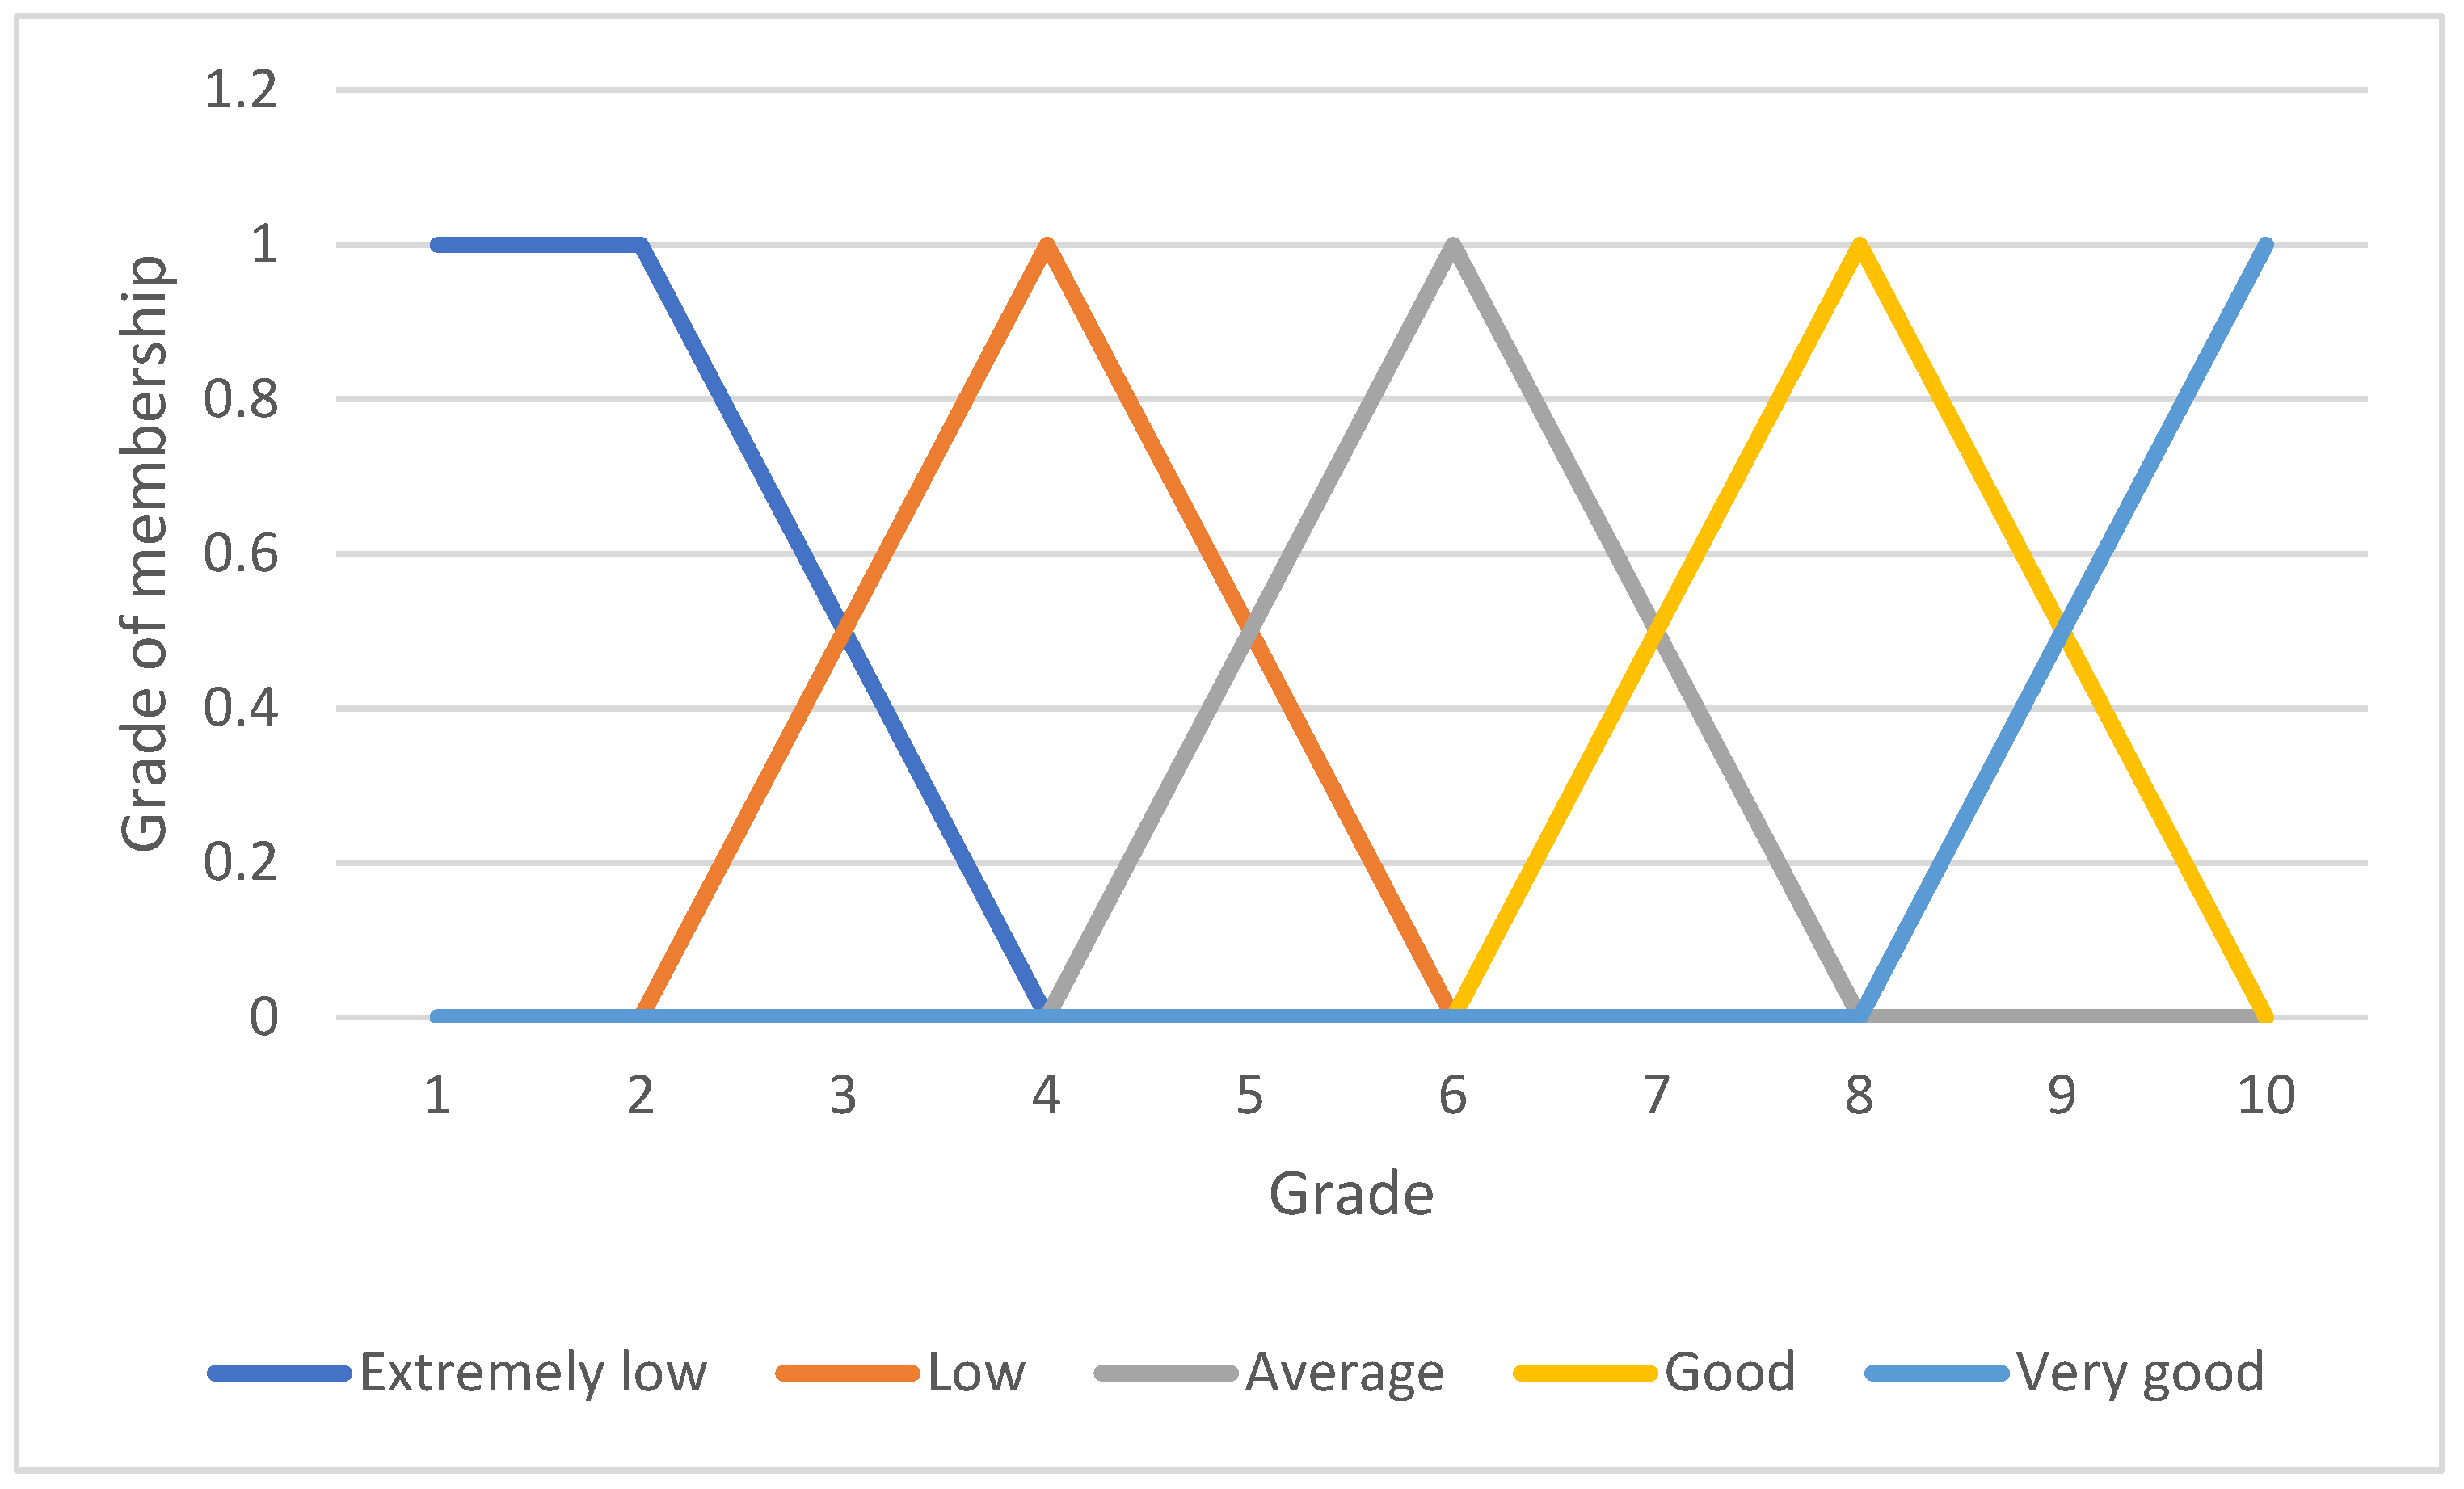
We present the procedure of the fuzzification, inference, and defuzzification of crisp data. To define the membership functions for the written and oral grades, we distinguished five levels: (1) extremely low, (2) low, (3) average, (4) good, and (5) very good. In Table 1, we present the definition of each membership function [26,31]. In Figure 3, we present a graphical representation of such membership functions.

Table 1.
Definition of the membership functions for written and oral grades.
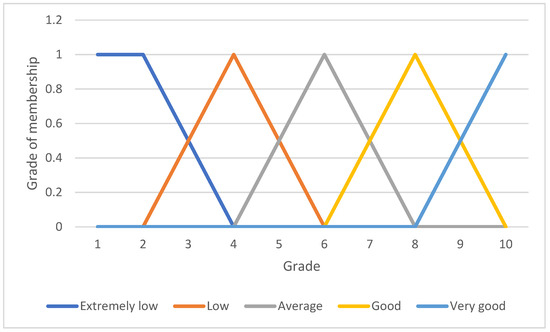
Figure 3.
Graphical representation of the membership functions for teacher-given grades.
Table 2.
The inference rule for Fuzzy logic 1.
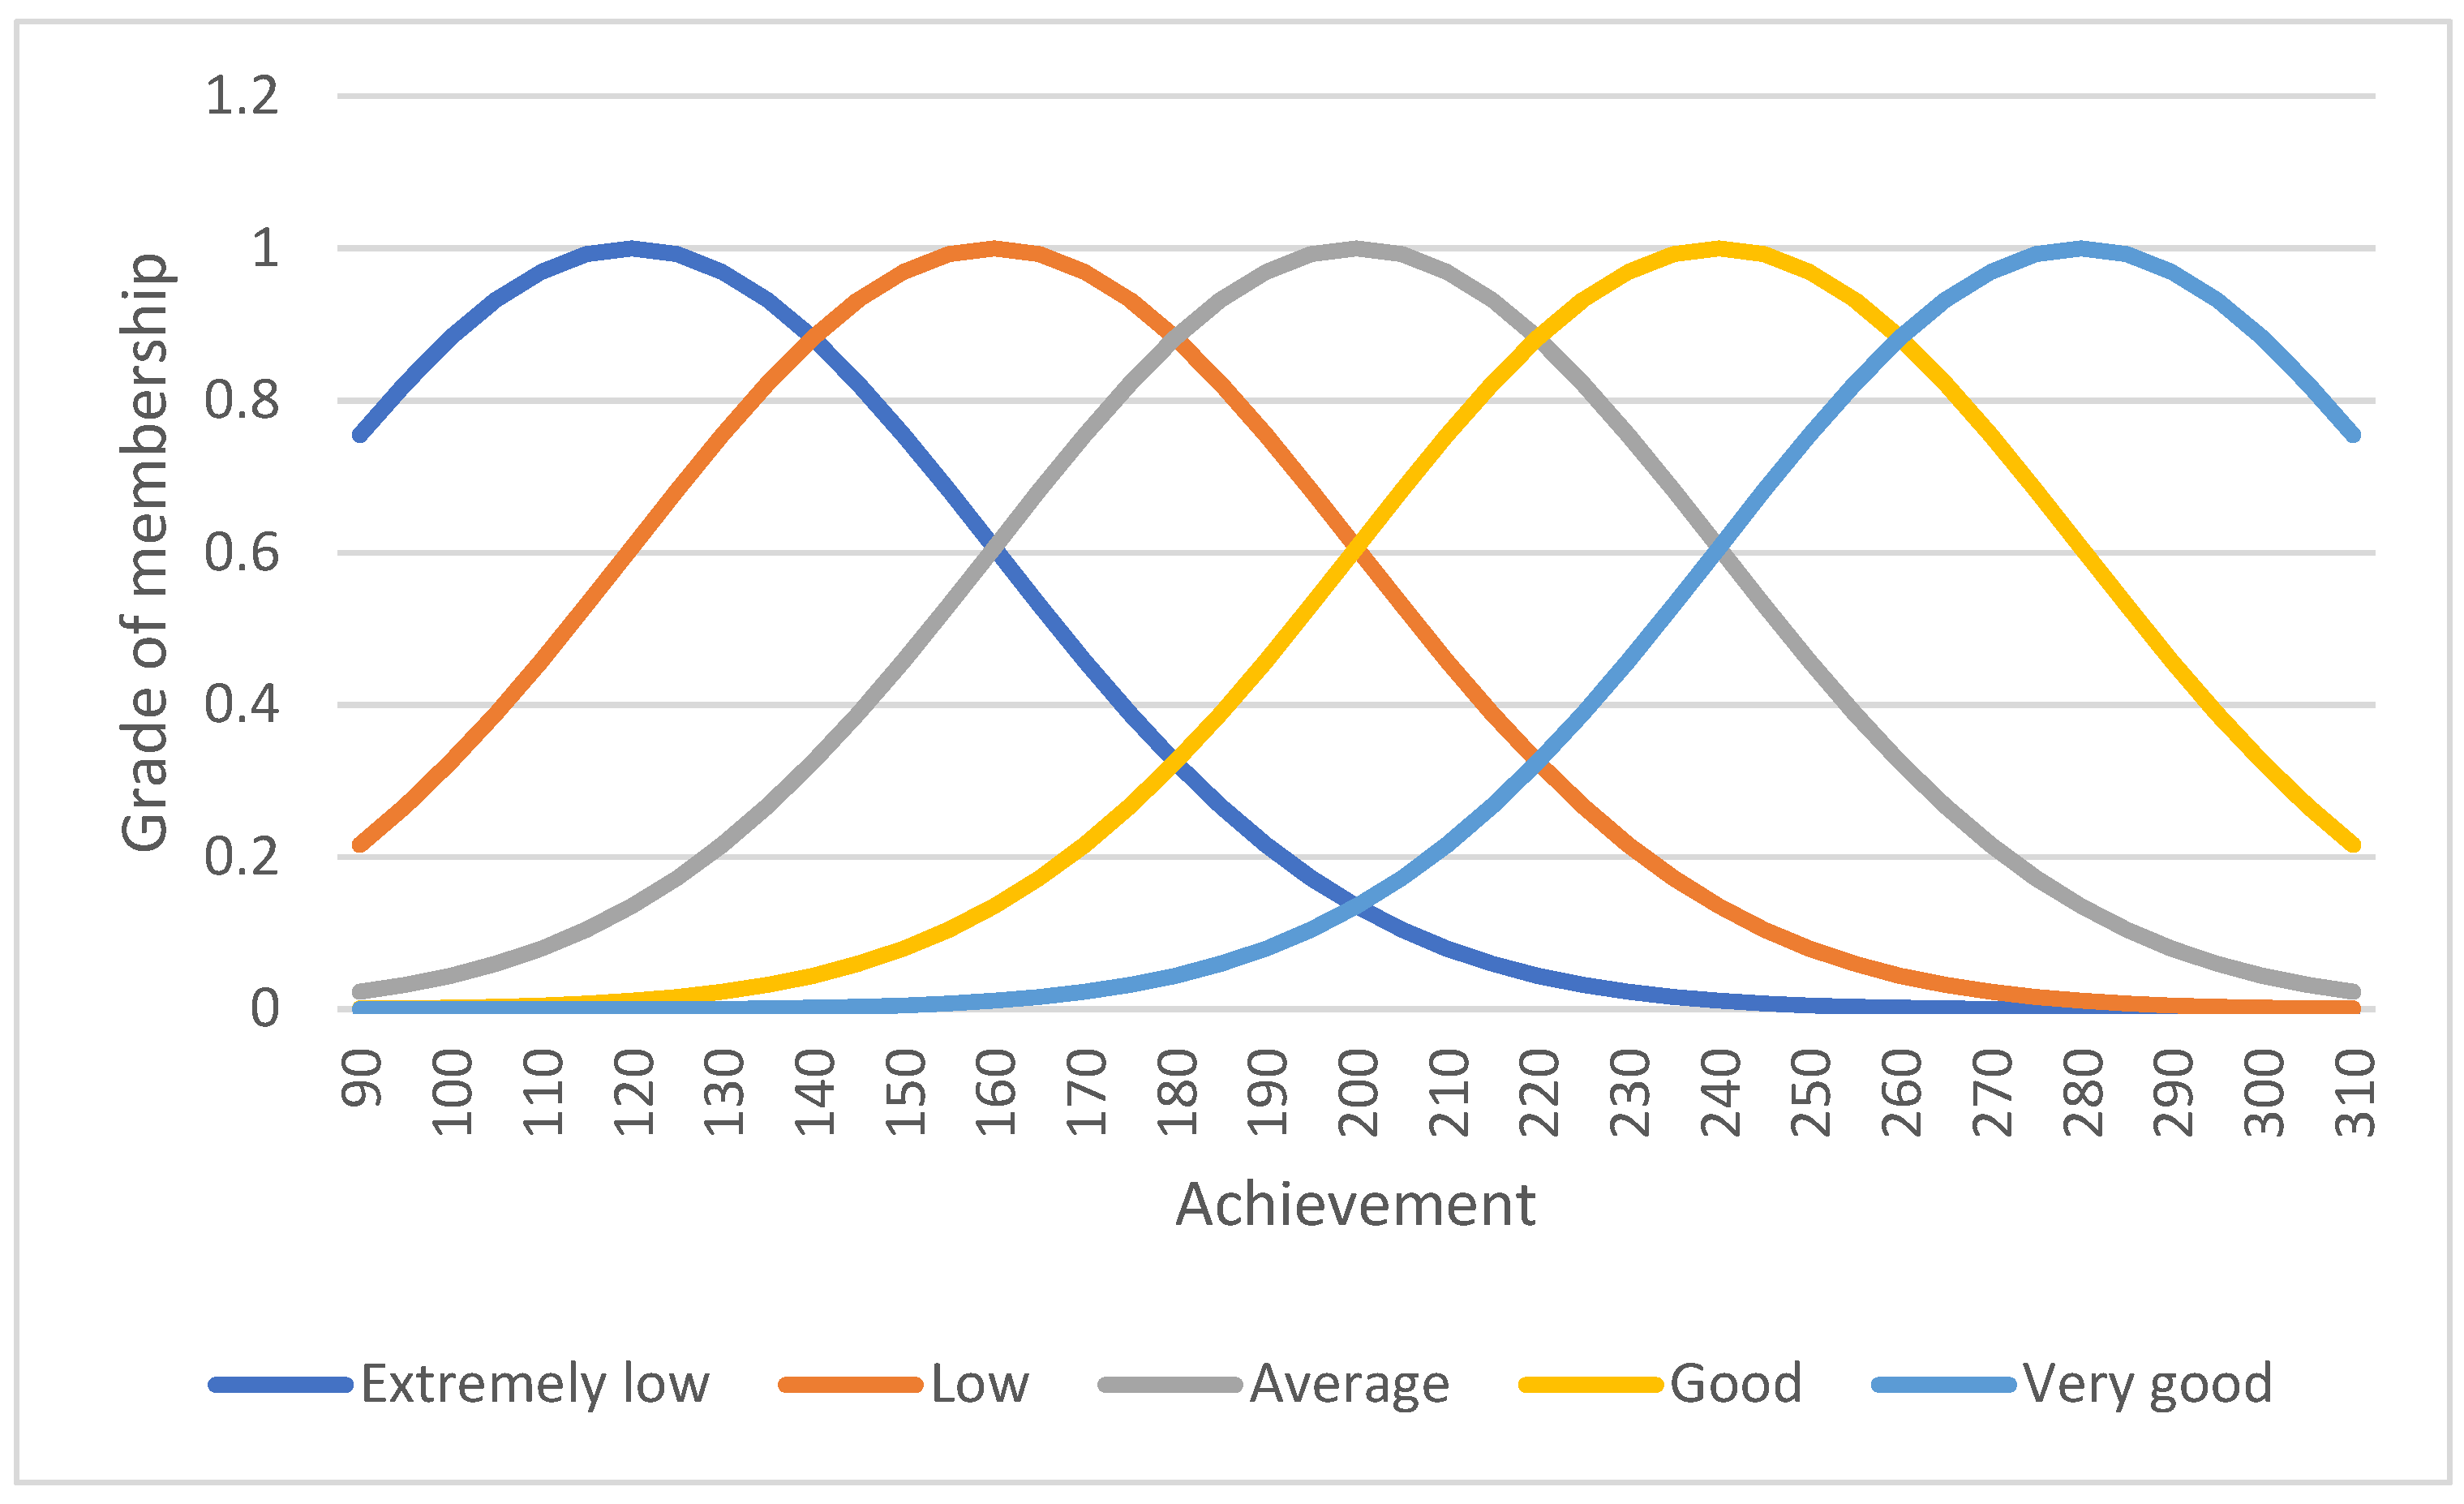
The INVALSI scores were obtained through standardization with an average and standard deviation ; thus, we used Gaussian membership functions to describe student achievements on the INVALSI test with five levels, defined in Table 3 and represented in Figure 4.
Table 3.
Definition of membership functions for student achievements on the INVALSI test (Fuzzy logic 2).
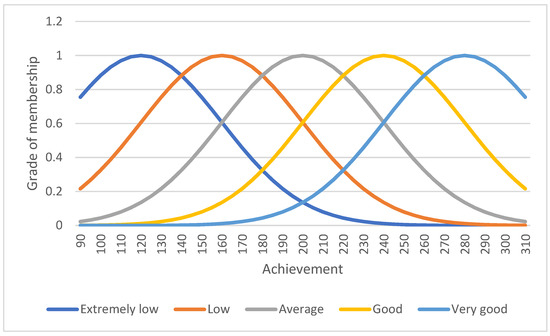
Figure 4.
Graphical representation of the membership functions for the INVALSI test.
We defined the inference rule for Fuzzy logic 1 (i.e., the written and oral grades) and the INVALSI achievements, as presented in Table 4.
Table 4.
The inference rule for Fuzzy logic 2.
The defuzzification process requires a membership function, presented in Table 5. We used the COG and MOM defuzzification methods.
Table 5.
Definition of the membership functions for the defuzzification process.
The defuzzified grades were approximated to the nearest integer, representing the final student grade (or hypothetical grade). In the following sections, “COG hypothetical grades” denote outcomes obtained using the COG defuzzification method, and “MOM hypothetical grades” represent outcomes obtained using the MOM method.
For example, in Table 6, we present how Fuzzy logic 1 (combination of oral and written grades) and Fuzzy logic 2 (final grade) vary for a student with a written grade of 5 and an INVALSI score of 235 among all possible oral grades. We also approximate the outcome of Fuzzy logic 2 to the nearest integer and present the final student grades.
Table 6.
Example of the fuzzy logic system.
3.6. Data Analysis
Crisp (i.e., clear, original) grades were fuzzified using MATLAB R2020b software. We used the Fuzzy Logic Toolbox, which has been used in research related to fuzzy logic [40]. The data were analyzed using the methods of descriptive and inferential statistics with the statistical software Jamovi. We applied the Shapiro–Wilk test to verify that the normality assumption, and nonparametric tests were used because all data significantly deviated from the normal distribution. We employed the Wilcoxon W-test for paired samples to compare two variables, Spearman’s’ ρ correlation coefficient, and the Kruskal–Wallis χ2-test to check the differences between groups. As a post hoc test, we used the Dwass–Steel–Crichlow–Fligner (DSCF) pairwise comparison. Whenever possible, we present the Cohen’s d measure of effect size [41].
4. Results
4.1. Student Grades and Achievements on INVALSI
An initial screening of the raw data was performed to gain an overview of the written and oral grades and achievements on the INVALSI national assessment of mathematical knowledge (Table 7).
Table 7.
Descriptive statistics of written grades, oral grades and the INVALSI scores.
The Shapiro–Wilk test of normality indicates that the written grades (W = 0.988; p < 0.001), oral grades (W = 0.987; p < 0.001), and INVALSI scores (W = 0.985; p < 0.001) depart significantly from normality. Thus, nonparametric tests were used. The Wilcoxon W-test for paired samples revealed that oral grades are significantly higher than written grades (W = 136,705; p < 0.001; Cohen’s d = −0.116), with a mean difference of 0.0878 (SE = 0.0158). Further analysis of the data demonstrated a positive and strong correlation between the written and oral mathematics grades (ρ = 0.856; p < 0.001). A significant moderate correlation exists between written grades and INVALSI scores (ρ = 0.384; p < 0.001) and between oral grades and INVALSI achievements (ρ = 0.380; p < 0.001). Moreover, differences in grades and INVALSI achievements were checked for the four typologies of high schools. The Kruskal–Wallis test indicated statistically significant differences between the four school typologies in the written grade (χ2 = 49.4; p < 0.001; ε2 = 0.0217), oral grade (χ2 = 78.2; p < 0.001; ε2 = 0.0343), and INVALSI score (χ2 = 591.9; p < 0.001; ε2 = 0.2598), as presented in Table 8.
Table 8.
Grades and INVALSI scores between the four school typologies.
The DSCF pairwise comparison highlighted some statistically significant differences in student achievements between the four school typologies, listed in Table 9.
Table 9.
Dwass–Steel–Crichlow–Fligner pairwise comparison for school grades and INVALSI scores between school typologies.
4.2. Center of Gravity Fuzzy Logic and Hypothetical Grades
We calculated the final student grade (i.e., the hypothetical grade) and rounded the real number to the closest integer following the procedure described earlier. Table 10 presents the descriptive statistics of the hypothetical grades.
Table 10.
Descriptive statistics of the COG hypothetical grades.
Table 10 reveals that no student scored lower than 3 or scored a 10. The Shapiro–Wilk test of normality reveals a violation of such an assumption (W = 0.938; p < 0.001); thus, the data are not normally distributed. The hypothetical grades strongly and positively correlate with written grades (ρ = 0.772; p < 0.001), oral grades (ρ = 0.768; p < 0.001), and achievements on the INVALSI test (ρ = 0.750; p < 0.001). Further investigations confirmed that hypothetical grades (M = 5.73; SD = 1.19; Mdn = 6) are lower than the written grades (M = 6.50; SD = 1.43; Mdn = 6) with a mean difference of 0.766 (SE = 0.0192). Such differences are statistically significant (W = 1.25 ; p < 0.001; Cohen’s d = 0.835). Moreover, hypothetical grades are also lower than oral grades (M = 6.59; SD = 1.41; Mdn = 7), with a mean difference of 0.854 (SE = 0.0192). These differences are statistically significant (W = 1.38 ; p < 0.001; Cohen’s d = 0.931). Moreover, differences in hypothetical grades were checked between the four typologies of high schools. The Kruskal–Wallis test indicated statistically significant differences between the four school typologies (χ2 = 289; p < 0.001; ε2 = 0.127; see Table 11).
Table 11.
Center of gravity hypothetical grades between the four school typologies.
The DSCF pairwise comparison in Table 12 demonstrates that all differences between school typologies (except the OL and TS comparison) are statistically significant.
Table 12.
Dwass–Steel–Crichlow–Fligner pairwise comparison of center of gravity hypothetical grades between school typologies.
4.3. Mean of Maximum Fuzzy Logic and Hypothetical Grades
We calculated the final student grade (i.e., the hypothetical grade) and rounded the real number to the closest integer following the procedure described earlier. Table 13 presents the descriptive statistics of the hypothetical grades.
Table 13.
Descriptive statistics of the MOM hypothetical grades.
The Shapiro–Wilk test of normality indicated that the MOM grades are not normally distributed (W = 0.929; p < 0.001). The hypothetical grades moderately and positively correlate with the written grades (ρ = 0.671; p < 0.001) and oral grades (ρ = 0.676; p < 0.001), and strongly correlate with achievement on the INVALSI test (ρ = 0.814; p < 0.001). Further investigations confirmed that hypothetical grades (M = 5.56; SD = 1.76; Mdn = 5) are lower than the written grades (M = 6.50; SD = 1.43; Mdn = 6) with a mean difference of 0.941 (SE = 0.0267). Such differences are statistically significant (W = 1.12 ; p < 0.001; Cohen’s d = 0.738). Moreover, hypothetical grades are also lower than the oral grades (M = 6.59; SD = 1.41; Mdn = 7), with a mean difference of 1.03 (SE = 0.0267). These differences are statistically significant (W = 1.19 ; p < 0.001; Cohen’s d = 0.806). Moreover, differences in hypothetical grades were checked between the four typologies of high schools. The Kruskal–Wallis test demonstrated statistically significant differences between the four school typologies (χ2 = 354; p < 0.001; ε2 = 0.155; Table 14).
Table 14.
Mean of maximum (MOM) hypothetical grades between the four school typologies.
The DSCF pairwise comparisons in Table 15 reveal that all differences between school typologies are statistically significant, except for the OL and TS comparison.
Table 15.
Dwass–Steel–Crichlow–Fligner pairwise comparison for mean of maximum hypothetical grades between school typologies.
4.4. Comparing the Two Fuzzy Grading Methods
As illustrated, both the COG and MOM methods of grading students produce grades statistically lower than the student grades. However, a difference of 0.175 (SE = 0.0197) exists between them. The COG (M = 5.73; SD = 1.19; Mdn = 6) method is less strict than the MOM (M = 5.56; SD = 1.76; Mdn = 5) grading method (W = 57,1125; p < 0.001; Cohen’s d = 0.185). Thus, the grades obtained using the MOM method are statistically lower than those obtained using the COG method. The correlation between the two variables is strong and positive (ρ = 0.809; p < 0.001). Checking the possible differences between the four school typologies, we applied the Wilcoxon W-test for each school, finding that the COG grading system produced higher grades in all school typologies except SL students (Table 16).
Table 16.
Center of gravity (COG) and mean of maximum (MOM) hypothetical grades between four school typologies.
5. Discussion and Conclusions
The present research aimed to analyze how the two proposed fuzzy-logic-based assessment methods differ from the traditional teacher assessment. Before doing so, we screened the raw sample data to gain a clearer view of student achievements. Our preliminary analysis reveals that written grades, oral grades, and achievements on the INVALSI test are not normally distributed. Oral and written grades are strongly and positively correlated, indicating that students with higher written grades have higher oral grades and vice versa. A deeper investigation demonstrates that oral grades are generally higher than written grades. The underlying reason for this difference might be explained by considering what comprises oral grades. For instance, oral grades include information about oral examinations, written tests that are not compiti in classe, homework, project work, and attendance. Thus, several elements are included in this information [3,4,5]. In contrast, written grades consist solely of in-class written tests compiti in classe, which do not include other information about the students.
Although the correlation between written and oral grades is strong, the correlation between written grades and achievements on the INVALSI assessment and between oral grades and INVALSI is moderate. The results indicate that students with higher school grades have higher achievements on the Italian national assessment and vice versa. The correlation agrees with previous research in the Italian context [11]; however, it is much lower than the correlations found in the international literature [3,10]. This fact indicates that several factors influence teacher-given grades, not solely student academic knowledge. The INVALSI assessment, although an objective measure of student mathematical outcomes [23], cannot measure some metacognitive and cognitive factors involved in learning and understanding mathematics [18]. Thus, the fact that the correlations are not strong might be explained by considering what comprises each grade and the peculiarity of the INVALSI assessment.
Moreover, from the initial analysis, the average score on the INVALSI was M = 178, which is lower than the national average of M = 200, and the standard deviation SD = 35.4 is lower than the national SD = 40 [18,19]. Thus, additional care should be taken when data are interpreted and generalized to the whole population of Grade 13 Italian students.
Furthermore, we analyzed student grades between different typologies of high schools, finding statistically significant differences concerning written and oral grades and the INVALSI assessment. Students from SLs have the highest achievements on the INVALSI assessment, followed by TSs, OLs, and, finally, VSs. Such differences have also been found by the INVALSI Institute [18,19] and other research [11] and might be understood considering the different focuses of the schools [12]. Students from SLs have the most hours of mathematics per week [13]; thus, they are more likely to study some topics in detail that are assessed by the INVALSI tests. However, VSs aim to provide students practical knowledge, and mathematics represents a marginal subject. Students from all schools have similar grades, except for VSs, which have the lowest achievements concerning student written and oral grades. This fact might be explained by considering that individual teachers use different assessment methods and criteria, leading to different grades between the four high school typologies.
After a general analysis of the sample, we applied the procedure of fuzzification, inference, and defuzzification using both the COG and MOM methods. First, we checked the final student (hypothetical) grades found using the COG method. The minimal grade was 3, and the maximal grade was 9. No student obtained an excellent (10) grade.
Our first research question regarded student COG hypothetical grades and whether they are different from traditional school grades. First, we aimed to determine whether a correlation exists between hypothetical grades and student grades and INVALSI scores. The correlational analysis found that hypothetical grades are positively and strongly correlated with written and oral grades and achievements on the national test, suggesting that students with higher grades or achievements on the INVALSI test obtained a higher hypothetical grade. This result is unsurprising because hypothetical grades are created using student school grades and scores on the INVALSI test.
Second, a deeper analysis of the differences between traditional teacher-given grades and hypothetical grades reveals a statistically significant difference between these variables. Hypothetical grades are lower than written and oral grades. Considering the Cohen’s d measure of the effect size (d = 0.835 for written grades and d = 0.931 for oral grades), substantial differences might exist between hypothetical grades and student grades. Thus, the fuzzy logic assessment method is stricter than the traditional grading system. Considering a student with oral and written grades of 10 and INVALSI of 280 (i.e., very good), the student would obtain a 9.36 as a Fuzzy logic 1 output and an 8.45 (i.e., a score of 9) as the final output, which does not correspond to what one would expect for excellent performance. Moreover, a student with oral and written grades of 10 and an INVALSI score of 311 (the maximum for the INVALSI in this sample) would obtain a total grade of 8.65 (i.e., a score of 9 once again). A student with a 100 on the INVALSI test (i.e., very low) and a 1 for the oral and written grades would obtain a 2.06 for the Fuzzy logic 1 output and a 2.53 (i.e., a score of 3) as the final grade. Thus, from the presented limitations, the proposed method penalizes excellent students and is a more lenient grading method for extremely low-achieving students. The proposed COG method is unfair considering the three models of grading [42]. Considering a fair grade as the achievement students receive as a reward or punishment for learning or failing to learn course content or institutional values, we understand that excellent students are penalized because they master the course topics (their school grades are excellent) and other institutional material (the grade on the INVALSI test is excellent). Hence, excellent grades are unjustly lowered by at least one grade level in this specific case.
Finally, an analysis of the grade distribution between the four high school typologies was considered. The results indicate a statistically significant difference between the four school typologies. Students from the SLs had the highest average, followed by students from TSs, OLs, and VSs. Although no statistically significant difference was found in oral and written grades for the school typology, with the only exception of VS with the lowest mean, hypothetical grades no longer reflect such a distribution. Nevertheless, hypothetical grades reflect the situation depicted concerning the INVALSI test, where students from the SLs outperformed students from all other school typologies. Thus, the hypothetical grades, reflecting student performances on the INVALSI test, maintain such differences between the four school typologies, with the only exception in comparing OLs and TSs, which have a statistically nonsignificant difference in hypothetical grades.
Our second research question regarded student MOM hypothetical grades and whether they are different from traditional school grades. First, we aimed to understand the correlation between the MOM hypothetical grades and student grades and INVALSI scores. A correlational analysis found that hypothetical grades are positively and statistically significantly moderately correlated with school grades and are strongly correlated with achievements on the INVALSI test. Once again, the result is unsurprising because the MOM hypothetical grades also include information from both student grades and achievements on the national assessment of mathematical knowledge.
Second, we verified whether a difference exists between traditional grades and MOM hypothetical grades. The results demonstrated that hypothetical grades are statistically significantly lower than written and oral grades. The interpretation of the Cohen’s d measures of the effect size (d = 0.738 for written grades and d = 0.806 for oral grades) revealed that the differences between the traditional and novel methods of assessing student knowledge are substantial; hence, the MOM hypothetical grades are generally stricter than traditional ones. A student with oral and written grades of 10 and an INVALSI of 280 (i.e., very good) would obtain a 10 as a Fuzzy logic 1 output and a 10 as a final output, which corresponds to what one would expect from excellent performance. Moreover, a student with oral and written grades of 10 and an INVALSI score of 311 (the maximum possible INVALSI score in this sample) would obtain a total grade of 9.78 (i.e., a 10). In contrast, a student with a 100 on the INVALSI test (i.e., very low) and a 1 for oral and written grades would obtain a 1.50 (i.e., a score of 2) as a Fuzzy logic 1 output and a 1.59 (i.e., a score of 2) as a final grade. Hence, the MOM hypothetical grade does not penalize excellent students as much as the COG method. Thus, the MOM hypothetical grade might be considered a fairer method than the COG, despite some anomalies (e.g., those presented in Table 6 (**)). These anomalies are related to the way data are fuzzified and defuzzified. A graphical example is presented in Figure 5, where the surface of the COG Fuzzy logic 2 (denoted by fuzzy2) is depicted. The anomalies are present due to the waves and irregularities of the surface.
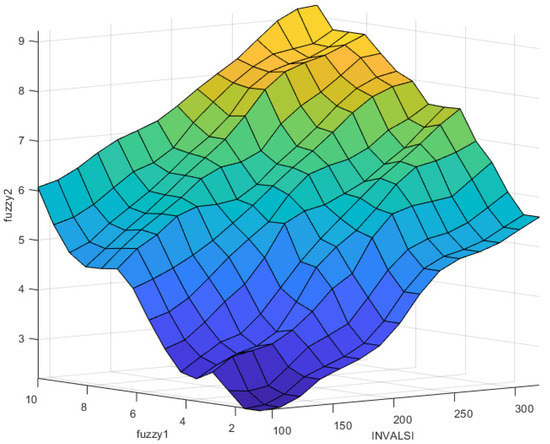
Figure 5.
Center of gravity fuzzy logic surface.
Finally, the results indicate a statistically significant difference in student MOM hypothetical grades between the four high school typologies. A deeper analysis confirmed that students from SLs have the highest grades, followed by TSs, OLs, and VSs. All differences in grades are statistically significant, except the OL and TS difference in grades. Hence, the results reveal that the MOM hypothetical grades, similarly to the COG method, discriminate between the school typology similarly to the INVALSI score.
This fact partially answers the last research question (i.e., whether differences exist between the COG and MOM hypothetical grades). Both methods privilege SL students, who had the highest scores on the INVALSI assessment [11,18]. Nevertheless, students from VSs have the lowest hypothetical grades. Thus, both fuzzy methods create a gap in achievements between students from the four high school typologies. Students from SLs have a stronger theoretical basis and a higher-level academic preparation [12]; thus, it is unsurprising that their scores on the INVALSI test are the highest; however, SL students in the sample had written and oral grades similar to those of students from other school typologies. Thus, although their levels of mathematical knowledge measured through the INVALSI test are higher than those of students from other schools, their final grade, which universities can later use to select future students [43,44] or employers to select employees [45], might provide incomplete information about their real knowledge and competencies in mathematics. Thus, including information about student performance on the national assessment (or, in general, other standardized assessments) might contribute to a clearer view of student knowledge and competencies [1,9].
The results demonstrated that the COG and MOM methods produced lower grades than the grades the students obtained on their report cards, both written and oral. Further analysis identified the MOM method as statistically stricter than the COG method, although the latter did not produce any grade below 3 or higher than 9. The correlation between the two kinds of hypothetical grades is strong and positive, indicating that higher grades of one kind would produce higher grades of the other. An analysis of student grades between the four school typologies reveals that SL students received higher grades when graded using MOM methods, whereas students from any other school typology received statistically significantly higher grades using the COG method.
Overall, this research highlights that lower achievements are expected when student scores on the INVALSI test are added to student school grades. Higher-achieving students were penalized using the COG defuzzification method, whereas lower-achieving student grades increased, similar to the findings by [31,35]. Thus, the COG method is unfair in this case. The MOM defuzzification method represents a fairer grading method, despite some anomalies detected due to the definition of the membership functions and inference rules [29]. Nevertheless, the proposed grading system also considers student achievements on standardized assessments, promoting the objectivity of the final student grade [36].
Author Contributions
Conceptualization, D.D., D.F. and M.C.; methodology, D.D.; software, D.D.; investigation, D.D.; resources, D.D. and D.F.; data curation, D.F. and M.C.; writing—original draft preparation, D.D., D.F. and M.C.; writing—review and editing, D.D., D.F. and M.C.; supervision, M.C. All authors have read and agreed to the published version of the manuscript.
Funding
This research received no external funding.
Institutional Review Board Statement
Not applicable.
Informed Consent Statement
Not applicable.
Data Availability Statement
Not applicable.
Conflicts of Interest
The authors declare no conflict of interest.
References
- Felda, D. Preverjanje matematičnega znanja. J. Elem. Educ. 2018, 11, 175–188. [Google Scholar] [CrossRef]
- Menéndez, I.Y.C.; Napa, M.A.C.; Moreira, M.L.M.; Zambrano, G.G.V. The importance of formative assessment in the learning teaching process. Int. J. Soc. Sci. Humanit. 2019, 3, 238–249. [Google Scholar]
- Bowers, A.J. What’s in a grade? The multidimensional nature of what teacher-assigned grades assess in high school. Educ. Res. Eval. 2011, 17, 141–159. [Google Scholar] [CrossRef] [Green Version]
- Harvey, K.E.; Suizzo, M.A.; Jackson, K.M. Predicting the grades of low-income–ethnic-minority students from teacher-student discrepancies in reported motivation. Int. J. Exp. Educ. 2016, 84, 510–528. [Google Scholar] [CrossRef]
- Marini, J.; Shaw, E.; Young, L.; Ewing, M. Getting to Know Your Criterion: Examining College Course Grades and GPAs over Time; College Board. 2018. Available online: https://files.eric.ed.gov/fulltext/ED582569.pdf (accessed on 22 February 2022).
- Annerstedt, C.; Larsson, S. ‘I have my own picture of what the demands are…’: Grading in Swedish PEH—problems of validity, comparability and fairness. Eur. Phys. Educ. Rev. 2010, 16, 97–115. [Google Scholar] [CrossRef]
- McMillan, J.H.; Myran, S.; Workman, D. Elementary teachers’ classroom assessment and grading practices. J. Educ. Res. 2002, 95, 203–213. [Google Scholar] [CrossRef]
- Gershenson, S. Grade Inflation in High Schools (2005–2016). Thomas B. Fordham Institute. 2018. Available online: https://fordhaminstitute.org/sites/default/files/20180919-grade-inflation-high-schools-2005-2016_0.pdf (accessed on 22 February 2022).
- Finefter-Rosenbluh, I.; Levinson, M. What is wrong with grade inflation (if anything)? Phil. Inq. Educ. 2015, 23, 3–21. [Google Scholar] [CrossRef]
- Willingham, W.W.; Pollack, J.M.; Lewis, C. Grades and test scores: Accounting for observed differences. J. Educ. Meas. 2002, 39, 1–37. [Google Scholar] [CrossRef]
- Argentin, G.; Triventi, M. The North-South divide in school grading standards: New evidence from national assessments of the Italian student population. Ital. J. Sociol. Educ. 2015, 7, 157–185. [Google Scholar]
- Contini, D.; Di Tommaso, M.L.; Mendolia, S. The gender gap in mathematics achievement: Evidence from Italian data. Econ. Educ. Rev. 2017, 58, 32–42. [Google Scholar] [CrossRef] [Green Version]
- MIUR. La Scuola Secondaria di Secondo Grado. Available online: https://www.miur.gov.it/scuola-secondaria-di-secondo-grado (accessed on 17 January 2022).
- DLgs 62/2017. Available online: https://www.gazzettaufficiale.it/eli/id/2017/05/16/17G00070/sg (accessed on 9 January 2022).
- RD 653/1925. Available online: https://www.normattiva.it/uri-res/N2Ls?urn:nir:stato:legge:1925-05-04;653 (accessed on 9 January 2022).
- CM 94/2011. Available online: https://www.istruzione.it/archivio/web/istruzione/prot6828_11.html (accessed on 9 January 2022).
- DLgs 297/1994. Available online: https://archivio.pubblica.istruzione.it/comitato_musica_new/normativa/allegati/dlgs160494.pdf (accessed on 9 January 2022).
- INVALSI. Quadro di Riferimento 2018. Available online: https://invalsi-areaprove.cineca.it/docs/file/QdR_MATEMATICA.pdf (accessed on 9 January 2022).
- INVALSI. Rapproto Prove INVALSI 2018. Available online: https://www.invalsi.it/invalsi/doc_evidenza/2018/Rapporto_prove_INVALSI_2018.pdf (accessed on 9 January 2022).
- INVALSI. Rapproto Prove INVALSI 2019. Available online: https://invalsi-areaprove.cineca.it/docs/2019/rapporto_prove_invalsi_2019.pdf (accessed on 9 January 2022).
- OECD. Technical Report PISA 2015. Available online: https://www.oecd.org/pisa/sitedocument/PISA-2015-Technical-Report-Chapter-9-Scaling-PISA-Data.pdf (accessed on 9 January 2022).
- TIMSS. Scaling Methodology. Available online: https://timssandpirls.bc.edu/timss2019/methods/pdf/T19_MP_Ch11-scaling-methodology.pdf (accessed on 9 January 2022).
- Pastori, G.; Pagani, V. What do you think about INVALSI tests? School directors, teachers and students from Lombardy describe their experience. J. Educ. Cult. Psychol. Stud. 2016, 13, 97–117. [Google Scholar] [CrossRef]
- Zadeh, L.A. Fuzzy sets. Inf. Control 1965, 8, 338–353. [Google Scholar] [CrossRef] [Green Version]
- Bai, Y.; Wang, D. Fundamentals of fuzzy logic control—fuzzy sets, fuzzy rules and defuzzifications. In Advanced Fuzzy Logic Technologies in Industrial Applications; Bai, Y., Zhuang, H., Wang, D., Eds.; Springer: London, UK, 2006; pp. 17–36. [Google Scholar]
- Yadav, R.S.; Soni, A.K.; Pal, S. A study of academic performance evaluation using Fuzzy Logic techniques. In Proceedings of the 2014 International Conference on Computing for Sustainable Global Development, New Delhi, India, 5–7 March 2014; pp. 48–53. [Google Scholar]
- Ivanova, V.; Zlatanov, B. Implementation of fuzzy functions aimed at fairer grading of students’ tests. Educ. Sci. 2019, 9, 214. [Google Scholar] [CrossRef] [Green Version]
- Viattchenin, D.A.; Tati, R.; Damaratski, A. Designing Gaussian membership functions for fuzzy classifier generated by heuristic possibilistic clustering. J. Inf. Organ. Sci. 2013, 37, 127–139. [Google Scholar]
- Semerci, Ç. The Influence of Fuzzy Logic Theory on Students’ Achievement. Turkish Online J. Educ. Technol. 2004, 3, 56–61. [Google Scholar]
- Soh, K.C. Grade point average: What’s wrong and what’s the alternative? J. High. Educ. Policy Manag. 2010, 33, 27–36. [Google Scholar] [CrossRef]
- Petrudi, S.H.J.; Pirouz, M.; Pirouz, B. Application of fuzzy logic for performance evaluation of academic students. In Proceedings of the 2013 13th Iranian Conference on Fuzzy Systems, Qazvin, Iran, 27–29 August 2013; pp. 1–5. [Google Scholar]
- Saliu, S. Constrained subjective assessment of student learning. J. Sci. Educ. Technol. 2005, 14, 271–284. [Google Scholar] [CrossRef]
- Meenakshi, N.; Pankaj, N. Application of Fuzzy Logic for Evaluation of Academic Performance of Students of Computer Application Course. Int. J. Res. Appl. SCI. Eng. Technol. 2015, 3, 260–267. [Google Scholar]
- Namli, N.A.; Şenkal, O. Using the Fuzzy Logic in Assessing the Programming Performance of Students. Int. J. Assess. Tool. Educ. 2018, 5, 701–712. [Google Scholar] [CrossRef]
- Kumari, N.A.; Rao, D.N.; Reddy, M.S. Indexing student performance with fuzzy logics evaluation in engineering education. Int. J. Eng. Technol. Sci. Res. 2017, 4, 514–522. [Google Scholar]
- Bjelica, M.; Rankovic, D. NOTE FOR EDITOR: The Use Of Fuzzy Theory In Grading Of Students In Math. Turk. Online J. Distance Educ. 2010, 11, 13–19. [Google Scholar]
- INVALSI Servizio Statistico. Available online: https://invalsi-serviziostatistico.cineca.it/ (accessed on 8 January 2022).
- Cardone, M.; Falzetti, P.; Sacco, C. INVALSI Data for School System Improvement: The Value Added. Available online: https://www.invalsi.it/download2/wp/wp43_Falzetti_Cardone_Sacco.pdf (accessed on 11 January 2022).
- INVALSI. Istruzioni Informazioni Contest Scuola Seondaria Secondo Grado. Available online: https://invalsi-areaprove.cineca.it/docs/2020/02_2020_Istruzioni_informazioni_contesto_Scuola_secondaria_secondo%20_grad.pdf (accessed on 11 January 2022).
- Sharma, S.; Obaid, A.J. Mathematical modelling, analysis and design of fuzzy logic controller for the control of ventilation systems using MATLAB fuzzy logic toolbox. J. Interdiscip. Math. 2020, 23, 843–849. [Google Scholar] [CrossRef]
- Cohen, J. Statistical Power Analysis for the Behavioral Sciences, 2nd ed.; Routledge: London, UK, 1988. [Google Scholar]
- Close, D. Fair grades. Teach. Philos. 2009, 32, 361–398. [Google Scholar] [CrossRef]
- DM 270/2004. Available online: http://www.miur.it/0006menu_c/0012docume/0098normat/4640modifi_cf2.htm (accessed on 18 January 2022).
- Hübner, N.; Wagner, W.; Hochweber, J.; Neumann, M.; Nagengast, B. Comparing apples and oranges: Curricular intensification reforms can change the meaning of students’ grades! J. Educ. Psychol. 2020, 112, 204–220. [Google Scholar] [CrossRef] [Green Version]
- Fossati, F.; Wilson, A.; Bonoli, G. What signals do employers use when hiring? Evidence from a survey experiment in the apprenticeship market. Eur. Sociol. Rev. 2020, 36, 760–779. [Google Scholar] [CrossRef]


Publisher’s Note: MDPI stays neutral with regard to jurisdictional claims in published maps and institutional affiliations. |
© 2022 by the authors. Licensee MDPI, Basel, Switzerland. This article is an open access article distributed under the terms and conditions of the Creative Commons Attribution (CC BY) license (https://creativecommons.org/licenses/by/4.0/).