1. Introduction
The design and implementation of policies must fit societal needs, but this is not always the case. Closing such policy gaps requires the professional development of well-targeted groups in order to translate the higher-level policies to local strategies and regulations, and disseminate supporting resources, such as guidelines, effective programs and assessment tools [
1]. A policy/evidence-practice gap can be defined as “the difference between what is known from the best available research evidence and what is practised in reality (through delivery of medical care or drafting of policies or guidelines)” [
2].
Activities regarding closing policy gaps require strong cooperation between all (for our field: educational) players to establish concrete co-creation values. Co-creation can be found in the education field to describe the cooperative relationship between teachers, trainers and students, as well as the cooperation between higher institutions.
The policy gaps in our research context can be identified as the following: First, there is a vertical gap in the translation of higher-level policies to local strategies and regulations [
3]. Second, there is a horizontal gap between educational domains regarding the policy awareness of individual players [
4]. From our findings, we argue that the combination of both gaps puts the academic bridge [
5] from secondary to tertiary education at risk, including the associated knowledge proficiency levels.
Closing the policy gaps is crucial, because on one hand it will serve to narrow the angle in the horizontal dimension between different academies as a critical need in the digital age. This policy gap poses a problem because there is a ‘risk of non-usage’ or ‘risk of usage not as intended’ on the grounds of structural complexities of (and between) educational domains [
4]. On the other hand, filling the policy gap builds a robust academic bridge between secondary schools and higher education (HE) institutions as a vertical dimension. Bridging policies vertically is important because there can be a “loss in translation”, starting from implementation to an unfolding at the local level ([
3], p. 6). Generally speaking, there is always a risk of policy gaps in all policy-induced systems / services to society (e.g., [
6,
7]). Our paper covers an aspect of a general risk with policies within all societal systems (in our case the educational field).
A theoretical foundation is required for policy making. Further development by evidence-based data to feed and confound policy making is necessary. To this end, aiming for distinct goals and research questions, such as our study focused on closing policy gaps in the educational field, an evaluation provides evidence in order to formulate recommendations to policy makers and the solutions that are linked to them. Evidence should be gathered by evaluating the experimentation through several phases. Experimentations aim to test new policies in a small-scale setting and search for generalization potential on a larger scale [
8]: “The deliberateness of experimentation resides in the planning of the process, and in particular, in the ex-ante decisions of what is going to be implemented and how its effects will be measured.” ([
8], p. 169). It is a set of possible knowledge in the line of research that needs to give the researchers and policy makers a scientific base to describe the status quo and lead them to reasonably believe that something is true or happened by accepting or rejecting their hypotheses. According to Davies, the evidence-informed policy based on well-defined target groups is an approach that “helps people make well-informed decisions about policies, programs and projects by putting the best available evidence at the heart of policy development and implementation” ([
9], p. 3).
In this paper, we present our findings from two case studies on policy evaluation in the educational sector: the first on virtual mobility in HE, the second on teacher training in AI and Data Literacy. Both projects are funded by the European Commission in Erasmus+ Key Action 3 on policy experimentation and evaluation. By contrasting both cases, we were able to derive recommendations not only in the respective fields, but also on a more general level.
The project “Online Pedagogical Resources for European Universities” (OpenU) is guided by the question: How can inter-university cooperation, innovative pedagogical teaching and learning, as well as academic mobility, be strengthened throughout the project? The OpenU project brings together representatives of European HE institutions, six ministries of HE and research (France, Germany, Belgium, Latvia, Portugal and Spain), and four European networks around the topic of digitalization in HE. The objective of technical development and educational experiments in two rounds is to contribute to the emergence of innovative policies, encourage mutual learning and strengthen long-term strategic and structural cooperation between European HE institutions [
10].
The project “Teacher training for Data Literacy and Computer Science competences” (TrainDL) wants to reduce the digital skills gap in and across educational systems in Europe. In three countries (Germany, Austria and Latvia) the digital competencies of data literacy (DL) and artificial intelligence (AI) are tested in a policy cycle consisting of three experimentation rounds. Results from these teacher trainings provide insights for recommendations to policy makers regarding the implementation of DL and AI in national framework curriculums and educational systems [
11]. Furthermore, the digital divide is to be prevented.
Both projects are part of the (educational) EU activities, which “are designed to bring an additional international dimension to studying, teaching, researching and making policy in higher education” [
12]. Some of the most significant goals of Union action in HE are student and teacher mobility, as well as the encouragement and development of distance education. In addition, cooperation between the education systems of Member States and educational institutions is created/promoted [
12].
OpenU and TrainDL share commonalities: They are both working on the promotion of themes in digitization (OpenU: blended learning, virtual mobility; TrainDL: DL, AI). Both are situated in the educational field. The same methodological approach is used (questionnaires). However, there are some differences between the projects: They are targeting different educational (secondary and tertiary education) and institutional levels (OpenU: HE; TrainDL: school level). This is also the very reason for combining both projects in the presented manner because we want to bridge the policy gap between the levels.
This article investigates the role of digitization and other factors related to digitization to fill the policy gaps in the academic bridge. The knowledge proficiency levels between secondary and tertiary levels are different. We utilize value co-creation as a theoretical basis in the context of digitization in education in both HE institutions (tertiary level) and secondary schools. This paper discusses the value co-creation for and by stakeholders and what they expect from or ascribe to educational policies. We answer the research question: Which values do the involved stakeholders expect from or ascribe to policies, with respect to the themes of the policies in the selected field of digitization in education (virtual mobility, blended learning, data literacy, artificial intelligence)? To this end, we analyzed the questionnaire data of the second evaluation phase of the OpenU project, as well as the first evaluation phase of the TrainDL project.
The remainder of this paper is structured as follows. The next section shows the theoretical background as well as related research. The
Section 3 investigates the horizontal and vertical policy gaps, which contain the value co-creation model of this study.
Section 4 and
Section 5 explain the evaluation methodologies that were used in both projects to gather data about the vertical and horizontal dimensions respective of the values.
Section 6 summarizes and discusses the preliminary results of this study, while
Section 7 provides several recommendations and flexible solutions for policy makers and stakeholders. The last section suggests future research work.
2. Theoretical Background and Related Work
2.1. Service-Domain Logic and Value Co-Creation
The value of policies only arises through cooperation/co-creation with the involvement activities within the educational institutions. In the following, we are presenting the concept of value co-creation, which stems from the service-dominant (S-D) logic. Edvardsson et al. [
13] argue that S-D logic holds that all providers are essentially service providers, and that resources are distinguished into two categories: (1) operand resources, which are typically physical and (2) operant resources, which are typically human, such as skills and knowledge.
The operant resources operate on resources to match the institutional needs and operational experiences, which are often invisible and intangible. Generally, they are core competencies or organizational processes. They are likely to be dynamic and infinite and not static and finite, as is usually the case with operand resources. Because operant resources produce effects, they enable humans to multiply the value of natural resources and create additional operant resources [
14]. All actors within contexts where value is produced are “resource integrators” ([
15], p. 7). The resources do not have an inherent value, so in order to be of value, they have to be put to use and integrated into value creation processes [
16].
Vargo and Lusch [
14] extended S-D-logic, as described above, towards firm–customer-relations in economic exchanges and into different forms of value configurations—“economic and social actors within networks interacting and exchanging across and through networks” ([
15], p. 5). S-D logic suggests that through collaborative competence in such contexts, value is co-created [
13].
There are different conceptualizations of value co-creation:
- (1)
Value is not a fixed term and is dependent on a variety of factors. Vargo and Lusch mention that value perception is a relational phenomenon [
14]. The consumer determines and perceives it as “value in use” ([
14], p. 7). Therefore, “analysis of value creation in terms of a service system blurs the distinction between the role of the producer and the role of the consumer” ([
13], p. 331). For Vargo and Lusch, from an economic perspective, S-D logic is process oriented and it is only through customer collaboration that market offerings/value can be created. The customer becomes an involved co-creator of value [
13,
17], instead of being an uninvolved recipient/consumer. This is because the value is phenomenologically and idiosyncratically determined by the beneficiary. The creation of value by the beneficiary means that the supplier of the resources or services, on which grounds the value is created, can only offer value propositions [
15]. Hence, Vargo and Lusch define value co-creation concerning beneficiaries/consumers in exchange systems.
- (2)
Kinnula et al. utilize a different emphasis, while integrating most of the groundwork achieved by Vargo and Lusch: Value co-creation is a process in which all stakeholders in a given context create value “that is relevant for themselves as well as for others” ([
18], p. 464). The success of value co-creation is dependent on whether all stakeholders perceive receiving value from the service. Their school-based study concludes that, although value experience is different [
18], “similar experiences of value emerge for different stakeholder groups” ([
18], p. 490).
We are focusing the second approach upon analyses of the values of evaluated stakeholders and target groups in the projects, in connection to the other project partners and formulated project aims. In addition, the integration of policy contexts and institutional structures are processes that can only be initiated and re-confirmed with stakeholder participation.
From the value co-creation perspective, educational institutions collaborate for many reasons. Institutional reasons could be to increase the instructors’ experiences and skills, to enhance the quality of education or to improve their image. Other reasons could be giving students a chance to learn from other institutions, time efficiencies, expansion in terms of internationalization purposes, etc.
2.2. Value Co-Creation in OpenU and TrainDL Projects
In OpenU and TrainDL, value (regarding policies) is co-created from the experimentations on digitization and education in different spheres and at different levels. Value co-creation has been affected by several factors that are related to the effect of the experimentation and the implementation outcomes.
Value co-creation in OpenU takes place in its experimentation phase. It has two dimensions. The first dimension is the value co-created by the educational designers and teachers across the European universities through experimentation partnerships and international collaborations, which reflect on the respective influence of national strategies and policies. The second dimension is from the experimentation on feedback to bridge practices and policies at the institutional level. Value co-creation, from the two dimensions that are mentioned above, is helping to fill the vertical gap locally and nationally.
Value co-creation in TrainDL also takes place in its experimentation phase. It also has two dimensions. First, in the experimentations, value is generated under the participation of the teachers (experimentation target group) in so-called “interventions”. When referring to an educational intervention, we mean an action (e.g., teacher training) that can be used to measure content, concepts, and related effects; it is connected to policy changes (teacher trainings) and offers insights for the evaluators. Secondly, later interventions with other target groups will be specified and, in the end, this will lead (through recommendations) to horizontal policy integration across schools and educational systems in European countries.
One aim of the involvement of stakeholders in the process is to guarantee a successful implementation from theory to practice, by considering each of the individual players’ perspectives. This is closely linked to the single and shared values of the stakeholders, and the values they each ascribe to the project and its (ongoing) results after implementation. Therefore, disseminated values within the ongoing project between the stakeholders are linked to the value once the project ends and policy implementation begins. Moreover, comparing these processes across both cases helps to address horizontal policy gaps.
2.3. Related Research
Evidence-based policy making has been studied through many research works. Davies [
9] emphasizes the role of evidence in developing the best policies and strategies, as well as their implementation. In many projects, researchers prefer to use the term ‘evidence-based’ rather than ‘evidence-informed’ when the evidence is intended to be used in decision making. Pellegrini and Vivanet [
1] argue that many European initiatives are preferring to use the term evidence-informed education They insist that the use of the term ‘evidence-informed’ education has implications for research and policy: “For policies, the European Union (EU) documents provide guidance rather than stipulations regarding the use of evidence in educational decision making” ([
1], p. 2). Janušauskienė and Dvorak confirm the contribution of evidence-based policy in HE for implementation and goal achievement, but also underline a dependence upon the effectiveness of the evidence-based policy regarding policy problems and goals [
19]. Turan and Kılıçoğlu (2017), as well as Lassnigg (2016), argue for policy evidence systems in centralized education systems, using Turkey and Austria as examples (e.g., [
4,
20]).
However, there are significant differences between the education sectors, which make it difficult to make phase transitions or change tracks. That is why Kift et al. propose a so-called “transition pedagogy”, to bridge the vertical and horizontal gaps in the education system for HE students in their first-year experience (FYE); this would “transcends the silos of academic, administrative and support areas to enact a holistic, systematically-managed, vision for the FYE that is truly student focused” ([
5], p. 14). In addition to this pedagogical perspective, we further investigate policy issues affecting the effectiveness of the academic bridge.
Many researchers utilized S-D logic for HE services to reframe the role of students. The research of Díaz-Méndez et al. [
21] advocates for the improvement of educational services by developing an alternative framework that is more appropriate for addressing the usual student-teacher dyad, within the HE services of teachers as service providers and students as service customers. Instead, teachers should be seen as value facilitators and students as value co-creators in order to consider the HE “as a network composed of several actors who use and integrate resources among themselves to obtain benefits together with the network resources, such as university policies or educational politics, which are also integrated into the process” ([
21], p. 8). This value co-creation process at a university is the learning process, while the service is learning, rather than the teaching or educational process. Both student and professor use their resources in the co-creation of learning and they receive support from resources in their network, which may include other students, professors, libraries, books and Information and Communication Technology (ICT) systems. We make use of this perspective, considering insights into policies as an additional value, co-created from the evaluated educational experiments.
S-D logic is grounded in an increased focus on operant resources and especially on process management [
14]. Edvardsson et al. [
13] argue that S-D logic essentially states that service is linked mainly to competence (knowledge and skills). They also insist that the co-creation process at a university is a learning process, while the service is learning. Both students and professors use their resources in the co-creation of learning and they receive support from other resources in their network. The competitive advantage is primarily created through operant resources because they operate on resources to solve problems, fulfill needs and produce a favorable customer experience [
14].
Edvardsson et al. ([
13], pp. 333–335) suggest four propositions for applying key concepts from social construction theories to S-D logic:
“Proposition 1: Value has a collective and intersubjective dimension and should be understood as value-in-social-context.
Proposition 2: How resources are assessed depends on the social context
Proposition 3: Service exchange and value co-creation can be asymmetric
Proposition 4: Service exchanges and actors’ roles are dynamic in adaptive service systems.”
Propositions 1 and 3 are related to our research work. They make a point of values being different. Before measuring these differences, we investigate the horizontal and vertical gaps. Researchers have emphasized the need to understand the differences between societies and their educational systems [
22]. To this end, a model has been created that visualizes the occurrence of values in different contexts in order to fill the gap horizontally and vertically.
3. Investigating the Horizontal and Vertical Policy Gaps
The gap between policy and practice is a common problem faced by many (national) education systems [
22]. Closing the policy gaps vertically and horizontally between HE partners on one side, and the secondary schools on the other side, relies on several factors. In both projects, the factors and evidence that have been gathered can be classified into three categories. The first category is the (1) experimentation level: It includes criteria such as barriers and difficulties (during experimentation), the effect on the target groups and their acceptance of the experimentations. The second category is the (2) implementation level: It can be described through the actual steps that need to be completed to integrate a policy into practice (may be in connection with milestones, etc.). It includes institutional policies and strategies, recognitions, legislations and infrastructure, translating the policies and quality assurance. For example, in OpenU, virtual mobility certifications belong to this level. For TrainDL, an example would be necessary steps to bring DL and AI into the framework curriculums. The third category is the (3) acting and sustaining level: The third level is mainly connected to the outcomes of the experimentations, in order to inform the policy makers with the aim of anchoring and sustaining the virtual mobility experimentation (OpenU) and the ‘success’ of framework curriculum integration (TrainDL). For both projects, monitoring of the acting level can be conducted.
An example of a great change is establishing value through cooperation between partners, in order to bridge secondary and tertiary education. Each of the partners has the role of adding value to close and fill the gaps between partners, on the one hand, and establishing the flow of knowledge between the institutional policy level and the level of good practice, on the other hand.
Key Action 3 (KA3) provides support to policy cooperation at the EU level, thereby contributing to the development of new policies, which can trigger modernization and reforms in the fields of education, youth training and sport. One of its aims is to gather evidence and knowledge about education, foster policy dialogue with stakeholders and contribute to identifying and disseminating good practices [
23]. Another aim is to identify such gaps and find solutions to bridge and close the gap between policies, through several well-defined experimentations across the European partners, as well as on the institutional level. Secondary education also faces a challenge to match its policies and regulation with the HE institutions’ policies, as the universities recruit first-year students from the graduated students of secondary schools.
In OpenU, experiments in different European universities were conducted in two phases and through several partners as cross-institutional and cooperative online activities. The first experimentation phase was launched in July 2021, while the second phase was launched in June 2022 to identify needs, produce knowledge, encourage the development of close-knit cooperation activities; to enable an analysis of their effect, an online hub and its functionalities were applied. The experimentations were conducted by university research professors, along with their students and local teams. Each phase of experimentation had at least 6 peer learning sessions, including 10 partners, each represented by experts/researchers/teachers, students and staff. One of the evaluation roles in the OpenU project was to investigate the practices of the national and institutional policies, as well as the administrative solutions for international cooperation, virtual mobility and blended learning in two evaluation cycles. To this end, the results of the second evaluation phase showed the valuable role of policy experimentation in potentially bridging the gap between policy and practice using a bridge of research evidence [
3].
TrainDL’s evaluation of the three cycles of experimentation aimed to gather evidence about competencies and the models of best practices and circumstances, regarding teacher training, for teaching DL and AI at the school level. The results presented in this paper are collected in the first phase. The slight alteration of the evaluation concepts to maintain a high comparability of results between intervention cycles (adjusted to different target groups of teachers) is planned. Questions target multi-dimensional assessments and challenge the actual knowledge of teachers in DL and AI. Therefore, the evaluation of the first round already produces feasible estimations for implementation and bridging from the secondary to the tertiary level.
Figure 1 shows the overarching value co-creation model between different partners in tertiary and secondary education, to close the vertical and horizontal gaps and to gain the best practice advantages.
At the secondary level, members of institutions take part in different experimentation formats that are then evaluated. In a spiral evaluation, results will be shared with policy makers and, based on recommendations, consequently fed into modified concepts in the following experimentation cycles. In both projects, the required organizational steps are clearly chronologically defined and emphasized in the required action (e.g., implementing changes into the next cycle). Based on the guiding results and the implemented changes following them, it is the intent of both projects to build sustainable bridges both vertically between policy and practice, as well as horizontally between the secondary and tertiary education sectors.
4. The Evaluation Methodology in the OpenU Project
Written questionnaires were the evaluation method applied by both projects. It was used because this method is highly standardizable, meaning that there was strong predetermination in questions, and that their sequencing and choices were also given. Through these means, it is possible to facilitate comparison between cases; this is the main reason for using the written questionnaire [
24].
The used methodology aimed to gain data about the vertical domain, i.e., knowledge and evidence from the second experimentation phase of OpenU. The experimentation in this project practices the policies and the strategies at the institutional level, regarding virtual mobility and blended learning, as well as the international cooperation between the partners at the European institutional level.
The first evaluation cycle of OpenU included evaluation activities, represented by analyzing the strategic documents that were collected from the OpenU partners. These documents relate to the institutional strategies of three spheres of the project: blended learning, virtual mobility and international cooperation. In the first phase, a pre-design questionnaire was used and several interviews were conducted with selected experimentation leaders.
In the second evaluation cycle, a questionnaire was submitted to OpenU project partners after the second phase of their experimentation, to investigate the practices of blended learning, virtual mobility and international cooperation in practice. The survey targeted two main groups. The first group was educational designers who participated in the OpenU experimentation, while the second target group contained administrators and stakeholders at the institutional level; this included the CIO offices, the international teaching and cooperation office staff and IT specialists.
The questionnaire was adjusted based on the answers of the respondent’s position, as shown in
Figure 2. One of the survey parts for the educational designers contained general questions related to the priority actions, target groups and goals of their experimentation. Then, the educational designers were asked several questions to measure the effect of the experimentation, the acceptance of the experimentation, the factors that stimulate or hamper the experimentation, the added value from the experimentation partners, the translation of the policies and the strategies at the institutional level.
However, the admin group was asked several questions about the institutional policies and strategies for implementing blended learning, virtual mobility and technology-enhanced learning. In the second part, the questions were about the effect of the experimentation. Some of the questions were asked with the goal of estimating the effect of blended learning and virtual mobility experimentation, the role of translating the university policies, and how one could bridge the policies and practices at the institutional level. Other questions aimed to rate the acceptance of virtual mobility and blended learning in the educational environment. The administrators were also asked about how they recognize the teaching staff’s efforts in practicing virtual and international collaboration, and ensuring the quality of the Technology Enhanced Learning and the certificates that should be provided for students’ virtual mobility.
Following this two-part assessment, in the last part, the questionnaire was designed to ask the participants (both target groups) about the implementation outcomes that were intended to be reached. In this part, all of the respondents answered questions to measure the factors that stimulate or hamper a fully digital workflow of mobility at the institutional level, estimating the virtual mobility types based on the strategic importance and the quantity in the last year. Other questions targeted the challenges that the experimentation was facing in terms of sustainable virtual mobility settings, as well as the granularities and the student activities suitable for virtual mobility.
The questionnaire ended with two questions; one was about the respondents’ overall feelings towards virtual mobility at European universities. The questions were designed in different formats, including selection, scaling, ranking, and rating multiple-choice questions with an option to add individual comments that are always from minimum to maximum agreement. A total of 25 respondents completed the whole questionnaire. The results are presented in
Section 6.
5. The Evaluation Methodology in the TrainDL Project
The questionnaires and competency tests were designed to evaluate the effect of the interventions (through direct comparison of repeated questions before and after the intervention), gather multidimensional assessments (e.g., outcomes and policy-related questions) and get insight into demographic data.
Competency tests: Before the intervention was conducted, the teachers were sent a competency test, which they were asked to fill out off-site. They were also asked to complete a second competency test directly after the intervention (on-site). These tests’ purpose was to gather data about the self-estimation of knowledge in DL and AI in one part, and actual knowledge through knowledge questions about them in the other. In both instances, the tests included exactly the same questions. Estimation and knowledge questions were referring both to DL and AI. For evaluation purposes, it was clearly marked which of the knowledge and estimation questions were linked to which of the two topics.
The number of questions and topic distribution was as follows: Self-estimation—15 DL-based and 10 AI-based questions for different knowledge aspects of these topics. The possible answers were given on a Likert scale. Knowledge—14 single and multiple-choice questions were used for 4 DL and 10 AI-based questions related to different dimensions/hypothetical problems. The maximum possible score for each question was one point, so in total 14 points could be scored.
Questionnaires: For the two questionnaires, the participants were asked to fill them out directly before and after the intervention on-site. Through these questionnaires, three questions were repeated: effect (e.g., self-estimation of knowledge for DL and AI, and how it is usable in courses), outcome (assessment of DL and AI and their added value for pupils in the future) and policy aspects (e.g., assessment if DL and AI are missing in the respective framework curriculums of teachers’ subjects).
The three intervention rounds were based on different target groups of teachers respective of school level. They comprised: (1) Informatics teachers at the secondary level; (2) Non-Informatics teachers at the secondary level and (3) teachers at the primary level. This paper presents the results from the questionnaires/competency tests for the first round of interventions.
All assessment questions were realized through Likert scales, nearly all of them with six items. Other questions were designed in different formats as multiple and single choice options, with a few spaces where the teachers could give free formulated answers or where choices were not given.
Figure 3 shows target groups, sequencing and contents plus dimensions/results that were targeted in the first phase/intervention.
Other instruments: These are not included in the paper. A personal interview was conducted directly after the intervention. This gives deeper insight into motivations and assessments of the intervention and suggestions and, for example, on changes and challenges (barriers) regarding structural integration. In addition, a short follow-up evaluation, consisting of a questionnaire and a short interview after approximately half a year after the intervention, is planned. Here, an implemented usage of DL and AI after the intervention can be discussed. This gives insight into best practices after the intervention.
In the next chapter, we present statistical matters for the used method—the questionnaire. This is necessary for better classification and understanding of both projects’ results.
6. Statistical Types of Errors, Programs/Tools and Operations
6.1. Statistical Types or Errors
Because of the relatively small sample size in both projects, we want to mention the compromising of statistical power (or higher probability for Type II error (β)); this is especially for weak and also, but lesser, moderate correlations, and for statistical comparison tests, with power getting greater from minor to major differences/effects (also depending on n). Additionally, in order to prove the results as significant (rejecting Type I error (α) for a significance level of 0.05), higher level results are needed than for experimentations with a more sufficient number of n within a given context.
Connected to that, among other things, for scientific purposes, it is usually recommended to have at least 30 persons, or a number slightly below that, in a sample (e.g., [
25,
26]).
6.2. Statistical Programs/Tools
The questionnaires of both evaluation methods in two projects were designed using QUAMP [
27], which is a modular software platform for setting up web-based feedback systems with a focus on the collection, management and analysis of empirical data. Several statistical operations/functions were used to analyze the collected results. We utilized RStudio as a tool to analyze the data that was collected from QUAMP in both projects.
6.3. Statistical Operations
We applied one-sided testing for comparison tests for after-intervention effects (for greater values post-intervention), and one-sided testing for correlations was performed when applicable (for positive correlations).
For this case, alternative hypotheses for different tests with ordinal data and one-sided testing (only TrainDL) state: The rank sums of two variables after the intervention are greater than the value before (intervention effect). The null hypotheses read: The rank sums are the same (no intervention effect).
For correlations and one-sided testing, the following alternative hypotheses were formulated (only TrainDL): The correlation between two variables is positive. The null hypotheses in these instances are: No relationship between variables can be found.
For two-sided testing and difference tests (OpenU and TrainDL), these hypotheses are formulated: The rank sums of two variables are different. Null hypotheses state: The rank sums of two variables are not different from one another.
Regarding correlations, there are alternative hypotheses (OpenU and TrainDL): There is a correlation between two variables. The null hypotheses read: No relationship between two variables is detected.
The following statistical operations were used:
Measures of central tendency—For metric data, only the arithmetic mean is used. For ordinal data, both mean and median are applied. While calculating a mean for ordinal data is usually seen as not very meaningful [
28], if distances between predetermined items/scales can be interpreted as equal it can also be applied [
29]. For our study, this was used when sensible.
Correlations—Most variables use Likert scales as items, so the choices were limited to Spearman or Kendall’s Tau, both of which can be applied in the case of ordinal data [
30]. It was decided that Spearman would be used, because it is recommended for bigger scales, such as five-point scales or above [
31]; these were used most of the time in both projects. For metric data, the Pearson correlation was used if conditions are met [
32].
Difference tests—For paired (dependent groups) and ordinal data, the Wilcoxon test was applied, and for unpaired data (independent groups) the Mann–Whitney test was utilized [
33]. For comparison of dependent groups with metrical data, the Wilcoxon test was also used, because the sample size was smaller than
n < 30. Below this threshold, it is advised to not use a t-test [
34]. An asymptotic calculation of the
p-value was applied.
For correlations, the following classification strength was utilized: No correlation [0, 0.3), weak correlation [0.3, 0.5), moderate correlation [0.5, 0.8), and strong correlation [0.8, 1] [
35]. This was subsequently also used for comparison tests.
After this statistical embedding, in the next chapter we present the results of both projects.
7. Discussing the Preliminary Results
In both policy experimentation projects, studying the implementation of policies in practice is a focal point, not only for the experimentation results but also for long-term cooperation and sustainability. To this end, this section introduces the preliminary results of the experimental evidence in order to later introduce several recommendations and solutions to fill gaps between policy and practice, and the academic bridge between secondary and tertiary education levels.
Several intersectional questions were selected to discuss the relationship between the vertical and the horizontal gaps from both evaluation methodologies, based on effect aspects, outspanning assessments, and policy and good practices levels.
Because both projects have a sample size smaller than 30, the results are to be understood as preliminary.
In the following, we present the analysis results and we reflect on the value/value co-creation as a concrete lens to lay the groundwork for several recommendations and proposed solutions to fill the gaps between policies and practices in the HE institutions on one side, and closing the policy gap in the academic bridge between secondary schools and HE on the other side.
In the results section, the number of persons who completed the questionnaires is given. However, sometimes within these data a slight loss for variables occurred (for various reasons). For the most part, these instances will not be mentioned.
7.1. The Preliminary Results on Virtual Mobility Experiments
First, we discuss the preliminary results from the second evaluation questionnaire of the OpenU project. The selected results have been determined to provide evidence related to investigating the implementation, as well as good practices at the institutional and international level regarding virtual mobility and blended learning, and as a vertical gap.
One of the challenges of designing virtual mobility activities is that they need special skills in technologies, pedagogical materials and knowledge of context as well as internationalization skills. This also reflects the institutional policy of the cooperating partners.
Facing this diversity of required skills and involved people, the questionnaire contained four parts targeting these segments. Through several questions, the questionnaire measured the effect of the experimentation and the implementation outcomes, as well as the good practices of the institutional policies within the framework of virtual mobility and international collaboration. From around 50 contacted persons, 25 completed the questionnaire and were distributed into two groups: 12 from the educational designers and 13 from the administration group (distributed as follows: Three from the CIO office, six from the International Office, three from IT specialists and one from the Information Office at the faculty level). This paper will only present the results that are closely related to the research aspects.
The results will be presented in three categories: (1) the results of the educational designers. (2) An analysis of the results of the administrators’ group. (3) An analysis of the implementation outcomes based on all of the respondents’ answers. To this end, correlations and comparison studies will be presented based on the target groups’ answers.
Scales go from maximum approval (lowest number = 1) to minimum approval (highest number). Most of the time, four-point Likert scales are used.
7.1.1. Analyzing the Educational Designers’ Answers
The majority of the educational designers that participated in the questionnaire selected the “collaborative experiments that complement each other” as one of the most important factors that stimulate the experimentation. This emphasizes the importance of the value co-creation role in complementing the experimentation roles.
When asked if their experimentation translated the university policies related to vertical mobility and international collaboration into good practice, about 42% of the educational designers answered “no” and 25% selected the option “I do not know”. Approximately 33% answered “yes” and some of them provided links to relevant information in this regard.
Half of the respondents recognized the added value of this experimentation because of the collaboration between partners. However, about 42% of the educational designers selected the “no estimation” option.
In their comments, the educational staff highlighted the benefits received from the experimentation regarding the blended learning and virtual mobility courses; in addition the benefits and the added values through the exchanges and peer evaluation were said to be very constructive. In some other cases, the added values were not as expected because of several barriers, such as the language, intercultural competencies, development of cooperation among partner universities and resource sharing.
Correlation studies based on the educational designers’ answers show:
The correlation between the effect of the experimentation on the target groups (The original question asked is: “How would you estimate the impacts of this experimentation on the target groups?”) and the acceptance of the experimentation (“How satisfied are you with the acceptance of such experimentations based on the target group engagement?”) was tested: There is a moderately significant correlation—which is positive—to be found (rs = 0.74, p < 0.05).
There is a moderately significant positive correlation between the effect of the experimentation on the target groups and the experimentation results, and blended learning and virtual mobility services (rs = 0.72, p < 0.05).
No correlation between the acceptance of the experimentation and the experimentation results and services could be found.
7.1.2. Analyzing the Administrators’ Answers
The administrators were asked if their universities have provided dedicated strategies and clear policies regarding the implementation of virtual mobility. Approximately 38% have such strategies, whereas 46% selected that they “do not have yet” such strategies, but are in the process. Only 2 out of 12 of the participants answered “no”. This is remarkable considering that having such an institutional policy in place was a formal requirement for participation in the funding scheme.
The answers to the question aimed at measuring the legislation and infrastructure supporting virtual mobility and internationalization activities, are varying. About 38% of the participants from the admin group selected the option “not yet, but currently under discussion”, whereas 31% answered that virtual mobility settings are well-defined and recognized through the university legislation, and the institutional infrastructure is ready for further cooperation with other partners. Still, 31% preferred to select the option “I do not know”.
In total, 54% of the respondents answered that the effect of the virtual mobility experimentation on translating the university policies is “in expectation”, and there is increasing interest in practicing blended learning and virtual mobility scenarios at the university; this is expected to expand to sustainable cooperation with other partners in EU universities that are bridging the policies and practices at the institutional level. However, about half of the participants from the administration group estimated “less than expected”, suggesting that much more work is recommended to engage the institutional staff and stakeholders in practicing blended learning and virtual mobility scenarios.
Correlation studies based on the administrators’ answers show:
A moderately significant positive correlation was found between the effect of the experimentation on translating the university policies and the acceptance of the experimentation in the educational environment at the institutional level (rs = 0.53, p < 0.05).
No correlation between the dedicated strategies and policies (“Does your university have a dedicated strategy and clear polices that specifically addresses the implementation of blended learning, technology-enhanced learning or virtual mobility?”) and the effect of the experimentation on translating the university policies and bridging policies and practices could be detected.
No correlation between the dedicated strategies and policies for implementing virtual mobility and blended learning scenarios and the legislation and infrastructure (“Do you think that your legislation and infrastructure are supporting the blended learning and virtual mobility experiments to be anchored and sustainable at your university?”) could be detected.
7.1.3. Analyzing the Answers Regarding the Outcomes of the Policy Implementation
The answers show that the top three challenges affecting anchoring and sustaining virtual mobility are the awareness of the regulations, limited resources and the gap between the policy makers and teaching staff.
The technical infrastructure is the factor with the biggest effect rate for stimulating or hampering a fully digital workflow of mobility at the institutional level. Awareness of the regulations ranked as the top factors anchoring or sustaining virtual mobility scenarios. ECTS is regarded as having high strategical importance but is not frequently used.
We asked all participants about their overall feeling toward virtual mobility at their universities. The answers reflect that about 37% of the respondents feel that virtual mobility is an opportunity for students and instructors who have barriers preventing them from participating in various physical mobility activities. Indeed, 17% have a feeling that strong infrastructure and policy agreements are required. In total, 12.5% have a feeling that it is in the way of sustainability, especially after the COVID-19 pandemic.
The Mann–Whitney test has been used for comparing target groups. As shown in
Table 1,
Mdn1 refers to the median value from the educational designers’ answers and the
Mdn2 refers to the median value of the administrators’ answers. The presented results go from maximum approval (lowest number = 1) to minimum approval (highest number = 3 or 4).
The results show that there are no significant differences between the answers of educational designers and administrators.
7.2. The Preliminary Results from the Teacher Training Experiments
In the following, we present the preliminary results of TrainDL from the first-round questionnaires and competency tests. The first intervention took place in June 2022, and 24 persons participated in the event and completed the questionnaire. The four written questionnaires (pre- and post-questionnaire and pre- and post-competency test) were filled out electronically. Except for the pre-competency test all tests were filled out on-site.
The number of usable cases n for the questionnaire was as follows: 23 (pre), 21 (post) and combined for both 20. For the competency test, the cases were as follows: 17 (pre), 20 (post) and combined for both 15 (also the same number when results are combined with the results from the questionnaires). Because there are comparisons/correlations to be executed between all four tests (pre- and post-questionnaire, pre- and post-competency test), data in this could be matched via raised pseudonymization codes.
Scales go from zero approval (lowest number) to maximum approval (highest number). There are always six-point Likert scales used, if not mentioned otherwise.
Results are presented in three categories: Effect (before–after results without relation to outcome and policy), outcome and policy.
The presentation is classified into three categories: (1) Effect—directly measurable through repeated questions for pre- and after-intervention (mainly knowledge-based self-estimations and actual knowledge), (2) assessment of outcome via the added value of DL and AI for pupils in the future and (3) policy implementation (assessments for DL and AI are missing in framework curriculums, plus these topics are of socially sufficient importance to integrate them in framework curriculums).
7.2.1. The Immediate Effect of the Experiments on Competencies
Effect in the context presented here is to be understood as effects resulting from the experiments that are foremost on a personal level, not the impact of the policies behind them at a broader level. The following results relate to knowledge levels (self-estimations in different contexts and actual knowledge) and compare them between pre-and post-intervention.
First, we want to share different means of (subjective) self-estimation of knowledge.
One measurement is a self-estimation regarding specific usage for using DL and AI in courses with the statement “I know how the contents of DL/AI can be used in class.“ (pre- and post-intervention (questionnaires), n = 20). For both DL and AI, significant differences in rank sums can be proven: DL (before: M = 2.45, Mdn = 2; after: M = 4, Mdn = 4) shows a strong effect size on assessment depending on measured time frame, respectively, before and after intervention (Wilcoxon one-sided; r = 0.8, p < 0.05). The same can be said for AI, but with an even higher effect size (before: M = 2.35, Mdn = 2; after: M = 4.65, Mdn = 5) (Wilcoxon one-sided; r = 0.85, p < 0.05). The comparison of rank sums of DL and AI, after the intervention, results in a moderately significant effect size in favor of AI (Wilcoxon; r = 0.56, p < 0.05). While DL shows a significantly and positively moderate correlation between pre- and post-measurement (rs = 0.55, p < 0.05), AI offers no significant correlation.
The second is a self-estimation regarding general knowledge of DL and AI. This is based on 15 questions for DL and 10 for AI, that ask the participants how they would rate their knowledge in specific areas of these topics: DL: cleansing, visualization of data etc.; AI: Principle of unsupervised learning, supervised learning (pre- and post-intervention (competency tests), n = 15, five-point Likert scale). For these assessment questions, scale means had to be calculated. The effect is shown through significant differences between pre-and post-results; the intervention has a moderate effect on self-assessment regarding DL (before: M = 2.28; after: M = 3.24; Wilcoxon one-sided; r = 0.73, p < 0.05), a strong effect for AI (before: M = 2.4; after: M = 3.73; Wilcoxon one-sided; r = 0.88, p < 0.05), and the assessment for all questions together (before: M = 2.33; after: M = 3.43; Wilcoxon one-sided; r = 0.83, p < 0.05). Between pre- and post-results for each of the topics, no or no significant correlations can be traced.
Through both measurements, it can be shown that the intervention boosted the knowledge estimations of the participants.
Correlation with another variable shows:
Self-estimation regarding specific usage for using DL and AI in courses (pre- and post-intervention (questionnaires), n = 15): DL does not show correlations when the results from self-estimation of general knowledge before and after intervention (competency tests) are compared with self-estimation for specific usage in DL and AI courses for the same time points (before-before and after-after). AI does show a weakly positive and significant correlation between before results (rs = 0.49, p < 0.05) and a positively significant and moderate correlation between post results (rs = 0.69, p < 0.05) (all tested one-sided).
Secondly, after the estimation of knowledge, the actual knowledge is measured.
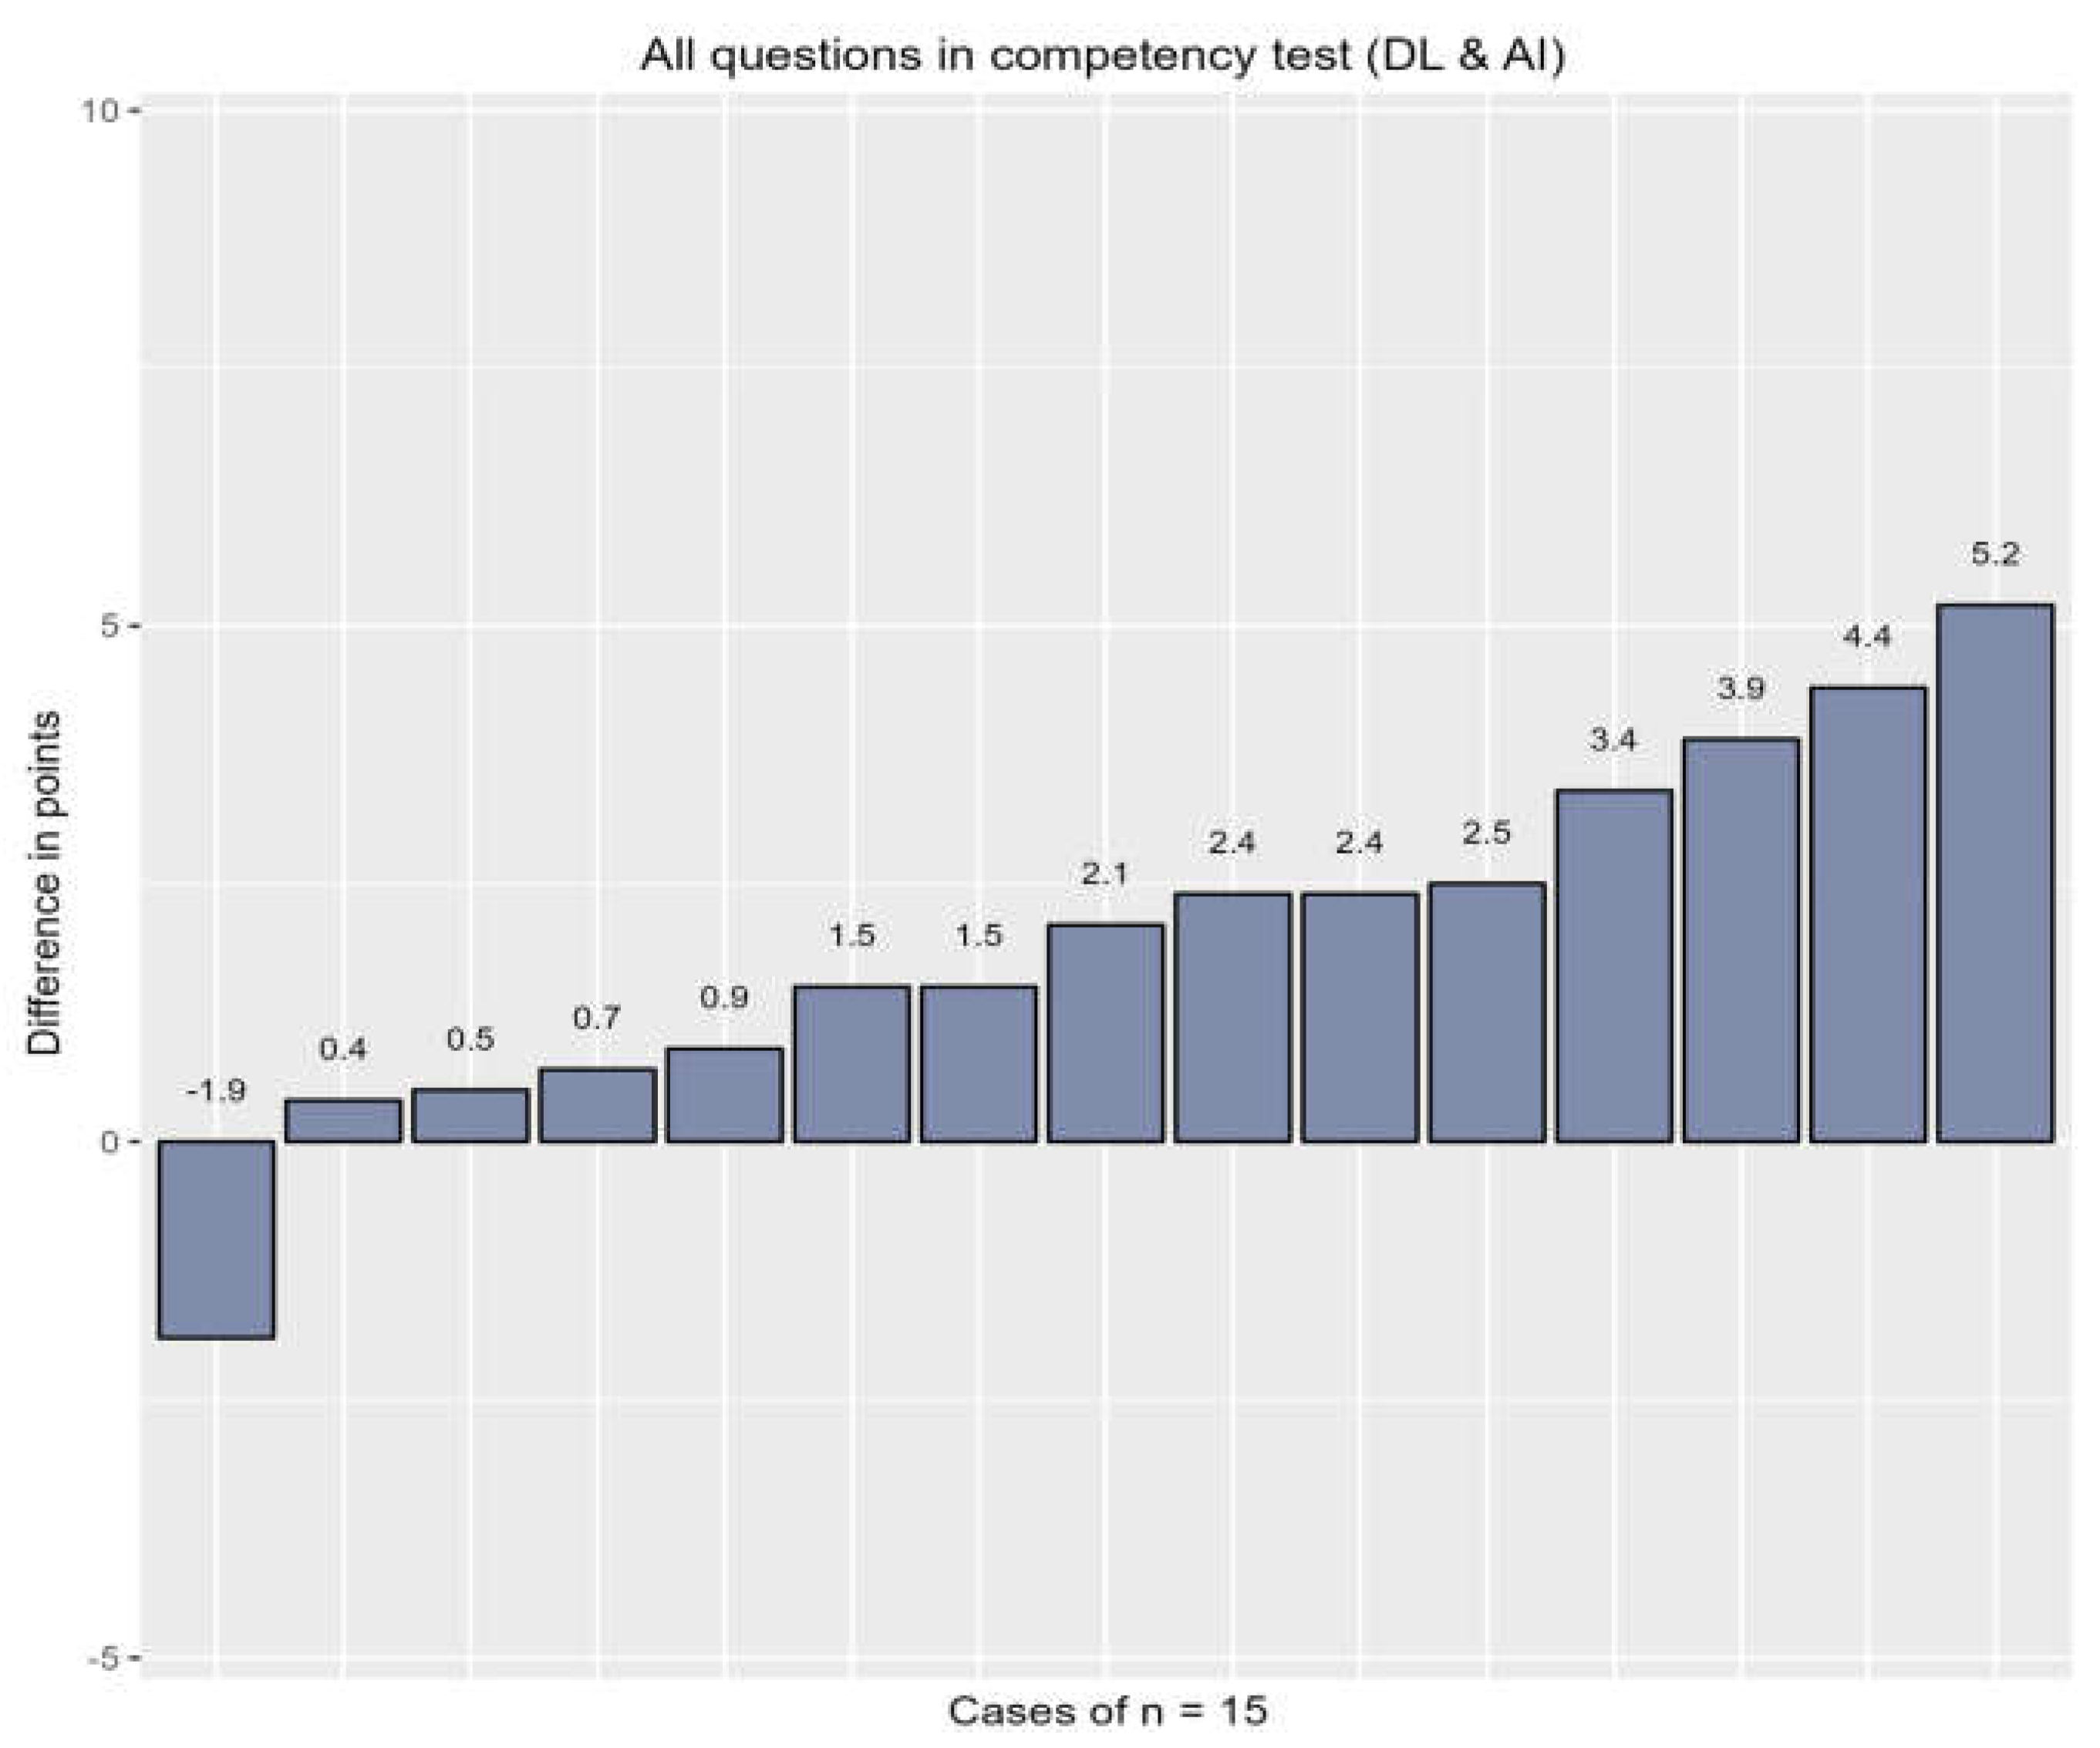
For 14
knowledge questions, actual/objective knowledge and sums of points were calculated. There were 4 questions for DL and 10 for AI (pre- and post-intervention (competency tests),
n = 15). Of most interest is the difference between pre- and post-results. As shown in
Figure 4, only 1 of 15 participants has less points (−1.9) in total than before, with 5.2 points being the biggest positive difference:
While the points for DL show no significant differences (before: M = 1.9, after: M = 2.3; Wilcoxon one-sided; p = 0.088), both AI (before: M = 4.8; after: M = 6.39; Wilcoxon one-sided; r = 0.77, p < 0.05) and the whole test (before: M = 6.7, after: M = 8.69; Wilcoxon one-sided; r = 0.78, p < 0.05) reveal moderate intervention effects. However, because DL has only 4 in contrast to AI’s 10 questions, errors in DL’s questions have a higher effect on its separate results than in the case of AI. Nearly all pre–post-correlations are significant (moderate effect size—AI (before-after): rs = 0.75 and total (before-after): rs = 0.71; weak effect size—DL and AI (before): rs = 0.56 + DL and AI (after): rs = 0.61; all p < 0.05). The sole exception is DL before–after for having a non-significant correlation.
In the end, actual knowledge and self-estimation are looked at together. In
Table 2, correlations of actual knowledge between the variables regarding the two self-estimations of knowledge show only two significant correlations; these are boldly marked.
Although actual knowledge has experienced gains (but not-significantly for DL), there are almost no (significant) correlations with both knowledge estimations (specific and general) to be found. This relates to the self-assessment of value (in the context of knowledge) for the target group. Although value can be ascribed to a matter (topics DL and AI), its hypothetical value is interpreted depending on the self-estimation of knowledge, whereas the quality in usage (also, value for others) is, among other things, dependent on the actual knowledge itself.
7.2.2. The Outcome of the Experiments Regarding Later Implementation in School
For the second layer of results, assessments for possible outcomes on an objective level are looked at.
For this, value for pupils with the statement “The teaching of DL/AI will bring added value to the students in the future.” is discussed (pre- and post-intervention (questionnaires), n = 20).
For DL, the data show no significant differences between assessments pre-intervention (M = 4.45, Mdn = 4.5) and post-intervention (M = 4.5, Mdn = 4.5) (Wilcoxon one-sided; p = 0.589). However, a significant difference can be proven for AI before (M = 4.6, Mdn = 5) and after (M = 5.4, Mdn = 6) with moderate effect strength (Wilcoxon one-sided; r = 0.5, p < 0.05). DL proves to be significantly and positively moderately correlated (rs = 0.56, p < 0.05) while AI shows no significant correlation between both times. How DL and AI measure against each other should be assessed, especially in regards to the after results. Here, the rank sums of AI are significantly higher than DL’s with moderate effect strength (Wilcoxon; r = 0.71, p < 0.05).
Correlations with other variables show:
Self-estimation regarding specific usage for using DL and AI in courses (post-intervention (questionnaire), n = 21): While DL does not reveal a significant correlation, AI shows a significant correlation that is moderately positive (rs = 0.47, p < 0.05).
Enthusiasm for DL and AI projects by pupils (post-intervention (questionnaire), n = 21): For DL a significantly moderate and positive correlation can be traced (rs = 0.73, p < 0.05). For AI, there is no significant correlation. The sole comparison of rank sums for this variable between DL (M = 4, Mdn = 4) and AI shows higher values for the latter (M = 5.29, Mdn = 6). The difference is significant and shows a moderate effect size (Wilcoxon; r = 0.66, p < 0.05).
Own capacity to excite pupils for DL and AI projects (post-intervention (questionnaire), n = 21): Neither DL nor AI show (significant) correlations.
AI has a higher estimation of added value for pupils in the future and its post-results are significantly higher than before. In addition, the enthusiasm of pupils for it is rated higher than DL. Both differences are significant in comparison to DL.
The assessment of added value for the future gives way to potentials that lie in integrating transferable knowledge and its potential usage from secondary to tertiary education levels; the academic gap is, therefore, bridged if the corresponding implementations and conditions on both levels are met.
7.2.3. Policy Issues Regarding the Teacher Training Experiments
In this part, results for policy-level questions concerning the integration of DL and AI into curricular frameworks are explicated.
Missing contents for DL and AI in curricular frameworks with the statements “I think that the content on DL/AI is missing from the current curricular frameworks in the subject [...].” (pre- and post-intervention (questionnaires), n = 20): The intervention was conducted for Informatics teachers only. The usable data for them is n = 18. There are no significant differences for DL pre- and post-intervention (before: M = 4.25, Mdn = 4; after: M = 4.17, Mdn = 4) (Wilcoxon one-sided; p = 0.805). The same holds true for AI (before: M = 4.25, Mdn = 4; after: M = 4.56, Mdn = 5) (Wilcoxon one-sided; p = 0.482). Between before (Wilcoxon; p = 0.9301) and after (Wilcoxon; p = 0.202) results for comparing DL and AI, no significant differences can be found. Between time points—before and after—DL is not significantly correlated, while AI shows a moderately positive significant correlation (rs = 0.57, p < 0.05). In general, approval of DL and AI is high.
The second most taught subject is Mathematics (pre- and post-intervention (questionnaires), n = 20). Mathematics was indicated n = 14 times. Comparison of both time measurements shows no significant differences for both DL (before: M = 3.86, Mdn = 3.5; after: M = 3.79, Mdn = 4) (Wilcoxon one-sided; p = 0.586) and AI (before: M = 4.64, Mdn = 6; after: M = 3.93, Mdn = 4) (Wilcoxon one-sided; p = 0.937). Again, comparing pre- (Wilcoxon; p = 0.203) and post-intervention results (Wilcoxon; p = 0.638) for DL and AI yields no significant differences. Both DL and AI show significant correlations between pre-and post-intervention results: DL displays a highly positive (rs = 0.81, p < 0.05), while AI has a moderately positive correlation (rs = 0.66, p < 0.05). Agreement is less high among Mathematics compared to Informatics teachers.
The assessment of social relevance of DL and AI was measured with the statements “The topics DL/AI are of enough societal importance to integrate them in the curricular framework.” (post-intervention, n = 21): The comparison between DL (M = 5.19, Mdn = 5) and AI (M = 5.52, Mdn = 6) shows a significant difference in favor of AI, with weak effect size (Wilcoxon; r = 0.43, p < 0.05). Both variables show a moderately positive correlation, which is significant (rs = 0.55, p < 0.05). These are very high approval ratings. We think it is very important, but the implementation of this topic in the classroom still needs to be explored.
Correlations with other variables show:
Missing contents for DL and AI in curricular frameworks for subject: Informatics (post-intervention (questionnaire)): Results for DL and AI show significant correlations: DL reads for a moderately positive (rs = 0.63, p < 0.05) while AI reads for a weakly positive one (rs = 0.49, p < 0.05).
Missing contents for DL and AI in curricular frameworks for subject: Mathematics (post-intervention (questionnaire)): There are no correlations for DL and AI.
There are no significant differences between DL and AI and when they are compared to each other. This holds true for both subjects (Informatics, Mathematics). The social importance of integration into the curricular framework is rated significantly higher for AI than DL, and both correlate with the missing assessments of DL and AI in the subject Informatics.
Although the approval for missing DL and AI does not significantly change for the subjects Informatics and Mathematics, and value assessment stagnation for this variable is recognizable, a potential factor that might have influenced the replies has to be mentioned: The topics are already in the curricular frameworks, but in different states (for example: AI is specialization area, but not a compulsory one in the state of Berlin). This research has to be developed in future questionnaires in another way to appropriate the actual circumstances.
8. Conclusions, Recommendations and Future Work
Stakeholders expect from and ascribe varied values to educational collaborations and secondary schools in the academic bridge. The recommendations that will be presented in this chapter reflect the experiences of the stakeholders and aim to fill the gaps between policy and practice based on the evaluation and observation study made in both projects.
In the OpenU project, the educational designers were faced with a variety of barriers and difficulties in the second phase of the experimentation; this was reflected in the experimentation results and outcomes. The barriers that the educational designers emphasized are mainly in regards to the need for flexible solutions, recommendations to reduce these difficulties, barriers to reaching out to sustainable collaboration and successful virtual mobility scenarios. The participants highlighted that there is a disconnect between what central educational support services would like to implement and/or see developed, and the academic and teaching staff who are mentally prepared for another major switch. Meanwhile, the experts insisted on the advanced skills that educational designers should have to produce high-quality online mobility content. It needs technological, pedagogical, context knowledge and awareness of the internationalization regulations, as well as the intercultural learning dimension, which is not usually easy to find with many of the instructors in all universities.
As a consequence, we can testify to an obvious vertical gap regarding implementation of virtual mobility policies evolving into practice. While political demand, as well as educational need and willingness are clearly a given, structural anchoring, effective support and guidance on an institutional level are missing; i.e., there is a pipeline leakage in transformation of (inter)national policies to institutional strategy and regulation, as well as their subsequent implementation. At the same time, policy awareness among HE educators is remarkably low [
3].
This is a significant contrast to the very strong policy awareness in the area of teacher education, where both faculty and teachers involved in the training revealed a detailed knowledge of applicable policies and a distinct personal opinion on their possible adjustments. We consider this noteworthy, since the case study in teacher training is also carried by HE institutions, i.e., in practice it is subject to comparable structures as the case study in the field of virtual mobility. However, additional influences obviously come into play here, which have a positive effect on policy awareness and implementation. We draw two major conclusions from this:
There is a cultural break in the area of the academic bridge between secondary and tertiary education. Since not only learners, but also teachers are active in this transition, friction losses should be avoided in order to avoid impairing the development of competencies and personalities, which is particularly sensitive here.
Experiences from policy making and implementation in the field of teacher education could be transferred to the field of HE in order to promote policy awareness and impact there. This will require an adapted form in order to avoid unduly restricting the freedom of teaching in HE. However, a more precise translation into institutional policies and their more consistent implementation into practice (including adequately funded and skilled support structures) seems urgently needed.
We are now narrowing the focus to answer our research question based on the two case studies: Which value do the involved stakeholders expect from or ascribe to educational policies?
In OpenU, educational designers and IT specialists are the focal points in co-creating value. At the institutional level, value co-creation could be established through a spiral evaluation model as the preliminary outcome from the experimentation results and the policy makers. The added values establish a concrete feedback loop to fill the gap between policies and practices from one side, and strengthen the institutional infrastructure by increasing the operant resources. On the regional level, partnership agreements between the European institutions establish value co-creation nationally or even internationally, where much of the operand resources could be limited without value co-created by the operant resources. The immediate educational value is confirmed by the participants, while they are rather reluctant towards a value of policies.
In TrainDL, insight into value expectations is offered through questions that find (predominantly more) agreement after the intervention. Regarding this context, the answers of the target group nudged into these expectations. This study found that the participants see more value in AI than in DL, not only in general but in means through these dimensions (e.g., added value for the future or societal importance through curricular framework integration). However, it is important to take into account context factors, such as the intervention (e.g., distributed time for the DL and AI) or personal predispositions (e.g., usage of DL and AI in courses). Implicitly, they ascribe high value to current policies, such as curricular frameworks and their continued update. These value-charged processes are also hinting at the direction of future usage at the tertiary educational level and beyond, and are connected to the pupils that the courses given are targeted at. With highly rated means of future values and societal importance, the connection to the secondary educational level can be drawn.
Insights for recommendations were gained through the results presented above, but also through the construction of questionnaires and the experimentation process that helped foster the recommendations. We propose three groups of recommendations to close the identified gaps in different dimensions:
Recommendations for the field of virtual mobility:
Draw attention to the importance of building a common vision among partners through involved institutions, interested stakeholders, as well as existing contacts between staff members and departments in the framework of value co-creation advantages.
Put a strong emphasis on translating the applicable policies and strategies into practice, which requires structural anchoring and might benefit from a spiral model of experimentation.
Co-create the value from the experimentation using a triangle between three players: The policy makers at the institutional level, the educational designers, and the targeted students.
Establish design teams that contain experts in technological and pedagogical knowledge, with international and multicultural skills.
Recognize the efforts of the educational designers in order to encourage and reward them to implement digital learning content and virtual settings.
These points will play a steering role to close the vertical gaps between higher-level policies and good practices on-site.
Recommendations for the field of teacher training:
AI is established as more of a buzz-word [
36]. Therefore, it should be ascribed with scientific value to objectify it. DL seems to be the more neglectable for participants. Here, a two-fold-approach can be advised: (1) Drive home the interconnection between the two topics and (2) make clear (in conjunction with, but in demarcation, to AI) what both topics can do and cannot do.
Concerning DL and AI, the value that can be taught when and how it is connected to later usages should be demonstrated. These dimensions have to be in sync, not only to foster post-school usages (career choices or usage in non-connected or inter-connected work fields), but also to guarantee the interconnectivity between different educational levels and bridging them.
There is a divide between self-estimation and actual knowledge (for both DL and AI) on the teachers’ side. After integration of DL and AI into the curriculum, the hard ´currency´ could be training and testing knowledge (not only estimating), and therefore formulating testable knowledge targets that are to be carried/adapted over from secondary to tertiary education level.
These points might contribute vertically to further adapt higher-level policies to current practical needs.
Some general recommendations across both fields of education follow:
Dedicate the concept of value co-creation between partners in policy experimentation and at different institutional/regional levels.
Modify experimentations to match all target groups’ needs (students, educators and policy makers).
Use experimentation projects to defuse barriers between practice and policy, and for disseminating policy awareness/acceptance at different educational levels.
Boost the evidence-based culture in education through systematic evaluations using a consistent framework for sustainable change.
Pay more attention to the experimentation that interoperates HE policy, locally and internationally.
Provide the policies and strategies in very plain language for experimenters, trainers, students and teachers at schools.
Define future goals clearly and make existing or potential risk areas transparent. Provide monitoring and support structures to mitigate risks.
Establish a community network for the exchange of knowledge and experiences on educational reforms, and as a basis, share evidence and best practice examples in open repositories.
These points might help to close the horizontal gaps in policy making and implementation between different fields of education.
Comparing the results in TrainDL across all three evaluation phases for different target groups, is a core research goal in our next steps. This could be cross-matched with the results of the second evaluation phase of OpenU.
The research presented in this article is an example of cooperation between two Erasmus+ KA3 projects. Such cooperation is advised to merge and match different project aims in a meaningful way. In this case, both projects contribute to insights and recommendations in order to fill the policy gaps in the academic bridge. Such cooperation is a good show case for interlinkage and could encourage other researchers for such kinds of research work.
Depending on the current status of involved fields, future research might focus rather on making policy gaps visible or on analyzing how to further finetune existing policies and policy processes. Further attention should be paid to the mechanisms and barriers at work in the respective fields for the translation and implementation of policies. We strongly recommend a participative approach (such as value co-creation as presented here) in order to involve the perspectives of all involved stakeholders.


