Article

The Challenge to Link Biology, Chemistry, and Physics: Results of a Longitudinal Study on Self-Rated Content Knowledge

Biology Education, University of Göttingen, 37073 Göttingen, Germany
*
Author to whom correspondence should be addressed.
Educ. Sci. 2022, 12(12), 928; https://doi.org/10.3390/educsci12120928
Submission received: 11 November 2022 / Revised: 7 December 2022 / Accepted: 12 December 2022 / Published: 15 December 2022

Abstract

:
Interdisciplinary science teaching in (lower) secondary education can lead to out-of-field teaching in countries with a discipline-specific teacher education. For example, the discipline-specific teacher education in Germany does not fit the current demands of interdisciplinary science teaching, especially in comprehensive schools. Self-rated content knowledge (srCK)—a specific part of academic self-concept—of (prospective) teachers is important in the context of motivational orientations and due to the reciprocal relation of academic self-concept and performance. Previous research did not focus on the long-term development of core idea-based srCK regarding secondary education. Thus, we surveyed 271 (prospective) teachers of biology, chemistry, and physics three times (2019–2021). In addition, we surveyed seven chemistry and physics pre-service teachers participating in a biology content knowledge (CK) course. Taking into account measurement invariance, we used structural equation modeling and latent change models. The srCK of biology, chemistry, and physics showed a high relative and absolute stability. We did not find any correlation between srCK of biology and chemistry. SrCK of chemistry and physics always showed a small positive correlation. SrCK of biology and physics always had a strong negative correlation. Supporting these results, studying physics had a negative effect on the srCK of biology, and studying chemistry had a positive effect on the srCK of physics. Additionally, studying the subject of the srCK in question always had a strong positive effect. Though srCK seems to be time-stable, a biology CK course for pre-service chemistry and physics teachers showed strong positive changes in their srCK of biology. Thus, training in an unstudied subject could help to cope with the undesired time-stability of srCK. In addition, the strong negative correlation between the srCK of biology and of physics needs to be addressed in teacher education.

1. Introduction

Interdisciplinary science teaching in secondary education is a serious challenge for teachers and teacher education [1,2,3,4]. In this paper, interdisciplinary science teaching means teaching biology, chemistry, and physics as one subject [5]. Present issues of humanity, such as pandemics, climate change, or the energy crisis, concern multiple scientific disciplines. Addressing these issues with the perspectives of biology, chemistry, and physics is assumed a major advantage of interdisciplinary science teaching [5]. However, pre-service teachers in Germany can only study the single disciplines biology, chemistry, and physics and usually no more than two (science) subjects [6]. This leads to out-of-field teaching (e.g., [2]), i.e., teaching an unstudied subject (mainly at comprehensive schools). Furthermore, questions about the professional competence of (prospective) teachers for interdisciplinary science teaching occur. In this paper, we focus on self-rated content knowledge (srCK) as an important aspect of motivational orientations [7] and as a possible proxy for (prospective) teachers’ content knowledge (CK) (e.g., [8]). The latter is an integral part of professional knowledge [9]. Previous research shows a lack of longitudinal studies about (prospective) teachers’ srCK or academic self-concept in the context of science-related core ideas of secondary education. Thus, insights about possible changes or stability of this srCK during teacher education and possible factors influencing srCK are missing. These insights are important to analyze the actual state of teacher education, including chances and challenges. In addition, they are important to develop measures to improve teacher education regarding interdisciplinary science teaching. In our study, we want to learn more about the development of the srCK of biology, of chemistry, and of physics during two years of teacher education: How do the srCK of biology, of chemistry, and of physics change during this time period? What influence do the studied subjects have on the different subject-specific srCK types? Which challenges and chances for interdisciplinary science teaching exist in the present teacher education? Is it possible to strengthen srCK with participation in a content course for an unstudied science subject?

2. Theoretical Framework

2.1. Teacher Education and Interdisciplinary Science Teaching in Germany

In Germany, teacher education at university is usually separated into Bachelor (three years) and Master of Education program (two years), including courses on CK, pedagogical content knowledge (PCK), pedagogical knowledge, and first practical experiences [6]. For example, at University of Kiel or University of Göttingen, the focus is on courses regarding CK in the Bachelor program; in the Master of Education program, the focus is rather on PCK and pedagogical knowledge [6]. Practical experiences are integrated in the Bachelor and Master of Education programs at both universities [6]. In our paper, we call the students in the Bachelor and Master of Education programs pre-service teachers. This first phase of teacher education is followed by the traineeship at school for eighteen months to two years—the second phase of teacher education [6]. We call the university graduates who are trained in the second phase of teacher education trainee teachers in this paper. After finishing the two phases of teacher education, they can be employed as qualified teachers at schools [6]. In our paper, we named these persons in-service teachers; (prospective) teachers include all three groups, i.e., pre-service, trainee, and in-service teachers. In Germany, science is taught disciplinarily and interdisciplinarily in lower secondary education [10]. For example, in Lower Saxony, science is taught as an interdisciplinary subject from classes five to ten especially at comprehensive schools [11] and usually as separated subjects biology, chemistry, and physics at grammar schools [12].
At the same time, German teacher education for grammar and comprehensive schools usually includes biology, chemistry, and physics as separate disciplines [6]. In addition, mainly only two subjects are studied [6]. However, these two subjects do not have to be two science education subjects. Thus, mostly only one or two of the subjects of biology, chemistry, and physics are studied when entering interdisciplinary science teaching. This leads to the problem of out-of-field teaching [2,3]. There are programs in Germany that try to address this issue, such as the Schlözer Programm Lehrerbildung (SPL) at the University of Göttingen or the course of study science and technology at the Karlsruhe Institute of Technology. Within the SPL, a voluntary certificate program for interdisciplinary teaching was developed [13]. One focus of this certificate program is interdisciplinary science teaching [13]. The pre-service teachers study modules on CK and PCK of the otherwise unstudied subjects [13]. In addition, there is a module to gain teaching practice in interdisciplinary science teaching; it provides first experiences in school settings [13].

2.2. Definition and Importance of Self-Rated Content Knowledge

Teachers’ professional competence includes professional knowledge and motivational orientations [9]. One domain of professional knowledge is CK [9]. Research showed that CK is crucial for PCK (e.g., [14,15,16,17]). In turn, PCK is important for teaching (e.g., [15,17]). On that basis, we are interested in (prospective) teachers’ perceptions of their own CK in biology, chemistry, and physics [18], since a metasynthesis identified some correlation (r = 0.29) between performance and the corresponding self-report [8]. Referring to the multidimensionality and hierarchy of self-concept [19], we define this perception of their own CK as a specific part of the academic self-concept regarding a specific subject [4,18,20]. Academic self-concept is defined as the perceptions of the own skills regarding academic situations [20]. The academic self-concept, in turn, as a type of self-rated ability cognitions, is part of the motivational orientations of teacher’s professional competence [7]. On the one hand, these types of affective components are important; they are integral parts of teachers’ PCK models [21]. On the other hand, academic self-concept has a reciprocal relation to performance [22,23]. Thus, investigating srCK as a part of academic self-concept can give significant insights into current teacher education regarding interdisciplinary science teaching in secondary education.

2.3. Previous Research

There are cross-sectional investigations of the (academic) self-concept with pre-service biology and physics secondary teachers, generally regarding the CK and PCK [24,25], not with concrete core ideas such as in the science curricula for comprehensive schools in Lower Saxony [11]. Other studies, such as that from Jansen et al. [26], investigated academic self-concept for students on a rather subject-related specificity level. Some studies, such as that from Hardy [27], focused on curricular-relevant topics, also for students, in England. In turn, other studies, such as those from Yilmaz-Tuzun [28] or Yangin and Sidekli [29], investigated pre- and in-service-teachers and specific topics, but in the primary education of the USA and Turkey. In addition, Yilmaz-Tuzun [28] showed a positive relation between participating in more science content courses and “the confidence in teaching biology and earth science content”, r = −0.22, p < 0.05 (p. 195). Bröll and Friedrich [1] focused on curricular-relevant topics and German in-service teachers, but only from classes five to nine and without the integration of curricular-based core ideas. Thus, Handtke and Bögeholz [4] identified a lack of measurement instruments for srCK focusing on (prospective) teachers’ understanding of the biology, chemistry, and physics core ideas based on the German lower secondary education curricula.
They focused on the perceptions regarding biology, chemistry, and physics core ideas (lower secondary education) with 552 pre-service and trainee teachers in Germany using a cross-sectional design [4]. The researchers found a strong correlation between the srCK and the corresponding academic self-concept [4]. This strengthens the assumption of srCK as a specific part of academic self-concept [18,20]. In addition, they found (1) no correlation between the srCK of biology and of chemistry, (2) a positive and moderate correlation between the srCK of chemistry and of physics, and (3) a moderate and negative correlation between the srCK of biology and of physics [4]. Furthermore, Handtke and Bögeholz [4] showed that studying the subject of the srCK in question always had a strong positive effect. This effect is also described with manifest values of the srCK of biology, of chemistry, and of physics by Bröll and Friedrich [1]. Besides these strong positive effects, (1) studying physics had a negative effect on the srCK of biology; (2) in turn, studying biology had a negative effect on the srCK of physics and of chemistry; (3) studying chemistry had a positive effect on the srCK of physics [4].
However, to the best of our knowledge, there are no longitudinal studies looking at this type of (prospective) teachers’ srCK regarding science core ideas in (German) lower secondary education. However, to give an impression about the state of the art, we outline some exemplary longitudinal studies of neighboring research areas. Thus, we look at science CK and more general academic self-concepts in the following, since srCK can be seen as a proxy indicator of CK [8] and it correlated strongly with academic self-concept [4].
The longitudinal study of Nixon et al. [30] focused on the CK of 15 secondary science teachers from the USA in their first and fifth years of teaching by using concept maps. They found no significant gain in the teachers’ CK after five years of teaching [30]. Thus, Nixon et al. [30] concluded that teachers cannot be assumed to learn the necessary CK through teaching this CK. Sorge et al. [31] examined the physics CK of pre-service physics teachers at two time points in different years (2014–2015 with 26 pre-service teachers; 2015–2016 with 42 pre-service teachers). Their analysis revealed a strong prediction (relative stability) of pre-service teachers’ CK at time point two by the CK at time point one, β = 0.77, p < 0.001 [31]. Another longitudinal study focused on 22 secondary science (pre-service) teachers’ change in CK especially regarding energy, atoms, cell, and pollution with data from interviews including self-ratings at five measurement points over the period of 17 years [32]. They found out that CK “does not grow linearly over time.” [32] (p. 245). Regarding the studied subjects, they identified an advantage for teaching studied subjects in terms of confidence, interest, knowledge base, and faster remembering content [32].
Further, there are studies looking at academic self-concept on a more general level regarding primary education and the context of participations in interventions/courses. One exemplary study had a pre-post-follow-up design with 202 pre-service primary teachers; among other things, the researchers investigated the influence of an interdisciplinary course (focus on the CK and academic self-concept) on the academic self-concepts in biology, chemistry, and physics on a subject level [33]. They showed a significant increase in all three academic self-concepts [33]. Another study for primary and lower secondary education focused on pre-service teachers’ academic self-concept in physics over the course of two types of methods courses (n = 111 and 56) [34]. The researcher found the physics academic self-concept to be stable over time [34]. However, such studies rather focus on primary education leading to different requirements. They are on a more general level, not addressing specific curricular-relevant core ideas. Thus, a longitudinal study about the srCK of science subjects regarding the core ideas of German lower secondary education seems to be missing. Thus, a differentiated investigation of relative and absolute stability of the respective srCK is also missing. Relative stability has a focus on the change in rank order [35]. Absolute stability has a focus on the change in means/absolute values [35].

3. Research Questions and Hypotheses

The present paper aims to explore the development of the srCK of biology, of chemistry, and of physics. At the beginning, we investigated how the srCK of each subject is correlated with each other over two years.
Research Question 1:How are the srCK of biology, of chemistry, and of physics related with each other?
We wanted to deepen our results [4] by surveying the same persons over three successive years. Thus, we had one hypothesis comprising three sub-hypotheses:
Hypothesis 1.
The correlations of srCK
  • of chemistry and of physics are moderate and positive,
  • of biology and of physics are moderate and negative,
  • and there are no correlations between the srCK of biology and of chemistry.
In a second step, we investigated the stability of the srCK of biology, of chemistry, and of physics. Here, we were interested in the relative (correlation between the time points; [35]) and absolute stability (change in the mean between time points; [35]). There are studies looking at the science CK of secondary education pre-service teachers (e.g., [30,31]) or the general science academic self-concept of primary (or lower secondary) education pre-service teachers (e.g., [33,34]). However, the srCK of biology, of chemistry, and of physics on the level of curricular-relevant core ideas seem to be investigated only in cross-sectional designs so far (e.g., [1,4,27]). Thus, there is no previous knowledge about its development over several years. Therefore, our research question was:
Research Question 2:How time-stable is the srCK of biology, of chemistry, and of physics?
In a further step, we wanted to know more about factors influencing the srCK of biology, of chemistry, and of physics (over the time of two years). Thus, our third research question was:
Research Questions 3:Which factors have an influence on the stability of the srCK of biology, of chemistry, and of physics?
Regarding the studied science subjects, research has shown a strong effect of studying the subject of the corresponding srCK [1,4]. In addition, there were some remarkable (and especially negative) effects of the studied subjects on the srCK of other subjects [4]. According to these results, our second hypothesis comprises four sub-hypotheses assuming specific effects:
Hypothesis 2.
The studied subjects have an effect on the srCK of biology, of chemistry, and of physics:
  • Studying the corresponding subject has a clear positive effect on the srCK (e.g., studying biology on the srCK of biology).
  • Studying physics has a negative effect on the srCK of biology.
  • Studying biology has a negative effect on the srCK of chemistry and of physics.
  • Studying chemistry has a positive effect on the srCK of physics.
Moreover, we want to learn about the impact of a voluntary SPL course of the cer-tificate program of interdisciplinary science teaching on the time-stability of srCK [13]. In the past, other researchers showed positive effects of CK courses on science academic self-concepts or beliefs of being confident in teaching specific CK regarding primary education [28,33]. We investigated the srCK of biology regarding a biology CK course with chem-istry and physics pre-service teachers. The aim of this course was to strengthen chemistry and physics pre-service teachers’ biology CK (biology = unstudied subject) [13]. Thus, we expected a raise in these pre-service teachers srCK of biology—similar to the advantage of studying the subject of the srCK to rate [1,4]:
Hypothesis 3.
The biology CK course has a positive effect on the chemistry and physics pre-service teachers’ srCK of biology.

4. Methods

4.1. Research Design of the Longitudinal Study

We started the longitudinal study with our cohort from nine German universities in autumn 2019. We repeated the survey with this cohort in a longitudinal design twice, i.e., we collected data from the same study participants again in autumn 2020 and 2021. Thus, we had information regarding srCK at three time points. After two years, the probability was high that most of the study participants transitioned into a next section of teacher education during this period (e.g., from Bachelor to Master of Education or from Master of Education to teacher training). This should allow deep insights into the development between all sections of teacher education. In addition to the pre-service teachers from nine German universities, we contacted 90 study participants who expressed interest in participating in the longitudinal study after participating in a previous study (nprevious study = 590; see [4,36,37]). Thus, there were few trainee teachers at the beginning of this longitudinal study as well. We started the longitudinal study with 698 study participants. From these 698 study participants, 393 participated again in 2020, and 284 again in 2021. Thus, we were able to slow down panel attrition over time from 43.70% to 27.74%. The panel attrition does not seem to concern a specific type of study participants. For example, the study participants that only participated in the first two time points and those that participated in all three time points do not clearly differ in terms of the phase of teacher education, age, sex, university study site, and studied science subjects (biology, chemistry, and physics). Thus, there is no hint of a specific reason for their drop out, rather indicating that those missing are random. At the beginning, perhaps some study participants only wanted to be part of the study in 2019, since every participation was rewarded. Only 515 of the 698 study participants left their contact details for the second time point. In the following years, there seem to have been more study participants who were ready to participate in the long term.

4.2. Sample of the Longitudinal Study

In sum, 271 study participants completed our questionnaire at all three time points. Table 1 shows the characteristics of these 271 study participants over the two years. Nearly all pre-service teachers studied in a program to teach at a grammar/comprehensive school from the beginning. Only two pre-service teachers started in a program to teach at another school type and changed their indication in the following time points into grammar/comprehensive school as well. Thus, all following trainee and in-service teachers should be part of secondary education as well.
Table 1 shows that the majority of our longitudinal sample was female. A lot of our study participants studied biology (more than half of the sample). Indeed, we tried to recruit more similar amounts of study participants in the different subjects. However, in Germany, biology is studied by more pre-service teachers than chemistry or physics (e.g., [38], first semester in winter semester 18/19; biology: 12,005, chemistry: 5369, physics/astronomy: 2818). Thus, this ratio of studied subjects seems to be rather realistic. In our sample, around 15% each studied only chemistry, only physics, or biology together with chemistry. Only a few study participants studied biology with physics, chemistry with physics, or all three subjects. All these values are time-stable with the exception of some single changes. Changes over the two years especially appeared regarding the phase of teacher education.
We started our longitudinal study with around two thirds Bachelor students and one third Master of Education students (and just a little group of trainee teachers) in 2019. At this time, the Bachelor students were in semester 4.21 (SD = 2.13) of the Bachelor program on average, with a minimum of 1 and maximum of 15. The Master of Education students were in semester 2.51 (SD = 1.66) of the Master of Education program on average, with a minimum of 1 and maximum of 7. These study participants progressed in teacher education over time. Thus, the portions of Bachelor and Master of Education students were nearly on the same level in 2020—besides the growing number of trainee teachers and some first in-service teachers. This distribution shifted again as expected in 2021. Only one fifth of the study participants was left in the Bachelor studies, over half of the sample was in the Master of Education studies, but almost another fifth was working as trainee teachers.

4.3. Accompanying Research Regarding the Biology Content Knowledge Course

In addition to our longitudinal study, we investigated gains in the srCK of biology of pre-service chemistry and physics teachers in a biology CK course by accompanying research. This course is part of a certificate program of the University of Göttingen regarding the preparation for interdisciplinary science teaching in (lower) secondary education [13]. The biology CK course (presence time: 56 h, self-study: 94 h) contains sessions regarding an overview of the biological disciplines and methods of scientific inquiry in biology (e.g., experimentation). In addition, there is one session for each of the eight biological core ideas of the lower secondary curriculum [12]. The pre-service teachers receive broad overviews of important aspects of the core ideas with selected in-depth examples. The in-depth examples are introduced by the lecturers or by the participants: Each participant of the course gives an individual presentation on a scientific biological paper related to one of the core ideas (20 min presentation and 10 min discussion). No more than two pre-service teachers are assigned to one core idea/session.
In the winter semester 2021/2022, ten pre-service teachers attended the biology CK course. Seven of them participated in our voluntary survey before (pre-test) and after the course (post-test). These seven participants of the biology CK course studied chemistry, physics, or both subjects, but not biology. The participants were in the Bachelor program and all studied to teach in secondary education (grammar or comprehensive school). We asked these seven study participants before and after their participation in the biology CK course (among other things) about their srCK of biology. The aim of this accompanying research was to investigate the impact of the participation in this course on the respective pre-service teachers’ srCK of biology.

4.4. Measurement Instrument and Survey

We used the reliable and valid measurement instrument from Handtke and Bögeholz [4] to measure the srCK of biology, of chemistry, and of physics. The measurement instrument development is described in detail by Handtke and Bögeholz [4]. The instrument focuses on relevant core ideas of the lower secondary education curricula in Lower Saxony (Germany) for students of biology, chemistry, and physics [12], since there are no detailed guidelines for teachers’ CK [4]. The instrument does not operationalize the curriculum of interdisciplinary science teaching [11], since the discipline-specific approach allows analyses between the subjects [4]. Further, the curricula of biology, chemistry, and physics [12] contain the core ideas that are integrated in the curriculum for interdisciplinary science teaching [4].
The instrument contains three overarching items about the own CK to teach interdisciplinary science well (one for each subject), e.g., “I think that I have enough content knowledge to teach the biological parts of the interdisciplinary subject science well.” [4] (p. 66). In addition, there are seven items regarding biology core ideas, four regarding chemistry core ideas, and six regarding physics core ideas [4]. These 17 items all start with “I know very much about the core idea of…” [4] (p. 66). Each is followed by the specific core idea (e.g., reproduction) with at least two examples that were developed with the help of experts (n = 8) (e.g., “sexual and asexual procreation, technical cloning, […]”) [4] (p. 67). We asked one researcher of biology/chemistry/physics education each and two teachers/teacher trainers of biology/chemistry/physics each to rate the examples for their subject(s) [4].
One exemplary item for biology is “I know very much about the core idea of reproduction (e.g., sexual and asexual procreation, technical cloning, recombination, and manifestation of genetic information, such as genes, phenotype, mutation).” [4] (p. 66–67). A four-point Likert scale is applied with the categories: 1: “Do not agree at all”, 2: “Do rather not agree”, 3: “Do rather agree”, and 4: “Fully agree” [4] (p. 55).
The survey asked for different information: personal data, overarching questions about interdisciplinary science teaching (not considered in this paper), srCK of biology, of chemistry, and of physics [4], self-efficacy beliefs of interdisciplinary science teaching [36,39] (not considered in this paper), and the perceived advantages and disadvantages of interdisciplinary science teaching (not considered in this paper). We executed the study online with the tool LimeSurvey. At the end of this survey, the study participants were directed to another survey for further participation in the following year and monetary compensation for their participation in the recent year. The survey gave information about the rewarding system including 5€ per person for the participation in the study at each time point. In addition, at each time point, the participation in the drawing of vouchers was possible (20 vouchers worth 25€, from 2021 as cash due to internal regulations of the University of Göttingen).

4.5. Measurement Invariance and Data Analysis

Measurement invariance is required for a reliable analysis of longitudinal data since it shows whether the measurement instrument does work in the same way at all time points. Testing measurement invariance can include four steps of measurement invariance [40]: configural (same model), metric (same factor loadings), scalar (same intercepts), and residual invariance (same residuals). Metric invariance allows for the comparison of variance and covariance [41]. Scalar invariance allows for the comparison of factor means [41], and residual invariance allows for the comparison of factor variances since the item residuals are equivalent [40].
We applied the more commonly used structural equation modeling (SEM) framework [40]. We estimated all autocorrelations (unstructured) to enable the calculation of the autocorrelations between all three measurement time points. Configural invariance was evaluated by the absolute fit of the model [40]. The other steps of invariance were evaluated by a comparison of the model fit of one invariance step, e.g., configural invariance, and the next one, e.g., metric invariance; this includes the differences between the models’ fit statistics [40].
We used the following more liberal guidelines as lower limits to test the overall model fit: X2/df ≤ 5, (robust) Comparative Fit Index (CFI) > 0.90, (robust) Root Mean Square Error of Approximation (RMSEA) < 0.10 [41,42]. Furthermore, we applied the following guidelines for testing the differences between the individual steps of measurement invariance: ∆CFI < 0.005, ∆RMSEA < 0.01 [43]. In addition, smaller values of the AIC (Akaike Information Criterion) [44] and BIC (Bayesian Information Criterion) [45] indicate a better fit when comparing the models [35]. A non-significant chi-square difference test also indicates the acceptance of a stricter model, i.e., the next step of invariance [46]. However, there are doubts about (only) using the chi-square difference test [43,47]. These doubts are due to the fact that sample size and violation of normality assumption can have a great impact on the result of the chi-square difference test [43]. The additional use of goodness-of-fit indices, such as CFI or RMSEA, is recommended [43,47]. Therefore, we used goodness-of-fit indices and the chi-square difference test. However, in case of doubt, our focus was on the goodness-of-fit indices.
We used SPSS 27 and the following packages in RStudio: lavaan (0.6–9; [48]), ggplot2 (3.3.5; [49]), and tidyr (1.2.0; [50]). We applied the robust maximum likelihood estimator (MLR) for SEM, since it can deal with non-normality and we assume our data to be metric [51,52]. We used listwise deletion for the only use of complete data with study participants that attended the questionnaire every year. This procedure seems reasonable since the panel attrition rate does not seem to concern specific persons in particular (see Section 4.2).
First, we tested configural and metric invariance for the model including srCK of biology, of chemistry, and of physics at the same time (Table 2). We wanted to investigate the latent intercorrelations and, therefore, metric invariance was sufficient [41]. The means of the observed variables were omitted to make the calculation of the model possible (more parsimonious model). Furthermore, these means are not necessary for the comparison and interpretation of the latent correlations. The fit indices show that metric invariance is valid for our model (Table 2).
After that, we tested the different steps of measurement invariance for three single models regarding srCK of biology (Table 3), of chemistry (Table 4), and of physics (Table 5). The fit indices of the different models show that residual invariance is valid for all three models.
Due to residual invariance of all models (including scalar invariance), we applied latent change models/latent difference models [53,54,55,56,57] to investigate the development of the srCK of biology, of chemistry, and of physics over the course of the two years. This included the differences between the years as latent variables. According to Steyer et al. [54,55], we specified neighbor change versions of the models, i.e., we specified the changes between time points 1 and 2 and 2 and 3.
We used violin plots with integrated box plots to illustrate the distributions of the srCK of biology, of chemistry, and of physics at all time points. We scaled the violins to the same maximum width to allow an easier comparison of the distribution between the time points. When integrating the studied subjects into the graphs, we focused on studying biology, chemistry, or physics only. We excluded combinations of biology, chemistry, and physics since the graphs would be too complicated with all seven combinations of studied subjects. In contrast, we integrated all combinations of studied science subjects into the latent change models in the form of time-invariant covariates. Note that we used the three covariates regarding the studied subjects of the study participants (indicated at time point 1) as the exogenous variables for srCK of biology, of chemistry, and of physics at all three time points. This procedure allowed for a more parsimonious model, compared to using the studied subjects at time points 2 and 3 as well. The covariates for the investigation of the studied subjects’ influence were effects-coded (−1 = did not study the subject, and 1 = studied the subject) [58]. We created one variable for each subject (biology, chemistry, and physics). We integrated all three variables in the three different latent change models simultaneously. Thereby, we considered the effect of all studied combinations of biology, chemistry, and physics on the srCK of biology, of chemistry, and of physics. We evaluated the strength of the coefficients of determination with the guidelines from Cohen [59]: small = 0.02 ≤ R2 < 0.13, middle = 0.13 ≤ R2 < 0.26, and strong = R2 ≥ 0.26.
In addition, we applied the Wilcoxon signed-rank test [60] to investigate the difference in pre-service chemistry and physics teachers’ srCK of biology before and after the biology CK course of the SPL certificate program for interdisciplinary science teaching. We used the Wilcoxon signed-rank test as a non-parametric method due to our small dependent sample in the course (n = 7) [60]. We evaluated the strength of the effect by Pearson’s r with the guidelines from Cohen [59]: small = 0.1, middle = 0.3, and strong = 0.5.

5. Results

5.1. Research Question 1: Relations of the Self-Rated Content Knowledge of Biology, of Chemistry, and of Physics with Each Other

Hypothesis 1a–c: Intercorrelations of the Self-Rated Content Knowledge of Biology, of Chemistry, and of Physics over Two Years

Before looking at the single latent change models of the srCK of biology, of chemistry, and of physics, we present one model with all three subjects of srCK together (metric invariance, see Table 2). We investigated the intercorrelations (Table 6) of the srCK of biology, of chemistry, and of physics (X2/df = 1.60, robust CFI = 0.95, robust RMSEA = 0.05, 90%-CI = 0.04–0.05). Similar for all three time points, Table 6 reveals rather small positive correlations between the srCK of chemistry and srCK of physics (r = 0.23–0.30, p < 0.01), no correlations between the srCK of biology and srCK of chemistry, and strong negative correlations between the srCK of biology and srCK of physics (r = −0.57 to −0.52, p < 0.01).

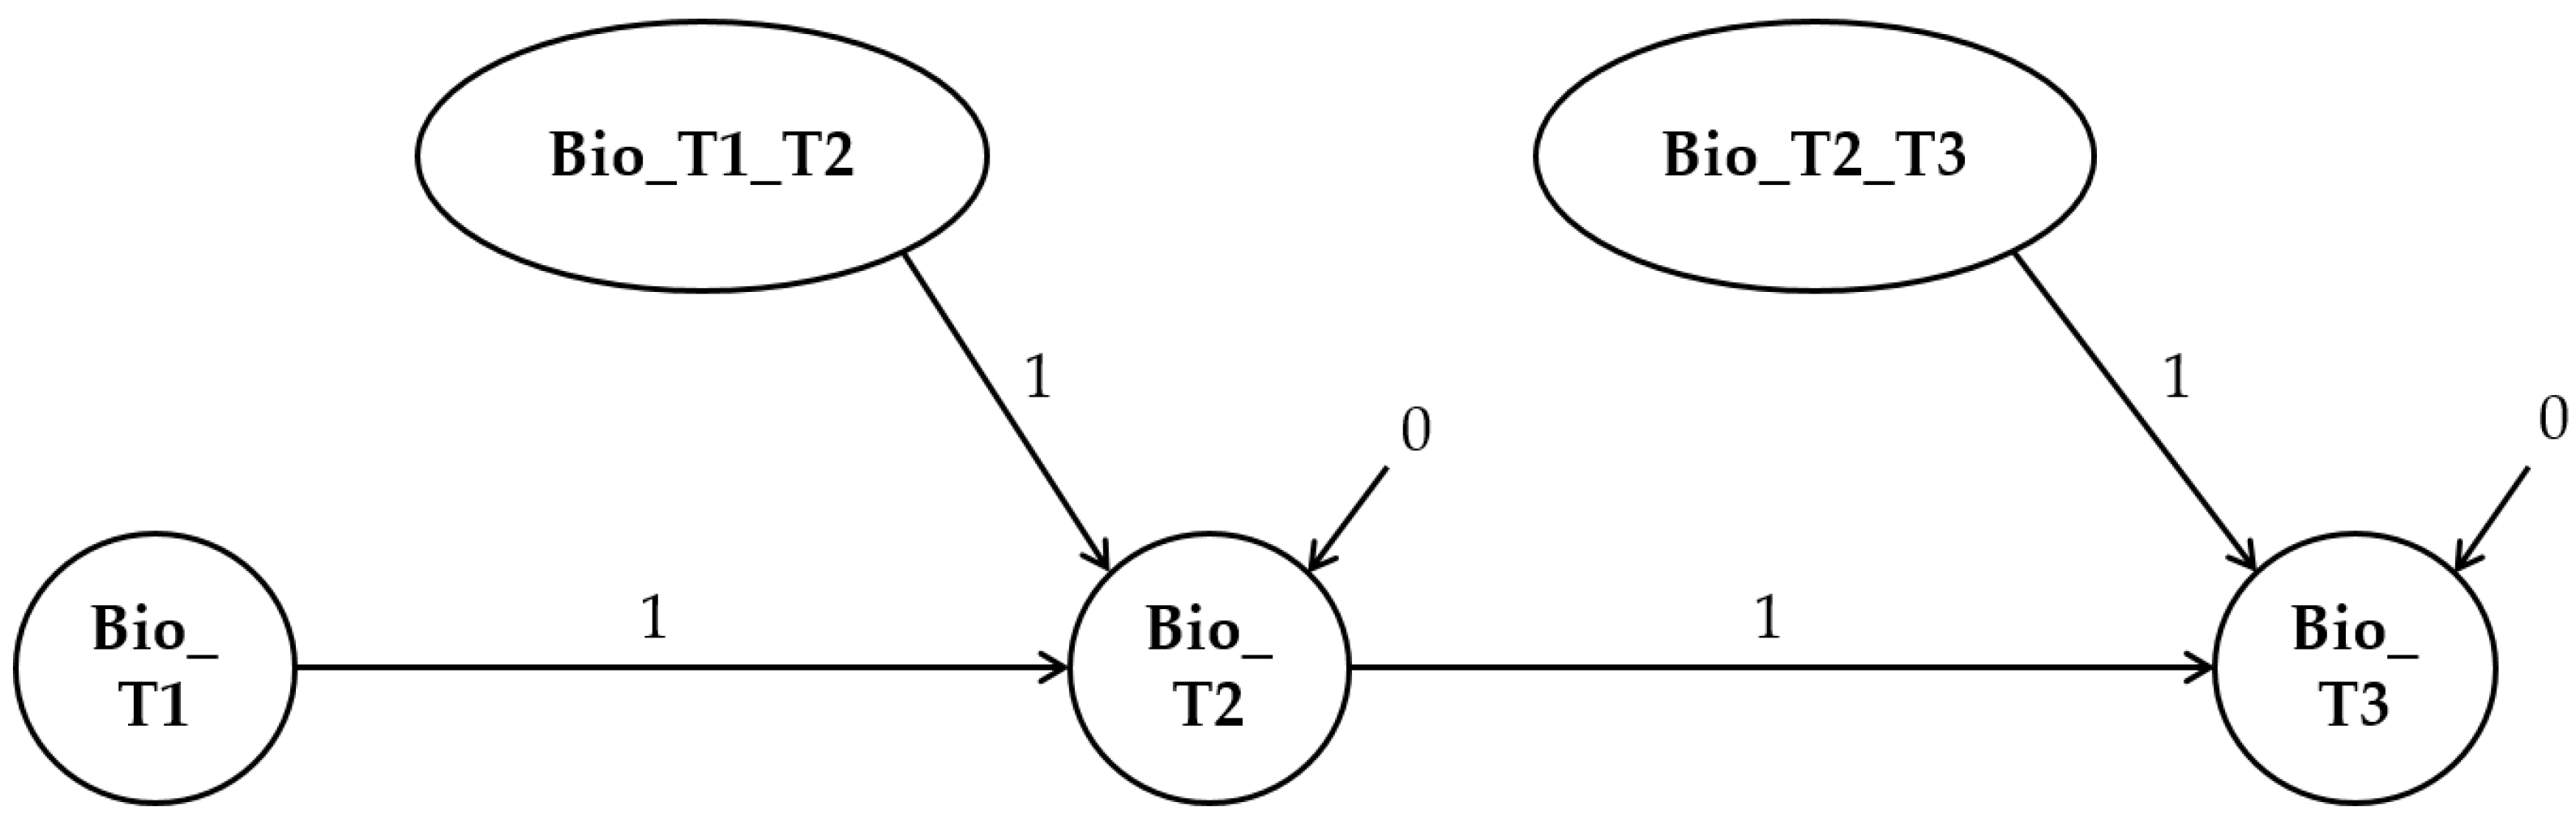
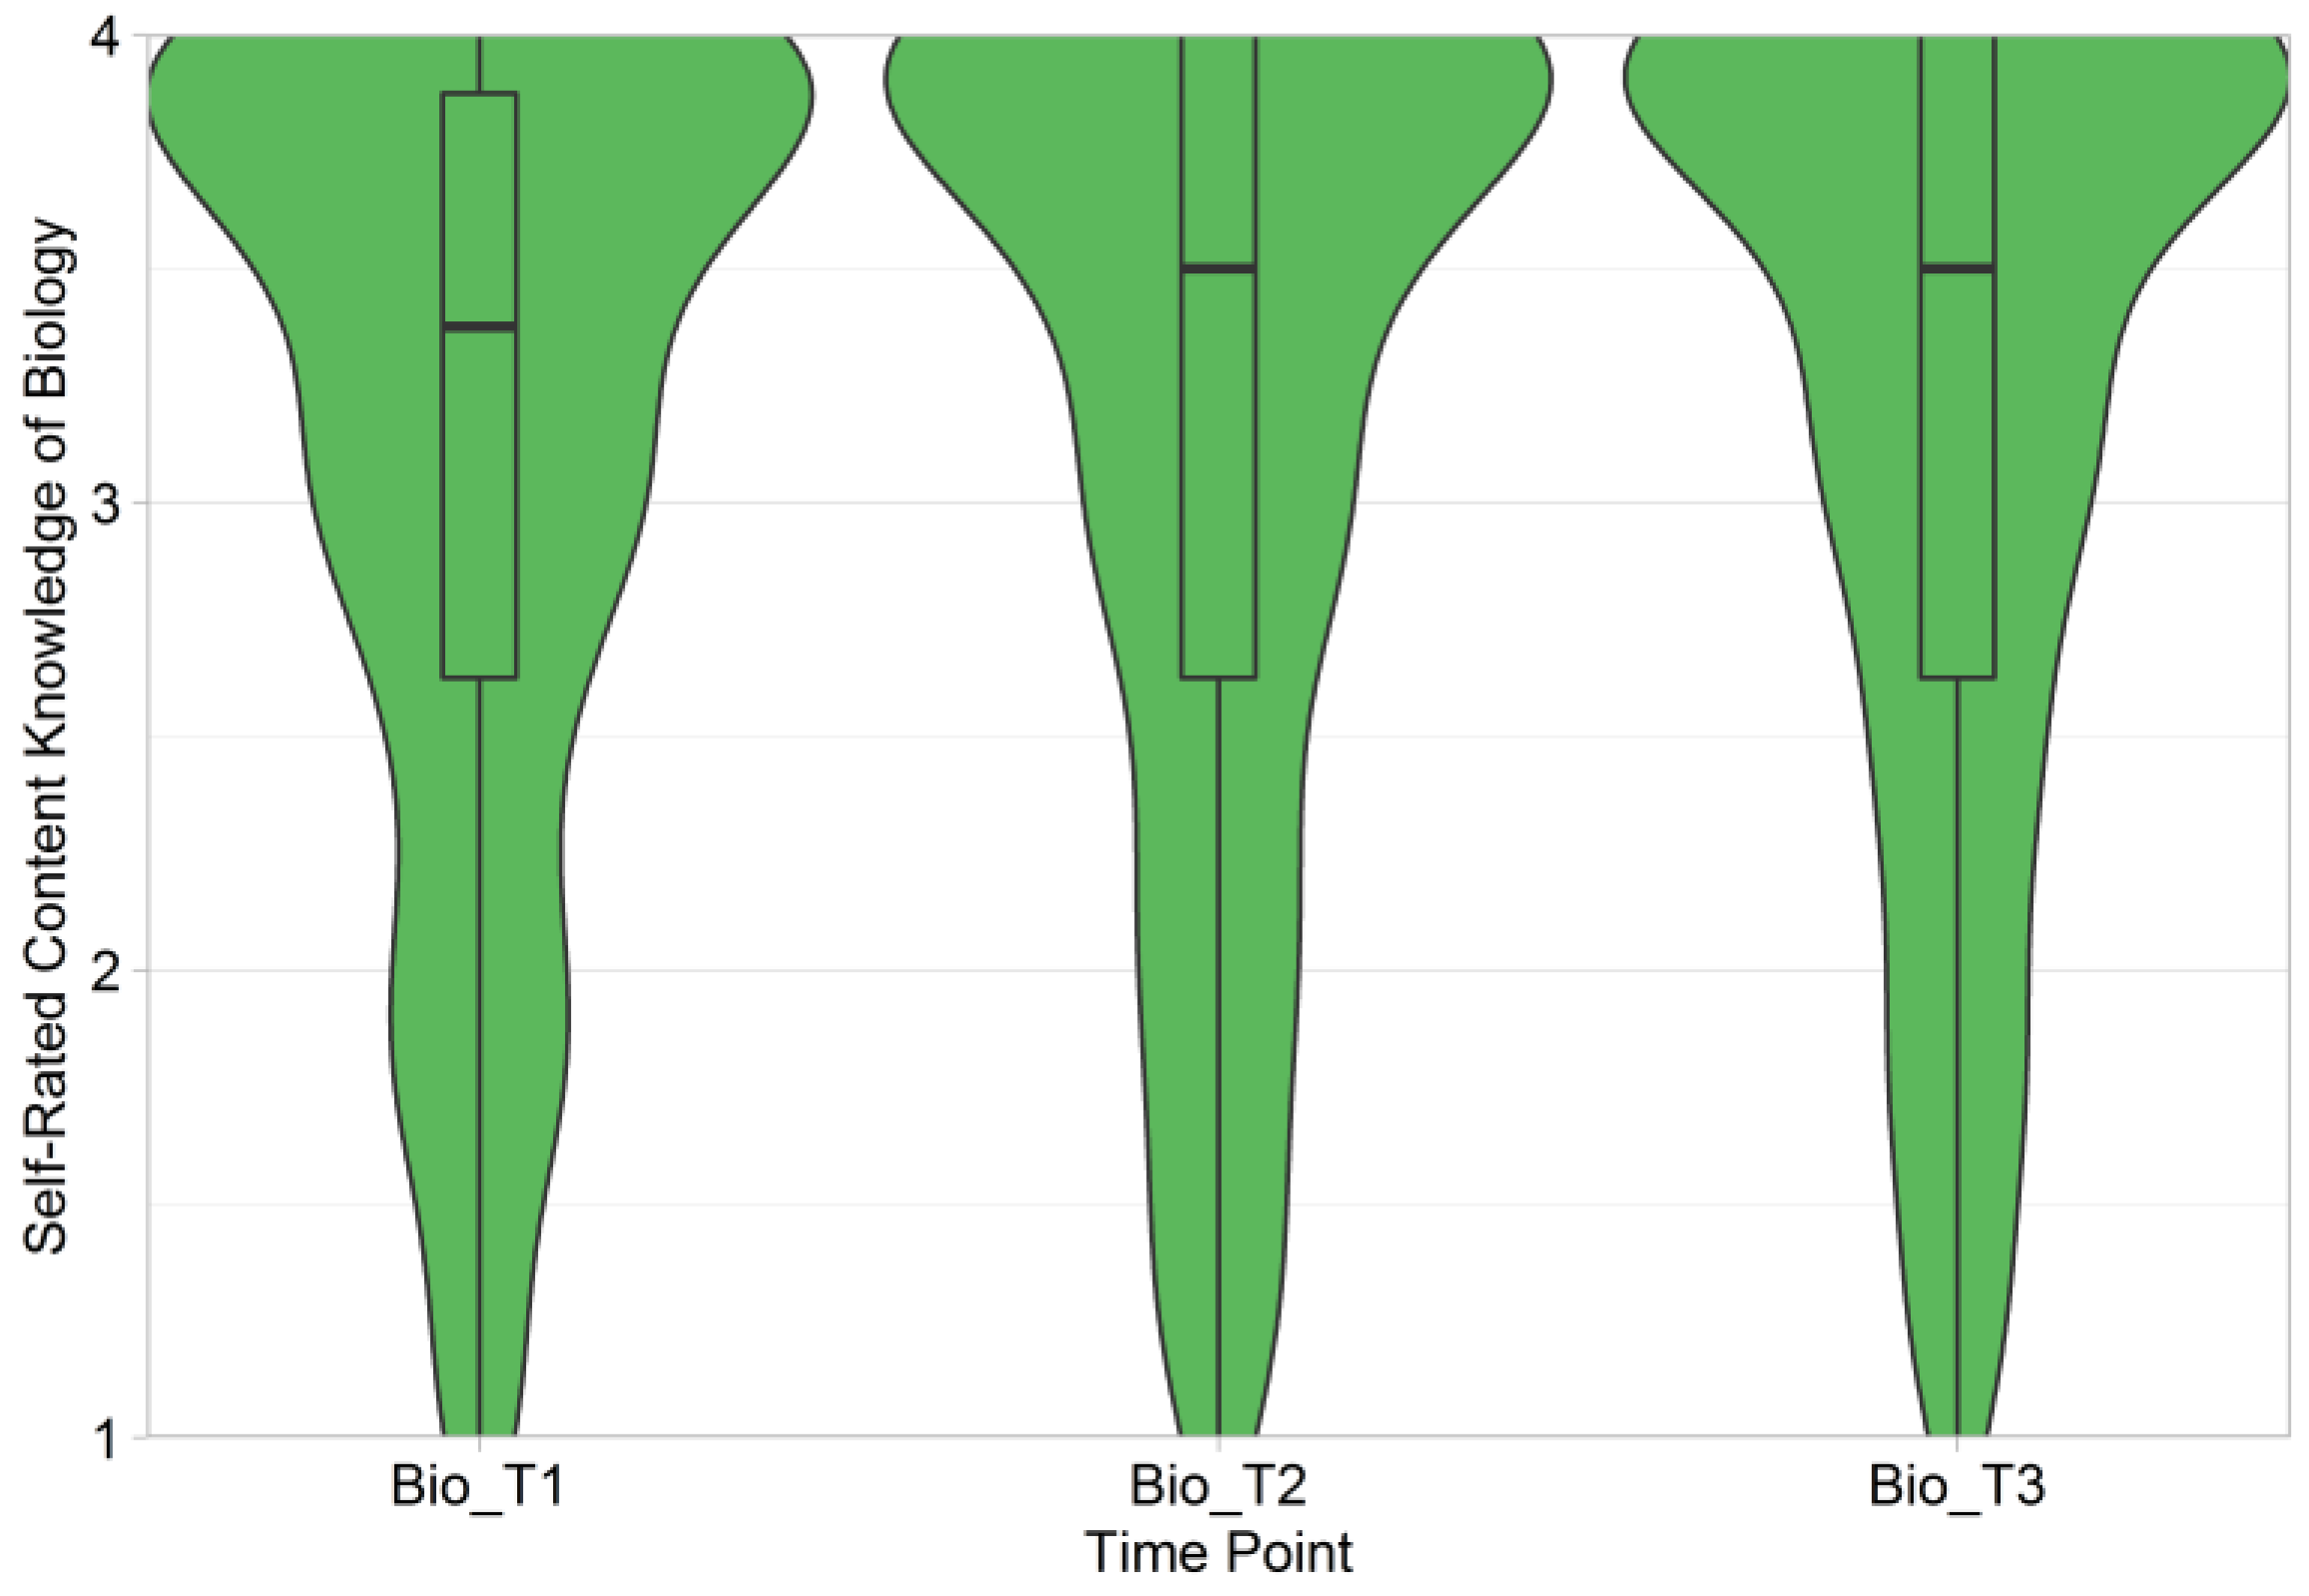
5.2. Research Question 2: Time-Stability of the Self-Rated Content Knowledge of Biology, of Chemistry, and of Physics over Two Years of Teacher Education

5.2.1. Self-Rated Content Knowledge of Biology

We positively tested the three subject-specific models of srCK for residual measurement invariance, including scalar invariance (biology: Table 3; chemistry: Table 4; physics: Table 5). Thus, we specified three latent change models, following the scheme of Figure 1, exemplified for the srCK of biology.
The scheme shows the latent factors of self-rated content knowledge of biology at time points 1, 2, and 3 (Bio_T1, Bio_T2, and Bio_T3) computed by the manifest variables. For biology, the manifest variables are one overarching item and seven items regarding biological core ideas at each time point. Between these values in 2019, 2020, and 2021, we specified factors that represent the change for every test person between two time points (Bio_T1_T2 between Bio_T1 and Bio_T2; Bio_T2_T3 between Bio_T2 and Bio_T3). The arrows represent the necessary regressions fixed to 1 and the residual variance (i.e., the unexplained variance) fixed to zero. These specifications mean: Adding the value of time point 1 to the change between time point 1 and 2 equals the value at time point 2 that has no unexplained variance. Thus, the srCK at time point 2 is only computed by the srCK at time point 1 and the change between time point 1 and 2. This applies accordingly for the time points 2 and 3. By these specifications, the latent factors Bio_T1_T2 and Bio_T2_T3 represent the change between two time points. Since we investigate the changes between two neighboring time points, the model is called the neighbor change model.
First, we look at the distribution of the srCK of biology for all study participants at the three time points in Figure 2. The distribution of the studied subjects (see Section 4.2) should be kept in mind when looking at Figure 2, Figure 3 and Figure 4.
The distribution is very similar at each time point with a clear positive srCK of biology (median over 3). Regarding the latent change model of the srCK of biology, we look especially at two aspects of the model: relative stability (change in the rank order in the form of correlations between the time points; [35]) and absolute stability (change in the means/difference between time points; [35]). Table 6 shows a strong correlation between the srCK of biology of neighboring time points (rT1–T2 = 0.89, p < 0.01; rT2–T3 = 0.92, p < 0.01). The change factors between the srCK of biology at time points 1 and 2 as well as time points 2 and 3 were not significant.

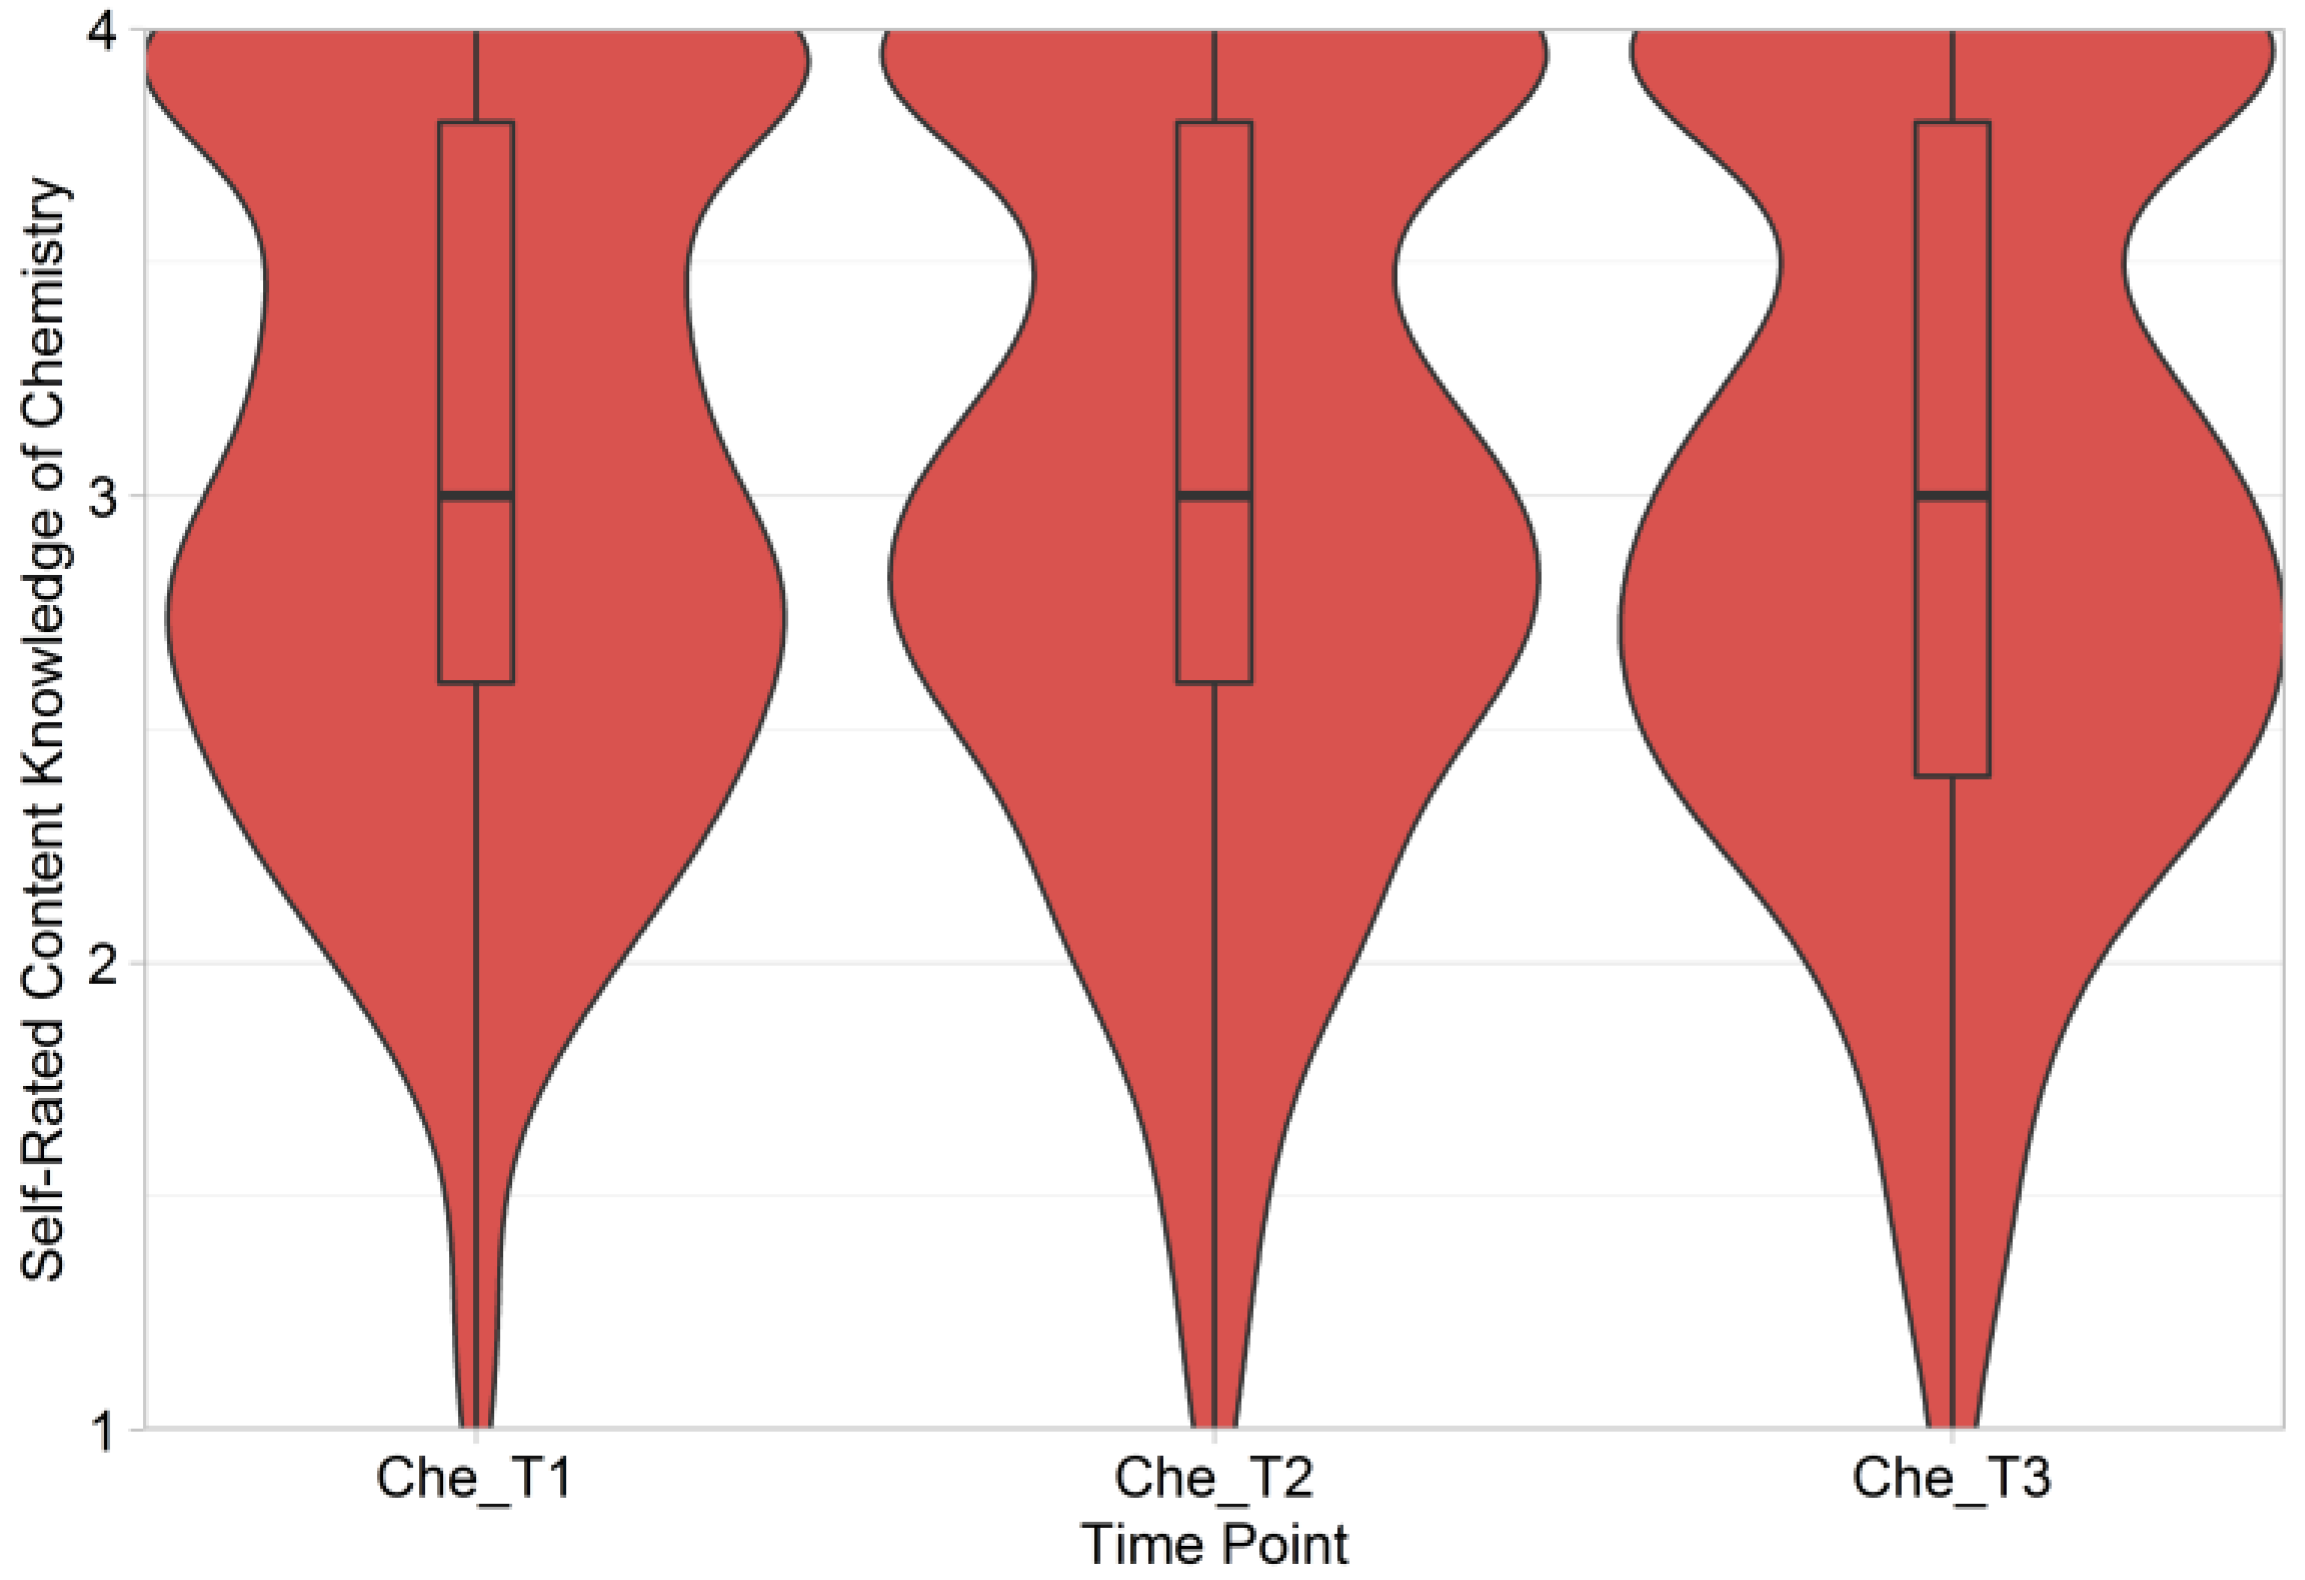
5.2.2. Self-Rated Content Knowledge of Chemistry

First, we look at the distribution of the srCK of chemistry for all study participants at the three time points in Figure 3.
Figure 3. Self-rated content knowledge of chemistry at three different time points (n = 271) illustrated by violin plots and box plots. The violins have been scaled to the same maximum width for a better comparison of the distributions. Scale: 1 = Do not agree at all, 2 = Do rather not agree, 3 = Do rather agree, and 4 = Fully agree. Che_T1 = time point 2019, Che_T2 = time point 2020, and Che_T3 = time point 2021.
Education 12 00928 g003
The distribution is very similar at each time point with a positive srCK of chemistry (median around 3). Comparable to biology, we look at relative stability and absolute stability. Table 6 shows a strong correlation between the srCK of chemistry of neighboring time points (rT1–T2 = 0.85, p < 0.01; rT2–T3 = 0.89, p < 0.01). The change factor between the srCK of chemistry at time points 1 and 2 was not significant. In contrast, the change factor between the srCK of chemistry at time points 2 and 3 indicated only a small negative change in the mean of −0.07, p < 0.05.

5.2.3. Self-Rated Content Knowledge of Physics

First, we look at the distribution of the srCK of physics for all study participants at the three time points in Figure 4.
Figure 4. Self-rated content knowledge of physics at three different time points (n = 271) illustrated by violin plots and box plots. The violins have been scaled to the same maximum width for a better comparison of the distributions. Scale: 1 = Do not agree at all, 2 = Do rather not agree, 3 = Do rather agree, and 4 = Fully agree. Phy_T1 = time point 2019, Phy_T2 = time point 2020, and Phy_T3 = time point 2021.
Education 12 00928 g004
The distribution is very similar at each time point with a rather neutral srCK of physics (median around 2.5). Comparable to biology and chemistry, we look at relative stability and absolute stability. Table 6 shows a strong correlation of the srCK of physics between neighboring time points (rT1–T2 = 0.90, p < 0.01; rT2–T3 = 0.93, p < 0.01). The change factors between the srCK of physics at time points 1 and 2 as well as time points 2 and 3 were not significant.

5.3. Research Question 3: Factors Influencing the Stability of Self-Rated Content Knowledge of Biology, of Chemistry, and of Physics

5.3.1. Hypothesis 2a–d: Effect of the Studied Subjects on the Self-Rated Content Knowledge of Biology, of Chemistry, and of Physics

Since the studied science subjects are not equally distributed in our sample (see Section 4.2), we examine the srCK of biology, of chemistry, and of physics differentiated by the subjects studied next. Before looking at the latent change model with the studied subjects integrated, we present the absolute values for the three srCK subjects differentiated by studying biology, chemistry, and physics (Figure 5, Figure 6 and Figure 7). For a clearer overview, the figures only contain study participants with biology, chemistry, or physics as one studied subject and the other subject not being biology, chemistry, or physics. In contrast, the latent change models integrate all subject combinations of the 271 study participants (e.g., studying biology with chemistry).
Figure 5 shows high values of the srCK of biology for the study participants who studied biology. The lowest values had the study participants who studied physics. The study participants who studied chemistry were in between with a median near the theoretical middle of the scale. Figure 6 shows the highest (and absolutely very high) values of the srCK of chemistry for the study participants who studied chemistry. The study participants who studied biology and physics indicated lower values on a similar level a little above the theoretical middle of the scale. Figure 7 indicates the highest values of the srCK of physics for the study participants who studied physics. While the study participants who studied biology had the lowest values, the study participants with chemistry as a subject were around the theoretical middle of the scale.
In sum, three things can be highlighted:
  • Study participants who studied the subject of the srCK in question showed the highest (and absolutely high) values.
  • Regarding the srCK of unstudied subjects:
    • Study participants who studied chemistry showed rather neutral srCK of biology and slightly positive srCK of physics.
    • Study participants who studied biology showed low srCK of physics and vice versa.
    • Study participants who studied biology or physics showed rather neutral srCK of chemistry.
In a next step, we integrated the three effects-coded variables for studying biology, chemistry, and physics as time-invariant covariates (with an effect on the starting value as well as the first and second change factors) into each of the three subject-specific latent change models: biology (X2/df = 2.20, robust CFI = 0.95, robust RMSEA = 0.07, 90%-CI = 0.07–0.08), chemistry (X2/df = 2.46, robust CFI = 0.95, robust RMSEA = 0.08, 90%-CI = 0.07–0.09), and physics (X2/df = 2.57, robust CFI = 0.93, robust RMSEA = 0.08, 90%-CI = 0.07–0.09). All models showed a good fit.
Table 7 presents the effects of studying biology, chemistry, or physics on the starting values (value at time point 1) of the srCK of biology, of chemistry, and of physics. The effects of studying one of the three science subjects on the two change factors (factors for difference between time points 1 and 2 as well as time points 2 and 3) of each of the three models were not significant.
Table 7 shows strong positive effects of studying the subject of the corresponding srCK in question (biology: β = 0.78, p < 0.001; chemistry: β = 0.67, p < 0.001; physics: β = 0.80, p < 0.001). In addition, there is a small positive effect of studying chemistry on the srCK of physics (srCKphysics: βchemistry = 0.21, p < 0.001) and a rather small negative effect of studying physics on the srCK of biology (srCKbiology: βphysics = −0.13, p = 0.021). Table 8 presents the coefficients of determination of the starting values and two change factors of the srCK of biology, of chemistry, and of physics.
The coefficients of determination indicate a strong explanation of variance in all starting values of srCK by the three studied subjects’ covariates. The effect of the studied subjects on the changes, which are based on the starting values in part, shows only small or no meaningful further explanations of the variance. This fits the missing effects of the studied science subjects on the change factors mentioned before.

5.3.2. Hypothesis 3: Effect of a Biology Content Knowledge Course on the Self-Rated Biology Content Knowledge of Pre-Service Chemistry and Physics Teachers

Hypothesis 3 is about the effect of a biology CK course on the srCK of biology of chemistry and physics pre-service teachers (n = 7). Figure 8 presents a spaghetti plot with the development curves of the seven participants from the beginning to the end of the course (winter semester 2021/2022).
The participation in the biology CK course significantly and strongly increased the pre-service chemistry and physics teachers’ srCK of biology, z = 2.38, p < 0.05, r = 0.90. Figure 8 shows the strong effect and the gain in every pre-service teacher’s srCK of biology (means included for more information).

6. Discussion

Our study contributes to the field of research with a novel longitudinal study examining (prospective) teachers’ srCK of biology, of chemistry, and of physics. The study has a focus on teacher education for lower secondary education in Germany and curricular-relevant core ideas. In sum, our results show that the srCK of biology, of chemistry, and of physics regarding lower secondary education seems to be time-stable (relative and absolute stability; Figure 2, Figure 3 and Figure 4). Nevertheless, the participation in a biology CK course had positive effects on the participants’ srCK of biology (Figure 8). Although the sample is small and this has to be taken into account, srCK can be improved though it seems to be time-stable during teacher education. Studying the subject of the srCK in question had strong positive effects (Table 7). In addition, studying chemistry was supportive for the srCK of physics, and studying physics had a small negative effect on the srCK of biology (Table 7). Only the starting values of srCK were influenced by the studied subjects, and there was a strong clarification of variance in the starting values of the srCK of biology, of chemistry, and of physics. These results indicate an important role of the specific teacher education in terms of the studied subjects for the srCK (Table 8). In addition, the relationship between the srCK of biology and of physics needs to be highlighted as a major challenge for interdisciplinary science teaching (Table 6). The intercorrelations were strongly negative at all three time points. This underlines previous results [4]. Supported by the negative effect of studying physics on the srCK of biology, these results suggest for teacher education to stronger emphasize the links between biology and physics.
The intercorrelations between the srCK of biology, of chemistry, and of physics show similar values as in Handtke and Bögeholz [4]: There are no correlations between the srCK of biology and of chemistry at all three time points and rather small to middle positive correlations between the srCK of chemistry and of physics (Table 6). A correlation between the srCK of biology and of chemistry may be missing due to the focus on lower secondary education that hardly considers topics such as neurobiology [4]. In Handtke and Bögeholz [4], the srCK of biology and of physics was rather middle negative correlated (r = −0.34, p < 0.01). In this longitudinal study, the correlation is also negative, but rather strong negative at all three time points (Table 6). Perhaps subjects such as biophysics are too rarely addressed in teacher education or too novel to be strongly considered in teacher education and thus, are no strong part of (prospective) teachers’ perception of their CK. In this context, it is interesting to note that students at school do not always seem to perceive these hurdles between biology and physics when they are asked about srCK/academic self-concept on a subject level (positive correlation; [26]) or on a topic level (positive correlation; [27]).
Taking into account Figure 5, Figure 6 and Figure 7, we want to look at the absolute perception of the unstudied srCK of biology, of chemistry, and of physics. For example, pre-service teachers of all subjects seem to think that they have a rather good chemistry CK (Figure 6). This is in line with Fruböse et al. [3], who stated that chemistry CK can be mastered by every teacher due to the ostensible low requirements. Thus, chemistry does not seem to be the key problem of interdisciplinary science teaching from the (prospective) teachers’ perspective.
We cannot support stereotypes or results such as those from White and Tyler [61] that (high school) physics teachers feel well-prepared for other sciences besides physics as well. This is valid for chemistry a little, but our (prospective) physics teachers show rather low srCK when it comes to biological core ideas. Perhaps questionnaires only asking on a subject level [61] do not point out the complexity and diversity of biology like questionnaires reflecting several core ideas [4]. Yilmaz-Tuzun [28] stated that pre-service elementary science teachers would rather teach biology than physics and chemistry concepts. Looking at the values of all study participants (Figure 2, Figure 3 and Figure 4), only at first sight this seems to be valid for our sample regarding (lower) secondary education. However, a more precise look differentiated by the studied subjects is necessary (Figure 5, Figure 6 and Figure 7). The differentiated analyses show that the overarching result of Yilmaz-Tuzun [28] needs more differentiation.
The effects of the studied subjects (Table 7) were similar in some points to those of Handtke and Bögeholz [4], but also different in other points. In both studies and in the study from Bröll and Friedrich [1] as well, studying the subject of the srCK in question was a strong advantage (Table 7; [4]). In both studies, there is a small positive effect of studying chemistry on the srCK of physics and a small negative effective of studying physics on the srCK of biology (Table 7; [4]). In addition, Handtke and Bögeholz [4] also found a small negative effect of studying biology on the srCK of chemistry and a small negative effect of studying biology on the srCK of physics. Thus, not all results of Handtke and Bögeholz [4] could be reproduced in our longitudinal sample. However, important conclusions from the intercorrelations and the studied subjects’ effects are:
  • Studying the subject according to the srCK is very positive for the srCK and indicates a positive effect of discipline-specific teacher education on the intended subject.
  • From the (prospective) teachers’ perspective, chemistry and physics have a rather positive relation, that could be used for teaching interdisciplinary science.
  • From the (prospective) teachers’ perspective, biology and physics have a rather strong negative relation, which could be an enormous challenge for teaching interdisciplinary science.
Looking at relative and absolute stability [35], as well as the clarification of variances in the srCK of biology, of chemistry, and of physics, similar trends emerge for each subject. For all subjects of the srCK, we identified a strong relative stability with correlations between the time points of at least r = 0.85, p < 0.01 (Table 6). In addition, there also seems to be an absolute stability for the srCK of biology, of chemistry, and of physics. Besides one very small and negligible change in means in chemistry between time points 2 and 3, there was no significant difference. This seems to be comparable to some results of longitudinal studies regarding physics and chemistry, also indicating no strong changes over the course of time [30,31]. This stability over time also underpins the intercorrelations that were stable over two years and indicates a stable perception of the (prospective) teachers. This complicates the challenge of interdisciplinary science teaching additionally. Not only do there seem to be strong perceived hurdles between biology and physics CK, but also the srCK of all subjects does not seem to change significantly during teacher education. Thus, one cannot assume that these hurdles will be solved by the actual teacher education without additional interventions or modifications.
We also identified very strong predictors of the variance in the starting values of the srCK of biology, of chemistry, and of physics: the studied subjects (Table 8). While there is actually no change over time due to very strong relative and absolute stability, the studied subjects seem to be a crucial factor to explain the different levels of the srCK of biology, of chemistry, and of physics. Thus, the srCK seems to be determined by the subject studied in large parts (Table 8). In addition, some effects and intercorrelations show great challenges for interdisciplinary science teaching (e.g., strong negative correlation between biology and physics; Table 6 and Table 7).
It seems that there is a major role in teacher education to prepare pre-service teachers for interdisciplinary science teaching. Despite the stability during teacher education, we were able to show (with a small sample), that the srCK of biology can be improved strongly by a biology CK course for pre-service chemistry and physics teachers (Figure 7). Therefore, our results rather indicate a possible change comparable to Beudels et al. [33] with their interdisciplinary course affecting academic self-concept in science. Thus, the srCK of biology, of chemistry, and of physics seem to depend on the studied subjects—without great changes over the time of teacher education. However, for biology we could find hints that the srCK—although it is time-stable—can be improved significantly.

7. Conclusions

7.1. Limitations and Future Research

When interpreting our results, some limitations have to be considered. Regarding our sample, only 18.1% were trainee teachers and 3.7% were teachers at the third time point. Thus, the conclusion about the teacher education of trainee teachers and the phase of the in-service teachers is limited. Surveying the sample in following years also could give hints on these parts of teacher education. Nevertheless, teacher education in university is captured very well by our sample.
We have to register panel attrition in our sample, but we do not seem to have a bias, since those missing seem to be rather random (see Section 4.1). In addition, considering possible changes in study or university, with nearly 300 persons, we were able to convince a lot of study participants to stay in the panel in three consecutive years. At the beginning of our longitudinal study, we contacted pre-service teachers of nine German universities. It is important to note that 90 study participants of a previous study regarding srCK (n = 590) [4,36,37] were additionally contacted over e-mail to be part of the first time point of our longitudinal study. Thus, there will probably be an overlap between a part of the previous study on srCK [4,36] and the 698 study participants at the beginning of the longitudinal study. This possible overlap has to be kept in mind when comparing the results (e.g., intercorrelations, effect of the subjects studied) of the previous cross-sectional study on srCK [4] and the present longitudinal study on srCK. However, since it is not a great portion of both samples (90 of 590 and maximally 90 of 698 study participants), the effect should be negligible.
Further, our sample contains more than 50% study participants with biology as at least one subject. This is due to there being many more biology than chemistry and physics pre-service teachers in Germany (e.g., [38]). Since we looked at the different parts of srCK differentiated by the studied subjects and surveyed enough chemistry and physics (prospective) teachers, the sample composition does not really matter.
Our investigation of the intervention’s effect could only be carried out with seven study participants. Thus, more research is necessary to support this result. However, our result seems to give a serious hint since the effect of the intervention is very strong. In addition, the effects of comparable chemistry or physics CK courses for pre-service teachers who did not study the subject should be investigated. Perhaps the strong effect of the biology CK course is also due to the fact that the study participants had rather low starting values of the srCK of biology. However, even the one test person who started with a relatively high srCK value was able to get better. In sum, further research is needed to deepen our preliminary result regarding the accompanying research.
It has to be made transparent that all study participants received a monetary compensation for their participation. In addition, every year 20 people received a bonus by draw. Since all study participants received a monetary compensation, an effect of this compensation cannot be tested in our study. However, the monetary compensation was essential to reduce panel attrition.
Last, it has to be taken into account that our survey focuses on teacher education for lower secondary education, not higher secondary education. This can have implications, e.g., for the interpretation of the intercorrelations. Nevertheless, this focus makes sense since interdisciplinary science is rather taught in lower secondary education [10]. In Germany, if at all, interdisciplinary science is taught in lower secondary education, too [10].
Another option for further research is a differentiation of the core ideas by lower and higher secondary education or specific class levels such as performed by Bröll and Friedrich [1] in another context (classes five to nine, used topics and no core ideas). Further, it can be of interest to investigate the suitability of srCK as a proxy indicator of CK. In this context, the intercorrelations of biology, chemistry, and physics CK could be examined, too. Such future research could help to find out about possible negative relations not only between srCK of biology and of physics, but also between the respective CK. Such an investigation could clarify whether this negative correlation only relies on (prospective) teachers’ perception of the subjects or also on the knowledge of the subject matter of biology and physics itself.

7.2. Implications

Our results are in line with other teachers and researchers that demand a change in teacher education regarding interdisciplinary science teaching (e.g., [1,2,3,4,37,62]). We found no change in the srCK of biology, of chemistry, and of physics over time, a negative effect of studying physics on the srCK of biology (Table 7), and negative (biology–physics) as well as no (biology–chemistry) intercorrelations (Table 6). These results reveal the actual discipline-specific teacher education as not appropriate enough for interdisciplinary science teaching. In addition, the results underline the great challenge to link biology, chemistry, and physics in interdisciplinary science teaching. Regarding another interdisciplinary teaching challenge, Education for Sustainable Development (ESD), we also revealed potential for more ESD in German teacher education [63]. However, interdisciplinary science teaching is assumed important to address interdisciplinary issues of humanity in school [5]. Pre-service biology teachers also expressed their belief in addressing issues of humanity and cross-linking contents as advantages of interdisciplinary science teaching [64]. In addition, the majority of these pre-service biology teachers criticized the actual teacher education regarding interdisciplinary science teaching [64]. Thus, a corresponding interdisciplinary science teacher education would be crucial to prepare the (prospective) teachers better for the challenges of interdisciplinary science teaching. This could also help to strengthen the links between biology and physics. Other countries are already one step further by focusing on (integrated) STE(A)M education, i.e., teaching science, technology, engineering, arts, and math (e.g., [65,66,67]). Integrative STEM education includes even two or more of these STEM subjects or one STEM subject and at least one other subject in school [68]. The following starting points for improving discipline-specific science teacher education can be derived from our results:
  • Due to the very stable values of the srCK of biology, of chemistry, and of physics during teacher education, active interventions and advanced trainings are necessary for interdisciplinary science teaching (e.g., [13]). Otherwise, the negative effect of studying physics and the intercorrelations of the srCK of biology, of chemistry, and of physics do not seem to change over time. It needs to be considered whether a voluntary offer can suffice at all.
  • A focus on the relation between biology and physics is necessary to break down obvious hurdles in (prospective) teachers’ heads and/or competencies. Otherwise, biology and physics (prospective) teachers will probably struggle with the respective other unstudied subject. Perhaps the (prospective) physics teachers need even more support regarding biology CK (Figure 5: median = 1.75–1.81) than (prospective) biology teachers regarding physics CK (Figure 7: median = 2). One approach could be the integration of overlaps between the subjects in the mandatory teacher education or voluntary certificates (e.g., [13]) to highlight the relations between both subjects. In addition, it is possible to develop educational resources that especially focuses on the connection of biological and physical aspects of a topic, e.g., optics.
  • The positive potential between chemistry and physics should be used in teacher education as well to facilitate interdisciplinary science teaching. The focus should not only be on the challenges for interdisciplinary science teaching, but also on the opportunities. The positive relation between chemistry and physics is one that should be used and further strengthened in teacher education, e.g., in curriculum development.
In sum, the present paper shows that the srCK of the different science subjects can give important insights into the deficits of current teacher education. Moreover, the paper provides possible starting points to improve teacher education regarding interdisciplinary science teaching in (lower) secondary education.

Author Contributions

Conceptualization, K.H. and S.B.; methodology, K.H. and S.B.; formal analysis, K.H.; investigation, K.H. and S.B.; data curation, K.H.; writing–original draft preparation, K.H.; writing–review & editing, S.B.; visualization, K.H.; supervision, S.B.; project administration, S.B.; funding acquisition, S.B. All authors have read and agreed to the published version of the manuscript.

Funding

This project is part of the “Qualitätsoffensive Lehrerbildung”, a joint initiative of the Federal Government and the Länder, which aims to improve the quality of teacher training. The programme is funded by the Federal Ministry of Education and Research (reference number: 01JA1917). The authors are responsible for the content of this publication. Education 12 00928 i001We acknowledge support by the Open Access Publication Funds of the Göttingen University (APC funding).

Institutional Review Board Statement

The study was conducted in accordance with all relevant requirements of the Declaration of Helsinki. Ethical review and approval were waived for this study since it is voluntary at the University of Göttingen, and we identified no critical or problematic ethical aspects in our study. We explained this in detail in the cover letter.

Informed Consent Statement

Informed consent was obtained from all subjects involved in the study.

Data Availability Statement

The data presented in this study are available in an anonymized form on request from the authors. The data are not publicly available due to the General Data Protection Regulation and the informed consent given by the participants.

Acknowledgments

We want to thank all (prospective) teachers that took part in our study, especially those who participated in each year of the longitudinal study.

Conflicts of Interest

The authors declare no conflict of interest. The funders had no role in the design of the study, in the collection, analyses, or interpretation of data, in the writing of the manuscript, or in the decision to publish the results.

References

  1. Bröll, L.; Friedrich, J. Zur Qualifikation der Lehrkräfte für den NWA-Unterricht: Eine Bestandsaufnahme in Baden-Württemberg. MNU J. 2012, 65, 180–186. [Google Scholar]
  2. Dörges, A. Erfahrungen mit dem integrierten naturwissenschaftlichen Unterricht. MNU J. 2001, 54, 230–232. [Google Scholar]
  3. Fruböse, C.; Illgen, J.; Kohm, L.; Wollscheid, R. Unterricht im integrierten Fach Naturwissenschaften: Erfahrungen aus gymnasialer Sicht. MNU J. 2011, 64, 433–439. [Google Scholar]
  4. Handtke, K.; Bögeholz, S. Self-rated content knowledge of biology, chemistry, and physics–Developing a measure and identifying challenges for interdisciplinary science teaching. RISTAL 2020, 3, 46–67. [Google Scholar]
  5. Labudde, P. Fächerübergreifender naturwissenschaftlicher Unterricht—Mythen, Definitionen, Fakten. ZfDN 2014, 20, 11–19. [Google Scholar] [CrossRef]
  6. Neumann, K.; Härtig, H.; Harms, U.; Parchmann, I. Science Teacher Preparation in Germany. In Model Science Teacher Preparation Programs: An International Comparison of What Works; Pedersen, J.E., Isozaki, T., Hirano, T., Eds.; Information Age Publishing: Charlotte, NC, USA, 2017; pp. 29–52. [Google Scholar]
  7. Baumert, J.; Kunter, M. Das Kompetenzmodell von COACTIV. In Professionelle Kompetenz von Lehrkräften: Ergebnisse des Forschungsprogramms COACTIV; Kunter, M., Baumert, J., Blum, W., Klusmann, U., Krauss, S., Neubrand, M., Eds.; Waxmann: Münster, Germany, 2011; pp. 29–53. [Google Scholar]
  8. Zell, E.; Krizan, Z. Do People Have Insight into Their Abilities? A Metasynthesis. Perspect. Psychol. Sci. 2014, 9, 111–125. [Google Scholar] [CrossRef] [Green Version]
  9. Baumert, J.; Kunter, M. The COACTIV Model of Teachers’ Professional Competence. In Cognitive Activation in the Mathematics Classroom and Professional Competence of Teachers: Results from the COACTIV Project; Kunter, M., Baumert, J., Blum, W., Klusmann, U., Krauss, S., Neubrand, M., Eds.; Mathematics teacher education 8; Springer: New York, NY, USA, 2013; pp. 25–48. [Google Scholar]
  10. Forsthuber, B.; Horvath, A.; de Almeida Coutinho, A.S.; Motiejūnaitė, A.; Baïdak, N. Science Education in Europe. National Policies, Practices and Research; Education, Audiovisual and Culture Executive Agency: Brussels, Belgium, 2011. [Google Scholar]
  11. Niedersächsisches Kultusministerium. Kerncurriculum für die Integrierte Gesamtschule Schuljahrgänge 5–10. Naturwissenschaften; Unidruck: Hannover, Germany, 2020. [Google Scholar]
  12. Niedersächsisches Kultusministerium. Kerncurriculum für das Gymnasium Schuljahrgänge 5–10. Naturwissenschaften; Unidruck: Hannover, Germany, 2015. [Google Scholar]
  13. Eggert, S.; Bögeholz, S.; Oberle, M.; Sauer, M.; Schneider, S.; Surkamp, C. Herausforderung Interdisziplinäres Unterrichten in der Lehrerbildung: Das Göttinger Zertifikatsmodell. J. Lehr. 2018, 18, 51–55. [Google Scholar]
  14. Käpylä, M.; Heikkinen, J.-P.; Asunta, T. Influence of Content Knowledge on Pedagogical Content Knowledge: The case of teaching photosynthesis and plant growth. Int. J. Sci. Educ. 2009, 31, 1395–1415. [Google Scholar] [CrossRef]
  15. Sadler, P.M.; Sonnert, G.; Coyle, H.P.; Cook-Smith, N.; Miller, J.L. The Influence of Teachers’ Knowledge on Student Learning in Middle School Physical Science Classrooms. Am. Educ. Res. J. 2013, 50, 1020–1049. [Google Scholar] [CrossRef] [Green Version]
  16. Kleickmann, T.; Tröbst, S.; Heinze, A.; Bernholt, A.; Rink, R.; Kunter, M. Teacher Knowledge Experiment: Conditions of the Development of Pedagogical Content Knowledge. In Competence Assessment in Education: Research, Models and Instruments; Softcover reprint of the original 1st edition 2017; Leutner, D., Fleischer, J., Grünkorn, J., Klieme, E., Eds.; Methodology of Educational Measurement and Assessment; Springer International Publishing: Cham, Germany, 2018; pp. 111–129. [Google Scholar]
  17. Baumert, J.; Kunter, M.; Blum, W.; Brunner, M.; Voss, T.; Jordan, A.; Klusmann, U.; Krauss, S.; Neubrand, M.; Tsai, Y.-M. Teachers’ Mathematical Knowledge, Cognitive Activation in the Classroom, and Student Progress. Am. Educ. Res. J. 2010, 47, 133–180. [Google Scholar] [CrossRef] [Green Version]
  18. Oberle, M. Politisches Wissen über die Europäische Union. Subjektive und Objektive Politikkenntnisse von Jugendlichen; Springer VS: Wiesbaden, Germany, 2012. [Google Scholar]
  19. Shavelson, R.J.; Hubner, J.J.; Stanton, G.C. Self-Concept: Validation of Construct Interpretations. Rev. Educ. Res. 1976, 46, 407–441. [Google Scholar] [CrossRef]
  20. Dickhäuser, O.; Schöne, C.; Spinath, B.; Stiensmeier-Pelster, J. Die Skalen zum akademischen Selbstkonzept: Konstruktion und Überprüfung eines neuen Instrumentes. Z. Differ. Diagn. Psychol. 2002, 23, 393–405. [Google Scholar]
  21. Neumann, K.; Kind, V.; Harms, U. Probing the amalgam: The relationship between science teachers’ content, pedagogical and pedagogical content knowledge. Int. J. Sci. Educ. 2019, 41, 847–861. [Google Scholar] [CrossRef] [Green Version]
  22. Marsh, H.W.; Craven, R.G. Reciprocal Effects of Self-Concept and Performance from a Multidimensional Perspective. Perspect. Psychol. Sci. 2006, 1, 133–163. [Google Scholar] [CrossRef]
  23. Marsh, H.W.; Martin, A.J. Academic self-concept and academic achievement: Relations and causal ordering. Br. J. Educ. Psychol. 2011, 81, 59–77. [Google Scholar] [CrossRef] [PubMed]
  24. Paulick, I.; Großschedl, J.; Harms, U.; Möller, J. Preservice Teachers’ Professional Knowledge and Its Relation to Academic Self-Concept. J. Teach. Educ. 2016, 67, 173–182. [Google Scholar] [CrossRef]
  25. Sorge, S.; Keller, M.M.; Neumann, K.; Möller, J. Investigating the relationship between pre-service physics teachers’ professional knowledge, self-concept, and interest. J. Res. Sci. Teach. 2019, 56, 937–955. [Google Scholar] [CrossRef]
  26. Jansen, M.; Schroeders, U.; Lüdtke, O.; Pant, H.A. Interdisziplinäre Beschulung und die Struktur des akademischen Selbstkonzepts in den naturwissenschaftlichen Fächern. Z. Pädagog. Psychol. 2014, 28, 43–49. [Google Scholar] [CrossRef]
  27. Hardy, G. Academic Self-Concept: Modeling and Measuring for Science. Res. Sci. Educ. 2014, 44, 549–579. [Google Scholar] [CrossRef]
  28. Yilmaz-Tuzun, O. Preservice Elementary Teachers’ Beliefs about Science Teaching. J. Sci. Teach. Educ. 2008, 19, 183–204. [Google Scholar] [CrossRef]
  29. Yangin, S.; Sidekli, S. Self-Efficacy for Science Teaching Scale Development: Construct Validation with Elementary School Teachers. J. Educ. Train. Stud. 2016, 4, 54–69. [Google Scholar] [CrossRef] [Green Version]
  30. Nixon, R.S.; Hill, K.M.; Luft, J.A. Secondary Science Teachers’ Subject Matter Knowledge Development across the First 5 Years. J. Sci. Teach. Educ. 2017, 28, 574–589. [Google Scholar] [CrossRef]
  31. Sorge, S.; Keller, M.; Petersen, S.; Neumann, K. Die Entwicklung des Professionswissen angehender Physiklehrkräfte. In Qualitätsvoller Chemie- und Physikunterricht—Normative und Empirische Dimensionen; Maurer, C., Ed.; Gesellschaft für Didaktik der Chemie und Physik, Jahrestagung in Regensburg 2017; Universität Regensburg: Regensburg, Germany, 2018; pp. 114–117. [Google Scholar]
  32. Arzi, H.J.; White, R.T. Change in Teachers’ Knowledge of Subject Matter: A 17-Year Longitudinal Study. Sci. Ed. 2008, 92, 221–251. [Google Scholar] [CrossRef]
  33. Beudels, M.M.; Damerau, K.; Preisfeld, A. Effects of an Interdisciplinary Course on Pre-Service Primary Teachers’ Content Knowledge and Academic Self-Concepts in Science and Technology: A Quantitative Longitudinal Study. Educ. Sci. 2021, 11, 744. [Google Scholar] [CrossRef]
  34. Peschel, M. SelfPro: Entwicklung von Professionsverständnissen und Selbstkonzepten angehender Lehrkräfte beim Offenen Experimentieren. In Profession und Disziplin: Grundschulpädagogik im Diskurs; Miller, S., Holler-Nowitzki, B., Kottmann, B., Lesemann, S., Letmathe-Henkel, B., Meyer, N., Schroeder, R., Velten, K., Eds.; Jahrbuch Grundschulforschung Band 22; Springer VS: Wiesbaden, Germany, 2018; pp. 191–196. [Google Scholar]
  35. Newsom, J.T. Longitudinal Structural Equation Modeling. A Comprehensive Introduction; Routledge Taylor and Francis Group: New York, NY, USA, 2015. [Google Scholar]
  36. Handtke, K.; Bögeholz, S. Arguments for Construct Validity of the Self-Efficacy Beliefs of Interdisciplinary Science Teaching (SElf-ST) Instrument. Eur. J. Educ. Res. 2020, 9, 1435–1453. [Google Scholar] [CrossRef]
  37. Handtke, K. Entwicklung von Messinstrumenten für Selbstwirksamkeitserwartungen und selbstberichtetes Fachwissen zum Unterrichten von Naturwissenschaften. Ph.D. Thesis, Georg-August-Universität Göttingen, Göttingen, Germany, 2021. [Google Scholar]
  38. Statistisches Bundesamt (Destatis). Bildung und Kultur. Studierende an Hochschulen. Wintersemester 2018/2019. Available online: https://www.destatis.de/DE/Themen/Gesellschaft-Umwelt/Bildung-Forschung-Kultur/Hochschulen/Publikationen/Downloads-Hochschulen/studierende-hochschulen-endg-2110410197004.pdf;jsessionid=2668C17F0FB411994FB9829152E97351.internet8711?__blob=publicationFile (accessed on 10 November 2022).
  39. Handtke, K.; Bögeholz, S. Self-Efficacy Beliefs of Interdisciplinary Science Teaching (SElf-ST) Instrument: Drafting a Theory-based Measurement. Educ. Sci. 2019, 9, 247. [Google Scholar] [CrossRef]
  40. Putnick, D.L.; Bornstein, M.H. Measurement Invariance Conventions and Reporting: The State of the Art and Future Directions for Psychological Research. Dev. Rev. 2016, 41, 71–90. [Google Scholar] [CrossRef] [Green Version]
  41. Little, T.D. Longitudinal Structural Equation Modeling; The Guilford Press: New York, NY, USA, 2013. [Google Scholar]
  42. Wheaton, B.; Muthén, B.; Alwin, D.F.; Summers, G.F. Assessing Reliability and Stability in Panel Models. Sociol. Methodol. 1977, 8, 84–136. [Google Scholar] [CrossRef]
  43. Chen, F.F. Sensitivity of Goodness of Fit Indexes to Lack of Measurement Invariance. Struct. Equ. Model. 2007, 14, 464–504. [Google Scholar] [CrossRef]
  44. Akaike, H. Information theory as an extension of the maximum likelihood principle. In Second International Symposium on Information Theory; Petrov, B.N., Csaki, F., Eds.; Akademiai Kiado: Budapest, Hungary, 1973; pp. 267–281. [Google Scholar]
  45. Schwarz, G. Estimating the Dimension of a Model. Ann. Statist. 1978, 6, 461–464. [Google Scholar] [CrossRef]
  46. Urban, D.; Mayerl, J. Strukturgleichungsmodellierung. Ein Ratgeber für die Praxis; Springer VS: Wiesbaden, Germany, 2014. [Google Scholar]
  47. Vandenberg, R.J.; Lance, C.E. A Review and Synthesis of the Measurement Invariance Literature: Suggestions, Practices, and Recommendations for Organizational Research. Organ. Res. Methods 2000, 3, 4–70. [Google Scholar] [CrossRef]
  48. Rosseel, Y.; Jorgensen, T.D.; Rockwood, N.; Oberski, D.; Byrnes, J.; Vanbrabant, L.; Savalei, V.; Merkle, E.; Hallquist, M.; Rhemtulla, M.; et al. Lavaan: Latent Variable Analysis. Available online: https://cran.r-project.org/web/packages/lavaan/lavaan.pdf (accessed on 27 August 2020).
  49. Wickham, H.; Chang, W.; Henry, L.; Pedersen, T.L.; Takahashi, K.; Wilke, C.; Woo, K.; Yutani, H.; Dunnington, D.; RStudio. ggplot2: Create Elegant Data Visualisations Using the Grammar of Graphics. Available online: https://cran.r-project.org/web/packages/ggplot2/ggplot2.pdf (accessed on 1 July 2021).
  50. Wickham, H.; Girlich, M.; RStudio. tidyr: Tidy Messy Data. Available online: https://cran.r-project.org/web/packages/tidyr/tidyr.pdf (accessed on 2 February 2022).
  51. Christ, O.; Schlüter, E. Strukturgleichungsmodelle mit Mplus. Eine Praktische Einführung; Oldenbourg: München, Germany, 2012. [Google Scholar]
  52. Muthén, L.K.; Muthén, B.O. Mplus User’s Guide; Muthén & Muthén: Los Angeles, CA, USA, 2017. [Google Scholar]
  53. Geiser, C. Datenanalyse mit Mplus. Eine Anwendungsorientierte Einführung; VS Verlag für Sozialwissenschaften: Wiesbaden, Germany, 2010. [Google Scholar]
  54. Steyer, R.; Eid, M.; Schwenkmezger, P. Modeling True Intraindividual Change: True Change as a Latent Variable. Methods Psychol. Res. Online 1997, 2, 21–33. [Google Scholar]
  55. Steyer, R.; Partchev, I.; Shanahan, M.J. Modeling True Intraindividual Change in Structural Equation Models: The Case of Poverty and Children’s Psychosocial Adjustment. In Modeling Longitudinal and Multilevel Data: Practical Issues, Applied Approaches, and Specific Examples; Little, T.D., Schnabel, K.U., Baumert, J., Eds.; Erlbaum: Mahwah, NJ, USA, 2000; pp. 109–126. [Google Scholar]
  56. McArdle, J.J. Dynamic but structural equation modeling of repeated measures dara. In Handbook of Multivariate Experimental Psychology; Cattell, R.B., Nesselroade, J., Eds.; Plenum Press: New York, NY, USA, 1988; pp. 561–614. [Google Scholar]
  57. McArdle, J.J.; Hamagami, F. Latent difference score structural models for linear dynamic analysis with incomplete longitudinal data. In New Methods for the Analysis of Change; Collins, L.M., Sayer, A.G., Eds.; American Psychological Association: Washington, DC, USA, 2001; pp. 137–175. [Google Scholar]
  58. Cohen, J.; Cohen, P.; West, S.G.; Aiken, L.S. Applied Multiple Regression/Correlation Analysis for the Behavioral Sciences, 3rd ed.; Lawrence Erlbaum Associates: Mahwah, NJ, USA, 2003. [Google Scholar]
  59. Cohen, J. Statistical Power Analysis for the Behavioral Sciences; Erlbaum: Hillsdale, NJ, USA, 1988. [Google Scholar]
  60. Leonhart, R. Lehrbuch Statistik. Einstieg und Vertiefung, 3rd ed.; Hans Huber: Bern, Switzerland, 2013. [Google Scholar]
  61. White, S.; Tyler, J. High School Physics Teacher Preparation: Results from the 2012–13 Nationwide Survey of High School Physics Teachers. Available online: https://www.aip.org/sites/default/files/statistics/highschool/hs-teacherprep-12.pdf (accessed on 2 December 2016).
  62. Busch, M.; Woest, V. Fächerübergreifender naturwissenschaftlicher Unterricht: Empirische Befunde zu Potenzial und Grenzen aus Lehrerperspektive. MNU J. 2016, 69, 269–277. [Google Scholar]
  63. Handtke, K.; Richter-Beuschel, L.; Bögeholz, S. Self-Efficacy Beliefs of Teaching ESD: A Theory-Driven Instrument and the Effectiveness of ESD in German Teacher Education. Sustainability 2022, 14, 6477. [Google Scholar] [CrossRef]
  64. Handtke, K. Die Zukunft der Lehrkräfteausbildung?: Was Biologie-Lehramtsstudierende über das fächerübergreifende Unterrichten von Naturwissenschaften denken. BiuZ 2022, 52, 320–322. [Google Scholar]
  65. Kelley, T.R.; Knowles, J.G.; Holland, J.D.; Han, J. Increasing High School Teachers Self-Efficacy for Integrated STEM Instruction through a Collaborative Community of Practice. Int. J. STEM Educ. 2020, 7, 14. [Google Scholar] [CrossRef] [Green Version]
  66. Aguilera, D.; Ortiz-Revilla, J. STEM vs. STEAM Education and Student Creativity: A Systematic Literature Review. Educ. Sci. 2021, 11, 331. [Google Scholar] [CrossRef]
  67. Burrows, A.; Lockwood, M.; Borowczak, M.; Janak, E.; Barber, B. Integrated STEM: Focus on Informal Education and Community Collaboration through Engineering. Educ. Sci. 2018, 8, 4. [Google Scholar] [CrossRef]
  68. Sanders, M. STEM, STEM Education, STEMmania. Technol. Teach. 2009, 68, 20–26. [Google Scholar]
Figure 1. Simplified scheme of the latent factors of the latent change model (neighbor change) exemplarily for the srCK of biology. Bio_T1/T2/T3 = Values of srCK of biology at time points 1, 2, and 3. Bio_T1_T2/T2_T3 = Values of the change in srCK of biology between time points 1 and 2 as well as 2 and 3. Further parts of the statistical model, such as manifest variables and correlations, are omitted for a better overview. This scheme was transferred to the srCK of chemistry and of physics in the same way.
Education 12 00928 g001
Figure 2. Self-rated content knowledge of biology at three different time points (n = 271) illustrated by violin plots and box plots. The violins have been scaled to the same maximum width for a better comparison of the distributions. Scale: 1 = Do not agree at all, 2 = Do rather not agree, 3 = Do rather agree, and 4 = Fully agree. Bio_T1 = time point 2019, Bio_T2 = time point 2020, and Bio_T3 = time point 2021.
Education 12 00928 g002
Figure 5. Self-rated content knowledge of biology at three different time points differentiated by the studied subjects of biology (n = 147), chemistry (n = 36), and physics (n = 42)—violin plots and box plots. The violins have been scaled to the same maximum width for a better comparison of the distributions. Scale: 1 = Do not agree at all, 2 = Do rather not agree, 3 = Do rather agree, and 4 = Fully agree. Bio_T1 = time point 2019, Bio_T2 = time point 2020, and Bio_T3 = time point 2021.
Education 12 00928 g005
Figure 6. Self-rated content knowledge of chemistry at three different time points differentiated by the studied subjects of biology (n = 147), chemistry (n = 36), and physics (n = 42)—violin plots and box plots. The violins have been scaled to the same maximum width for a better comparison of the distributions. Scale: 1 = Do not agree at all, 2 = Do rather not agree, 3 = Do rather agree, and 4 = Fully agree. Che_T1 = time point 2019, Che_T2 = time point 2020, and Che_T3 = time point 2021.
Education 12 00928 g006
Figure 7. Self-rated content knowledge of physics at three different time points differentiated by the studied subjects of biology (n = 147), chemistry (n = 36), and physics (n = 42)—violin plots and box plots. The violins have been scaled to the same maximum width for a better comparison of the distributions. Scale: 1 = Do not agree at all, 2 = Do rather not agree, 3 = Do rather agree, and 4 = Fully agree. Phy_T1 = time point 2019, Phy_T2 = time point 2020, and Phy_T3 = time point 2021.
Education 12 00928 g007
Figure 8. Development of physics and chemistry pre-service teachers’ (n = 7) self-rated content knowledge of biology before (Bio_pre) and after (Bio_post) the participation in the biology content knowledge course—spaghetti plot. The black triangles present the mean of all pre-service teachers at the respective time point. Scale: 1 = Do not agree at all, 2 = Do rather not agree, 3 = Do rather agree, and 4 = Fully agree. Since two pre-service teachers had the same development (from 2.13 to 3.25, green curve), only six curves are visible.
Education 12 00928 g008
Table 1. Characteristics of the study participants that took part in the survey at all three time points (n = 271 for each time point). Differences to 100% are due to missing values or rounding of the single values. All study participants studied at least two subjects. Only studying biology (“Biology”), for example, means that the other subject studied is not chemistry or physics. This applies accordingly to “Chemistry” or “Physics” as the subject studied.
Time Point 1
(2019)
Time Point 2
(2020)
Time Point 3
(2021)
Sex
Female62.73%63.10%62.73%
Male36.90%36.16%36.53%
Subjects studied
Biology54.24%53.51%53.51%
Chemistry13.28%13.28%13.28%
Physics15.50%15.50%15.50%
Biology and chemistry12.20%12.55%12.55%
Biology and physics2.21%2.21%2.21%
Chemistry and physics2.21%2.21%2.21%
Biology, chemistry, and physics0.37%0.74%0.74%
Phase of teacher education
Bachelor62.36%44.28%20.30%
Master of Education36.16%48.00%57.93%
Trainee teacher1.48%7.01%18.08%
In-service teacher0.00%0.74%3.69%
Table 2. Fit indices for the two measurement invariance steps of srCK of biology, of chemistry, and of physics in the same model. Guidelines for testing the next step of measurement invariance: non-significant (p > 0.05) chi-square difference test [46], ∆CFI < 0.005, ∆RMSEA < 0.01 [43], smaller values for AIC and BIC [35].
ConfiguralMetric
X2/df
(p-value)
2596.76/1614
(<0.001)
2634.07/1648
(<0.001)
X2 Difference/df
(p-value)
-33.74/34
(0.480)
Rob. CFI (∆CFI)0.946 (-)0.946 (-)
AIC27,270.0827,231.09
BIC28,048.1427,886.68
Adj. BIC27,363.2727,309.61
Rob. RMSEA
(∆RMSEA)
0.048
(-)
0.048
(-)
Table 3. Self-rated biology content knowledge: fit indices for the different measurement invariance steps. Guidelines for testing the next step of measurement invariance: non-significant (p > 0.05) chi-square difference test [46], ∆CFI < 0.005, ∆RMSEA < 0.01 [43], smaller values for AIC and BIC [35]. Values indicating non-invariance are bold.
ConfiguralMetricScalarResidual
X2/df
(p-value)
405.67/225
(<0.001)
423.51/239
(<0.001)
448.13/253
(<0.001)
465.47/269
(<0.001)
X2 Difference/df
(p-value)
-15.42/14
(0.350)
24.56/14
(0.039)
19.97/16
(0.222)
Rob. CFI (∆CFI)0.972 (-)0.972 (-)0.971 (−0.001)0.970 (−0.001)
AIC9987.049973.979970.309972.29
BIC10,343.6510,280.1510,226.0510,170.40
Adj. BIC10,029.7510,010.6410,000.939996.01
Rob. RMSEA
(∆RMSEA)
0.062
(-)
0.061
(−0.001)
0.060
(−0.001)
0.059
(−0.001)
Table 4. Self-rated chemistry content knowledge: fit indices for the different measurement invariance steps. Guidelines for testing the next step of measurement invariance: non-significant (p > 0.05) chi-square difference test [46], ∆CFI < 0.005, ∆RMSEA < 0.01 [43], smaller values for AIC and BIC [35].
ConfiguralMetricScalarResidual
X2/df
(p-value)
118.46/72
(<0.001)
128.10/80
(0.001)
139.46/88
(<0.001)
154.17/98
(<0.001)
X2 Difference/df
(p-value)
-8.18/8
(0.416)
11.00/8
(0.202)
14.67/10
(0.145)
Rob. CFI (∆CFI)0.984 (-)0.984 (-)0.983 (−0.001)0.982 (−0.001)
AIC6632.096623.396618.346615.63
BIC6859.0206821.506787.646748.91
Adj. BIC6659.276647.116638.626631.60
Rob. RMSEA
(∆RMSEA)
0.056
(-)
0.053
(−0.003)
0.052
(−0.001)
0.051
(−0.001)
Table 5. Self-rated physics content knowledge: fit indices for the different measurement invariance steps. Guidelines for testing the next step of measurement invariance: non-significant (p > 0.05) chi-square difference test [46], ∆CFI < 0.005, ∆RMSEA < 0.01 [43], smaller values for AIC and BIC [35]. Values indicating non-invariance are bold.
ConfiguralMetricScalarResidual
X2/df
(p-value)
312.04/165
(<0.001)
326.80/177
(<0.001)
345.19/189
(<0.001)
373.16/203
(<0.001)
X2 Difference/df
(p-value)
-9.92/12
(0.623)
17.89/12
(0.119)
28.24/14
(0.013)
Rob. CFI (∆CFI)0.970 (-)0.971 (+0.001)0.970 (−0.001)0.967 (−0.003)
AIC10,966.6710,949.6710,943.4510,943.83
BIC11,280.0511,219.8311,170.3811,120.33
Adj. BIC11,004.2010,982.0310,970.6210,964.97
Rob. RMSEA
(∆RMSEA)
0.062
(-)
0.060
(−0.002)
0.059
(−0.001)
0.059
(-)
Table 6. Correlations between the latent factors of self-rated content knowledge of biology, of chemistry, and of physics at time points 1, 2, and 3 (n = 271). Measurement invariance tested in Table 2. The intercorrelations at the same time point are marked gray. Bio = srCK of biology, Che = srCK of chemistry, Phy = srCK of physics, 1 = time point 1, 2 = time point 2, and 3 = time point 3.
Bio1Che1Phy1Bio2Che2Phy2Bio3Che3Phy3
Bio11.00--------
Che10.031.00-------
Phy1−0.52 **0.23 **1.00------
Bio20.89 **−0.01−0.59 **1.00-----
Che2−0.050.85 **0.15 *0.031.00----
Phy2−0.54 **0.18 *0.90 **−0.56 **0.23 **1.00---
Bio30.89 **−0.05−0.59 **0.92 **−0.06−0.58 **1.00--
Che3−0.100.83 **0.21 **−0.070.89 **0.27 **−0.081.00-
Phy3−0.52 **0.23 **0.89 **−0.57 **0.23 **0.93 **−0.57 **0.30 **1.00
* = p < 0.05, ** = p < 0.01.
Table 7. Effects of studying biology, chemistry, or physics on the starting values (time point 1) of the self-rated content knowledge of biology, of chemistry, and of physics (n = 271). srCK = self-rated content knowledge, β = standardized regression coefficient, SE = standard error, and p = p-value. Each self-rated content knowledge was calculated as an own latent change model. The table serves as an overview. Significant (p < 0.05) values are bold.
Studied SubjectsrCK of biologysrCK of chemistrysrCK of physics
β (SE)pβ (SE)pβ (SE)p
Biology0.78 (0.05)<0.001−0.07 (0.07)0.340−0.07 (0.06)0.205
Chemistry0.04 (0.04)0.2910.67 (0.05)<0.0010.21 (0.04)<0.001
Physics−0.13 (0.06)0.021−0.08 (0.08)0.3090.80 (0.04)<0.001
Table 8. Coefficients of determination (R2) of the first time point and the two change factors of each subject’s self-rated content knowledge with the studied subjects as covariates. srCK = self-rated content knowledge. The studied subjects of biology, chemistry, and physics were integrated as time-invariant covariates. The strength of the coefficients of determination is evaluated with the guidelines from Cohen [59]: small = 0.02 ≤ R2 < 0.13, middle = 0.13 ≤ R2 < 0.26, and strong = R2 ≥ 0.26.
srCK of biologysrCK of chemistrysrCK of physics
Starting value T10.730.500.71
Change T1–T20.030.030.01
Change T2–T30.010.030.01
Publisher’s Note: MDPI stays neutral with regard to jurisdictional claims in published maps and institutional affiliations.

