Systematic Review

A Reliability Generalization Meta-Analysis of “What Is Happening in This Class?” (WIHIC) Questionnaire

1
Department of Educational Psychology, Yangon University of Education, Yangon 11411, Myanmar
2
School of Education, Curtin University, Bentley, WA 6102, Australia
3
Independent Researcher, Mandalay 05011, Myanmar
*
Author to whom correspondence should be addressed.
Educ. Sci. 2022, 12(12), 929; https://doi.org/10.3390/educsci12120929
Submission received: 12 November 2022 / Revised: 5 December 2022 / Accepted: 13 December 2022 / Published: 15 December 2022
(This article belongs to the Special Issue Effects of Learning Environments on Student Outcomes)

Abstract

:
What is Happening In this Class? (WIHIC) is the widely used questionnaire to measure psycho-social aspects of the classroom and explore how these aspects affect student learning and achievement. The purpose of this study is to examine the cumulative estimates of reliability and conduct reliability generalization meta-analysis of Cronbach’s alpha for the WIHIC questionnaire. PRISMA framework is used to identify the papers in three major databases. Assuming a random-effects model, the average internal consistency reliability was 0.85, 95% CI [0.83; 0.87] for total scores and ranged from 0.80 to 0.88 for subscales. There was a substantial heterogeneity among the included articles (I2 = 99.04%, Q (23) = 1481.074, p < 0.001). According to mixed model analysis, school context has a significant effect on the total scale and subscales, including teacher support, involvement, investigation, cooperation, and equity. Overall, the reliability generalization analysis of pooling reliability estimates helps in understanding the psychometric properties of the WIHIC inventory in diverse populations.

1. Introduction

In recent years, there have been many attempts at school and curriculum reforms in education systems in every country. Educational planners increasingly recognize that success in educating the young generation depends on how well educators and policymakers understand the symbiotic relationships between student learning and social and emotional factors and learning environments [1]. As most instruction takes place in the classroom, it is crucial to examine the nature of the classroom environment, how it functions, and the dynamics involved in the process. Studies on the effects of the learning environment on student outcomes have grown in the last three decades and have been established as one of the critical aspects of educational research [2]. The researchers investigated the relationships between students’ and teachers’ perceptions of their learning environments, attitudes toward specific subjects, and cognitive outcomes in diverse, multi-cultural settings.
Since the conception of learning environments as a prodigious field of educational research, a considerable numbers of self-report instruments have been developed to measure students’ perceptions of the classroom climate [3]. Earlier attempts to conduct research in the learning environment used Learning Environment Inventory (LEI) [4], Questionnaire on Teacher Interaction (QTI) [5], and Science Laboratory Environment Inventory (SLEI) [6]. The most frequently used learning environment instrument is the What is Happening In this Class? (WIHIC), originally developed by [7]. The WIHIC combined relevant features from a wide range of existing questionnaires with additional scales that accommodate contemporary educational thinking, such as equity and constructivism. The WIHIC has 56 items that are divided equally into the seven scales. The internal consistency reliability values for each subscale are 0.81 for student cohesiveness, 0.88 for teacher support, 0.82 for involvement, 0.83 for investigation, 0.89 for task orientation, 0.67 for cooperation, and 0.81 for equity. Table 1 shows the scales in the WIHIC, along with a brief descriptor of each scale and sample items in the questionnaire.
The WIHIC questionnaire has been extensively used in all levels of education in different countries [8]. The studies have shown that the questionnaire has strong reliability and validity across various contexts. In a recent study, [9] examined the preservice teachers’ perceptions of learning environments in a public university in Texas, USA, before and after pandemic-related course disruption. The study used WIHIC to collect quantitative data from 230 teacher education students to explore changes in student perceptions of the learning environment from before to after the switch to remote learning due to the pandemic. The study found a decline in student cohesiveness, teacher support, involvement, task orientation, and equity scales.
In another study, [10] used scales from the WIHIC to measure the perceptions of nursing students on the effect of cooperative learning on academic achievement and the learning environment. The study found a significant difference between the academic achievement of students and their perception of the classroom environment in the experimental and control groups in favor of cooperative learning. [11] developed the New What Is Happening In this Class? (NWIHIC) instrument based on the WIHIC questionnaire by adding two more scales: differentiated instruction and ongoing assessment. The questionnaire was administered to 2556 grade 5 to grade 9 students in China. The study reports the grade and gender differences in the perceptions of their learning environment.
Bizimana et al. [12] investigated whether students taught biology using cooperative mastery learning had different perceptions of learning environment and engagement when compared to those taught using conventional teaching methods. The study involved 298 students, and a modified What Is Happening In this Class? (WIHIC) and Student Engagement Questionnaire (SEQ) were used to collect data. The results indicated a significant difference in the perceptions of the learning environment measured by these two instruments. The cooperative mastery learning group students were perceived as higher on all scales compared to conventional teaching methods group students. In Lithuania, Brandisauskiene et al. [13] highlighted the need for a sustainable school system to ensure the well-being of the young generation. The authors assessed the sustainable school environment variables and students’ emotional and behavioral engagement in learning with the What Is Happening in this Class? (WIHIC) questionnaire, a short form of the Learning Climate Questionnaire (LCQ), and the Student Engagement Scale. Cronbach’s alpha coefficients for each subscale are 0.915 for student cohesiveness, 0.928 for teacher support, 0.906 for cooperation, 0.931 for equity, 0.929 for learning climate, 0.892 for affective engagement, and 0.832 for behavioral engagement. Cronbach’s alpha results suggest that all subscales had an acceptable internal consistency. They found that emotional engagement and behavioral engagement correlated significantly with all WIHIC scales except task orientation. These studies illuminated that the WIHIC questionnaire can be used to examine various dimensions of a learning environment.
Therefore, many studies used the WIHIC questionnaire, reported to be a valid and reliable tool to assess students’ perception of the learning environment. To the best of our knowledge, there have been little to no studies that systematically provide an evaluation of the pool estimates of the internal consistency reliability of WIHIC. Therefore, we used the reliability generalization method, which is the application of meta-analysis in exploring the variability in the scores of reliability estimates of WIHIC. Reliability generalization is one of the methods of combining and analyzing the reliability coefficient alpha value from multiple empirical studies [14]. We also investigated the various characteristics of the studies that might affect the reliability estimates.

2. Materials and Methods

To answer the research questions, we conducted a literature review search and analysis according to the Preferred Reporting Items for Systematic Reviews and Meta-analysis (PRISMA) guidelines [15]. PRISMA is a widely used framework for reporting and synthesizing literature review following four steps: (1) identifying research literature from database searches, (2) screening articles using inclusion and exclusion criteria, (3) assessing full-text articles for eligibility, and (4) analyzing and reporting the final articles including in the review.

2.1. Data Sources and Literature Search

An initial search of the literature was conducted through three databases: ProQuest, Scopus, and Web of Science. The time frame for this review was from 1996 to May 2022, limiting to the period when Fraser et al. published the WIHIC questionnaire in 1996. The combination of keywords WIHIC and “learning environment” was used to identify the papers in every database. The detailed search strategy syntax used for each database can be seen in Table 2. Articles were included in this review if they were published in peer-reviewed journals in English. There were no restrictions regarding the design of studies: quantitative, qualitative, or mixed method.

2.2. Study Selection

The literature search identified a total of 240 articles (see Figure 1). As the purpose of the review is to verify the reliability of the WIHIC questionnaire and examine the characteristics of the studies that might affect the reliability estimates, we determined the inclusion and exclusion criteria based on PICOS (Population, Intervention, Comparison, Outcomes, and Study design) format (see Table 3). After removing the duplicates, the titles and abstracts of the articles were reviewed by the first and second authors if they met the inclusion/exclusion criteria. The last author skimmed and scanned the full papers and assessed their relevance based on the above criteria. Then, the first and second authors reviewed the outputs and finally decided the relevant articles. After applying the PICOS criteria, 84 articles remained for full-text review.

2.3. Approach to Analysis and Synthesis

The 84 full-text articles were reviewed if there was clear information about the use of WIHIC questionnaire and presented the reliability value. Papers that did not present the Cronbach’s alpha value were excluded for final analysis and synthesis. In addition, the articles were excluded if the full text of the articles were presented in another language with their abstracts in English. Following the same shortlisting and consensus-building process above, 24 articles remained for quantitative evidence synthesis.
The random-effects model was performed using a restricted maximum-likelihood method to calculate the cumulative estimates of Cronbach’s alpha and confidence intervals. The common measures for heterogeneity, including I2 and Q statistics, were reported. The publication bias was assessed by fail-safe N analysis using the Rosenthal approach. A mixed-effect model was conducted to examine the role of moderator on the overall estimate of Cronbach’s alpha. The analysis was conducted using Jamovi software (Version 2.3.13).

3. Results

We provided a summary of the 24 articles prior to presenting the answers to our research questions. This summary provides an overview of the characteristics of the reported research.

3.1. Characteristics of the Included Articles

This section presents the characteristics of the included articles, including study location; school level, research design, and the number of WIHIC sub-constructs in their studies (see Table 4).
Study location. The twenty-four studies come from thirteen different countries, with eight studies (33%) conducted in the USA, eight studies in Asia, three studies in Australia, and three in Africa. One study was reported for countries such as Turkey, Taiwan, and Australia.
School level (context). Most studies were conducted in secondary schools (83%). Two studies were conducted in primary schools (8%). Two studies were from mixed contexts (primary and secondary schools).
Research design. Eighteen studies (75%) employed a quantitative design. All quantitative studies employed a survey approach. Six studies (25%) employed mixed methods, and these employed more than the survey method, including interviews and observations.
WIHIC questionnaire. In the included studies, fifteen studies used the full version or the shortened form of the original scale. Meanwhile, nine studies used the translated version. In the translated version, the questionnaire was translated into Chinese [16,17,18], Spanish [19,20], Arabic [21], Turkish [22], Korean [23], and Indonesian [24]. In terms of the subscales, the included studies used from five to seven subscales in their studies, as the original WIHIC questionnaire included seven subscales, and the shortened version included five subscales.
Table 4. Characteristics of the included articles.
AuthorsCountryResearch DesignMethodsSchool ContextTranslated/OriginalSubscales
Adamski et al. [20]USAQuantitativeSurveyMixedTranslated (Spanish)6
Aldridge et al. [16]Taiwan and AustraliaMixed-methodSurvey, interviews, observationsSecondaryTranslated (Chinese)7
Allen and Fraser [25]USAMixed-methodSurvey, interviews, observationsMixedOriginal6
den Brok et al. [26]USAQuantitativeSurveySecondaryOriginal7
den Brok et al. [22]TurkeyQuantitativeSurveySecondaryTranslated (Turkish)7
Charalampous and Kokkinos [27] AfricaMixed-methodSurvey, interviewPrimaryOriginal7
Chionh and Fraser [28]AsiaQuantitativeSurveySecondaryOriginal7
Dorman [29] AustraliaQuantitativeSurveySecondaryOriginal7
Dorman [30]AustraliaQuantitativeSurveySecondaryOriginal7
Helding and Fraser [31]USAQuantitativeSurveySecondaryOriginal7
Khalil and Aldridge [21]AsiaQuantitativeSurveySecondaryTranslated (Arabic)5
Kim et al. [23]AsiaQuantitativeSurveySecondaryTranslated (Korean)7
Koul and Fisher [32]AsiaQuantitativeSurveySecondaryOriginal7
Lim and Fraser [33]AsiaQuantitativeSurveySecondaryOriginal6
Liu et al. [18]AsiaMixed-methodSurvey, interviews, observationsSecondaryTranslated (Chinese)5
Opolot-Okurut [34]AfricaQuantitativeSurveySecondaryOriginal5
Rita and Mar-tin-Dunlop [35]USAMixed-methodSurvey, interviewSecondaryOriginal7
Robinson and Fraser [19]USAQuantitativeSurveyPrimaryTranslated (Spanish)5
Shadreck [36]AfricaQuantitativeSurveySecondaryOriginal7
Stein and Klosterman [37]USAQuantitativeSurveySecondaryOriginal6
Taylor and Fraser [38]USAQuantitativeSurveySecondaryOriginal7
Wahyudi and Treagust [24]Asia QuantitativeSurveySecondaryTranslated (Indonesian)7
Waldrip et al. [39]Australia Mixed-methodSurvey, interviewSecondaryOriginal5
Yang [17]AsiaQuantitativeSurveySecondaryTranslated (Mandarin)7

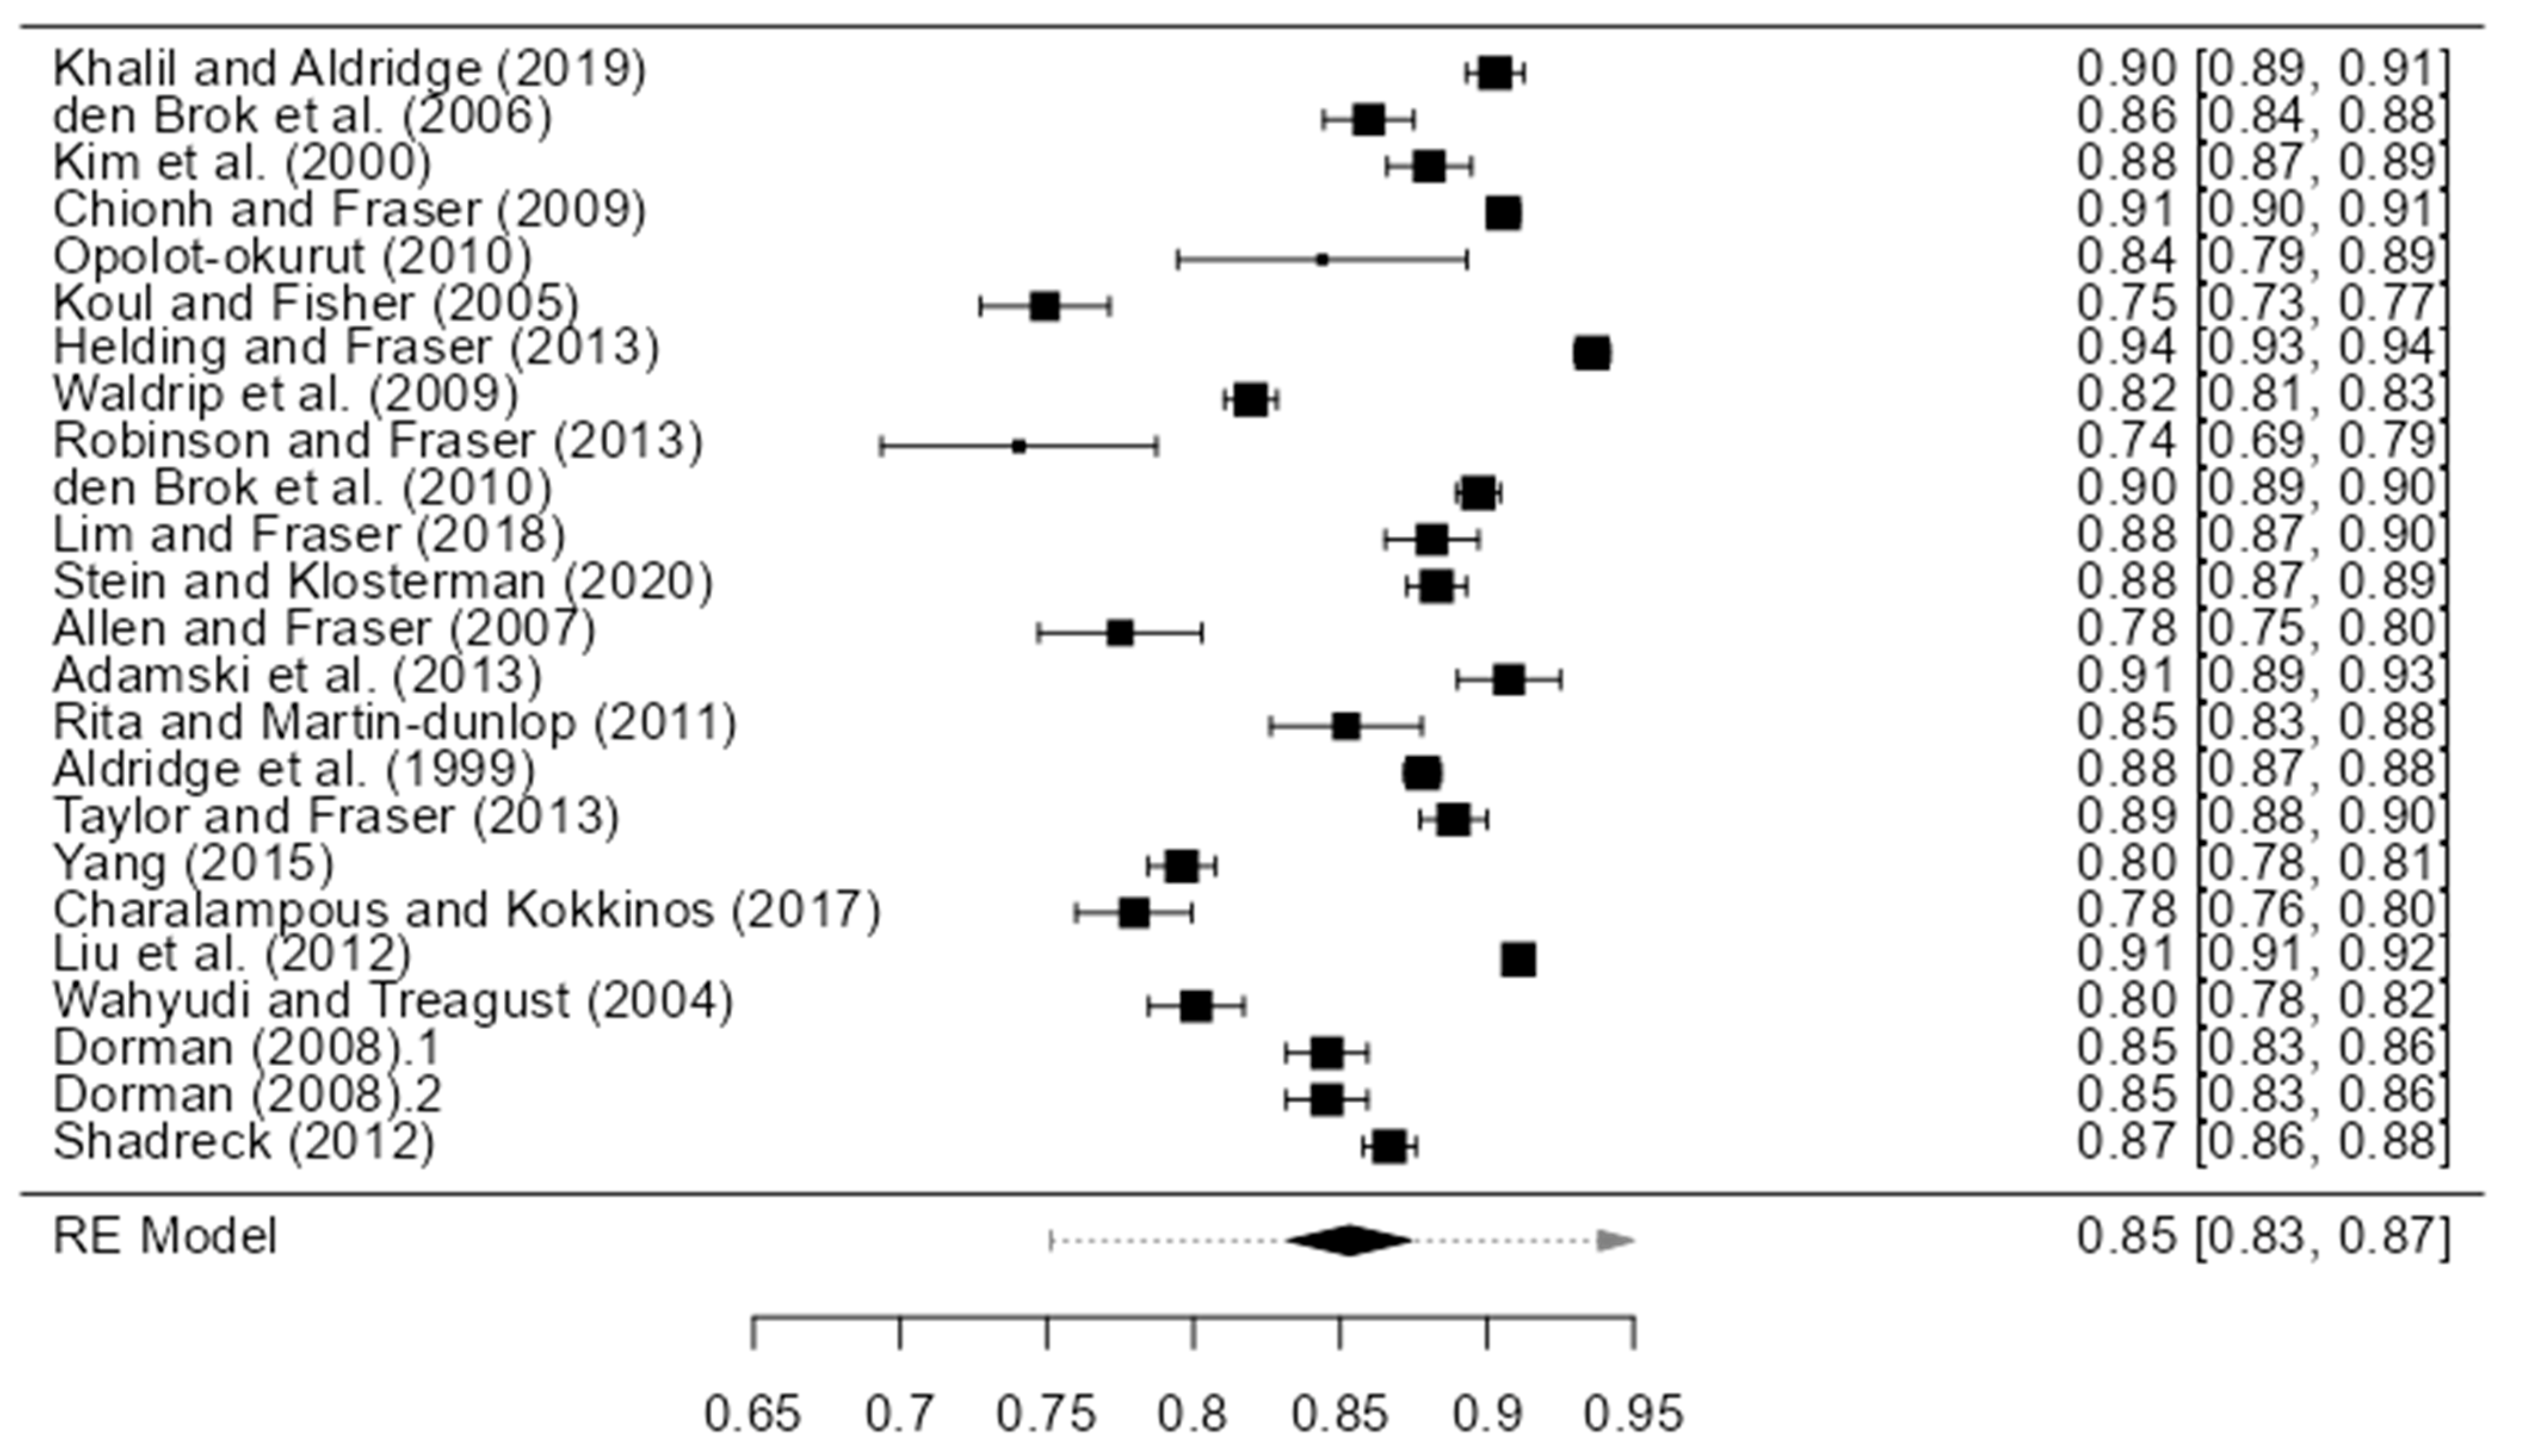
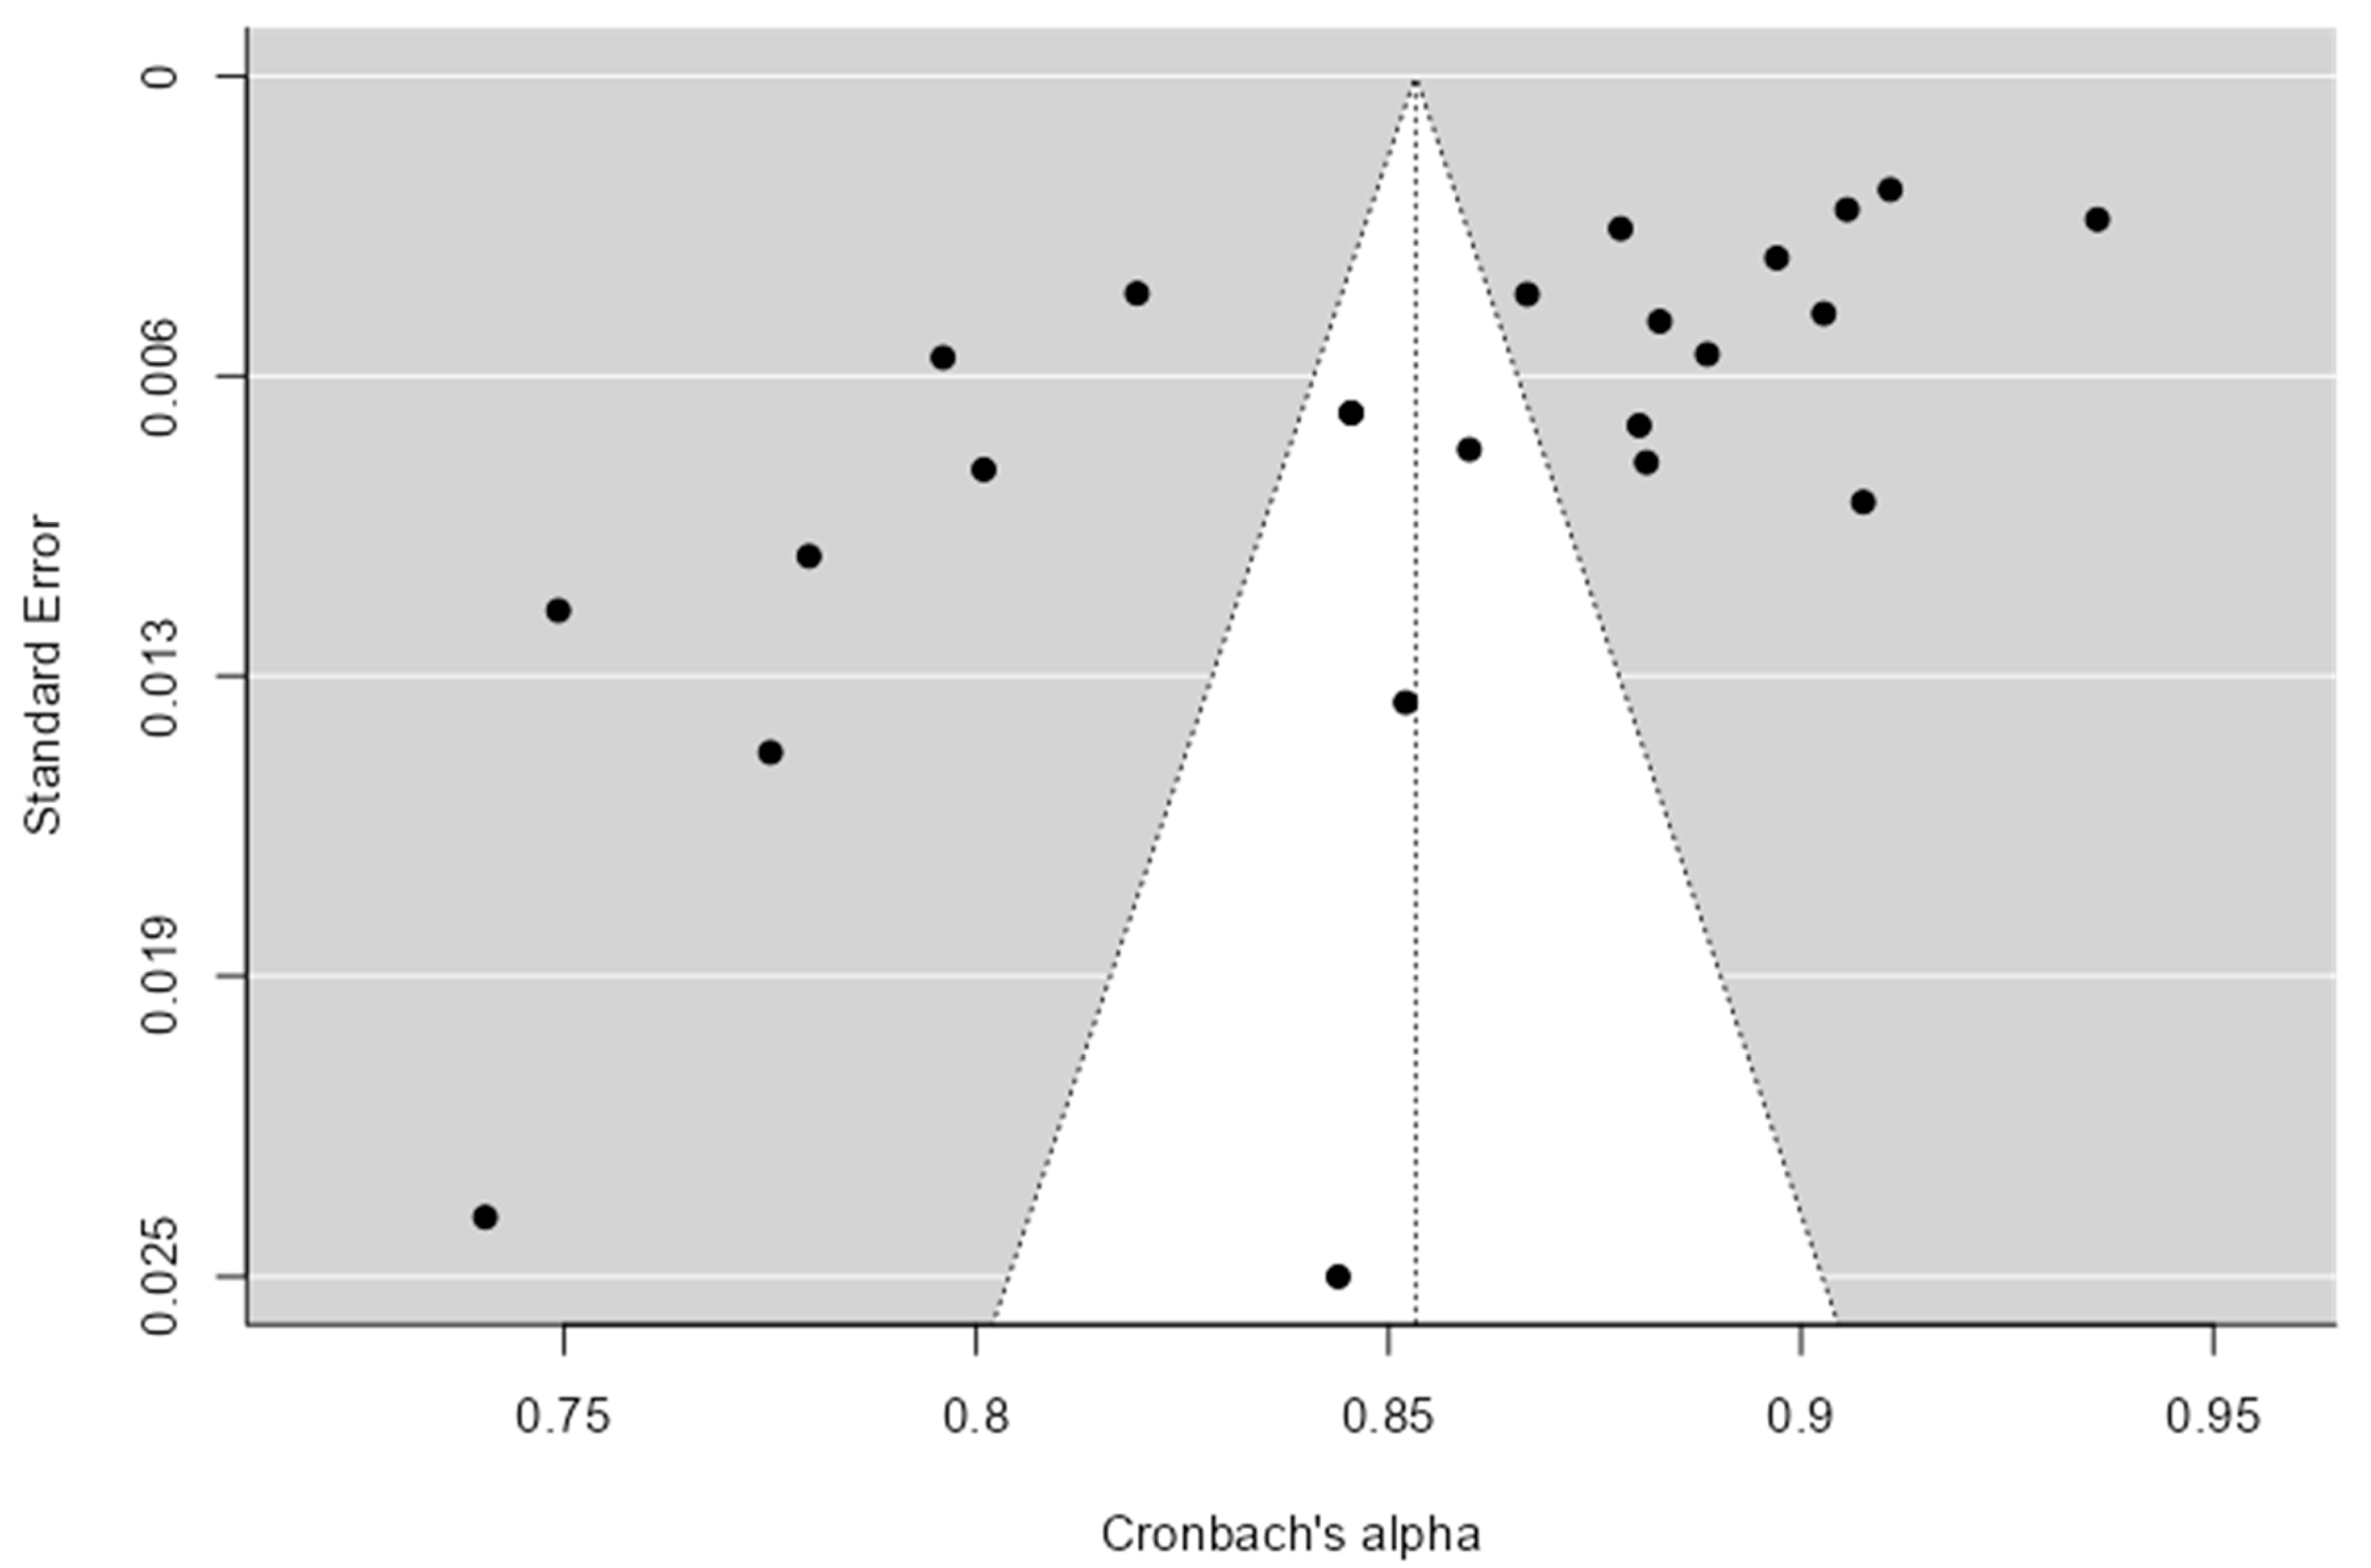
3.2. Reliability and Heterogeneity

Of the 24 eligible studies, no study reported a Cronbach’s alpha value for the overall scale. Therefore, an average alpha value was calculated by transforming each subscale alpha value into z values using Fisher’s z [40]. Then, the mean of those z values was calculated and back-transformed into Cronbach’s alpha value. The total sample size was 28,696 participants (range n = 81 to n = 3248), with M = 1196 and SD = 924. The main summary statistics for the alpha coefficients of WIHIC total scale and seven subscales can be seen in Table 5.
From the estimate of the random effects meta-analysis, the mean of total scale alpha coefficients is 0.85, 95% CI [0.83; 0.87]. Regarding student cohesiveness subscale, 22 studies totaling 28,365 participants were meta-analyzed and yielded an estimate of α = 0.80, 95% CI [0.77; 0.84]. Regarding the teacher support subscale, 23 studies containing a total of 25,827 participants were meta-analyzed and yielded an estimate of α = 0.87, 95% CI [0.85; 0.90]. Regarding the involvement subscale, 24 studies comprising 28,696 participants were meta-analyzed and yielded an estimate of α = 0.85, 95% CI [0.82; 0.87]. Regarding the investigation subscale, 16 studies comprising 19,738 participants were meta-analyzed and yielded an estimate of α = 0.86, 95% CI [0.83; 0.89]. Regarding the task orientation subscale, 22 studies comprising 27,662 participants were meta-analyzed and yielded an estimate of α = 0.82, 95% CI [0.79; 0.86]. Regarding the cooperation subscale, 22 studies containing a total of 24,928 participants were meta-analyzed and yielded an estimate of α = 0.86, 95% CI [0.84; 0.89]. Regarding the equity subscale, 22 studies totaling 23,372 participants were meta-analyzed and yielded an estimate of α = 0.88, 95% CI [0.86; 0.91]. Comparing the mean reliability coefficients of these subscales, the teacher support subscale yielded largest estimates (M = 0.87), while student cohesiveness estimated the poorest average reliability (M = 0.80).
Heterogeneity among reliability coefficients was examined by calculating the Cochran’s heterogeneity (Q) test and the heterogeneity index (I2) and constructing a forest plot. Table 5 presents high heterogeneity among the included articles (p < 0.001) and large I2 indices (>99%) for the total score and the subscales. Figure 2 presents a forest plot of alpha coefficients for WIHIC total score in each study. Therefore, it can be seen that there was a substantial heterogeneity, Q (23) = 1481.074, p < 0.001, I2 = 99.04%, τ2 = 0.0027. To address potential publication bias, a funnel plot was produced with a follow-up of the Egger’s test. Funnel plot asymmetry can be suggested by Egger’s test producing a p-value less than 0.001 (see Figure 3).

3.3. Analysis of Moderator Variables

Mixed-model analysis was conducted using year, country, research design, school context, original/translated version of the questionnaire, and number of subscales as the moderators. It would be of benefit to examine the potential impact of these demographic factors was used. Among these factors, this study found that school context has significant effect on the overall estimate (z = 2.72, p < 0.01, 95% CI [0.028; 0.173], R2 = 18.74%). No significant effect was seen with year (z = 0.026, p > 0.01, 95% CI [−0.164; 0.169], R2 = 0%), country (z = 0.596, p > 0.01, 95% CI [−0.055; 0.103], R2 = 0%), research design (z = −0.877, p > 0.01, 95% CI [−0.071; 0.027], R2 = 0%), original/translated version (z = 0.434, p > 0.01, 95% CI [−0.035; 0.054], R2 = 0%), and number of subscales (z = 0.419, p > 0.01, 95% CI [−0.058; 0.089], R2 = 0%).
Separate analyses were conducted for each of the subscales. As presented above, school context has significant effect on the total scale (p < 0.01), and significant effect was also found for the subscales including teacher support (p = 0.020), involvement (p < 0.001), cooperation (p = 0.036), equity (p < 0.001), and investigation (p = 0.006). For the research design as the moderator, the total score of the reliability estimate showed a non-significant p-value (p = 0.38), but there was statistically significant value for the equity subscale (p = 0.005). Similarly, in terms of original/translated version of the questionnaire as the moderator, although there was no significant value for the total scale (p = 0.665), a significant effect was found for the task orientation subscale (p = 0.030). It can be concluded that the reliability of the total scale and subscales excluding student cohesiveness and task orientation were influenced by school context. Furthermore, the equity subscale was influenced by research design of the included studies, and the task orientation subscale was influenced by original/translated version of the questionnaire.

4. Discussion and Conclusions

We focused on the alpha coefficient, which is a commonly reported method in indicating internal consistency of an instrument and usually varies in administration of the instrument. Reliability generalization is used in our study in order to calculate the cumulative reliability estimates of the WIHIC questionnaire and identify study characteristics associated to the variability among the reliability coefficients.
Through the analysis of 24 included studies, the RG estimate of Cronbach’s alpha for the WIHIC total score showed a high reliability value (0.85) even after accounting for potential publication bias. According to [41], the Cronbach’s alpha value is acceptable when it is >0.70. Each subscale of WIHIC also showed high reliability value, and the minimum reliability value is also greater than 0.70 [19,32]. This suggests that the questionnaire can be used with confidence in whole or in part. However, high heterogeneity was seen in our RG analysis of the alpha coefficient, so the results must be interpreted with caution.
Among the demographic factors of the studies, school context (primary, secondary, and mixed) has significant effect on the total scale and subscales including teacher support, involvement, investigation, cooperation, and equity. In our study, we limited the school context into school level, as most WIHIC studies were conducted at university level, as can be seen in the literature [8,9,10]. Further research should be undertaken to include the university level in investigating the RG analysis of WIHIC inventory. In addition, among the subscales, research design (qualitative, quantitative, and mixed method) has significant effect on the equity subscale, and original/translated version of the questionnaire has significant effect on the task orientation.
This paper has its limitations, like most research. Unpublished literature and articles published in non-English were excluded. Further studies should extend the data sources to verify the claims that have been presented. In addition, most papers did not report the Cronbach’s alpha value, and some provided only limited information. The reliability estimates of WIHIC questionnaire should be provided whenever the questionnaire is used. In general, the RG analysis of pooling reliability estimates helps in understanding the psychometric properties of the WIHIC inventory in diverse populations. The analysis also helps in understanding the source of variation across studies.

Author Contributions

Conceptualization, C.Z.O. and M.S.K.; methodology, C.Z.O. and M.S.K.; software, C.Z.O.; validation, C.Z.O., M.S.K. and N.M.H.S.; formal analysis, C.Z.O. and N.M.H.S.; writing—original draft preparation, C.Z.O. and M.S.K.; writing—review and editing, C.Z.O., M.S.K. and N.M.H.S.; supervision, M.S.K.; project administration, C.Z.O. and M.S.K. All authors have read and agreed to the published version of the manuscript.

Funding

This research received no external funding.

Institutional Review Board Statement

Not applicable.

Informed Consent Statement

Not applicable.

Data Availability Statement

Not applicable.

Conflicts of Interest

The authors declare no conflict of interest.

References

  1. Zandvliet, D.; Fraser, B. (Eds.) Thirty Years of Learning Environments: Looking Back and Looking Forward; Brill Sense: Leiden, The Netherlands, 2019. [Google Scholar]
  2. Khine, M.S.; Fraser, B.J.; Afari, E. Structural relationships between learning environments and students’ non-cognitive outcomes: Secondary analysis of PISA data. Learn. Environ. Res. 2020, 23, 395–412. [Google Scholar] [CrossRef]
  3. Cayubit, R.F.O. Why learning environment matters? An analysis on how the learning environment influences the academic motivation, learning strategies and engagement of college students. Learn. Environ. Res. 2022, 25, 581–599. [Google Scholar] [CrossRef]
  4. Walberg, H.J.; Anderson, G.J. The Achievement-Creativity Dimension and Classroom Climate*. J. Creat. Behav. 1968, 2, 281–291. [Google Scholar] [CrossRef]
  5. Khine, M.S.; Fisher, D.L. Teacher-student interactions in science classrooms. J. Classr. Interact. 2003, 38, 21–28. [Google Scholar]
  6. Fraser, B.J.; Lee, S.S.U. Science laboratory classroom environments in Korean high schools. Learn. Environ. Res. 2009, 12, 67–84. [Google Scholar] [CrossRef]
  7. Fraser, B.J.; Fisher, D.L.; McRobbie, C.J. Development, validation, and use of personal and class forms of a new classroom environment instrument. In Proceedings of the Annual Meeting of the American Educational Research Association, New York, NY, USA, 8–12 April 1996. [Google Scholar]
  8. Khine, M.S.; Fraser, B.J.; Afari, E.; Oo, Z.; Kyaw, T.T. Students’ perceptions of the learning environment in tertiary science classrooms in Myanmar. Learn. Environ. Res. 2018, 21, 135–152. [Google Scholar] [CrossRef]
  9. Long, C.S.; Sinclair, B.B.; Fraser, B.J.; Larson, T.R.; Harrell, P.E. Preservice teachers’ perceptions of learning environments before and after pandemic-related course disruption. Learn. Environ. Res. 2022, 25, 343–357. [Google Scholar] [CrossRef]
  10. Keramati, M.R.; Gillies, R.M. Perceptions of nursing students on the effect of cooperative learning on academic achievement and learning environment. Interact. Learn. Environ. 2022, 14, 1–11. [Google Scholar] [CrossRef]
  11. Cai, J.; Wen, Q.; Lombaerts, K.; Jaime, I.; Cai, L. Assessing students’ perceptions about classroom learning environments: The New What Is Happening in this Class (NWIHIC) instrument. Learn. Environ. Res. 2022, 25, 601–618. [Google Scholar] [CrossRef]
  12. Bizimana, E.; Mutangana, D.; Mwesigye, A. Students’ perceptions of the classroom learning environment and engagement in cooperative mastery learning-based biology classroom instruction. Educ. Res. Int. 2022, 2022, 1–14. [Google Scholar] [CrossRef]
  13. Brandisauskiene, A.; Buksnyte-Marmiene, L.; Cesnaviciene, J.; Daugirdiene, A.; Kemeryte-Ivanauskiene, E.; Nedzinskaite-Maciuniene, R. Sustainable school environment as a landscape for secondary school students’ engagement in learning. Sustainability 2021, 13, 11714. [Google Scholar] [CrossRef]
  14. Vacha-Haase, T. Reliability Generalization: Exploring variance in measurement error affecting score reliability across studies. Educ. Psychol. Meas. 1998, 58, 6. [Google Scholar] [CrossRef]
  15. Page, M.J.; McKenzie, J.E.; Bossuyt, P.M.; Boutron, I.; Hoffmann, T.C.; Mulrow, C.D.; Shamseer, L.; Tetzlaff, J.M.; Akl, E.A.; Brennan, S.E.; et al. The PRISMA 2020 statement: An updated guideline for reporting systematic reviews. Int. J. Surg. 2021, 88, 105906. [Google Scholar] [CrossRef] [PubMed]
  16. Aldridge, J.M.; Fraser, B.J.; Huang, T.C.I. Investigating classroom environments in Taiwan and Australia with multiple research methods. J. Educ. Res. 1999, 93, 48–62. [Google Scholar] [CrossRef]
  17. Yang, X. Rural junior secondary school students’ perceptions of classroom learning environments and their attitude and achievement in mathematics in West China. Learn. Environ. Res. 2015, 18, 249–266. [Google Scholar] [CrossRef]
  18. Liu, C.J.; Zandvliet, D.B.; Hou, I.L. The learning environment associated with information technology education in Taiwan: Combining psychosocial and physical aspects. Learn. Environ. Res. 2012, 15, 379–402. [Google Scholar] [CrossRef]
  19. Robinson, E.; Fraser, B.J. Kindergarten students’ and parents’ perceptions of science classroom environments: Achievement and attitudes. Learn. Environ. Res. 2013, 16, 151–167. [Google Scholar] [CrossRef]
  20. Adamski, A.; Fraser, B.J.; Peiro, M.M. Parental involvement in schooling, classroom environment and student outcomes. Learn. Environ. Res. 2013, 16, 315–328. [Google Scholar] [CrossRef]
  21. Khalil, N.; Aldridge, J. Assessing students’ perceptions of their learning environment in science classes in the United Arab Emirates. Learn. Environ. Res. 2019, 22, 365–386. [Google Scholar] [CrossRef]
  22. den Brok, P.; Telli, S.; Cakiroglu, J.; Taconis, R.; Tekkaya, C. Learning environment profiles of Turkish secondary biology classrooms. Learn. Environ. Res. 2010, 13, 187–204. [Google Scholar] [CrossRef] [Green Version]
  23. Kim, H.B.; Fisher, D.L.; Fraser, B.J. Classroom environment and teacher interpersonal behaviour in secondary science classes in Korea. Eval. Res. Educ. 2000, 14, 3–22. [Google Scholar] [CrossRef]
  24. Wahyudi; Treagust, D.F. The status of science classroom learning environments in Indonesian lower secondary schools. Learn. Environ. Res. 2004, 7, 43–63. [Google Scholar] [CrossRef]
  25. Allen, D.; Fraser, B.J. Parent and student perceptions of classroom learning environment and its association with student outcomes. Learn. Environ. Res. 2007, 10, 67–82. [Google Scholar] [CrossRef]
  26. den Brok, P.; Fisher, D.; Rickards, T.; Bull, E. Californian science students’ perceptions of their classroom learning environments. Educ. Res. Eval. 2006, 12, 3–25. [Google Scholar] [CrossRef]
  27. Charalampous, K.; Kokkinos, C.M. The Greek elementary “What Is Happening in this Class?” (G-EWIHIC): A three-phase multi-sample mixed-methods study. Stud. Educ. Eval. 2017, 52, 55–70. [Google Scholar] [CrossRef]
  28. Chionh, Y.H.; Fraser, B.J. Classroom environment, achievement, attitudes and self-esteem in geography and mathematics in Singapore. Int. Res. Geogr. Environ. Educ. 2009, 18, 29–44. [Google Scholar] [CrossRef]
  29. Dorman, J.P. Use of multitrait-multimethod modelling to validate actual and preferred forms of the What Is Happening in this Class? (WIHIC) questionnaire. Learn. Environ. Res. 2008, 11, 179–193. [Google Scholar] [CrossRef]
  30. Dorman, J.P. Using student perceptions to compare actual and preferred classroom environment in Queensland schools. Educ. Stud. 2008, 34, 299–308. [Google Scholar] [CrossRef]
  31. Helding, K.A.; Fraser, B.J. Effectiveness of National Board Certified (NBC) teachers in terms of classroom environment, attitudes and achievement among secondary science students. Learn. Environ. Res. 2013, 16, 1–21. [Google Scholar] [CrossRef]
  32. Koul, R.B.; Fisher, D.L. Cultural background and students’ perceptions of science classroom learning environment and teacher interpersonal behaviour in Jammu, India. Learn. Environ. Res. 2005, 8, 195–211. [Google Scholar] [CrossRef]
  33. Lim, C.T.D.; Fraser, B.J. Learning environments research in English classrooms. Learn. Environ. Res. 2018, 21, 433–449. [Google Scholar] [CrossRef]
  34. Opolot-Okurut, C. Classroom learning environment and motivation towards mathematics among secondary school students in Uganda. Learn. Environ. Res. 2010, 13, 267–277. [Google Scholar] [CrossRef]
  35. Rita, R.D.; Martin-Dunlop, C.S. Perceptions of the learning environment and associations with cognitive achievement among gifted biology students. Learn. Environ. Res. 2011, 14, 25–38. [Google Scholar] [CrossRef]
  36. Shadreck, M. Zimbabwean science students’ perceptions of their classroom learning environments and attitude towards science. Mediterr. J. Soc. Sci. 2012, 3, 415–425. [Google Scholar] [CrossRef]
  37. Stein, S.; Klosterman, P. Nature of learning environment in concurrent enrolment mathematics classrooms: A cluster analysis. Learn. Environ. Res. 2020, 23, 217–234. [Google Scholar] [CrossRef]
  38. Taylor, B.A.; Fraser, B.J. Relationships between learning environment and mathematics anxiety. Learn. Environ. Res. 2013, 16, 297–313. [Google Scholar] [CrossRef]
  39. Waldrip, B.G.; Fisher, D.L.; Dorman, J. Identifying exemplary science teachers through students’ perceptions of their learning environment. Learn. Environ. Res. 2009, 12, 1–13. [Google Scholar] [CrossRef]
  40. Crowder, J. How to Use the FISHER Function in Excel for Mac. Available online: https://turbofuture.com/computers/How-to-Use-the-FISHER-Function-in-Excel-For-Mac (accessed on 15 June 2022).
  41. George, D.; Mallery, P. Using SPSS for Windows Step by Step: A Simple Guide and Reference, 4th ed.; Pearson Education: London, UK, 2003. [Google Scholar]
Figure 1. Study Selection Flow Diagram.
Education 12 00929 g001
Figure 2. Forest plot for the reliability generalization of WIHIC.
Education 12 00929 g002
Figure 3. Funnel plot of alpha coefficient for the WIHIC scale.
Education 12 00929 g003
Table 1. Scale Description for each Scale and Example Items in the WIHIC Questionnaire.
ScaleDescriptionItem
Student CohesivenessExtent to which students are friendly and supportive of each other.I make friendships among students in this class.
Teacher SupportExtent to which the teacher helps, befriends, and is interested in students.The teacher takes a personal interest in me.
InvolvementExtent to which students have attentive interest, participate in class, and are involved with other students in assessing the viability of new ideas.I discuss ideas in class.
InvestigationExtent to which there is emphasis on the skills and of inquiry and their use in problem solving and investigation.I carry out investigations to test my ideas.
Task OrientationExtent to which it is important to complete planned activities and stay on the subject matter.Getting a certain amount of work done is important to me.
CooperationExtent to which students cooperate with each other during activities.I cooperate with other students when doing assignment work.
EquityExtent to which the teacher treats students equally, including distributing praise, question distribution, and opportunities to be included in discussions.The teacher gives as much attention to my questions as to other students’ questions.
Table 2. Search Strategy Syntax.
DatabaseSyntaxNumber of Articles
ProQuestWIHIC AND “learning environment”133
ScopusTITLE-ABS-KEY (WIHIC) AND TITLE-ABS-KEY (“learning environment”)68
Web of ScienceWIHIC (all fields) AND “Learning environment” (all fields)34
Table 3. Inclusion and Exclusion Criteria based on PICOS.
InclusionExclusion
PopulationSchool level Not university or college level
InterventionNANA
ComparisonNANA
OutcomesReported Cronbach’s alpha level: whether it is the overall alpha or alpha of the subscales for the WIHIC questionnaireNo Cronbach’s alpha value
Study DesignAll empirical papers Not review, discussion, or theoretical papers
Non-English papers
Not peer-review papers
Table 5. Mean alpha coefficients, 95% confidence intervals, and heterogeneity statistics for WIHIC total scale and the seven subscales.
Total Scale/SubscalenαLLULQI2
Total Scale240.850.830.871481.074 *99.04%
Student Cohesiveness220.800.770.844705.848 *99.58%
Teacher Support230.870.850.901920.505 *99.32%
Involvement240.850.820.871280.051 *99.1%
Investigation160.860.830.891914.472 *99.4%
Task Orientation220.820.790.864439.097 *99.55%
Cooperation220.860.840.895675.091 *99.51%
Equity220.880.860.912314.499 *99.47%
Notes. n, number of studies; LL, lower limit; UL, upper limit; Q, Cochran’s heterogeneity Q statistic; I2, heterogeneity index. * p < 0.001.
Publisher’s Note: MDPI stays neutral with regard to jurisdictional claims in published maps and institutional affiliations.

