
Experiences of Parents and Teachers with Virtual Classrooms during the COVID-19 Restrictions: A Study Focusing on Inclusive Education in Malaysia


Abstract
:1. Introduction
2. Materials and Methods
2.1. Data Collection
2.2. Data Analysis
3. Results
3.1. Demographic Background
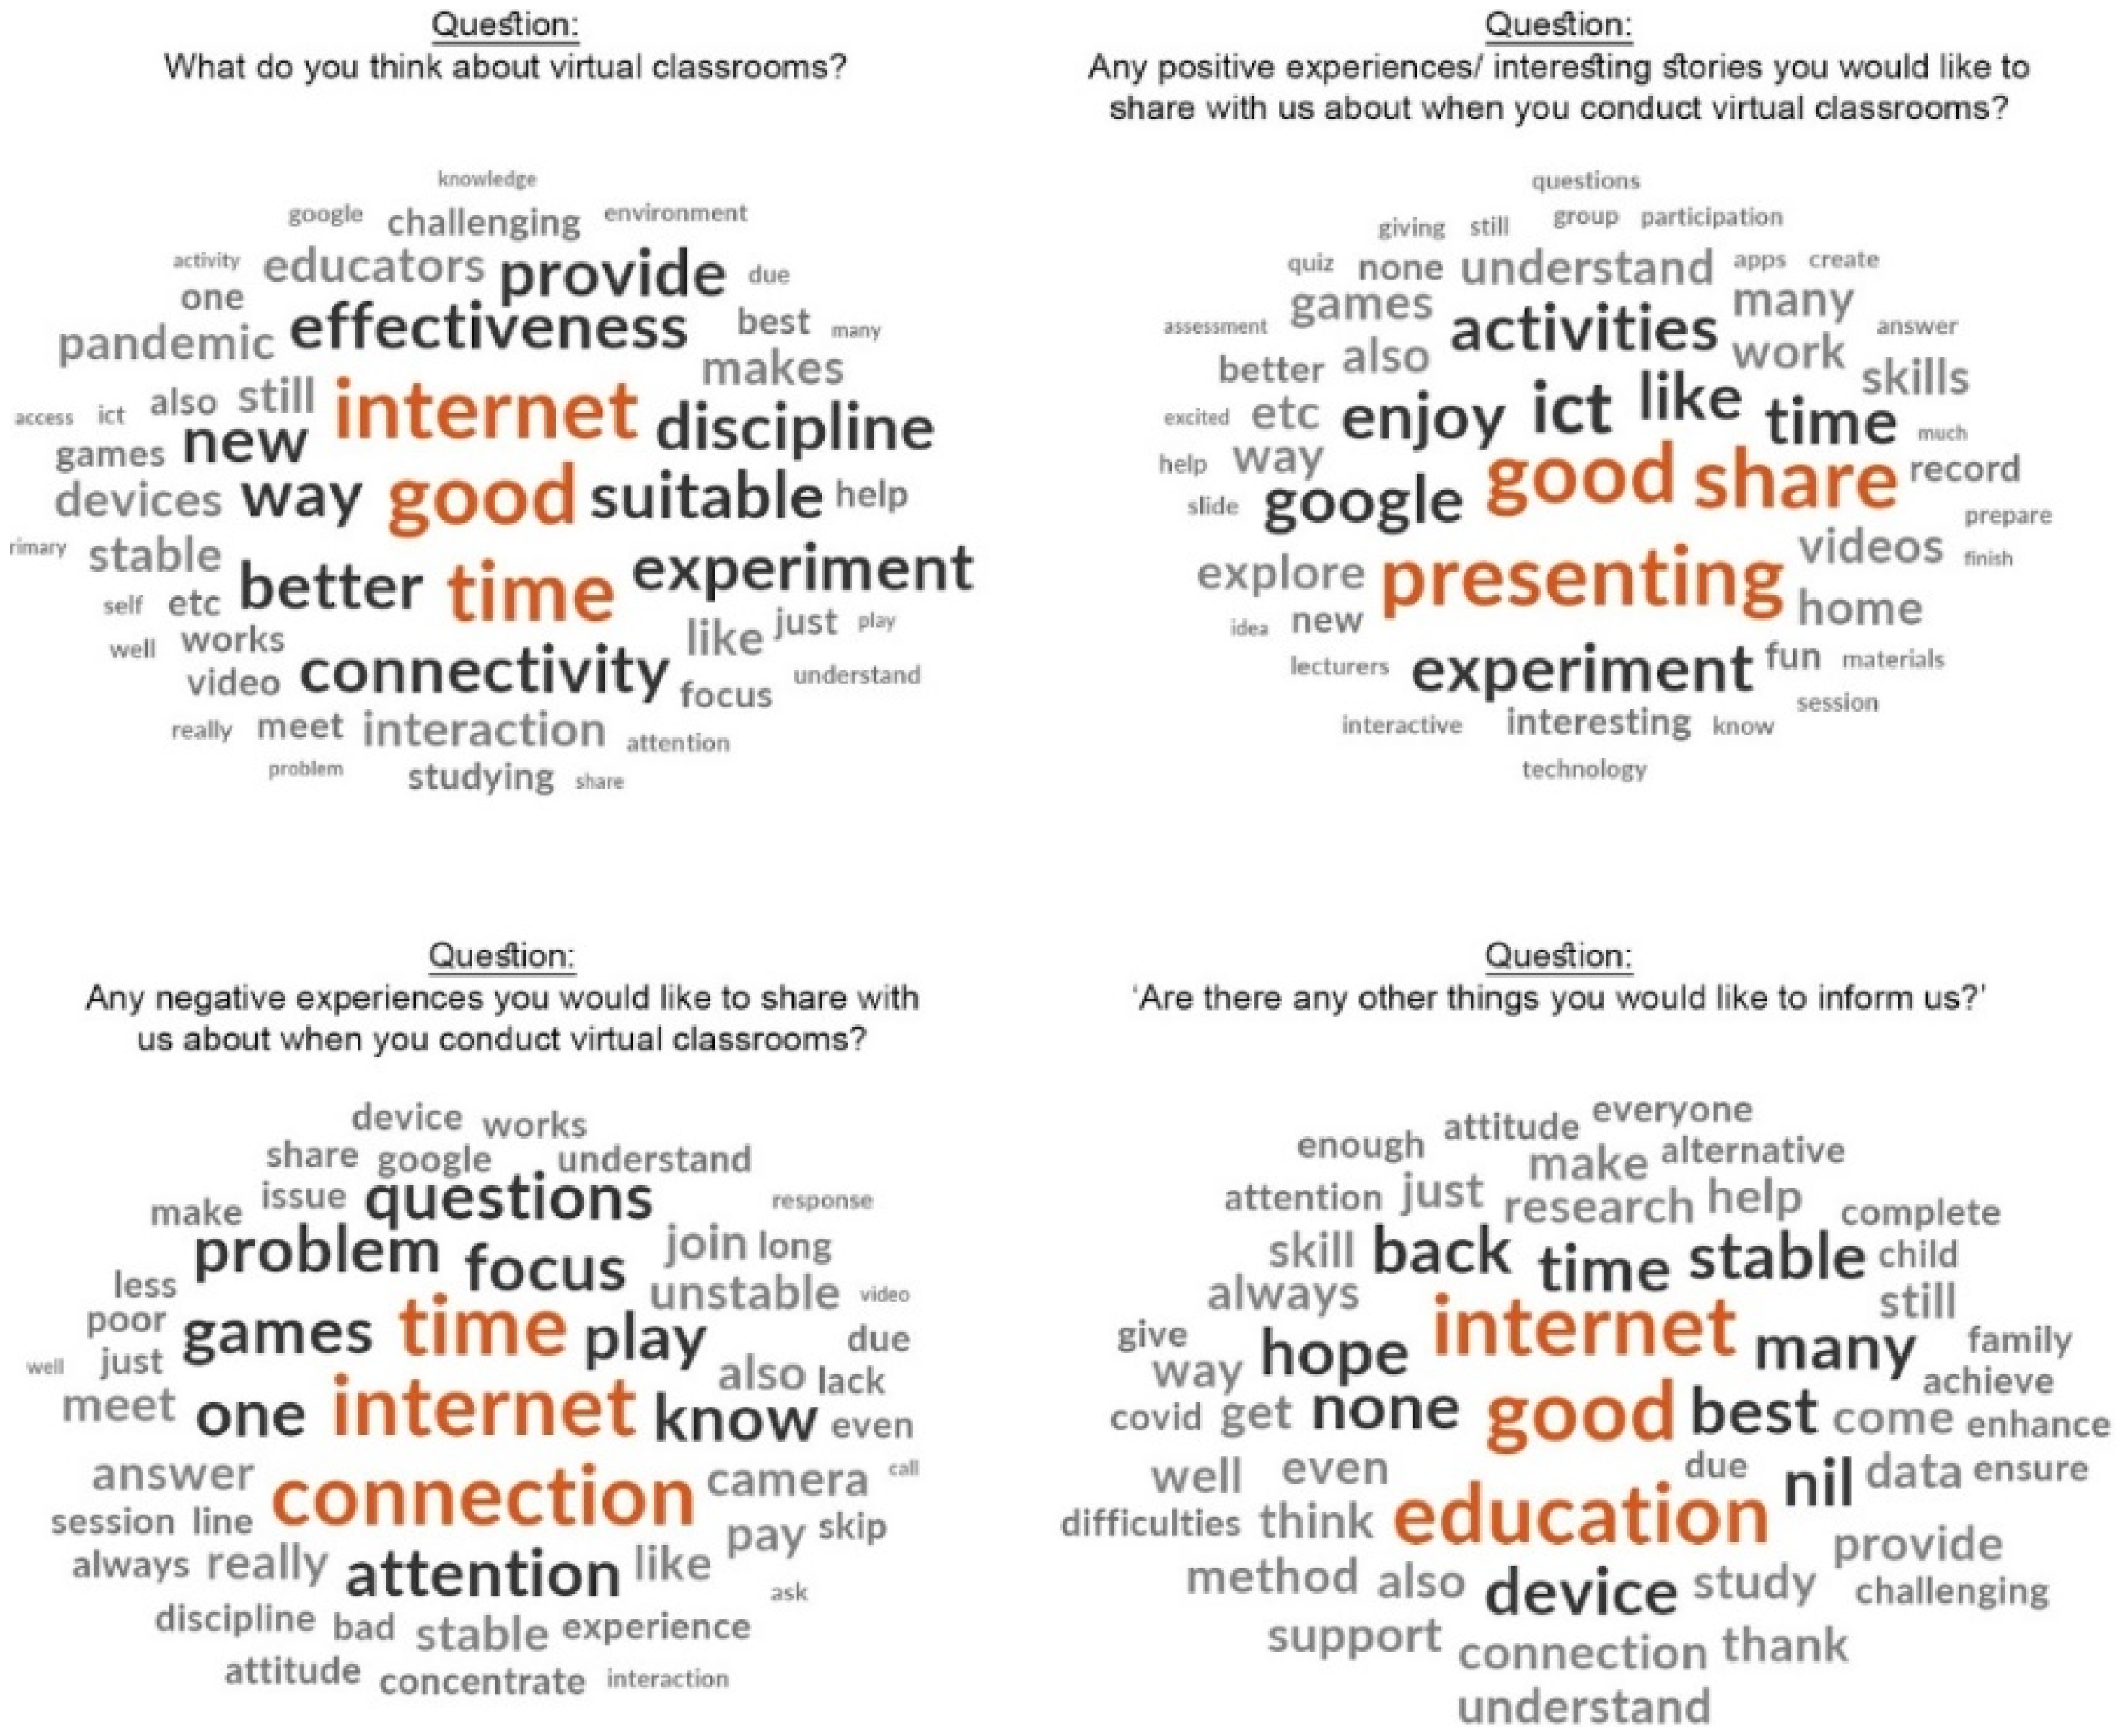
3.2. Experiences about Virtual Classrooms
3.3. Associations between Demographic Variables and Scores in Domains
4. Discussion
4.1. Stable Internet Access
4.2. ICT Competencies
4.3. The Role of Government
4.4. Demographic Background Influencing Individuals’ Readiness in Providing Inclusive Education
5. Conclusions
Author Contributions
Funding
Institutional Review Board Statement
Informed Consent Statement
Data Availability Statement
Acknowledgments
Conflicts of Interest
References
- Hodges, C.B.; Moore, S.; Lockee, B.B.; Trust, T.; Bond, M.A. The Difference between Emergency Remote Teaching and Online Learning. 2020. Available online: https://er.educause.edu/articles/2020/3/the-difference-between-emergency-remote-teaching-and-online-learning (accessed on 15 August 2022).
- Samsudin, M.A. Digital Learning Landscape in Malaysia during the COVID-19 Pandemic: The Perspective of Ecological Techno-Subsystem Theory. J. Int. Coop. Educ. 2021, 24, 131–151. [Google Scholar] [CrossRef]
- Sundarasen, S.; Chinna, K.; Kamaludin, K.; Nurunnabi, M.; Baloch, G.M.; Khoshaim, H.B.; Hossain, S.F.A.; Sukayt, A. Psychological impact of COVID-19 and lockdown among university students in Malaysia: Implications and policy recommendations. Int. J. Environ. Res. Public Health 2020, 17, 6206. [Google Scholar] [CrossRef] [PubMed]
- Ahmed, D.; Buheji, M.; Fardan, S.M. Re-emphasising the future family role in “care economy” as a result of COVID-19 pandemic spillovers. Am. J. Econ. 2020, 10, 332–338. [Google Scholar] [CrossRef]
- Kretchmar, K. ‘You just do it:’A snapshot of teaching during a pandemic. Teach. Educ. 2021, 32, 1–16. [Google Scholar] [CrossRef]
- Midcalf, L.; Boatwright, P. Teacher and Parent Perspectives of the Online Learning Environment Due to COVID-19. Delta Kappa Gamma Bull. 2020, 87, 24–34. [Google Scholar]
- Ikeda, M.; Echazarra, A. How Socio-Economics Plays into Students Learning on Their Own: Clues to COVID-19 Learning Losses; OECD-iLibrary: Berlin, Germany, 2021. [Google Scholar] [CrossRef]
- Bhamani, S.; Makhdoom, A.Z.; Bharuchi, V.; Ali, N.; Kaleem, S.; Ahmed, D. Home learning in times of COVID: Experiences of parents. J. Educ. Educ. Dev. 2020, 7, 9–26. [Google Scholar] [CrossRef]
- Zaccoletti, S.; Camacho, A.; Correia, N.; Aguiar, C.; Mason, L.; Alves, R.A.; Daniel, J.R. Parents’ perceptions of student academic motivation during the COVID-19 lockdown: A cross-country comparison. Front. Psychol. 2020, 11, 592670. [Google Scholar] [CrossRef]
- Amar-Singh, H.; Puay-Hoon, O.; Gill, R.; Srividhya, G.; Lai-Thin, N.; Yuenwah, S. Children’s learning loss: Post-COVID-19 recovery for schools. Free Malaysia Today. 2022. Available online: https://www.freemalaysiatoday.com/category/opinion/2022/05/09/childrens-learning-loss-post-covid-19-recovery-for-schools/ (accessed on 16 July 2022).
- Chan, D. Don’t relax, the pandemic isn’t over yet, cautions Health Ministry. In New Strait Times; New Strait Times: Kuala Lumpur, Malaysia, 2022. [Google Scholar]
- World Health Organization. Advice for the Public. 2022. Available online: https://www.who.int/emergencies/diseases/novel-coronavirus-2019/advice-for-public (accessed on 16 July 2022).
- UNICEF. Inclusive Education|UNICEF. Available online: https://www.unicef.org/education/inclusive-education (accessed on 1 August 2022).
- Gilligan, J. Competencies for educators in delivering digital accessibility in higher education. In Proceedings of the International Conference on Human-Computer Interaction, Copenhagen, Denmark, 19–24 July 2020; Springer: Cham, Switzerland, 2020; pp. 184–199. [Google Scholar] [CrossRef]
- Green, J.K.; Burrow, M.S.; Carvalho, L. Designing for transition: Supporting teachers and students cope with emergency remote education. Postdigital Sci. Educ. 2020, 2, 906–922. [Google Scholar] [CrossRef]
- Mahat, M. The Development of a Psychometrically-Sound Instrument to Measure Teachers’ Multidimensional Attitudes toward Inclusive Education. Int. J. Spec. Educ. 2008, 23, 82–92. [Google Scholar]
- Chua, K.H.; Bong, W.K. Providing inclusive education through virtual classrooms: A study of the experiences of secondary science teachers in Malaysia during the pandemic. Int. J. Incl. Educ. 2022, 46, 609–611. [Google Scholar] [CrossRef]
- Nunnally, J.C. Psychometric Theory, 2nd ed.; McGraw: New York, NY, USA, 1978. [Google Scholar]
- DePaolo, C.A.; Wilkinson, K. Get your head into the clouds: Using word clouds for analyzing qualitative assessment data. TechTrends 2014, 58, 38–44. [Google Scholar] [CrossRef]
- Henderson, S.; Segal, E.H. Visualizing qualitative data in evaluation research. New Dir. Eval. 2013, 2013, 53–71. [Google Scholar] [CrossRef]
- Feng, X.; Behar-Horenstein, L. Maximizing NVivo utilities to analyze open-ended responses. Qual. Rep. 2019, 24, 563–572. [Google Scholar] [CrossRef]
- Sellars, B.B.; Sherrod, D.R.; Chappel-Aiken, L. Using word clouds to analyze qualitative data in clinical settings. Nurs. Manag. 2018, 49, 51–53. [Google Scholar] [CrossRef]
- McNaught, C.; Lam, P. Using Wordle as a supplementary research tool. Qual. Rep. 2010, 15, 630–643. [Google Scholar] [CrossRef]
- Dewi, M.P.; Wajdi, M.B.N. Distance learning policy during pandemic COVID-19. EDUTEC J. Educ. Technol. 2021, 4, 325–333. [Google Scholar] [CrossRef]
- Uleanya, C.; Ezeji, I.N.; Uleanya, M.O. Inclusive Education in the Face of a Global Pandemic: Providing Support. Multicult. Educ. 2021, 7, 139–146. [Google Scholar] [CrossRef]
- Mushtaque, I.; Rizwan, M.; Dasti, R.K.; Ahmad, R.; Mushtaq, M. Students’ attitude and impact of online learning; role of teachers and classmate support during the COVID-19 crisis. Perform. Improv. 2021, 60, 20–27. [Google Scholar] [CrossRef]
- Mustapha, R.; Mahmud, M.; Burhan, N.M.; Awang, H.; Sannagy, P.B.; Jafar, M.F. An Exploration on Online Learning Challenges in Malaysian Higher Education: The Post COVID-19 Pandemic Outbreak. Int. J. Adv. Comput. Sci. Appl. 2021, 12, 1–8. [Google Scholar] [CrossRef]
- Azlan, C.A.; Wong, J.H.D.; Tan, L.K.; Huri, M.S.N.A.; Ung, N.M.; Pallath, V.; Tan, C.P.L.; Yeong, C.H.; Ng, K.H. Teaching and learning of postgraduate medical physics using Internet-based e-learning during the COVID-19 pandemic–A case study from Malaysia. Phys. Med. 2020, 80, 10–16. [Google Scholar] [CrossRef]
- Khairi, M.A.M.; Faridah, I.; Norsiah, H.; Zaki, M. Preliminary study on readiness to teach online due to Covid-19 pandemic among university academician in Malaysia. Int. J. Inf. Educ. Technol. 2021, 11, 212–219. [Google Scholar] [CrossRef]
- Nik-Ahmad-Zuky, N.L.; Baharuddin, K.A.; Rahim, A.A. Online clinical teaching and learning for medical undergraduates during the COVID-19 pandemic: The Universiti Sains Malaysia (USM) experience. Educ. Med. J. 2020, 12, 75–80. [Google Scholar] [CrossRef]
- Lie, A.; Tamah, S.M.; Gozali, I.; Triwidayati, K.R.; Utami, T.S.D.; Jemadi, F. Secondary school language teachers’ online learning engagement during the COVID-19 pandemic in Indonesia. J. Inf. Technol. Educ. Res. 2020, 19, 803–832. [Google Scholar] [CrossRef]
- Mailizar, A.; Abdulsalam, M.; Suci, B. Secondary school mathematics teachers’ views on e-learning implementation barriers during the COVID-19 pandemic: The case of Indonesia. Eurasia J. Math. Sci. Technol. Educ. 2020, 16, em1860. [Google Scholar] [CrossRef]
- Tay, L.Y.; Lee, S.-S.; Ramachandran, K. Implementation of online home-based learning and students’ engagement during the COVID-19 pandemic: A case study of Singapore mathematics teachers. Asia-Pac. Educ. Res. 2021, 30, 299–310. [Google Scholar] [CrossRef]
- Yew, K.K.W.; Tan, K.H. ESL Teachers’ Intention in Adopting Online Educational Technologies during COVID-19 Pandemic. J. Educ. E-Learn. Res. 2020, 7, 387–394. [Google Scholar] [CrossRef]
- Alhat, S. Virtual Classroom: A Future of Education Post-COVID-19. Shanlax Int. J. Educ. 2020, 8, 101–104. [Google Scholar] [CrossRef]
- Rulandari, N. The impact of the COVID-19 pandemic on the world of education in Indonesia. Ilomata Int. J. Soc. Sci. 2020, 1, 242–250. [Google Scholar] [CrossRef]
- Izhar, N.A.; Al-Dheleai, Y.M.; Ishak, N.A. Education continuation strategies during COVID-19 in Malaysia. Int. J. Acad. Res. Bus. Soc. Sci. 2021, 11, 1423–1436. [Google Scholar] [CrossRef]
- Hashim, N.A.; Shaari, N.D. Malaysian Teachers’ Perception and Challenges towards The Implementation of Flipped Learning Approach. Asian People J. (APJ) 2020, 3, 62–76. [Google Scholar] [CrossRef]
- Mishra, P.; Koehler, M.J. Technological pedagogical content knowledge: A framework for teacher knowledge. Teach. Coll. Rec. 2006, 108, 1017–1054. [Google Scholar] [CrossRef]
- Ramos-Pla, A.; del Arco, I.; Flores Alarcia, Ò. University professor training in times of COVID-19: Analysis of training programs and perception of impact on teaching practices. Educ. Sci. 2021, 11, 684. [Google Scholar] [CrossRef]
- Assi, E.; Rashtchi, M. Virtual classes during COVID-19 pandemic: Focus on university students’ affection, perceptions, and problems in the light of resiliency and self-image. Asian-Pac. J. Second Foreign Lang. Educ. 2022, 7, 17. [Google Scholar] [CrossRef]
- Yong, K.; Zaid, N.M.; Wahid, N.A.; Ashari, Z.M.; Suhairom, N.; Said, M.M. Challenges in Emergency Remote Teaching Among Malaysian Public Elementary School Teachers. Int. J. Emerg. Technol. Learn. 2021, 16, 74–90. [Google Scholar] [CrossRef]
- Hafifah, G.N.; Sulistyo, G.H. Teachers’ ICT Literacy And ICT Integration in ELT in the Indonesian Higher Education Setting. Turk. Online J. Distance Educ. 2020, 21, 186–198. [Google Scholar] [CrossRef]
- Zubković, B.R. Predictors of ICT use in teaching in different educational domains. Eur. J. Soc. Sci. Ed. Res. 2017, 4, 145–154. [Google Scholar] [CrossRef] [Green Version]
- Das, K. Role of ICT for Better Mathematics Teaching. Shanlax Int. J. Educ. 2019, 7, 19–28. [Google Scholar] [CrossRef]
- Cussó-Calabuig, R.; Farran, X.C.; Bosch-Capblanch, X. Effects of intensive use of computers in secondary school on gender differences in attitudes towards ICT: A systematic review. Educ. Inf. Technol. 2018, 23, 2111–2139. [Google Scholar] [CrossRef]
- Hatlevik, O.E.; Throndsen, I.; Loi, M.; Gudmundsdottir, G.B. Students’ ICT self-efficacy and computer and information literacy: Determinants and relationships. Comput. Educ. 2018, 118, 107–119. [Google Scholar] [CrossRef]
- Gómez-García, M.; Hossein-Mohand, H.; Trujillo-Torres, J.M.; Hossein-Mohand, H. The training and use of ICT in teaching perceptions of Melilla’s (Spain) mathematics teachers. Mathematics 2020, 8, 1641. [Google Scholar] [CrossRef]
- Sánchez Prieto, J.S.; Torres, J.M.T.; García, M.G.; García, G.G. Gender and digital teaching competence in dual vocational education and training. Educ. Sci. 2020, 10, 84. [Google Scholar] [CrossRef] [Green Version]
- Opoku, M.; Cuskelly, M.; Rayner, C.; Pedersen, S. The impact of teacher attributes on intentions to practice inclusive education in secondary schools in Ghana. Int. J. Disabil. Dev. Educ. 2022, 69, 382–398. [Google Scholar] [CrossRef]


| Domain (What to Measure) | Statements |
|---|---|
| Affective: Attitudes of parents and teachers concerning the inclusiveness of education in virtual classrooms |
|
| Behavior: Parents and teachers’ perception of teachers’ behavior towards providing an inclusive learning environment in virtual classrooms |
|
| Cognition: Parents and teachers’ perception of students’ experience attending virtual classrooms concerning inclusiveness |
|
| Competence: Parents and teachers’ digital skills in providing inclusive education |
|
| Awareness: Parents and teachers’ consciousness in providing inclusive education |
|
| Teacher Only | Parent Only | Both Teacher and Parent (T&P) | Total | |
|---|---|---|---|---|
| Age | ||||
| Below 30 | 42 | 4 | 3 | 49 |
| 31–40 | 63 | 45 | 51 | 159 |
| 41–50 | 15 | 59 | 40 | 114 |
| 51–60 | 20 | 16 | 18 | 54 |
| Above 60 | 0 | 1 | 2 | 3 |
| Total | 140 | 125 | 114 | 379 |
| Gender | ||||
| Male | 50 | 43 | 26 | 119 |
| Female | 88 | 81 | 87 | 256 |
| Prefer not to say | 2 | 1 | 1 | 4 |
| Total | 140 | 125 | 114 | 379 |
| Education | ||||
| No schooling completed | 0 | 1 | 0 | 1 |
| Primary school | 1 | 3 | 3 | 7 |
| Secondary school | 5 | 28 | 2 | 35 |
| Trade/technical/vocational training | 1 | 6 | 4 | 11 |
| Bachelor’s degree | 81 | 48 | 64 | 193 |
| Master’s degree or higher | 51 | 39 | 41 | 161 |
| Prefer not to say | 1 | 0 | 0 | 1 |
| Total | 140 | 125 | 114 | 379 |
| Area living in | ||||
| Urban | 87 | 79 | 76 | 242 |
| Suburban | 44 | 38 | 26 | 108 |
| Rural | 9 | 8 | 12 | 29 |
| Total | 140 | 125 | 114 | 379 |
| ICT skills | ||||
| 1 | 0 | 2 | 0 | 2 |
| 2 | 0 | 0 | 0 | 0 |
| 3 | 0 | 1 | 2 | 3 |
| 4 | 3 | 2 | 4 | 9 |
| 5 | 18 | 15 | 13 | 46 |
| 6 | 15 | 19 | 22 | 56 |
| 7 | 41 | 32 | 28 | 101 |
| 8 | 44 | 26 | 31 | 101 |
| 9 | 15 | 17 | 13 | 45 |
| 10 | 4 | 11 | 1 | 16 |
| Total | 140 | 125 | 114 | 379 |
| Number of Child/Children Attending | 0 | 1 | 2 | 3 | 4 | 5 and Above |
|---|---|---|---|---|---|---|
| Kindergarten | 140 | 74 | 20 | 3 | 2 | 0 |
| Primary school | 86 | 92 | 54 | 5 | 1 | 1 |
| Secondary school | 138 | 65 | 27 | 7 | 1 | 1 |
| Higher education (college, university, matriculation, etc.) | 187 | 29 | 17 | 4 | 0 | 2 |
| Demographic Variable | Category | Variable Value | Mean (M) and Standard Deviation (SD) | |||||
|---|---|---|---|---|---|---|---|---|
| Affective | Behavioral | Cognitive | Competency | Awareness | Overall | |||
| Gender | T&P | Male | 5.07 * | 4.98 | 4.31 | 5.45 | 5.90 * | 5.14 |
| (0.97) | (1.37) | (1.25) | (1.04) | (0.80) | (0.79) | |||
| Female | 3.98 | 5.33 | 4.09 | 5.59 | 5.16 | 4.81 | ||
| (1.08) | (1.14) | (1.09) | (0.93) | (1.41) | (0.84) | |||
| Teacher | Male | 4.48 | 5.06 | 3.88 | 5.01 | 5.77 | 4.83 | |
| (1.33) | (1.55) | (1.14) | (1.42) | (1.13) | (1.07) | |||
| Female | 4.38 | 5.66 * | 4.17 | 5.71 * | 5.53 | 5.08 | ||
| (0.98) | (1.09) | (1.02) | (0.92) | (1.12) | (0.76) | |||
| Parent | Male | 4.52 * | 4.67 | 3.81 | 3.93 | 5.12 * | 4.41 | |
| (1.12) | (1.20) | (1.18) | (1.87) | (1.65) | (1.03) | |||
| Female | 4.00 | 4.82 | 3.69 | 4.03 | 4.46 | 4.20 | ||
| (1.12) | (1.08) | (1.28) | (1.55) | (1.63) | (0.94) | |||
| Age | T&P | ≤40 | 4.13 | 5.66 * | 4.14 | 5.88 * | 5.96 * | 5.08 |
| (1.12) | (0.83) | (1.10) | (0.83) | (0.76) | (0.68) | |||
| >40 | 4.60 * | 5.23 | 4.38 | 5.56 | 5.46 | 5.03 | ||
| (1.04) | (1.16) | (1.07) | (0.86) | (1.28) | (0.72) | |||
| Teacher | ≤40 | 4.41 | 5.76 | 4.05 | 5.51 | 5.92 * | 5.11 | |
| (1.15) | (0.95) | (1.08) | (1.23) | (0.84) | (0.75) | |||
| >40 | 4.93 * | 5.51 | 4.71 * | 5.55 | 5.50 | 5.24 | ||
| (0.82) | (1.21) | (0.99) | (0.97) | (1.06) | (0.73) | |||
| Parent | ≤40 | 3.98 | 4.85 | 3.45 | 3.78 | 4.28 | 4.14 | |
| (1.29) | (1.02) | (1.43) | (1.66) | (1.51) | (0.93) | |||
| >40 | 4.56 * | 4.89 | 4.21 * | 4.39 * | 5.06 * | 4.62 * | ||
| (1.06) | (0.93) | (1.15) | (1.56) | (1.43) | (0.73) | |||
| Academic Qualification | T&P | Bachelor and below | 4.65 | 4.94 | 4.09 | 5.18 | 5.30 | 4.84 |
| (1.14) | (1.30) | (1.22) | (1.23) | (1.25) | (1.05) | |||
| Master and above | 4.81 | 5.63 * | 4.32 | 5.80 * | 5.82 * | 5.27 | ||
| (1.10) | (1.05) | (1.00) | (0.90) | (1.18) | (0.60) | |||
| Teacher | Bachelor and below | 5.02 * | 5.39 | 4.04 | 5.39 | 5.75 | 5.13 | |
| (1.09) | (1.26) | (1.04) | (1.09) | (1.06) | (0.83) | |||
| Master and above | 4.58 | 6.11 * | 4.48 * | 5.92 * | 5.47 | 5.31 | ||
| (1.11) | (0.88) | (1.16) | (0.94) | (1.32) | (0.76) | |||
| Parent | Bachelor and below | 4.40 | 4.47 | 3.56 | 3.66 | 4.50 | 4.14 | |
| (1.04) | (1.23) | (1.33) | (1.61) | (1.65) | (0.95) | |||
| Master and above | 5.27 * | 5.29 * | 4.28 * | 4.53 * | 5.92 * | 5.06 | ||
| (0.92) | (1.16) | (0.98) | (1.89) | (3.26) | (1.00) | |||
| Residential Area | T&P | Urban | 4.59 | 5.59 * | 4.21 | 5.12 | 5.31 | 4.96 |
| (1.31) | (1.08) | (1.17) | (1.31) | (1.34) | (0.99) | |||
| Rural | 5.14 * | 5.01 | 4.14 | 5.63 * | 5.84 * | 5.16 | ||
| (1.02) | (1.32) | (1.17) | (0.94) | (1.08) | (0.71) | |||
| Teacher | Urban | 5.28 * | 5.43 | 4.00 | 5.27 | 5.50 | 5.13 | |
| (1.05) | (1.40) | (1.05) | (1.34) | (1.40) | (0.99) | |||
| Rural | 4.65 | 5.89 * | 4.46 * | 5.69 | 5.48 | 5.23 | ||
| (1.04) | (1.01) | (1.18) | (1.07) | (1.13) | (0.77) | |||
| Parent | Urban | 4.35 | 4.37 | 3.60 | 3.83 | 4.44 | 4.14 | |
| (1.39) | (1.36) | (1.36) | (1.66) | (1.64) | (1.21) | |||
| Rural | 4.84 * | 5.02 * | 4.20 * | 3.84 | 5.24 * | 4.63 | ||
| (1.10) | (1.08) | (1.27) | (1.71) | (1.30) | (0.92) | |||
| School Location | T&P | Urban | 4.57 | 5.01 | 3.93 | 5.13 | 5.35 | 4.80 |
| (1.30) | (1.42) | (1.26) | (1.38) | (1.44) | (1.16) | |||
| Rural | 5.06 * | 5.10 | 4.64 * | 5.58 * | 5.38 | 5.16 | ||
| (0.99) | (1.27) | (1.10) | (0.97) | (1.24) | (0.87) | |||
| Teacher | Urban | 5.21 * | 5.74 | 4.77 * | 5.81 * | 5.91 * | 5.49 | |
| (1.12) | (1.14) | (0.96) | (1.06) | (1.05) | (0.90) | |||
| Rural | 4.61 | 5.42 | 4.10 | 5.38 | 5.43 | 4.99 | ||
| (1.05) | (1.28) | (1.11) | (1.14) | (1.17) | (0.89) | |||
| School Type | T&P | Public | 5.11 * | 5.33 | 4.63 * | 5.23 | 5.38 | 5.15 |
| (0.95) | (1.18) | (1.12) | (1.19) | (1.29) | (0.92) | |||
| Private | 4.50 | 4.98 | 3.96 | 6.00 * | 6.01 * | 5.07 | ||
| (1.11) | (1.37) | (0.96) | (0.83) | (1.06) | (0.79) | |||
| Teacher | Public | 4.83 * | 5.51 | 4.23 | 5.55 * | 5.68 * | 5.16 | |
| (1.09) | (1.20) | (0.98) | (1.13) | (1.10) | (0.89) | |||
| Private | 4.44 | 5.24 | 3.87 | 5.02 | 5.14 | 4.75 | ||
| (1.18) | (1.51) | (1.18) | (1.28) | (1.39) | (1.04) | |||
| Subject Taught | T&P | Science and Mathematics | 5.44 * | 5.04 | 4.14 | 5.68 * | 5.91 * | 5.27 |
| (0.92) | (1.17) | (1.09) | (1.03) | (0.95) | (0.78) | |||
| Art and Humanities | 4.59 | 5.85 * | 4.18 | 5.15 | 5.26 | 5.01 | ||
| (1.23) | (1.00) | (1.29) | (1.42) | (1.60) | (1.10) | |||
| Teacher | Science and Mathematics | 5.20 * | 5.84 * | 4.84 * | 5.71 | 5.90 * | 5.50 | |
| (0.83) | (0.94) | (0.87) | (0.97) | (0.96) | (0.70) | |||
| Art and Humanities | 4.48 | 5.26 | 3.92 | 5.34 | 5.33 | 4.87 | ||
| (1.22) | (1.50) | (1.12) | (1.28) | (1.35) | (1.06) | |||
| Domain | ≤10 Years | 11–20 Years | >20 Years | F | ||||||||||
|---|---|---|---|---|---|---|---|---|---|---|---|---|---|---|
| T&P | Teacher | T&P | Teacher | T&P | Teacher | T&P | Teacher | |||||||
| M | SD | M | SD | M | SD | M | SD | M | SD | M | SD | F (2111) | F (2137) | |
| Affective | 4.27 | 1.40 | 4.67 | 1.17 | 5.23 | 0.88 | 4.60 | 1.17 | 5.11 | 0.91 | 5.55 | 0.79 | 7.65 * | 7.26 * |
| Behavior | 4.88 | 1.62 | 5.42 | 1.35 | 5.45 | 1.06 | 6.06 | 0.93 | 5.56 | 1.08 | 5.42 | 1.15 | 2.49 | 3.55 * |
| Cognitive | 3.87 | 1.15 | 4.00 | 1.05 | 4.89 | 0.85 | 4.18 | 1.16 | 4.91 | 1.06 | 4.30 | 0.97 | 10.15 * | 0.93 |
| Competency | 5.26 | 1.51 | 5.32 | 1.25 | 5.68 | 0.96 | 5.34 | 1.26 | 5.19 | 1.03 | 6.31 | 0.64 | 6.48 * | 7.88 * |
| Awareness | 5.30 | 1.56 | 5.84 | 1.21 | 6.10 | 0.90 | 4.71 | 1.04 | 5.25 | 1.52 | 4.80 | 0.92 | 6.03 * | 16.43 * |
| Domain | <10 Years | 11–20 Years | >20 Years | |||||||||
|---|---|---|---|---|---|---|---|---|---|---|---|---|
| T&P | Teacher | T&P | Teacher | T&P | Teacher | |||||||
| 11–20 | >20 | 10–20 | >20 | <10 | >20 | <10 | >20 | <10 | 11–20 | <10 | 11–20 | |
| Affective | −0.96 * | −0.84 * | 0.06 | −0.88 * | 0.96 * | 0.12 | −0.06 | −0.95 * | 0.84 * | −0.12 | 0.88 * | 0.95 * |
| Behaviour | −0.57 | −0.68 | −0.64 * | −0.01 | 0.57 | −0.11 | 0.64 * | 0.64 | 0.68 | 0.11 | 0.01 | −0.64 |
| Cognitive | −1.02 * | −1.04 * | −0.19 | −0.30 | 1.02 * | −0.02 | 0.19 | −0.11 | 1.04 * | 0.02 | 0.11 | 0.30 |
| Competency | −0.42 | 0.07 | −0.12 | −0.99 * | 0.42 | 0.50 * | 0.01 | −0.98 * | −0.07 | −0.50 * | 0.99 * | 0.98 * |
| Awareness | −0.80 * | 0.05 | 1.13 * | 1.05 * | 0.80 * | 0.85 * | −1.13 * | −0.01 | −0.05 | −0.85 * | −1.05 * | 0.01 |
Publisher’s Note: MDPI stays neutral with regard to jurisdictional claims in published maps and institutional affiliations. |
© 2022 by the authors. Licensee MDPI, Basel, Switzerland. This article is an open access article distributed under the terms and conditions of the Creative Commons Attribution (CC BY) license (https://creativecommons.org/licenses/by/4.0/).
Share and Cite
Phua, C.Y.; Chua, K.H.; Bong, W.K. Experiences of Parents and Teachers with Virtual Classrooms during the COVID-19 Restrictions: A Study Focusing on Inclusive Education in Malaysia. Educ. Sci. 2022, 12, 884. https://doi.org/10.3390/educsci12120884
Phua CY, Chua KH, Bong WK. Experiences of Parents and Teachers with Virtual Classrooms during the COVID-19 Restrictions: A Study Focusing on Inclusive Education in Malaysia. Education Sciences. 2022; 12(12):884. https://doi.org/10.3390/educsci12120884
Chicago/Turabian StylePhua, Chu Yun, Kah Heng Chua, and Way Kiat Bong. 2022. "Experiences of Parents and Teachers with Virtual Classrooms during the COVID-19 Restrictions: A Study Focusing on Inclusive Education in Malaysia" Education Sciences 12, no. 12: 884. https://doi.org/10.3390/educsci12120884
APA StylePhua, C. Y., Chua, K. H., & Bong, W. K. (2022). Experiences of Parents and Teachers with Virtual Classrooms during the COVID-19 Restrictions: A Study Focusing on Inclusive Education in Malaysia. Education Sciences, 12(12), 884. https://doi.org/10.3390/educsci12120884