Abstract
Student persistence and retention in STEM disciplines is an important yet complex and multi-dimensional issue confronting universities. Considering the rapid evolution of online pedagogy and virtual learning environments, we must rethink the factors that impact students’ decisions to stay or leave the current course. Learning analytics has demonstrated positive outcomes in higher education contexts and shows promise in enhancing academic success and retention. However, the retention factors in learning analytics practice for STEM education have not been fully reviewed and revealed. The purpose of this systematic review is to contribute to this research gap by reviewing the empirical evidence on factors affecting student persistence and retention in STEM disciplines in higher education and how these factors are measured and quantified in learning analytics practice. By analysing 59 key publications, seven factors and associated features contributing to STEM retention using learning analytics were comprehensively categorised and discussed. This study will guide future research to critically evaluate the influence of each factor and evaluate relationships among factors and the feature selection process to enrich STEM retention studies using learning analytics.
1. Introduction
Science, Technology, Engineering, and Mathematics (STEM) education has become a global discussion topic in the last decade. The change in the global economy and the needs of the workforce indicate that STEM-prepared graduates will be in short supply around the world [1]. However, STEM disciplines in higher education institutions continue to face significant challenges due to high attrition and low retention rates. Many STEM entrants perform poorly in comparison to their peers, end up changing to non-STEM disciplines, or leave without earning any educational qualifications [2]. A student’s early withdrawal from a degree program has detrimental effects on the well-being of students, institutions as well as a society [3]. This problem demands that institutions take measures to encourage students’ persistence during their participation in STEM programs, increase retention rates, and assist students with academic success.
The retention analysis challenge arises as a result of the development of digital transformation in higher education institutions [4,5]. The rapid evolution of online pedagogy has resulted in the expansion of computer-supported learning environments, such as the Learning Management System (LMS) and Massive Open Online Courses (MOOCs), to improve the learning process of students. The COVID-19 outbreak in 2020 accelerated the pace of transition to online pedagogy, both nationally and internationally. Since COVID-19, there is a tendency to continue to offer online courses and/or blended learning courses [6]. This rapid transition has resulted in a tremendous amount of data being generated by the LMS and Student Information System (SIS) [7] which can be used to continuously track the online learning process. In this context, the need for high-tech data-driven solutions is becoming increasingly apparent in many institutions.
Learning Analytics (LA) has grown in popularity as a result of the use of big data analysis and the premise of optimising learning environments and improving retention in STEM disciplines [8]. LA has emerged since 2011, and is commonly defined as the “measurement, collection, analysis and reporting of data about learners and their contexts, for purposes of understanding and optimising learning and the environments in which it occurs” [9] (p. 305). It allows objective information on students’ learning progress to be tracked by using data obtained automatically from students’ interactive activity with the online learning platform. Improving the retention rate is a multi-dimensional process involving many levels of relationship [10], and many factors contribute to a students’ decision to persist in their current course, or switch discipline or even leave university without gaining an academic qualification [2,11,12]. In dynamic learning environments, it enables researchers to capture and analyse a variety of data with the assistance of new tools and techniques [13]. LA uses digital traces, such as clickstream, assessment participation, etc., to provide insights into a student’s learning progress within a learning environment, which can be used to identify retention factors.
It should be noted that the “one size fits all” in LA may be counterproductive to student persistence and retention [14], and overgeneralising should be avoided in the practice of learning analytics across different disciplines [15]. The retention factors for STEM education explored in LA studies have yet to be systematically reviewed. Therefore, the purpose of this study is to contribute to this research gap by reviewing the empirical evidence on factors affecting student retention in STEM disciplines in higher education and what features can be used to measure and quantify those factors in learning analytics practice.
1.1. The Scope of This Study
Student persistence and retention in STEM disciplines is a critical challenge confronting higher education institutions. The existing reviews of retention learning analytics have primarily focused on the overall disciplines for higher education institutions [16], MOOCs [17], and online learning [18]. Therefore, this research is intended to present a comprehensive review of empirical studies that use LA to identify retention factors of higher STEM education in computer-supported learning environments. Through a systematic literature review, our contribution can be summarised as follows:
- A summary of factors, sub-factors, and features contributing to retention learning analytics in STEM education is presented. It provides researchers with guidance regarding which factors and features have been explored using learning analytics in the context of the digital transformation in the higher education sector.
- The features measured for each of the retention factors are evaluated and discussed. In the review of LA studies, it demonstrates how each factor can be quantified based on available datasets from systems (e.g., LMS and SIS) to predict student likelihood of persisting.
- This review also highlights the features that significantly contributed to STEM retention. This will facilitate the feature selection process and improve exploratory modelling efficiency in LA studies.
1.1.1. Research Questions
To carry out the systematic review, two research questions were formulated:
Research Question 1 (RQ 1): What factors have been identified that impact retention in STEM education?
Research Question 2 (RQ 2): In STEM retention studies, how are retention factors quantified and measured in learning analytics practice?
2. Methodology
This systematic review was conducted based on guidelines established in the Preferred Reporting Items for Systematic Reviews and Meta-analysis Protocols PRISMA [19]. The entire review process of studies selection is detailed in a flow chart (see Figure 1).
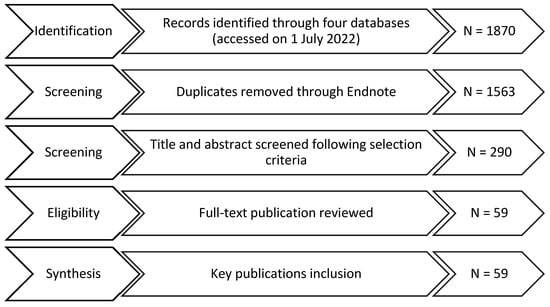
Figure 1.
Flow diagram of PRISMA article selection process.
2.1. Search Strategy
Four academic databases, including Scopus, ScienceDirect, ACM Digital Library and IEEE Xplore, were chosen to search for empirical studies related to using learning analytics for student retention in STEM education. We began the search by establishing search terms according to the research questions. All of STEM subjects were taken into consideration in this review. To avoid accidentally excluding studies representing STEM, we decided to leave specific subject qualifiers out of the search terms, e.g., chemistry, biology, and agricultural science. Studies that relate to non-STEM fields were filtered during the screening and eligibility review process. Therefore, the relevant papers were extracted based on two different types of search terms, as shown in Table 1. Filters were used to identify papers written in English between 2014 and 2022 as studies in this nine-year duration would be sufficient evidence of the recent developments of using learning analytics for STEM retention studies.

Table 1.
Search terms and search query.
2.2. Selection Criteria
The main purpose of this study was to summarise and synthesise evidence from empirical studies utilising learning analytics demonstrating the features and variables that impact STEM retention in a computer-supported learning environment among higher education institutions. In this systematic review, eligibility criteria were identified to determine the publications to be considered to answer research questions.
2.2.1. Inclusion Criteria
- The articles were published in a peer-reviewed journal or conference;
- The study employed learning analytics techniques with empirical evidence;
- The study explored an online learning environment and examined data collected from a LMS or a similar online learning platform;
- The study subjects’ major should be within STEM field;
- The sample population should be from higher education institutions.
2.2.2. Exclusion Criteria
- The articles did not fulfil the eligibility criteria;
- The study did not contribute to the research questions.
2.3. Selection of Publications
As shown in Figure 1, the initial search from four electronic databases yielded 1870 articles. Of these results, three hundred and seven (307) duplicates were automatically screened and eliminated by Endnote. In the screening phase, all articles that did not match the selection criteria were excluded, leading to two hundred and ninety (290) articles remaining for full-text eligibility check. At the end of this phase, fifty-nine (59) key publications that contribute to the research questions were selected for the systematic review, as listed in Table 2.
Table 2.
Summary of fifty-nine (59) publications.
3. Results
In this section, the results of the surveyed key publications are reported from three dimensions, including general information, characteristics of selected studies, and summarised retention factors, sub-factors and features.
3.1. Type of Publication
The 59 key articles include thirty-three journal articles and twenty-six conference papers. Figure 2 presents the distribution of journal articles and conference papers over the selected publication years. Although the number of included articles in 2022 is seven, this is the search results for only the first half of the year. LA is addressing retention challenges in STEM education, and more studies in the future will enhance learning environments by employing LA.
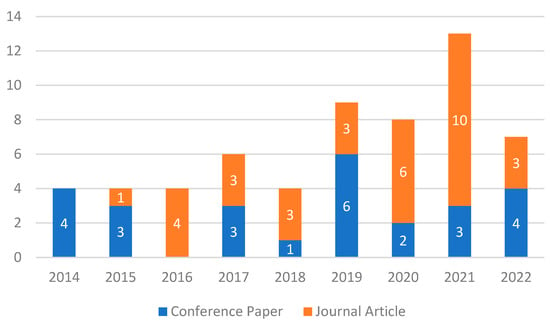
Figure 2.
Number of studies in terms of types from year January 2014 to June 2022.
3.2. Characteristics of Selected Studies
Table 2 provides a summary of characteristics of the selected studies that focus on learning analytics for STEM retention and identifies the key purpose of each study, data source, data collection methods, sample size, and students’ enrolment courses and commencing student status.
Of the 59 articles included, the common key purposes were predicting student performance (grade) (29), identifying at-risk students (fail/pass, engagement/disengagement) (15), and predicting dropout (14). For the dataset, 49 collected corpus data from for-credit institutions and 10 used available datasets from MOOCs to conduct learning analytics practice. Student information and digital footprints in the virtual learning environment are easily accessible. There were five studies that implemented questionnaires/surveys aiming to collect basic data [47], measure self-efficacy and motivation [24], learning approaches and skills [28,40], and self-regulation levels [52]. Figure 3 illustrates the frequency of the key publications based on the size of sample dataset. Nearly half of the studies (28) employed a dataset of less than 500 student records for learning analytics. It was observed that only 19 studies used a dataset with more than 2500 students’ data, and the data source for 10 of these articles was from different MOOCs.
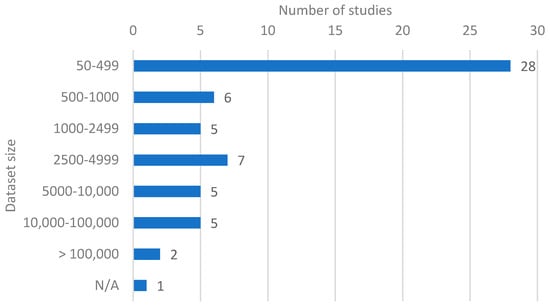
Figure 3.
The frequency of articles according to the size of sample dataset.
3.3. STEM Retention Factors, Sub-Factors and Features
The purpose of this paper is to provide a comprehensive review that concentrates on the categorisation of retention factors and the quantified features used in learning analytics in higher STEM education. As presented in Table 3, the retention factors used in the selected studies can be grouped into seven categories. Six of them are student-focused factors, including student personal characteristics, enrolment features, prior academic performance, current academic performance, behavioural engagement, and academic engagement. One factor is course design, data extracted from the subject/unit level. The review found that students’ current academic performance (56%), student behavioural engagement (58%), and academic engagement (78%) have been studied in most of the key publications. Only six (10%) articles examined the course design factor.
Table 3.
List of retention factors and studies.
In a virtual learning environment, static and dynamic data are readily accessible from an institution’s systems and contribute to the quantification of retention factors. The following sections identify how retention factors are quantified and measured in learning analytics. Each factor with sub-factors and features is detailed below.
3.3.1. Student Personal Characteristics
Regarding student personal information, basic demographic features and socioeconomic features are normally considered in retention studies. The analysed features and the number of studies are listed in Table 4. It can be observed that a host of studies have investigated basic demographic features, such as students’ gender (18) and age (10), which are the two most selected features. Students’ family income level (5) and his/her parental education information (4) are two commonly examined features for understanding a students’ socioeconomic level.
Table 4.
Student personal characteristics and features with numbers of times occurred.
3.3.2. Student Enrolment Properties
Student enrolment properties were studied in relatively low numbers (Table 5). The features encompass the administrative data recorded in SIS, such as whether the student studies full-time or part-time (2), whether the current STEM degree is the student’s initial intended degree (4), etc. Other financial support data (financial aid, scholarship) is also taken into account. Financial assistance may contribute to dropout decisions [79] and enhance student persistence in certain majors [80].
Table 5.
Student enrolment properties and features with numbers of times occurred.
3.3.3. Student Prior Academic Performance
Student prior knowledge can be reflected by data from a students’ educational background and admission tests for entering the university (Table 6). Features of educational background include students’ academic background level (6), grade point average (GPA) of high school, and GPA of prior university. Admission test data covers admission test overall scores (11) and STEM-related scores such as mathematics (8) and science (3) scores.
Table 6.
Student prior academic performance and features with numbers of times occurred.
3.3.4. Student Current Academic Performance
Students’ current academic performance and achievements play a vital role in students’ persistence in continuing their current degree and courses participation and enrolment. In Table 7, it shows that this retention factor can be split into two sub-factors: overall, academic performance regards the achievement at course level, such as GPA each semester (8), overall GPA ranking (1), course(s) score (7), etc.; assessment performance which includes assessments (11), quiz/test (5) or lab (1) score, and final examination grades (3).
Table 7.
Student current academic performance and features with numbers of times occurred.
3.3.5. Student Behavioural Engagement
Student behavioural engagement refers to the actions that are indirectly related to the learning process. As shown in Table 8, the most common examined features can be categorised as clickstream data, such as the number of student logins to the virtual learning system (20), the total number of clicks (2), the frequency students visit course pages (11), announcement content viewed (3), notification messages read (2), and glossary views (2). Other features are also representative of students’ behavioural engagement, for example, the total time students spend on the learning system (10), the number of days students login into the system, and students’ attendance for the enrolled subject (4).
Table 8.
Student behavioural engagement and features with numbers of times occurred.
3.3.6. Student Academic Engagement
Student academic engagement is one of the most examined factors in both online and hybrid learning environments for dropout prediction and at-risk student identification. The literature reviewed revealed three sub-factors, including engagement with learning material, assessment participation, and interactive activities with peers and instructors (Table 9).
Table 9.
Student academic engagement and features with numbers of times occurred.
Student engagement data with learning material is recorded on an ongoing basis to reflect student learning habits, processes, and strategies. The features include the frequency of students’ exposure to learning resources (25), lectures viewed (6), videos watched (8) and video solutions reviewed (1), the number of unique days students viewed the resources (3), and the number of resources downloaded by the students (3). In addition to the commonly applied data on engagement with learning management systems, [35,43,76] collected data on programming behaviours from students in the Technology discipline, such as the number of logical lines, number of test cases, and number of commands students generated during programming exercises.
In terms of assessment participation factors, the following features were considered: the number of completed assignment task (16), quiz (8), extracurricular quiz (2) and mock exam (2), the number of times students attempt to complete the assessments (8), the frequency with which students view their grades (2).
Another set of important features is considered as students’ interactive activities with their peers and instructors. Those analysed features are number of visits (17) by students to the discussion/forum and participation in posts or comments (21), times of involvement in collaboration with their peers (3), the times that students interacted with instructors through consultation time (4), and email (2).
3.3.7. Course Design
Course design is another factor that was examined in retention studies, although there are only six studies (see Table 3) covering this factor among the 59 key publications in this systematic review. The listed features (Table 10) cover the information about pedagogical materials, for example, how many content pieces have been introduced to student for certain subject (1) and how many assessments have been presented to students (3). The course outcome is composed of students’ online activity and performance, the features include assignment submission rate (1) and course pass rate (1). Features that measure student LMS usage at course level are taken into consideration. For example, total/average number of clickstream records for all students (1) and average student online activity days (2).
Table 10.
Course design factor and features with numbers of times occurred.
4. Findings and Discussion
In this section, the reviewed articles will be further analysed. The answers to the Research Questions in Section 1.1.1 are provided and discussed here structured according to each of the retention factors, followed by recommendations for future learning analytics research for improving STEM retention.
4.1. Retention Factors and Quantified Features Explored by LA in STEM Education
Seven factors employed in LA studies were summarised to be associated with student retention in STEM disciplines, answering RQ 1: What factors have been identified that impact retention in STEM education? To address RQ 2: In STEM retention studies, how are factors quantified and measured in learning analytics practice?, each factor has been examined and corresponding measurable features have been identified. A summary of factors and features that have been identified as having a significant impact on retention are presented in Table 11.
Table 11.
Summary of factors and significant features.
4.1.1. Student Personal Characteristics
The finding of this study revealed that individual characteristics and family background have a relevant influence on students’ motivation and persistence in completing the course. The most often measured features for this factor were student gender, age, and race/ethnicity. Seventeen of the nineteen articles included this factor in the prediction studies. In the STEM discipline, demographic factors seem to be significant features that impact retention rate [81], particularly in the first half of the academic year [63]. It has been evidenced using LA that older students showed more likelihood of persistence in STEM online courses [82], and gender has been shown to be a significant predictor of student success in computing curricula [83]. Despite this there is some evidence that shows such static features (age, gender, ethnicity) [16,21,42], and socio-economic factors [42,84] are irrelevant to a student’s performance and dropout decision.
4.1.2. Student Enrolment Properties
It is observed that the student enrolment data recorded in the Student Information System contains useful information that has not yet been fully explored. Only a handful of LA articles (12) considered this factor. Features of enrolment are often omitted from the analysis of LA due to its static data nature.
The proxy features of student intended degree and financial support data have been found to correlate with student dropout decision. When using LA to predict student dropout for 429 first-year engineering students, a student’s intended degree has been identified as the second ranking feature of 17 total features from six factors [42]. To some extent, it reflects a students’ interest and motivation in accessing and continuing in STEM subjects. This feature has also been included in the LA studies for identifying at-risk students of subject failure or dropping out of Technology [47,50,55]. Financial support features, such as financial aid [71] and scholarship [49,71], help predict the student likelihood of continuing the current STEM subjects as finances may contribute to dropout decisions [79] or enhance student persistence in their course [80]. Though finances may not be accurate in identifying at-risk students without considering other factors impacting a student’s learning progress and academic status.
4.1.3. Student Prior Academic Performance
Our findings reveal that a student’s prior knowledge is an important factor in both dropout prediction and performance prediction. It is possible to represent this factor using features, such as high school GPA, scores on entrance examination, and maths scores on an admission test. It has been proven to be significantly correlated by predictive learning analytics because these features reflect student interest and capability to continue their study in STEM disciplines.
This retention factor is found to significantly affect student success in both for-credit institutions [42,63] and MOOCs [66], especially for entrance examinations [50]. The analysis indicates that students who have good marks in previous degrees and admission tests have significantly better achievements [47] and are less inclined to drop out or switch to another degree [76]. This review also highlighted the influence of prior academic performance in STEM subjects in dropout prediction. Generally, secondary school graduates are not equally ready for STEM courses due to differences in school types and maths curricula [85]. Students’ prior knowledge has been found repeatedly in the selected articles to be related to academic success in STEM subjects [55,56]. Particularly for mathematic proficiency, students with basic mathematics deficiencies have a higher chance of failure or dropping out of STEM-related subjects [86]. Commencing students with a mathematical background are more likely to overcome any obstacles during learning and continue studying successfully [87]. Retention studies that involved the features such as high school score, maths score, or science score in an admission test demonstrated promise in measuring student STEM preparation level and forecasting struggling students at an early stage.
4.1.4. Student Current Academic Performance
The analysis found that a student’s current academic performance measured by both subject overall performance and assessment performance are appropriate data for predicting dropout/retention/performance.
Overall academic performance was widely evaluated as a predictor using various forms of grades, such as overall GPA, semester GPA, credit students earned in first semester [23,25,27,28,29,32,37,40,42,47,49,52,60,66,67,71,73,76]. The impact of performance on attrition for first and second year students has also been verified in predicting student performance and dropping out [32,76]. In addition, the credits student obtained in the first semester [38] and early academic success [38] in STEM disciplines are found to be two of the most important predictors of student dropout risk.
Assessment performance is another sub-factor in predicting student performance. Continuous data from assessment features (quiz, assignment, and/or test) proved predictors for students’ academic status in computer-supported learning. For example, there has been evidence to suggest that assignment scores affect discrimination student performance [20]; the test scores obtained for each chapter exercise among 20,142 MOOC learners in Technology study have been examined and validated as the most discriminating variable in dropout prediction [72]. Low-achieving students are more likely to lose confidence and motivation to continue their studies, consequently leading to a decrease in their participation [50].
4.1.5. Student Behavioural Engagement
How students engage with LMS has sparked considerable interest among researchers in LA. To evaluate behavioural engagement, a set of features derived from the learning system’s log data were identified in predictive learning analytics, such as login numbers, online time, and attendance.
In the virtual learning environment, behavioural engagement is a key precondition for effective learning, and students at risk of failure or dropout are linked to a lack of engagement [88]. Meanwhile, disengagement is a persisting issue in STEM subjects [54]. The traditional use of log data, such as the number of logins/clicks and attendance, has been criticised in a few studies. It has been argued that the login data were not related to learning outcomes [61] and clickstream activity failed to pinpoint students with high-risk [24]. While it has been well-documented that clickstream in LMS has positive correlations with student final marks [26,39,48,67], these features would reflect student self-motivation and self-efficacy in the blended learning environment [49]. The possible reason may be due to the different forms of data transformation used in the analysis. Data segments appear to be more accurate at recognising student dropouts when behavioural data are split into phases, such as weekly [22,70], every three weeks [71], and specified phases [73]. The transformation of features over time is an area of future research for exploring the potential of using data from a LMS for more accurate prediction results.
There are also concerns about the influence of class attendance in retention analysis, as it might be influenced by causes that are out of students’ control [16]. Class attendance demonstrates an essential role in enhancing academic performance among 239 commencing students in the Technology discipline [27]. Overall, the evidence of this review study indicates students who take a more active role and spend more time on the learning platform show a willingness to make a commitment to the course and tend to achieve higher grades.
4.1.6. Student Academic Engagement
Our findings reveal that student academic engagement contains features reflecting the dynamic learning behaviour within the learning environment and measures their perceived usefulness and direct effects on student learning performance. Most of the studies (78%) developed predictive LA using data generated from student engagement with online learning material and assessment as well as interaction with peers and instructors. Features, such as frequency of resources viewed, number of assessments finished, and discussion/forum commented, are significant indicators to be included in LA to address STEM retention problem.
Engagement with learning material. This sub-factor consists of the behavioural and cognitive dimensions of the learning process in a dynamic way and is tightly linked to academic performance [89]. The information regarding the changes in student activity, such as resource viewing frequency [42,48,51,58], content completed percentage [90], and time spent on each module [53,57], which may be measured to recognise struggling students at an early stage. The usage of subject material and lecture resources [60] and student effort over time [68] indicate positive correlations with subject outcomes over a semester. In addition, combining these types of data allows us to gain an insight into how personal characteristics of individual students and their educational trajectories are connected [91]. In particular, the results revealed features that are used in the context of programming education. Such data differs considerably, for example, keystroke latency, number of test cases and number of error message received [35,36,43,75]. This kind of feature shows promise in identifying students that struggle with programming subjects and provides insights into where and when students may struggle.
Assessment participation. Not only is the outcome of the assessment a predictor of student subject performance, but the footprint activities from the completion process of assessment also provide effective predictors to identify at-risk students [34]. For example, the average date between assignment deadlines and student’s work submissions can imply a student’s difficulty with deadlines, and this feature has been confirmed as an important indicator of dropout tendency [41]. Students’ behaviour in completing assessments (time spend on assessment, number of attempts, exam preparation) is an expression of self-efficacy that influences how the learner addresses goals, tasks, and challenges [92]. High self-efficacious students are more likely to get involved in a task more readily, committing more time and perseverance to its completion [93].
Interactivity. Student interaction with their peers and instructors through discussion/forums, collaborative work, email and consultation provide meaningful data to examine the impact on student learning progress and retention. The importance of engagement with peers and instructors has been identified [21]. Forum communication (frequency of discussion/forums viewed/posted/commented) was commonly analysed for dropout study in the online learning environment. Successful students show a higher frequency of discussion or forum page views and spend more time reviewing content [59,65,94]. The interactivities, to some extent, may mirror the sense of belonging in the academic realm, and the willingness to interact with others contributes to students’ persistence [92].
4.1.7. Course Design
The importance of the course design factor was identified in this systematic review, although this factor and features were underexplored among the 59 key articles. The pedagogical material and assessment design are linked with student performance and dropout decisions. For example, the number of content pieces and number of assignments/quizzes have an important impact on student engagement in the learning process [95] and partially contribute to the engagement level with the learning platform [31,65,96]. It is possible to represent this factor with the data related to the overall learning activity. These features are composed of students’ online activity and performance. With the consideration of the variation in behavioural data over the learning process at the level of activity across the subject, it is possible to detect the dropout probably of a subject or a course in LA [25].
4.2. Recommendations for Future Research
Several limitations and underexplored retention factors and proxy features were identified which help understand students and their behaviours in STEM disciplines.
- Seven retention factors and their sub-factors and features have been summarised. The power of each feature associated with each factor should be critically examined in future learning analytics studies. In addition, relationships between factors should be further evaluated.
- Features from static factors (student personal characteristics, student enrolment properties, and prior academic performance) demonstrated promising results in early detection of at-risk students. Learning analytics currently tends to explore dynamic data on the learning process leading to a snapshot of student learning patterns and predictions of learning outcomes for the purpose of providing intervention. However, these static factors and features are under explored in retention learning analytics studies; therefore, there is a need to further explore the potential of this data in LA for early prediction and/or even assist institutions in the phase of applicant selection to address the STEM retention challenge.
- The limited consideration towards the course design factor has been identified after reviewing the key publications. Most studies are student-focused, and the results emphasise that more attention and further research could be aimed at the pedagogical design of assessment, such as problem-based and cooperative learning to improve students’ interactions and maintain interest in STEM courses.
- Factor and feature selection and the data form denoted should direct studies in retention towards learning analytics. Combining features from different factors may yield better prediction results, though different data selection can result in varying predictive performance in identifying at-risk students [33]. Predictive model development should carefully select features and should avoid choosing purely one kind of retention factor. The results from one factor in learning analytics are far less accurate. [34]. A better performance model might be developed by combining other, even individually less effective, factors or features.
- The analysis may not be generalisable for all subjects in STEM disciplines, as the assessment and marking of each subject varies. Additionally, prediction models can also be affected by the pedagogical circumstances in the subject [15]. Future researchers could employ data from subjects in the same discipline that share similar pedagogy design and assessment format.
4.3. Limitations
The systematic review is an appropriate method for synthesising findings from research on the topic of STEM retention in learning analytics, but the tools, analysis techniques, algorithms, and methods employed in the selected studies have not yet been analysed. The effectiveness of retention factors should be read in the context of the methodology applied. Therefore, this limitation can be addressed by expanding this review with an examination of learning analytics approaches. This will facilitate the identification of important research trends and concerns in the literature on the learning analysis of STEM retention at a method level.
5. Conclusions
STEM retention is a critical challenge confronting higher education institutions. In the context of transformation of computer-supported learning environments, the effectiveness of learning analytics in identifying retention factors has been demonstrated by conducting a systematic literature review. This review brought together and synthesised the latest evidence on retention LA in STEM disciplines while categorising and highlighting the factors and their quantified features that are significantly discriminative in learning analytics practice. The influential factors impacting student persistence and retention were summarised into seven categories: (1) student personal characteristics, (2) student enrolment properties, (3) prior academic performance, (4) current academic performance, (5) behavioural engagement, (6) academic engagement, and (7) course design. Deliberate consideration of the selection and combination of these factors and features can be advisable in the implementation of learning analytics in STEM education, which can support establishing the profile of at-risk students who show a likelihood to discontinue studying in STEM courses and facilitate the prediction of students who need support.
The contribution of this review study is twofold: (1) The comprehensively reviewed retention factors and proxy features enriches LA studies in STEM disciplines. The findings of this paper can be used as a guide for data selection for use with LA to improve predictive model accuracy. (2) The categorisation presented in this systematic review can assist researchers in investigating the influence of factors and examining the relationship between factors/features in STEM retention studies. Having knowledge of the retention factors and possible measurable features, it is possible for subject designers and instructors to gain a deeper insight into the digital footprint of students’ learning process.
Author Contributions
Conceptualization, C.L., N.H., S.Y. and J.M.; methodology, C.L., N.H., S.Y. and J.M.; formal analysis, C.L.; resources, C.L.; data curation, C.L.; writing—original draft preparation, C.L.; writing—review and editing, N.H., S.Y. and J.M.; visualization, C.L.; supervision, N.H., S.Y. and J.M. All authors have read and agreed to the published version of the manuscript.
Funding
This research received no external funding.
Institutional Review Board Statement
Not applicable.
Informed Consent Statement
Not applicable.
Data Availability Statement
Not applicable.
Conflicts of Interest
The authors declare no conflict of interest.
References
- Almatrafi, O.; Johri, A.; Rangwala, H.; Lester, J. Retention and Persistence among STEM Students: A Comparison of Direct Admit and Transfer Students across Engineering and Science. In Proceedings of the 124th ASEE American Society for Engineering Education, Columbus, OH, USA, 25–28 June 2017; p. 18453. [Google Scholar]
- Sithole, A.; Chiyaka, E.T.; McCarthy, P.; Mupinga, D.M.; Bucklein, B.K.; Kibirige, J. Student Attraction, Persistence and Retention in STEM Programs: Successes and Continuing Challenges. High. Educ. Stud. 2017, 7, 46–59. [Google Scholar] [CrossRef]
- Sultana, S.; Khan, S.; Abbas, M.A. Predicting performance of electrical engineering students using cognitive and non-cognitive features for identification of potential dropouts. Int. J. Electr. Eng. Educ. 2017, 54, 105–118. [Google Scholar] [CrossRef]
- Iivari, N.; Sharma, S.; Ventä-Olkkonen, L. Digital transformation of everyday life—How COVID-19 pandemic transformed the basic education of the young generation and why information management research should care? Int. J. Inf. Manag. 2020, 55, 102183. [Google Scholar] [CrossRef] [PubMed]
- Anh, T.V.; Nguyen, H.T.T.; Linh, N.T.M. Digital Transformation: A Digital Learning Case Study. In Proceedings of the the 2019 The World Symposium on Software Engineering (WSSE), Wuhan, China, 20–23 September 2019; pp. 119–124. [Google Scholar]
- Martin, L. Foundations for Good Practice: The Student Experience of Online Learning in Australian Higher Education during the COVID-19 Pandemic; Tertiary Education Quality and Standards Agency: Melbourne, Australia, 2020; pp. 1–25. [Google Scholar]
- Francis, B.K.; Babu, S.S. Predicting Academic Performance of Students Using a Hybrid Data Mining Approach. J. Med. Syst. 2019, 43, 162. [Google Scholar] [CrossRef] [PubMed]
- Prieto, L.P.; Rodríguez-Triana, M.J.; Martínez-Maldonado, R.; Dimitriadis, Y.; Gašević, D. Orchestrating learning analytics (OrLA): Supporting inter-stakeholder communication about adoption of learning analytics at the classroom level. Australas. J. Educ. Technol. 2019, 35, 14–33. [Google Scholar] [CrossRef]
- Ferguson, R. Learning analytics: Drivers, developments and challenges. Int. J. Technol. Enhanc. Learn. 2012, 4, 304–317. [Google Scholar] [CrossRef]
- Gibson, D.C.; Ambrose, M.; Gardner, M. Self-organising maps and student retention: Understanding multi-faceted drivers. In Proceedings of the 32nd Annual Conference of the Australasian Society for Computers in Learning and Tertiary Education (ASCILITE 2015), Perth, Australia, 30 November–3 December 2019; pp. 112–120. [Google Scholar]
- Nieuwoudt, J.E.; Pedler, M.L. Student Retention in Higher Education: Why Students Choose to Remain at University. J. Coll. Stud. Retent. Res. Theory Pract. 2021, 1–24. [Google Scholar] [CrossRef]
- Muljana, P.S.; Luo, T. Factors contributing to student retention in online learning and recommended strategies for improvement: A systematic literature review. J. Inf. Technol. Educ. Res. 2019, 18, 19–57. [Google Scholar] [CrossRef]
- Spikol, D.; Ruffaldi, E.; Landolfi, L.; Cukurova, M. Estimation of Success in Collaborative Learning Based on Multimodal Learning Analytics Features. In Proceedings of the 17th International Conference on Advanced Learning Technologies (ICALT 2017), Timisoara, Romania, 3–7 July 2017; pp. 269–273. [Google Scholar]
- Finnegan, C.; Morris, L.V.; Lee, K. Differences by Course Discipline on Student Behavior, Persistence, and Achievement in Online Courses of Undergraduate General Education. J. Coll. Stud. Retent. Res. Theory Amp Pract. 2008, 10, 39–54. [Google Scholar] [CrossRef]
- Gašević, D.; Dawson, S.; Rogers, T.; Gasevic, D. Learning analytics should not promote one size fits all: The effects of instructional conditions in predicting academic success. Internet High. Educ. 2016, 28, 68–84. [Google Scholar] [CrossRef]
- Shafiq, D.A.; Marjani, M.; Habeeb, R.A.A.; Asirvatham, D. Student Retention using Educational Data Mining and Predictive Analytics: A Systematic Literature Review. IEEE Access 2022, 10, 72480–72503. [Google Scholar] [CrossRef]
- Liliana, L.; Santosa, P.I.; Kusumawardani, S.S. Completion factor in massive open online course in developing countries: A literature review in 2015–2021. World J. Educ. Technol. Curr. Issues 2022, 14, 456–472. [Google Scholar] [CrossRef]
- Shaikh, U.U.; Asif, Z. Persistence and Dropout in Higher Online Education: Review and Categorization of Factors. Front. Psychol. 2022, 13, 902070. [Google Scholar] [CrossRef] [PubMed]
- Moher, D.; Liberati, A.; Tetzlaff, J.; Altman, D.G. Preferred reporting items for systematic reviews and meta-analyses: The PRISMA statement. Ann. Intern. Med. 2009, 151, 264–269. [Google Scholar] [CrossRef] [PubMed]
- Umer, R.; Susnjak, T.; Mathrani, A.; Suriadi, S. A learning analytics approach: Using online weekly student engagement data to make predictions on student performance. In Proceedings of the 2018 International Conference on Computing, Electronic and Electrical Engineering (ICE Cube 2018), Quetta, Pakistan, 12–13 November 2019. [Google Scholar]
- Zacharis, N.Z. A multivariate approach to predicting student outcomes in web-enabled blended learning courses. Internet High. Educ. 2015, 27, 44–53. [Google Scholar] [CrossRef]
- Gkontzis, A.F.; Kotsiantis, S.; Panagiotakopoulos, C.T.; Verykios, V.S. A predictive analytics framework as a countermeasure for attrition of students. Interact. Learn. Environ. 2019, 3, 1028–1043. [Google Scholar] [CrossRef]
- Iatrellis, O.; Savvas, I.Κ.; Fitsilis, P.; Gerogiannis, V.C. A two-phase machine learning approach for predicting student outcomes. Educ. Inf. Technol. 2021, 26, 69–88. [Google Scholar] [CrossRef]
- Broadbent, J. Academic success is about self-efficacy rather than frequency of use of the learning management system. Australas. J. Educ. Technol. 2016, 32, 38–49. [Google Scholar] [CrossRef]
- Cohen, A. Analysis of student activity in web-supported courses as a tool for predicting dropout. Educ. Technol. Res. Dev. 2017, 65, 1285–1304. [Google Scholar] [CrossRef]
- Al-Shabandar, R.; Hussain, A.J.; Liatsis, P.; Keight, R. Analyzing Learners Behavior in MOOCs: An Examination of Performance and Motivation Using a Data-Driven Approach. IEEE Access 2018, 6, 73669–73685. [Google Scholar] [CrossRef]
- Sunday, K.; Ocheja, P.; Hussain, S.; Oyelere, S.S.; Balogun, O.S.; Agbo, F.J. Analyzing student performance in programming education using classification techniques. Int. J. Emerg. Technol. Learn. 2020, 15, 127–144. [Google Scholar] [CrossRef]
- Celis, S.; López, D.; Silva, J. Analyzing the influence of online behaviors and learning approaches on academic performance in first year engineering. In Proceedings of the 2nd Latin American Conference on Learning Analytics, Valdivia, Chile, 18–19 March 2019. [Google Scholar]
- Carter, A.S.; Hundhausen, C.D.; Adesope, O. Blending measures of programming and social behavior into predictive models of student achievement in early computing courses. ACM J. Trans. Comput. Educ. 2017, 17, 12. [Google Scholar] [CrossRef]
- Cirigliano, M.M.; Guthrie, C.D.; Pusic, M.V. Click-level Learning Analytics in an Online Medical Education Learning Platform. Teach. Learn. Med. 2020, 32, 410–421. [Google Scholar] [CrossRef] [PubMed]
- Howard, E.; Meehan, M.; Parnell, A. Contrasting prediction methods for early warning systems at undergraduate level. Internet High. Educ. 2018, 37, 66–75. [Google Scholar] [CrossRef]
- Nam, S.; Lonn, S.; Brown, T.; Davis, C.S.; Koch, D. Customized course advising: Investigating engineering student success with incoming profiles and patterns of concurrent course enrollment. In Proceedings of the 4th International Conference on Learning Analytics and Knowledge (LAK 2014), Indianapolis, IN, USA, 24–28 March 2014; pp. 16–25. [Google Scholar]
- Tsao, N.L.; Kuo, C.H.; Guo, T.L.; Sun, T.J. Data Consideration for At-Risk Students Early Alert. In Proceedings of the 6th IIAI International Congress on Advanced Applied Informatics, Hamamatsu, Japan, 9–13 July 2017; pp. 208–211. [Google Scholar]
- Bognar, L.; Fauszt, T. Different learning predictors and their effects for moodle machine learning models. In Proceedings of the 11th IEEE International Conference on Cognitive Infocommunications, Mariehamn, Finland, 23–25 September 2020; pp. 405–410. [Google Scholar]
- Pereira, F.D.; Oliveira, E.; Cristea, A.; Fernandes, D.; Silva, L.; Aguiar, G.; Alamri, A.; Alshehri, M. Early dropout prediction for programming courses supported by online judges. In Proceedings of the 20th International Conference on Artificial Intelligence in Education (AIED 2019), Chicago, IL, USA, 25–29 June 2019; pp. 67–72. [Google Scholar]
- Arakawa, K.; Hao, Q.; Deneke, W.; Cowan, I.; Wolfman, S.; Peterson, A. Early Identification of Student Struggles at the Topic Level Using Context-Agnostic Features. In Proceedings of the 53rd Annual ACM Technical Symposium on Computer Science Education (SIGCSE 2022), Virtual, 3–5 March 2022; pp. 147–153. [Google Scholar]
- Bravo-Agapito, J.; Romero, S.J.; Pamplona, S. Early prediction of undergraduate Student’s academic performance in completely online learning: A five-year study. Comput. Hum. Behav. 2021, 115, 106595. [Google Scholar] [CrossRef]
- Cannistrà, M.; Masci, C.; Ieva, F.; Agasisti, T.; Paganoni, A.M. Early-predicting dropout of university students: An application of innovative multilevel machine learning and statistical techniques. Stud. High. Educ. 2021, 47, 1935–1956. [Google Scholar] [CrossRef]
- Qiu, F.; Zhu, L.; Zhang, G.; Sheng, X.; Ye, M.; Xiang, Q.; Chen, P.K. E-Learning Performance Prediction: Mining the Feature Space of Effective Learning Behavior. Entropy 2022, 24, 722. [Google Scholar] [CrossRef]
- Russell, J.E.; Smith, A.; Larsen, R. Elements of Success: Supporting at-risk student resilience through learning analytics. Comput. Educ. 2020, 152, 103890. [Google Scholar] [CrossRef]
- De Almeida Neto, F.A.; Castro, A. Elicited and mined rules for dropout prevention in online courses. In Proceedings of the 2015 IEEE Frontiers in Education Conference (FIE 2015), El Paso, TX, USA, 21–24 October 2015; p. 7344048. [Google Scholar]
- Aguiar, E.; Chawla, N.V.; Brockman, J.; Ambrose, G.A.; Goodrich, V. Engagement vs. performance: Using electronic portfolios to predict first semester engineering student retention. In Proceedings of the 4th International Conference on Learning Analytics and Knowledge (LAK 2014), Indianapolis, IN, USA, 24–28 March 2014; pp. 103–112. [Google Scholar]
- Pereira, F.D.; Fonseca, S.C.; Oliveira, E.H.T.; Cristea, A.I.; Bellhauser, H.; Rodrigues, L.; Oliveira, D.B.F.; Isotani, S.; Carvalho, L.S.G. Explaining individual and collective programming students’ behaviour by interpreting a black-box predictive model. IEEE Access 2021, 9, 117097–117119. [Google Scholar] [CrossRef]
- DeMonbrun, R.M.; Brown, M.G. Exploring the relationship between the use of learning technologies and student success in the engineering classroom. In Proceedings of the 124th ASEE Annual Conference and Exposition, Columbus, OH, USA, 25–28 June 2017; p. 19716. [Google Scholar]
- Williams, L.; Titus, K.J.; Pittman, J.M. How Early is Early Enough: Correlating Student Performance with Final Grades. In Proceedings of the 5th Conference on Computing Education Practice (CEP 2021), Virtual, 7 January 2021; pp. 13–16. [Google Scholar]
- Martínez-Carrascal, J.A.; Márquez Cebrián, D.; Sancho-Vinuesa, T.; Valderrama, E. Impact of early activity on flipped classroom performance prediction: A case study for a first-year Engineering course. Comput. Appl. Eng. Educ. 2020, 28, 590–605. [Google Scholar] [CrossRef]
- Rafique, A.; Khan, M.S.; Jamal, M.H.; Tasadduq, M.; Rustam, F.; Lee, E.; Washington, P.B.; Ashraf, I. Integrating Learning Analytics and Collaborative Learning for Improving Student’s Academic Performance. IEEE Access 2021, 9, 167812–167826. [Google Scholar] [CrossRef]
- Nespereira, C.G.; Dai, K.; Vilas, A.F.; Redondo, R.P.D. Is the LMS access frequency a sign of students’ success in face-to-face higher education? In Proceedings of the 2nd International Conference on Technological Ecosystems for Enhancing Multiculturality (TEEM 2014), Salamanca, Spain, 1–3 October 2014; pp. 283–290. [Google Scholar]
- Jiang, X.; Liu, W.; Liu, J. Learning Analytics in a Blended Computer Education Course. In Proceedings of the International Workshop on Artificial Intelligence and Education (WAIE 2019), Singapore, 25–27 November 2019; pp. 6–12. [Google Scholar]
- Lacave, C.; Molina, A.I.; Cruz-Lemus, J.A. Learning Analytics to identify dropout factors of Computer Science studies through Bayesian networks. Behav. Inf. Technol. 2018, 37, 993–1007. [Google Scholar] [CrossRef]
- Mai, T.T.; Bezbradica, M.; Crane, M. Learning behaviours data in programming education: Community analysis and outcome prediction with cleaned data. Future Gener. Comput. Syst. 2022, 127, 42–55. [Google Scholar] [CrossRef]
- Feldman-Maggor, Y.; Blonder, R.; Tuvi-Arad, I. Let them choose: Optional assignments and online learning patterns as predictors of success in online general chemistry courses. Internet High. Educ. 2022, 55, 100867. [Google Scholar] [CrossRef]
- Koutcheme, C.; Sarsa, S.; Hellas, A.; Haaranen, L.; Leinonen, J. Methodological Considerations for Predicting At-risk Students. In Proceedings of the 24th Australasian Computing Education Conference (ACE 2022), Virtual, 14–17 February 2022; pp. 105–113. [Google Scholar]
- Vinker, E.; Rubinstein, A. Mining Code Submissions to Elucidate Disengagement in a Computer Science MOOC. In Proceedings of the 12th International Conference on Learning Analytics and Knowledge (LAK 2022), Virtual, 21–25 March 2022; pp. 142–151. [Google Scholar]
- Martínez-Navarro, Á.; Verdú, E.; Moreno-Ger, P. Mining Pre-Grade Academic and Demographic Data to Predict University Dropout. In Radical Solutions for Digital Transformation in Latin American Universities; Burgos, D., Branch, J.W., Eds.; Springer: Singapore, 2021; pp. 197–215. ISBN 978-981-16-3941-8. [Google Scholar]
- Sisovic, S.; Matetic, M.; Bakaric, M.B. Mining student data to assess the impact of moodle activities and prior knowledge on programming course success. In Proceedings of the 16th International Conference on Computer Systems and Technologies (CompSysTech ’15), Dublin, Ireland, 25–26 June 2015; pp. 366–373. [Google Scholar]
- Silva, J.; Romero, L.; Solano, D.; Fernandez, C.; Lezama, O.B.P.; Rojas, K. Model for predicting academic performance through artificial intelligence. In Proceedings of the International Conference on Computational Methods and Data Engineering, Sonipat, India, 30–31 January 2021. [Google Scholar]
- Marbouti, F.; Diefes-Dux, H.A.; Madhavan, K. Models for early prediction of at-risk students in a course using standards-based grading. Comput. Educ. 2016, 103, 1–15. [Google Scholar] [CrossRef]
- Chango, W.; Cerezo, R.; Romero, C. Multi-source and multimodal data fusion for predicting academic performance in blended learning university courses. Comput. Electr. Eng. 2021, 89, 106908. [Google Scholar] [CrossRef]
- Waddington, R.J.; Nam, S. Practice exams make perfect: Incorporating course resource use into an early warning system. In Proceedings of the 4th International Conference on Learning Analytics and Knowledge (LAK 2014), Indianapolis, IN, USA, 24–28 March 2014; pp. 188–192. [Google Scholar]
- Ulfa, S.; Fatawi, I. Predicting Factors That Influence Students’ Learning Outcomes Using Learning Analytics in Online Learning Environment. Int. J. Emerg. Technol. Learn. 2020, 16, 4–17. [Google Scholar] [CrossRef]
- Nouri, J.; Saqr, M.; Fors, U. Predicting performance of students in a flipped classroom using machine learning: Towards automated data-driven formative feedback. In Proceedings of the 10th International Conference on Society and Information Technologies (ICSIT 2019), Orlando, FL, USA, 12–15 March 2019; pp. 79–82. [Google Scholar]
- Cagliero, L.; Canale, L.; Farinetti, L.; Baralis, E.; Venuto, E. Predicting student academic performance by means of associative classification. Appl. Sci. 2021, 11, 1420. [Google Scholar] [CrossRef]
- Coussement, K.; Phan, M.; De Caigny, A.; Benoit, D.F.; Raes, A. Predicting student dropout in subscription-based online learning environments: The beneficial impact of the logit leaf model. Decis. Support Syst. 2020, 135, 113325. [Google Scholar] [CrossRef]
- Wang, C.; Chang, L.; Liu, T. Predicting Student Performance in Online Learning Using a Highly Efficient Gradient Boosting Decision Tree. In Proceedings of the 12th IFIP TC 12 International Conference on Intelligent Information Processing (IIP 2022), Qingdao, China, 27–30 May 2022; pp. 508–521. [Google Scholar]
- Kennedy, G.; Coffrin, C.; Barba, P.d.; Corrin, L. Predicting success: How learners’ prior knowledge, skills and activities predict MOOC performance. In Proceedings of the Fifth International Conference on Learning Analytics And Knowledge (LAK 2015), Poughkeepsie, NY, USA, 16–20 March 2015; pp. 136–140. [Google Scholar]
- Ademi, N.; Loshkovska, S.; Kalajdziski, S. Prediction of Student Success Through Analysis of Moodle Logs: Case Study. In Proceedings of the 11th International ICT Innovations Conference (ICT Innovations 2019), Ohrid, North Macedonia, 17–19 October 2019; pp. 27–40. [Google Scholar]
- Cerezo, R.; Sánchez-Santillán, M.; Paule-Ruiz, M.P.; Núñez, J.C. Students’ LMS interaction patterns and their relationship with achievement: A case study in higher education. Comput. Educ. 2016, 96, 42–54. [Google Scholar] [CrossRef]
- Jovanović, J.; Saqr, M.; Joksimović, S.; Gašević, D. Students matter the most in learning analytics: The effects of internal and instructional conditions in predicting academic success. Comput. Educ. 2021, 172, 104251. [Google Scholar] [CrossRef]
- Xing, W.; Chen, X.; Stein, J.; Marcinkowski, M. Temporal predication of dropouts in MOOCs: Reaching the low hanging fruit through stacking generalization. Comput. Hum. Behav. 2016, 58, 119–129. [Google Scholar] [CrossRef]
- Bertolini, R.; Finch, S.J.; Nehm, R.H. Testing the Impact of Novel Assessment Sources and Machine Learning Methods on Predictive Outcome Modeling in Undergraduate Biology. J. Sci. Educ. Technol. 2021, 30, 193–209. [Google Scholar] [CrossRef]
- Itani, A.; Brisson, L.; Garlatti, S. Understanding Learner’s Drop-Out in MOOCs. In Proceedings of the 19th International Conference on Intelligent Data Engineering and Automated Learning (IDEAL 2018), Madrid, Spain, 21–23 November 2018; pp. 233–244. [Google Scholar]
- Akçapınar, G.; Altun, A.; Aşkar, P. Using learning analytics to develop early-warning system for at-risk students. Int. J. Educ. Technol. High. Educ. 2019, 16, 40. [Google Scholar] [CrossRef]
- Suhonen, S.J.; Kinnari-Korpela, H. Using Moodle data for early warning of dropping out. In Proceedings of the 47th SEFI Annual Conference 2019—Varietas Delectat: Complexity is the New Normality, Budapest, Hungary, 16–19 September 2020; pp. 1113–1122. [Google Scholar]
- Venant, R.; Sharma, K.; Vidal, P.; Dillenbourg, P.; Broisin, J. Using sequential pattern mining to explore learners’ behaviors and evaluate their correlation with performance in inquiry-based learning. In Proceedings of the 12th European Conference on Technology Enhanced Learning (EC-TEL 2017), Tallinn, Estonia, 12–15 September 2017; pp. 286–299. [Google Scholar]
- Zhuhadar, L.; Daday, J.; Marklin, S.; Kessler, B.; Helbig, T. Using survival analysis to discovering pathways to success in mathematics. Comput. Hum. Behav. 2019, 92, 487–495. [Google Scholar] [CrossRef]
- Casey, K.; Azcona, D. Utilizing student activity patterns to predict performance. Int. J. Educ. Technol. High. Educ. 2017, 14, 4. [Google Scholar] [CrossRef]
- Massing, T.; Reckmann, N.; Blasberg, A.; Otto, B.; Hanck, C.; Goedicke, M. When is the Best Time to Learn?—Evidence from an Introductory Statistics Course. Open Educ. Stud. 2021, 3, 84–95. [Google Scholar] [CrossRef]
- Parkes, S.; Benkwitz, A.; Bardy, H.; Myler, K.; Peters, J. Being more human: Rooting learning analytics through resistance and reconnection with the values of higher education. High. Educ. Res. Dev. 2020, 39, 113–126. [Google Scholar] [CrossRef]
- Cochran, J.D.; Campbell, S.M.; Baker, H.M.; Leeds, E.M. The Role of Student Characteristics in Predicting Retention in Online Courses. Res. High. Educ. 2014, 55, 27–48. [Google Scholar] [CrossRef]
- Nicoletti, M.d.C. Revisiting the Tinto’s Theoretical Dropout Model. High. Educ. Stud. 2019, 9, 52–64. [Google Scholar] [CrossRef]
- Wladis, C.; Conway, K.M.; Hachey, A.C. The Online STEM Classroom—Who Succeeds? An Exploration of the Impact of Ethnicity, Gender, and Non-traditional Student Characteristics in the Community College Context. Community Coll. Rev. 2015, 43, 142–164. [Google Scholar] [CrossRef]
- Rosson, M.B.; Carroll, J.M.; Sinha, H. Orientation of Undergraduates Toward Careers in the Computer and Information Sciences. ACM J. Trans. Comput. Educ. 2011, 11, 1–23. [Google Scholar] [CrossRef]
- Kosasi, S.; Vedyanto; Kasma, U.; Yuliani, I.D.A.E. The Mediating Role of Learning Analytics to Improve Student Academic Performance. In Proceedings of the 2nd International Conference on Cybernetics and Intelligent System (ICORIS 2020), Manado, Indonesia, 27–28 October 2020; pp. 1–6. [Google Scholar]
- Derr, K.; Hübl, R.; Ahmed, M.Z. Using Test Data for Successive Refinement of an Online Pre-Course in Mathematics. In Proceedings of the 14th European Conference on e-Learning (ECEL 2015), Hatfield, UK, 29–30 October 2015; pp. 173–180. [Google Scholar]
- Derr, K. Identifying Consistent Variables in a Heterogeneous Data Set: Evaluation of a Web-Based Pre-Course in Mathematics. Electron. J. E-Learn. 2017, 15, 82–93. [Google Scholar]
- Yarygina, O. Learning analytics of CS0 students programming errors: The case of data science minor. In Proceedings of the 23rd International Academic Mindtrek Conference, AcademicMindtrek 2020, Tampere, Finland, 29–30 January 2020; pp. 149–152. [Google Scholar]
- Caspari-Sadeghi, S. Applying Learning Analytics in Online Environments: Measuring Learners’ Engagement Unobtrusively. Front. Educ. 2022, 7, 840947. [Google Scholar] [CrossRef]
- Balasooriya, I.; Mor, E.; Rodríguez, M.E. Engagement analytics: A microlevel approach to measure and visualize student engagement. In Software Data Engineering for Network eLearning Environments; Caballé, S., Conesa, J., Eds.; Lecture Notes on Data Engineering and Communications Technologies; Springer: Cham, Switzerland, 2018; Volume 11, pp. 47–66. ISBN 978-3-319-68318-8. [Google Scholar]
- Lagman, A.C.; Adao, R.T. Embedding machine learning algorithm models in decision support system in predicting student academic performance using enrollment and admission data. In Proceedings of the 8th International Workshop on Computer Science and Engineering (WCSE 2018), Bangkok, Thailand, 28–30 June 2018; pp. 298–302. [Google Scholar]
- Muñoz-Merino, P.J.; Valiente, J.A.R.; Kloos, C.D. Inferring higher level learning information from low level data for the Khan Academy platform. In Proceedings of the the Third International Conference on Learning Analytics and Knowledge (LAK 2013), Leuven, Belgium, 8–12 April 2013; pp. 112–116. [Google Scholar]
- Tinto, V. Reflections on Student Persistence. Stud. Success 2017, 8, 1–8. [Google Scholar] [CrossRef]
- Zimmerman, B.J.; Bandura, A.; Martinez-Pons, M. Self-Motivation for Academic Attainment: The Role of Self-Efficacy Beliefs and Personal Goal Setting. Am. Educ. Res. J. 1992, 29, 663–676. [Google Scholar] [CrossRef]
- Morris, L.V.; Finnegan, C.; Wu, S.-S. Tracking student behavior, persistence, and achievement in online courses. Internet High. Educ. 2005, 8, 221–231. [Google Scholar] [CrossRef]
- Holmes, N. Student perceptions of their learning and engagement in response to the use of a continuous e-assessment in an undergraduate module. Assess. Eval. High. Educ. 2015, 40, 1–14. [Google Scholar] [CrossRef]
- Ferguson, R.; Clow, D.; Beale, R.; Cooper, A.J.; Morris, N.; Bayne, S.; Woodgate, A. Moving through MOOCS: Pedagogy, learning design and Patterns of Engagement. In Proceedings of the 10th European Conference on Technology Enhanced Learning (EC-TEL 2015), Toledo, Spain, 15–18 September 2015; pp. 70–84. [Google Scholar]
Publisher’s Note: MDPI stays neutral with regard to jurisdictional claims in published maps and institutional affiliations. |
© 2022 by the authors. Licensee MDPI, Basel, Switzerland. This article is an open access article distributed under the terms and conditions of the Creative Commons Attribution (CC BY) license (https://creativecommons.org/licenses/by/4.0/).