Abstract
Developing scientific reasoning (SR) is a central goal of science-teacher education worldwide. On a fine-grained level, SR competency can be subdivided into at least six skills: formulating research questions, generating hypotheses, planning experiments, observing and measuring, preparing data for analysis, and drawing conclusions. In a study focusing on preservice chemistry teachers, an organic chemistry lab course was redesigned using problem-solving experiments and SR video lessons to foster SR skills. To evaluate the intervention, a self-assessment questionnaire was developed, and a performance-based instrument involving an experimental problem-solving task was adapted to the target group of undergraduates. The treatment was evaluated in a pre-post design with control group (cook-book experiments, no SR video lessons) and alternative treatment group (problem-solving experiments, unrelated video lessons). Interrater reliability was excellent (ρ from 0.915 to 1.000; ICC (A1)). Data analysis shows that the adapted instrument is suitable for university students. First insights from the pilot study indicate that the cook-book lab (control group) only fosters students’ skill in observing and measuring, while both treatment groups show an increase in generating hypotheses and planning experiments. No pretest-posttest differences were found in self-assessed SR skills in the treatment groups. Instruments and data are presented and discussed.
1. Introduction
The study of scientific thinking dates back nearly a century and has been the interest of psychologists and science educators alike [1,2]. The origins lie at Piaget’s [3] theory of stages of cognitive development, formulating that adolescents are able to evaluate evidence and build hypothetical terms. One main focus of research covers the development of domain-general strategies of reasoning and problem-solving [2]. Terminology varies respectively by discipline as well as focus on research or teaching, yielding terms such as scientific reasoning, critical thinking (with regard to a science context), scientific discovery, scientific inquiry, or inquiry learning [2,4]. For the purpose of this article, scientific inquiry is used to describe teaching methods and activities aimed at the process of gaining scientific knowledge [5,6], whereas scientific reasoning (SR) refers to the cognitive skills required during a scientific inquiry activity [1,6,7]. Due to its cognitive nature, SR is viewed to be a competency consisting of a complex set of skills [8,9].
SR is needed for acquiring scientific knowledge [10], making it an essential competency in science and one of the most important key competencies in societies, increasing their technical progress. Therefore, developing SR is a central goal of school science as well as science-teacher preparation worldwide [11,12,13,14,15,16,17,18,19]. In the context of teaching, SR can be fostered by inquiry teaching activities [20]. Teachers, however, perceive the integration of inquiry into their lessons to be a difficult task [21,22], particularly if they have never conducted inquiry experiments before [5]. SR and methods of inquiry teaching should therefore already be introduced in preservice science-teacher education [5,15,23].
1.1. Models for Scientific Reasoning Competency
SR can be studied in problem-solving situations, making it accessible to assessment [1,24]. Using a “simulated discovery context” [1] (p. 3) gives detailed insight into the underlying processes while maintaining control over situational boundaries and prior knowledge needed by the participants. So far, several models of scientific reasoning ranging from global measures to more fine-grained descriptions have been proposed, yielding various instruments for measuring SR competency [25]. Models can be differentiated by target group, i.e., school and/or university context or other target groups [25], and by their purposes, such as assessment [10], description of learners’ activities in the process of SR, and problem-solving [26,27] or the description of important aspects of inquiry teaching [28]. Following Klahr and Dunbar’s [29] “Dual Space Search,” SR models usually cover the domain “conducting scientific investigations” [24] and exhibit at least a three-fold structure involving the facets “hypothesis,” “experiment,” and “conclusion”. However, the respective models differ in the degree of sub-division into up to 9 facets (see Figure 1) [10,24,26,28,29,30,31,32,33,34,35,36,37]. For example, the model developed by Fischer and colleagues [30] also covers the problem identification, that is, the analysis of the underlying phenomenon before the generation of hypotheses. The skill “generating hypotheses” is divided into “questioning” and “hypothesis generation”. Moreover, “testing hypotheses” is subdivided into a construction phase (cf. the different notions of planning in Figure 1) and “evidence generation,” which is comparable to experimentation and observation [26,28,31]. The last facet of Klahr and Dunbar’s [29] model can be divided into “evidence evaluation,” such as the preparation and interpretation of experimental findings [26,32], and “drawing conclusions”. “Communicating and scrutinizing” completes the facets [30], whereas, for example, in Kambach’s model [26], communication is viewed as a skill relevant to all processes involved in SR. Some models also specify the documentation [28] skill as a separate facet, while this is seen as a cross-process skill relevant to all other facets in other models [26]. Recently, modelling skills have also been proposed to amend skills in conducting investigations to cover a broader notion of SR [10,33,34].
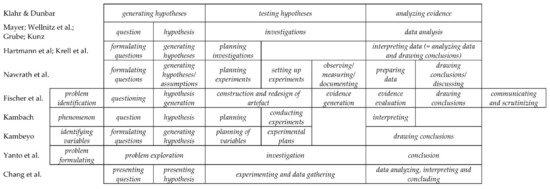
Figure 1.
Overview of some models for scientific reasoning competency subdomain “conducting scientific investigations” (compiled from [10,24,26,28,29,30,31,32,33,34,35,36,37]).
For this study, parts of Nawrath et al. and Kambach’s models [26,28] were combined to form a fine-grained model for measuring SR competency of preservice chemistry teachers. The skills formulating research questions, generating hypotheses, planning experiments, observing and measuring, preparing data for analysis, and drawing conclusions were included. In contrast to Kambach, the ability to specify the phenomenon is not assessed, but nevertheless, a phenomenon underlies the test instrument: A phenomenon is presented to the participants in an introduction and thereafter worked on. Furthermore, setting up experiments (cf. [28]) is not applied in our work, as this skill does not play a central role in scientific reasoning in chemistry and partly overlaps with practical work skills [24]. Documentation is understood as an overarching skill following Kambach [26] and is thus not part of the skill observing and measuring, which is contrary to the model by Nawrath et al. [28].
1.2. Assessment of Scientific Reasoning
SR competency can be assessed with domain-specific as well as domain-general instruments in different test formats, such as paper-pencil tests or experimental tests. For the latter, real or virtual/mental experiment can be used [25]. Both types can employ multiple-choice items [10,34] or open formats [27] and assess theoretical notions of SR, performance-related measures [26,27], or self-assessments [35]. Some studies also use mixed formats [25]. The different methods for eliciting these skills have different properties regarding time consumption, practicability, individual diagnostics, external influences, congruence, and simultaneity [27]. Performance tests showed significantly larger effect sizes than multiple-choice tests [38]. Moreover, as Shavelson [9] pointed out, multiple-choice assessment can hardly be seen as a situation closely representing real life. Furthermore, multiple-choice questions may measure knowledge that the participants might be able to state but might not be able to put to practice (inert knowledge, see for instance [39]). Hence, a performance-based assessment format seems to be more closely tied to the competency to be inferred. However, performance-based assessment can be time-consuming for participants and researchers alike. In addition, there are differences in measuring skills in individual and group work: while group work enhances communication and therefore makes thoughts accessible to the researcher [40], better performance in problem solving of groups compared to individuals has been demonstrated [41], which may limit reliability of assessment of individual skills in group work situations.
Adults, and therefore also preservice teachers, experience difficulties in dealing with SR tasks: they tend to design confounded experiments or to misinterpret evidence to be able to verify their beliefs [1]. Kunz [36], Khan, and Krell [42] as well as Hartmann et al. [10] found higher SR competency in preservice science teachers with two natural science subjects, while this made no difference in a study conducted by Hilfert-Rüppell et al. [43]. Furthermore, students’ SR competency differs by school type and progression in university studies [10,34,42]. Kambach’s [26] findings suggest that preservice biology teachers either are very apt in describing phenomena, generating hypotheses, and interpreting results or do not show these processes at all. As for the other processes, skills show more variation among the sample. However, students also lack experimental precision and demonstrate deficient reasoning for their choice of material in planning investigations. While conducting experiments, they tend not to consider blanks and hardly ever plan intervals or end points while measuring. Finally, they tend not to prepare their data for analysis or refer back to their hypotheses while interpreting. Overall, Kambach’s sample demonstrates variation of SR competency across the entire scale [26]. Hilfert-Rüppell et al. [43] demonstrated that preservice science teachers’ SR skills generating hypotheses and planning investigations are deficient. However, they found that students’ skill in planning investigations is moderated by their skill to generate hypotheses.
1.3. Learning Activities Supporting the Formation of Scientific Reasoning Competency
While the empirical and pedagogical literature has to offer various ideas and propositions for incorporating scientific inquiry into learning environments in schools and universities [44,45,46], preservice science teacher education still lacks inquiry learning activities [5,32]. For instance, lab courses mainly employ cook-book experiments [26,32,47]. If at all, the prospective teachers come into contact with forms of inquiry learning only in teaching methods courses in graduate education [10] or, if offered, while working or training in school laboratories [26]. Khan and Krell [42] therefore suggested a combination of contextualized, authentic scientific problem solving and its application to new contexts with tasks to reflect on problem solving and scientific reasoning on a meta level.
Still, the laboratory already “is the place of information overload” [48] (p. 266). Traditional cook-book experiments demand of the students to conduct, observe, note—and, hopefully, also interpret and understand—an enormous number of elements [48]. However, most of these demands are clearly stated in the laboratory instructions. Working on a problem-solving experiment, students need to perform a similar amount of tasks as well as additional cognitive activities, such as understanding the problem and devising their own strategy to solving it. Since these demands occupy working memory space not directed to learning, especially open inquiry is seen to be ineffective due to cognitive overload [49]. Furthermore, unfamiliarity with the method of problem-solving experiments from previous laboratories might add to these strains. Reducing the amount of cognitive demands students have to face simultaneously can be achieved by scaffolding the problem-solving process [50], providing learners with worked examples [51,52], examples before the problem-solving process [53,54], or structuring tasks [55,56]. For instance, Yanto et al. [32] found that structuring three subsequent experimental classes using the three main types of inquiry (structured, guided, and open inquiry, cf. [6]) in a stepped sequence fosters preservice biology teachers’ SR skills better than a traditional cook-book approach.
While the use of problem-solving and inquiry activities is widely seen as important, time-consuming learning activities like these do not always fit into tight schedules in schools and universities [44]. However, students may benefit from instruction before inquiry activities [57]. In a meta-analysis on the control of variables strategy, Schwichow et al. [38] showed that larger effects were achieved when learners were given a demonstration. Regarding chemistry laboratories, implementing instruction, such as demonstrations or examples as prelab learning activities, seems to be a promising approach [48]. This may be achieved by using educational videos [58,59,60].
1.4. Educational Videos as Pre Laboratory Activities
Educational videos are seen as a suitable medium to enhance students’ preparation in undergraduate chemistry, for instance, regarding content learning in organic chemistry [61], calculations for laboratory courses [62], as well as the use of laboratory equipment and procedures [62,63,64,65,66]. Methods for the development of effective videos are subsumed in [67]. Cognitive load theory (CLT) [68] and cognitive theory of multimedia learning (CTML) [69] inform design of effective videos. For instance, exclusion of unnecessary details helps keep students’ working memory from overloading (CLT), and making use of the visual and auditory channel in a way to avoid redundancy contributes to the effective use of both channels in educational videos (CTML). In terms of learning outcomes, Pulukuri et al. and Stieff et al. demonstrated that students preparing with videos statistically outperform a control group without any preparation [61] or an alternative treatment group preparing with a lecture [66]. However, many studies only report significant effects regarding the affective domain: students perceive videos to be helpful for preparation of and participation in the laboratory [60,62,63,64], even if no evidence can be found for their effectiveness on student performance [62,63]. Moreover, videos are still seen as rather new and motivating media in university education [70] and may therefore, like other newly advancing educational technologies, enjoy a novelty effect when used over a short period of time [61,70,71,72,73]. This may lead to an overestimation of their impact on student performance [61].
1.5. Self-Concept of Ability and Performance
“The relationship between self and performance is associated with an improvement in ability” [74] (p. 132). Self-concept is not a unidimensional construct but consists of various facets, such as academic self-concept [75]. Regarding students in an introductory chemistry course at university, House [76] showed that students’ academic self-concept is a better predictor of first-year achievement in chemistry than, for example, grade of college admission test. Moreover, facets of self-concept can be broken down further, i.e., academic self-concept can be further differentiated for different subjects [75]. For example, Atzert and colleagues demonstrated that self-concept of ability can be measured regarding science experimentation [77]. Sudria and colleagues [78] compared self-assessment and objective assessments of preservice chemistry teacher students’ practical skills in a chemistry laboratory. Their findings suggest that both students’ self-assessed skills at the beginning and during the course correlate with objective assessment of their performance by the lecturer. Self-concept of ability usually is assessed with regard to three different norms: individual (i.e., development of abilities over time), social (i.e., own ability in relation to others), and criterial (i.e., own ability with regard to an objective measure) [79]. However, in agreement with the criterial rubric Sudria et al. used, Atzert et al. showed that only the criterial norm informs school students’ self-concept of ability regarding science experimentation [77,78].
The aim of the project underlying this paper is both to foster preservice teachers’ SR competency by implementing a small number of problem-solving experiments and explanatory videos into an already-existing lab course and to measure a potential increase in SR competency. This paper first describes an instrument for objectively measuring SR skills as well as a self-assessment questionnaire in which students rate their SR skills with regard to the criterial norm before and after the intervention. Using data from the pilot study, a first insight is given into development of students’ SR skills.
2. Materials and Methods
2.1. Redesigning an Organic Chemistry Lab Course
Bearing in mind the insights from research on scientific reasoning and problem solving, we chose a 90-hour (3 credit points) organic chemistry lab course for second-year bachelor students [80] and redesigned 8 experiments into inquiry experimental problems cf. [6,46,81] The intervention constituted approximately 30% of all lab course activities. To account for the high complexity of a full problem-solving process, each experiment was designed to focus mainly on one SR skill; planning experiments was further subdivided into (a) planning experiments (general aspects), (b) using the control of variables strategy, and (c) using blanks. Control of variables is central to the SR skill planning experiments [38]; however, students might not be familiar with this strategy (cf. Section 3.1). Using blanks is a specific form of controlling variables; yet, due to its application in analytical chemical, problems might be more familiar to second-year students than control of variables strategy. Moreover, using blanks (i.e., negative and positive controls) does not only cover the experimental design but addresses validity since it but involves an examination of the method by (1) testing functionality of the reagents and (2) determining the limit of quantification [82,83,84]. Therefore, a distinction between using blanks and using the control of variables strategy was made.
For the lab course, this resulted in one experiment for each of the following skills: formulating research questions, generating hypotheses, planning experiments: general aspects, planning experiments: using the control of variables strategy, planning experiments: using blanks, observing and measuring, preparing data for analysis, and drawing conclusions. Students worked on the experiments in a stepped fashion: each consecutive experiment demanded of them to apply one more skill. Since formulating research questions and generating hypotheses are known to be more challenging to students than designing experiments and interpreting data [42,43], we organized the problem-solving experiments in a sequence from less to more challenging, starting with drawing conclusions in the first experiment up to the application of all skills in the final experiment [20]. Prior to the lab activity, each skill was explained and demonstrated to the students in a video lesson using examples different from those of the respective lab experiment. For instance, criteria for the generation of good scientific research questions or hypotheses were presented and applied to examples. In addition, students attended a colloquium on each experiment, discussing safety issues as well as specifics regarding experimental procedures and explanations with a lab assistant. In the redesigned course, the colloquium was also used to have students reflect on the content of each video lesson, i.e., students were asked to reproduce the main ideas taught in the video lesson and to apply them to the respective experiment. For example, they formulated their own research questions or presented their experimental planning. In the lab, students worked in pairs or groups of three if total participant count was odd. They handed in lab reports after the course. Details on the redesigned lab are reported elsewhere [81,85].
Two cohorts served as control groups. They received the organic chemistry laboratory as originally designed, i.e., without an explicit focus on inquiry experiments. Students were neither asked to formulate research questions, generate hypotheses, plan their own experiments, nor draw conclusions with regard to a hypothesis. Instead, they were given cook-book descriptions of the processes to be conducted. If applicable to the experiment, students were only asked to choose from a given set of qualitative tests (such as Schiff test or Tollens reagent) and to conduct blanks for comparison of test results. They were not given any of the video lessons nor provided with any information from the video lessons in the colloquiums. To account for motivational effects of video media [61,70], the study also used an alternative treatment group. This group received the redesigned lab course with problem-solving experiments but watched videos about practical laboratory skills [62,63,64,65,66], i.e., their videos were unrelated to SR skills.
2.2. Hypotheses
The overarching goal of our project was to determine whether the redesigned lab course helps in fostering SR competency. Therefore, we adapted an already validated test instrument for school students [27] to use with preservice chemistry teachers and complemented it with a self-assessment questionnaire. Psychometric properties were examined in a pilot study, and the following hypotheses were tested to account for the purposefulness of Kraeva’s instrument [27] for our target group:
Hypothesis 1.
In the adapted version of the test instrument, accompanying variables (prior knowledge, methodological knowledge, documentation skill) correlate in the same pattern as in Kraeva’s [27] findings.
Hypothesis 2.
Students in the control group score similar points in accompanying variables (prior knowledge, methodological knowledge, documentation skill) in pre- and post test since both test booklets are expected to be comparable, as they do not require prior knowledge [27].
Since traditional cook-book labs should already support some SR skills also associated with cook-book experiments, such as observing and measuring or preparing data for analysis [6,86,87], a control group was used to determine the extent to which the cook-book lab already fosters SR skills. Since both treatment groups worked on the problem-solving experiments in the lab, these were both expected to gain SR competency over the course of the lab. Nevertheless, the treatment group watching the SR-related videos (SR group) received more support in structuring the problem-solving process than the alternative treatment video group that watched SR-unrelated videos (alternative group). Therefore, the SR group was expected to benefit more from the lab course, which should manifest itself in a greater learning gain [61,66]. We hypothesized as follows:
Hypothesis 3.
Students in the control group show an increase in SR skills observing and measuring from pretest to posttest (i.e., after participation in the traditional lab course) but not in skills generating hypotheses, planning experiments, or drawing conclusions.
Hypothesis 4.
Students in both treatment groups (SR group and alternative group) show an increase in SR competency from pretest to posttest.
Hypothesis 5.
Students in the SR group show a greater learning gain in SR competency than students in the alternative group.
2.3. Data Collection
Following Shavelson’s [9] requirements for competency measurement, SR competency can be inferred from measuring a set of complex skills (such as formulating hypotheses, planning experiments, drawing conclusions, see Section 1.1) observable in a performance situation (experimental problem-solving tasks in the test instrument) close to a real-world situation (such as the problem-solving experiments in the laboratory). Tasks and scoring manuals need to be standardized for all participants (as presented below) and yield a score for the level of performance from which competency can be inferred. Moreover, the skills measured are supposed to be improvable through teaching and practice (that is, by the students attending a laboratory course such as the intervention presented) as well as dependent on disposition (such as self-regulation due to self-assessment in the respective skills). Therefore, we chose to build on an already validated, qualitative instrument with which the procedural structures of students’ problem-solving processes in an inquiry experiment can be determined using video recordings and written records [27]. Processes observed by Kraeva [27] were generating hypotheses, planning experiments, and drawing conclusions. Since Kraeva’s instrument was validated with high school students grade from 5 to 10, we report here the adaptation to the target group of university students. Using an expanded manual, the following SR skills were measured in the pilot study: generating hypotheses, planning experiments, observing and measuring, and drawing conclusions. Additional tasks assessing the skills developing questions and preparing data for analysis were constructed for the main study. Due to the pandemic, data on the latter two tasks so far could only be collected on five participants. Therefore, only data on the first four skills are presented here. As accompanying variables, prior knowledge, documentation skills, and methodological knowledge were assessed using Kraeva’s [27] instrument and manual. After the performance test, the students filled out a self-assessment questionnaire in which they assessed their own SR skills (developing questions, generating hypotheses, planning experiments, using control-of-variables strategy, using blanks, observing and measuring, preparing data for analysis, and drawing conclusions) on a five-point-scale. In addition, demographic data, such as age, gender, and parameters for students’ learning opportunities in chemistry (subject combination, semesters spent at university, and success in organic chemistry), were collected.
The test was administered in German with standardized test instructions before (pretest) and after completion of the lab course (posttest) with two similar test booklets on different chemical topics (adapted from [27]). The survey usually took place in pairs so that conversations could be recorded while videotaping. Data were collected anonymously with cameras positioned to only film participants’ hands and working surfaces. Students who did not wish to be videotaped were seated at a table without recording equipment. All students who participated in the study signed consent forms. Research procedures were in accordance with ethical standards of Technische Universität Braunschweig. Participants of cohort 2020 were recorded individually because of pandemic regulations. Nevertheless, due to using a think-aloud protocol (adapted from [88]), it was still possible to capture students’ thoughts.
2.4. Description of the Test Booklet
Paper-pencil tests started with two tasks on prior knowledge (Task 1: everyday knowledge and Task 2: chemical knowledge [27] (p. 81)) regarding the respective topic (e.g., surface tension). Students were then shown a slow-motion video of the phenomenon to be investigated and asked to document experimental procedures and observations (Task 3). This was followed by a videotaped sequence of tasks (“Experimental Tasks”, see Figure A1a and [27] (p. 71)), including a problem-solving experiment: first, students were asked to generate a hypothesis (hypothesis I) about the phenomenon in the slow-motion video (Experimental Task a). They were then asked to plan and conduct an experiment related to their hypothesis (experiment I), document the procedures, and draw a conclusion (Experimental Task b). This sequence was videotaped to observe students’ actual problem-solving process since protocols are known to not necessarily contain all steps discussed or conducted but rather a selection of those procedures that students judge worth reporting [89]. After the experimental task, students were asked to give an explanation for the phenomenon observed earlier in the slow-motion video using findings from their own experiments (Task 4; [27] (p. 82)). In Task 5 (see Figure A1b), they were asked to think of other conditions that affect the phenomenon and to develop a new research question and a corresponding hypothesis (hypothesis II). They then planned another experiment to test their hypothesis (experiment II), this time, however, without conducting it. Finally, a method for measuring surface tension was described to the students; they were given measurement data and asked to prepare a diagram for future analysis (Task 6, see Figure A2) as well as to extract information from the diagram to answer a question on data analysis.
2.5. Coding Manuals for Scientific Reasoning Skills
Transcriptions of the videotaped sequence and students’ written answers in the test booklet were analyzed using a coding manual. Accompanying variables were assessed in individual work from students’ written records. Table 1 shows which data sources were taken into account for analyses of SR skills.

Table 1.
Data sources for analyses of SR skills and accompanying variables.
Coding manuals for rating students’ SR skills were deductively developed from the literature [26,27,28,90] and inductively complemented with data from the control group. For calculation of interrater reliability, 13% of video transcripts and written records were coded by two raters (author 1 and a trained student research assistant, see Section 3.3). Students’ skills were assessed on four-point scales using the manual (see Table A1), whereby a full score indicated that the skill is fully developed. For example, there are four expressions for the skills observing and measuring as well as planning experiments I/II (e.g., no experiment, explicating planning, plan not suitable, plan suitable). The rating of the other skills is divided into four categories (e.g., for generating hypotheses I/II: no hypothesis, hypothesis, explanation, relationship). Points can be awarded independently of each other. The highest expression shown by a student was coded even if the same student did not demonstrate the respective level at another occasion in the task because it was assumed that once competency is expressed in performance, it can, in principle, be shown again and again.
2.6. Sample
Sixty preservice chemistry teacher students participated in the pilot study. Students were on average 22.1 years old (SD = 3.2). The majority identified as female (34 participants), 20 participants as male, and 4 did not provide a gender identification. Ratio of female to male students is usually high at Technische Universität Faculty of Humanities and Education Studies [91]. Average grade of school leaving certificate was 2.3 (SD = 0.55; “Abitur”, grades may vary from 1.0 to 4.0, with 1.0 being the best possible grade). Forty participants studied two STEM subjects, and 14 participants studied chemistry in combination with a non-STEM subject. The majority of the preservice teacher students in the sample planned to teach at secondary schools up to 12th grade (n = 42; German “Gymnasium”), and 15 participants planned to teach at secondary schools up to 9th or 10th grade (German “Realschule/Hauptschule”). On average, participants were in their 3rd semester of the bachelor (IQR = 2.75) when attending the organic chemistry laboratory. In addition, most participants (n = 50) had attended the corresponding lecture in organic chemistry before the laboratory; 29 had also passed the respective exam.
The data were collected between 2017 and 2020 in a pretest-posttest design, i.e., immediately before and after the laboratory course. Across all cohorts, some students refused videography, and thus, in some cases, less data are available for skills planning experiments I and observing and measuring than for those skills assessed from written records (see Table 2). The self-assessment questionnaire was not administered in the control group because it was not added to the study design until production of explanatory videos was completed. SR tasks assessing formulating research questions and preparing data for analysis were piloted in 2020 with a small cohort due to the pandemic.
Table 2.
Sample sizes for tasks A1 to A5 (accompanying variables, [27]) and SR skills by group in the pretest.
3. Results
Psychometric properties of the instruments were calculated using pretest data from the pilot study. Hypotheses were tested using pre- and posttest data. For a first insight into the effects of the newly designed laboratory, pre- and posttest measurements from the treatment groups were examined.
3.1. Self-Assessment Questionnaire
Self-assessment data on SR skills were collected in the treatment groups, totaling 32 participants. Item parameters of the self-assessment instrument show that students rated their initial abilities as rather high (M from 3.06 to 4.50, see Table 3; rating on a scale from 1 to 5). However, the majority of participants already judged their skills in using blanks, observing and measuring, and drawing conclusions to be very high before participating in the laboratory. Interestingly, for item “using control of variables strategy,” 15 out of 32 students chose the alternative answer “I don’t know,” resulting in only 17 valid answers. Item planning experiments was answered by six participants because it had only been added to the questionnaire in 2020.
Table 3.
Self-assessed scientific reasoning skills in the pretest (M, mean; SD, standard deviation; Pi, item difficulty; n, sample size; assessment on a 5-point scale).
Both items planning experiments and using control of variables strategy were excluded from calculations due to the small number of answers. Exploratory factor analysis of the remaining six items using principal component analysis (PCA) with varimax rotation showed a two-factor solution judging by Kaiser criterion (see Table 4) [93]. Rotated component matrix of the two-factorial structure indicated that the second factor consisted of only two items, using blanks and observing and measuring. These items identified as measuring skills not exclusively associated with inquiry experiments but also needed when conducting cook-book experimental procedures. Both items were excluded from the potential scale of SR skills. Reliability of the adapted four-item scale “self-assessment of scientific reasoning competency” gave an acceptable Cronbach’s α of 0.787 (4 items, n = 29) and a rather high inter-item correlation of 0.488 but still considerably lower than α [94,95]. No improvements of Cronbach’s α were achievable by further removal of items. Mean score on the four-item scale was M = 14.97 ± 2.442.
Table 4.
Rotated component matrix of self-assessed scientific reasoning skills in the pretest (n = 29). Factor loadings negligibly small (<0.3) [93] are set in gray.
Pre- and posttest data of self-assessment from the treatment groups were compared using the four-item-scale. Wilcoxon test was used due to small sample sizes. In both groups, a tendency for improvement toward the posttest is visible yet not significant (see Table 5).
Table 5.
Analysis of differences between pretest and posttest in SR skills in the treatment groups, calculated using Wilcoxon test (M, mean; SD, standard deviation; n, sample size; Z, parameter of Z-distribution; p, significance level).
3.2. Accompanying Variables
As Kraeva [14] had constructed the instrument for school students grade 5 to 10, yet as a tool not relying on prior knowledge, we investigated whether item difficulties in the accompanying variables (tasks A1 to A5) might hint at ceiling effects [92], potentially rendering the test too easy for university students. Means and item difficulties from pretest data of the pilot study show that students achieve moderate to high scores in the accompanying variables of the paper-pencil test. The test does not produce ceiling effects except for the task on content knowledge (see Table 6).
Table 6.
Item parameters of tasks A1 to A5, pretest data from the pilot study (M, mean; SD, standard deviation; Pi, item difficulty; n, sample size).
Kraeva [27] found small but significant correlations between tasks A1 (prior knowledge from everyday life) and A2 (prior knowledge from chemistry content knowledge) as well as between tasks A4 (explaining results) and A5 (generating a hypothesis and planning a corresponding but hypothetical experiment) and had hence subsumed tasks A1 and A2 to form a measure for prior knowledge and tasks A4 and A5 to measure methodological knowledge. We therefore expected to find similar correlations, while task A3 (“documentation”) was expected not to correlate (Hypothesis 1). Correlations with medium effect sizes [96] were found between tasks A1 and A2 (r = 0.332; p = 0.010; n = 60), tasks A3 and A1 (r = 0.320; p = 0.013; n = 60), and tasks A3 and A4 (r = 0.301; p = 0.019; n = 60), but no significant correlations with task A5 were found. For following analyses, tasks A1 and A2 were therefore subsumed as “prior knowledge” [27]; tasks A3, A4, and A5 were treated as separate items. In addition, task A5 was also rated using coding manuals for SR skills generating hypotheses II and planning experiments II (see Section 3.3).
Furthermore, we expected that pre- and posttest performance of participants would not differ in the accompanying variables, accounting for comparability of the pre- and posttest booklets (Hypothesis 2). To eliminate any potential influence from the intervention, only data from the control group were used in the comparison. Table 7 shows results from Wilcoxon signed-rank test indicating no significant differences between pretest and posttest performance of the control group in the accompanying variables.
Table 7.
Analysis of differences between pretest and posttest in tasks A1 to A5 in the control group, calculated using Wilcoxon signed-rank test (M, mean; SD, standard deviation; n, sample size; Z, parameter of Z-distribution; p, significance level).
3.3. Scientific Reasoning Skills
In the pilot study, students’ SR skills generating hypotheses I/II, planning experiments I/II, observing and measuring, and drawing conclusions were assessed on four-point scales using either their written records of tasks in individual work, such as generating hypotheses II or drawing conclusions, or video transcripts of tasks in pair work, such as planning experiments I or observing and measuring (see Table 1 for details on data source per skill). Since analysis of accompanying variables (see Section 3.2) showed that tasks A4 and A5 did not correlate as was found by Kraeva [27], Task A5 was used to assess students’ SR skills generating hypotheses II and planning experiments II in individual work with the manuals presented in Section 2.5 (Table A1).
Content validity of the instrument and manuals was established in a group discussion of eight members of staff in chemistry- and biology-teaching methodology. Reliability of the data collection was assessed by computing interrater reliabilities for the manuals. For this, the author conducted a rater training with the second rater (student research assistant) after the development of the manual, in which the manual was first presented in general and discussed using some examples. Finally, the student raters’ questions were clarified. Afterwards, the second rater coded 13% of the material and noted further questions and ambiguities, which were then clarified in a second rater training session. This was followed by the final coding of the material by both raters (13% student rater, entire data set author 1), from which the results of the ICC were computed. Intraclass correlation for absolute rater agreement in the presence of bias (ICC (A,1); [97]) was calculated, yielding excellent reliabilities ranging from 0.915 to 1.000 ([98]; see Table 8). Interrater reliabilities for the newly developed tasks measuring SR skills formulating research questions and preparing data for analysis were not yet calculated because of small sample sizes in 2020 due to pandemic regulations.
Table 8.
Interrater reliability (ICC (A,1); [97]) of the manuals for SR skills.
Means of students’ scores in the SR skills indicate that students already achieved moderate results in the pretest (see Table 9). Item difficulties were high but showed no ceiling effects, indicating that the tasks were not too easy for university students. For those skills that were both assessed in individual work (generating hypotheses II, planning experiments II) and in pair work (generating hypotheses I, planning experiments I), item parameters indicated that pair work assessment results in a higher item-difficulty value, i.e., tasks in pair work are easier for the students than tasks in individual work. Exploratory factor analysis (PCA, varimax rotation [93]) indicated a two-factorial structure judged by Kaiser criterion (see Table 10). Rotated component matrix showed that component 1 represents skills assessed in individual work using written records (generating hypotheses II, planning experiments II and drawing conclusions), and component 2 represents skills assessed in pair work using video data (planning experiments I and observing and measuring) as well as written records (generating hypotheses I). However, observing and measuring shows a negative loading and was therefore excluded.
Table 9.
Item parameters of objectively assessed scientific reasoning skills, pretest data from the pilot study (M, mean; SD, standard deviation; Pi, item difficulty; n, sample size). From 0 to 3 points were achievable in each skill.
Table 10.
Rotated component matrix of objectively assessed scientific reasoning skills in the pretest (n = 39). Factor loadings negligibly small (<0.3) [93] are set in gray.
Reliability was calculated for the potential scales “individual SR competency” using variables generating hypotheses II, planning experiments II and drawing conclusions as well as “SR competency in pair work” using variables generating hypotheses I and planning experiments I. Cronbach’s α = 0.578 was found to be rather low for the three-item scale “individual SR competency” (n = 60) but considerably higher than moderate average inter-item-correlation of 0.335 [95]. For the two-item-scale in pair work, Cronbach’s α = 0.292 was not acceptable (n = 39). Even though some authors argue that a Cronbach’s α lower than 0.7 is acceptable if item content is meaningful [94,95], we decided not to use the scales but to report analyses of SR skills item-wise.
Table 11 shows mean pretest and posttest scores for SR skills of all three groups. On average, students in all groups showed moderate abilities in all skills as well as a tendency for increase in the posttest in nearly all skills. Participants from the alternative treatment group seemed to achieve higher performances in pair work in the pretest (cf. generating hypotheses I, planning experiments I). To determine whether the traditional laboratory already enhances students’ SR skills (Hypothesis 3), two cohorts served as control groups. They received the organic chemistry laboratory as originally designed, i.e., without an explicit focus on inquiry experiments. Pre- and posttest data from the control group were tested for differences in the variables generating hypotheses I/II, planning experiments I/II, observing and measuring, and drawing conclusions. Differences between pre- and posttest were only found to be statistically significant for the skill observing and measuring (see Table 11). In this skill, the posttest shows a ceiling effect, as all participants achieved the full score in the posttest. Hence, the posttest may have been too easy for the participants of the control group regarding this skill.
Table 11.
Comparison of pretest and posttest mean scores in objectively assessed scientific reasoning skills, calculated using Wilcoxon signed-rank test (M, mean; SD, standard deviation; n, sample size; Z, parameter of Z-distribution; p, significance level). p-values for nonsignificant test results (p > 0.05) are set in gray.
Furthermore, we hypothesized that both treatment groups would show an increase in SR competency (Hypothesis 4). Both groups had significantly higher mean scores in generating hypotheses and planning experiments in the posttest than in the pretest (see Table 11). Interestingly, for the SR group, this only applies to the skills assessed in pair work, while for the alternative group, the increase is only significant for the skills assessed in individual work. Regarding the alternative group, skills assessed in pair work were already rather high in the pretest compared to individual skills. If pretest values are high, there is less room for improvement. Nevertheless, a total number of 13 participants equal 6 groups at most, reducing validity of the comparison. Furthermore, in contrast to the control group, neither treatment group achieved a significant increase in observing and measuring toward the posttest. Neither the treatment groups nor the control group showed an increase in the skill drawing conclusions. Still, it should be noted here that the small sample sizes of the pilot study, especially in the alternative group, limit generalizability of these findings.
So far, performances of control and treatment groups were compared independently of each other, yielding five significant achievement gains. Hypothesis 5 assumed that students in the SR group show a greater learning gain in SR competency than students in the alternative group. To enable a comparison among the groups, gains in each skill were calculated by distracting participants’ pretest scores from their posttest scores. Then, Kruskal–Wallis H test was performed on the pre-post differences, indicating the only group difference in the skill planning experiments I (see Table 12). A post-hoc test (with Bonferroni correction) showed that the group difference resulted only from a significant difference of learning gain between alternative group and SR group (z = −2.487; p = 0.039). So far, it can be concluded that control group and alternative group did not differ in learning gains, but participating in the SR group led to a significantly larger learning gain in the skill planning experiments I. Beyond that skill, no other differences were found between alternative and SR groups or control group and SR group. As was stated before, limitations regarding generalizability of these findings apply due to the small sample sizes.
Table 12.
Comparison of groups for mean pretest-posttest differences in objectively assessed scientific reasoning skills, calculated using Kruskal–Wallis H test (M, mean of pre-post difference; SD, standard deviation; n, sample size; H, parameter of H-distribution; p, significance level). p-values for nonsignificant test results (p > 0.05) are set in gray.
4. Discussion and Limitations of the Study
In this study, an already validated, performance-based instrument for description of SR processes of school students was adapted for measurement of SR competency of preservice chemistry teachers. Accompanying variables adopted from Kraeva [27] as well as tasks measuring SR skills were found to be suitable for preservice chemistry teachers regarding difficulty and comparability of test booklets (Hypothesis 2). Kraeva’s performance test originally only involved generating hypotheses, planning experiments, and drawing conclusions in a mixed format of individual and pair work. Due to the fact that, in contrast to Kraeva [27], no significant correlation between accompanying variables A4 and A5 could be identified, these variables were not summarized to form a measure for methodological knowledge but treated as separate items. Even though Hypothesis 1 therefore had to be rejected in parts, the data from A5 could now be used to assess SR skills generating hypotheses II and planning experiments II from individual work. Furthermore, the test was extended to measure observing and measuring in pair work in the pilot study. Factor analysis indicated a two-factorial structure of SR skills, separating skills assessed in individual work from those assessed in pair work. This is in accordance with findings from other studies comparing individual and group performance [40,41]. Even though reliabilities were low, tasks assessing skills individually yielded slightly more reliable data. Still, excellent interrater reliabilities were found indicating reliability of the method for collecting data on SR skills. Hence, for use in the main study, new tasks assessing skills formulating research questions and preparing data for analysis were added to the test. Factor analysis of SR self-assessment items indicated that the skills using blanks and observing and measuring load on a different factor than the other SR skills, such as formulating research questions or generating hypotheses. The former two skills seem to be not only relevant to inquiry experiments exclusively but also to cook-book experimentation. For example, Sudria and colleagues included observing in a set of practical laboratory skills [78].
The second aim of this project was to enhance preservice chemistry teachers’ SR competency through experimental problem solving and explanatory videos in an organic chemistry lab course. First insights can be inferred from comparison of control and treatment groups in the pilot study. Even though 60 students in total participated in the pilot study, the rather small sample sizes in each group still limit generalizability of the findings. Both SR self-assessment and objective assessment data show that preservice chemistry teachers in their second year at university already demonstrate substantial skill before attending the laboratory. That is, without having received any explicit instruction on inquiry learning or scientific reasoning so far. In comparison to instruments used with secondary preservice science teachers in other studies [10,34,42], the instrument presented here seems to be less difficult. This is in accordance with the origin of the instrument, which was originally developed for school students [27]. Nevertheless, increases in several skills were measurable (see below).
Students rated their own abilities in using blanks, drawing conclusions and observing and measuring as particularly highly developed, while lower self-assessment of skills was found for formulating research questions and using control of variables strategy. Especially the control of variables strategy may be unknown to some preservice teacher students in their second year of the bachelor, which might explain why students more frequently chose the alternative answer “I don’t know” with this item. A similar pattern was found in the SR skills assessed from students’ performance: students’ individual performance was found to be relatively high in drawing conclusions and moderate in generating hypotheses and planning experiments. This is accordance with findings from Krell and colleagues as well as Khan and Krell that students’ performances are lower in formulating research questions and generating hypotheses than in planning investigations, analyzing data, and drawing conclusions [34,42]. As was also demonstrated before [41], students scored more points in skills assessed in pair work than in individual work: Performance for generating hypothesis I and planning experiments I (assessed in pair work) tended to be higher than for generating hypotheses II and planning experiments II (assessed in individual work). This is in accordance with findings that groups have higher success in problem solving than individuals because they engage more actively in explanatory activities [41,99]. However, it cannot be said with certainty that the higher score is exclusively due to the work in pairs. Stiller and colleagues identified several features rendering test items difficult [100], such as text length, use of specialist terms, and cognitive demands, i.e., use of abstract concepts (for instance, also [101] in this special issue). A comparison of the experimental task and task 5 (see Figure A1) indicates no difference in text length or use of specialist terms. Tasks involving abstract concepts require participants to build “hypothetical assumptions […] not open to direct investigation” [100] (p. 725). This only holds true for planning experiments II (planning of a hypothetical experiment) but not for generating hypotheses I/II, as these are both hypothetical tasks. Moreover, students were not observed to change their answers in task generating hypotheses I after writing up their answers to the experimental task. Kraeva’s test construction followed the Model of Hierarchical Complexity in chemistry (MHC) [102], which describes task complexity with regard to the number of elements to be processed and their level of interrelatedness. Both the experimental task and task 5 were constructed on the highest level (“multivariate interdependencies”) [102] (p. 168); therefore, both tasks require the same cognitive demands. Additionally, the students were videotaped while solving the experimental task, which may have led to greater care and effort in solving the task. Therefore, it cannot be conclusively clarified whether this is an effect of pair work.
Regarding the increase in skill achieved through participation in the lab course, some learning gains were found in the control and treatment groups. As was expected for the control group, an increase was only found for observing and measuring but not for generating hypotheses, planning experiments, or drawing conclusions (Hypothesis 3). This may be attributed to the fact that in the traditional laboratory, students were not asked to generate their own research questions or hypotheses. Hence, there was also no need for them to reason with respect to question or hypothesis, consequently yielding no increase in these skills [6,86,87]. Hypothesis 3 was therefore provisionally accepted. Increases in SR skills in the treatment groups were not as clear cut as hypothesized. Both treatment groups showed an increase in generating hypotheses and planning experiments, whereas no increase was found for observing and measuring and drawing conclusions. Thus, Hypothesis 4 could be provisionally accepted for the respective skills. As the control group’s skill in observing and measuring increased, an increase would have been expected in the treatment groups as well. This may be attributed to several possible reasons: On the one hand, cognitive demands placed on the treatment groups due to the additional and new learning objectives in the intervention (such as generating hypotheses) could have been too high, therefore reducing cognitive capacity directed at skills students might have perceived as already familiar to them. On the other hand, since observing and measuring showed negative factor loading on SR skills in pair work, there might as well be an issue with the assessment of this skill either in the manual or in the task. Hence, this skill should undergo revision before start of the main study. So far, Hypothesis 5 had to be rejected since the SR group only showed a significantly larger learning gain than the alternative treatment group in one skill, planning experiments I, but no difference in learning gain compared to the control group. Since the data analyzed here belonged to the pilot study and therefore only give a first indication of the effectiveness of the intervention, both hypotheses 4 and 5 will have to be tested again in the main study.
Qualitative assessment was chosen to arrange for a more individualized view on students’ skills; yet, quantitative analyses show that small sample sizes are a serious limitation of the presented investigation. This applied particularly to the very small sizes of the treatment groups due to the piloting. Resulting from this, issues arose for the ratio of items to participants in the factor analyses as well as regarding the low reliabilities of the instruments. Furthermore, conducting parts of the performance tasks in pair work led to reliability issues in comparison to individually assessed SR skills, negating the advantage of the pair-work format in enhancing communication and hence accessibility of participants’ thoughts [40]. In addition, since the original test instrument was constructed for school students, we expected preservice teachers to achieve moderate to high scores. In some variables however, this produced ceiling effects [92], such as in the control group’s posttest for performance-based SR skill observing and measuring or in the self-assessment in the respective skill. This may lead to a failure of the instruments in differentiating potential gains in these skills due to the treatment. Furthermore, negative factor loading of SR skill observing and measuring demands that the respective task and manual should undergo revision before conducting the main study. Regarding the late introduction of the self-assessment questionnaire in the design of the study, comparison of self-assessed skills in the control group was impossible. Moreover, no gains in self-assessment of skills were found for the treatment groups. It cannot be ruled out that the pandemic had an influence on student motivation in the 2020 cohort, as lab activities had to be conducted under strict pandemic restrictions, for example, prohibiting pair work in the lab. Furthermore, the pandemic may also have had an impact on the researchers’ and assistants’ performance in the laboratory due to uncertainties in the planning process. Since the 2020 cohort was part of the SR group, this limits the scope of the findings from comparison of treatment groups even more. New pandemic regulations may also hinder the further conduction of this study.
5. Conclusions and Future Directions
With the performance-based instrument presented here, so far, four SR skills as well as gains in SR skills could be measured on a fine-grained level. Hence, the main aim of this pilot study was partially achieved. For the further course of the project, assessment tasks for the skills developing research questions and preparing data for analysis will undergo further investigation as soon as pandemic restrictions permit standardized test administration and delivering of the laboratory. In addition, task and manual assessing observing and measuring will be inspected critically. As for the self-assessment questionnaire, items for planning experiments and using control of variables strategy need further testing also regarding students’ understanding of the items. For a more thorough investigation into the effects of the redesigned laboratory on preservice chemistry teacher students’ objectively measured and self-assessed SR skills, a main study will be conducted. It remains to be seen what impact the interventions will have on students’ scientific reasoning.
Author Contributions
Conceptualization, B.E.B. and C.E.B.; methodology, B.E.B.; validation, B.E.B., C.E.B. and K.H.; formal analysis, B.E.B. and C.E.B.; investigation, B.E.B.; resources, K.H.; data curation, C.E.B.; writing—original draft preparation, B.E.B.; writing—review and editing, C.E.B. and K.H.; visualization, B.E.B.; supervision, K.H.; project administration, C.E.B.; funding acquisition, C.E.B. and K.H. All authors have read and agreed to the published version of the manuscript.
Funding
This research was funded by (a) Project PEGASUS: Niedersächsisches Ministerium für Wissenschaft und Kultur as part of their program “Innovative Lehr- und Lernkonzepte Innovation Plus” (2019/20), grant number 93 (b) DiBS Chemie: The project is part of the “Qualitätsoffensive Lehrerbildung”, a joint initiative of the Federal Government and the Länder which aims to improve the quality of teacher training. The program is funded by the Federal Ministry of Education and Research, grant number 01JA2028. The authors are responsible for the content of this publication. Funding of APC: The authors acknowledge support by the Open Access Publication Funds of Technische Universität Braunschweig.
Institutional Review Board Statement
All participants were students at a German university. They took part voluntarily and signed an informed consent form. Video data were collected with cameras positioned to only film participants’ hands and working surfaces. Students who did not wish to be videotaped were seated at a table without recording equipment. Pseudonymization of participants was guaranteed during the study. Due to all these measures in the implementation of the study, an audit by an ethics committee was waived.
Informed Consent Statement
Written informed consent was obtained from all participants in the study.
Data Availability Statement
Video data are not publicly available due to privacy reasons. Other data is available upon request from the authors.
Acknowledgments
We thank Lisanne Kraeva for critical remarks on the adapted instrument and support with data collection, Jaqueline Jacob and Kristina Schaate for support on video production, Dominik Stockmann and Kristina Schaate for support in transcription, data input and rating as well as K. Sachse and all student research assistants for support in the laboratory. Moreover, we thank all students of Organsiche Chemie 0 for their participation in the study. Finally, we are thankful for critical remarks to an earlier draft by the special issue editors and three anonymous reviewers whose recommendations substantially improved the quality of the article.
Conflicts of Interest
The authors declare no conflict of interest. The funders had no role in the design of the study; in the collection, analyses, or interpretation of data; in the writing of the manuscript, or in the decision to publish the results.
Appendix A. Excerpts from Test Booklet and Coding Manual
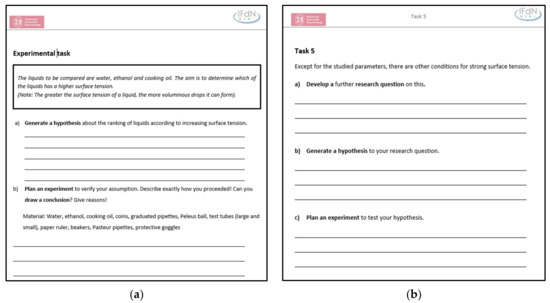
Figure A1.
(a) The experimental task “surface tension,” measuring SR skills generating hypotheses I, planning experiments I, and drawing conclusions; (b) Task 5, measuring SR skills developing research questions, generating hypotheses II, and planning experiments II.
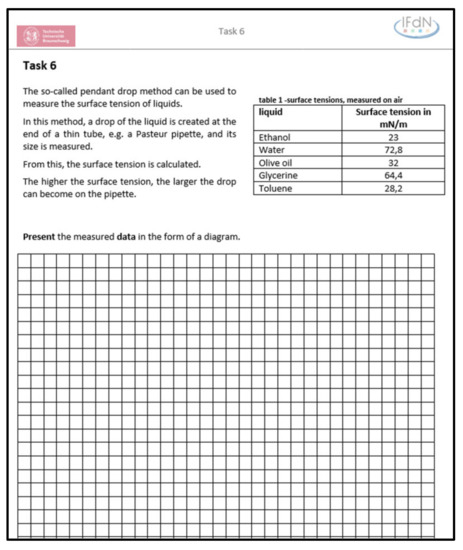
Figure A2.
Task 6. Preparing data for analysis.
Table A1.
Excerpt from coding manual for SR skills developing research questions, generating hypotheses I/II, planning experiments I/II, observing and measuring, preparing data for analysis, drawing conclusions. A maximum score of 3 points can be achieved in each skill. Based on [26,27,28,90].
Table A1.
Excerpt from coding manual for SR skills developing research questions, generating hypotheses I/II, planning experiments I/II, observing and measuring, preparing data for analysis, drawing conclusions. A maximum score of 3 points can be achieved in each skill. Based on [26,27,28,90].
| Developing Research Questions | Points |
| No question is formulated or the question does not address the topic. | 0 |
| The question addresses the subject and can be answered using scientific methods. | 1 |
| The question is formulated intelligibly and as an open-ended question. | 1 |
| The variables specified in the question denote general concepts (not individual cases) 1. | 1 |
| Generating Hypotheses I/II | Points |
| No hypothesis is generated or the hypothesis does not address the topic and/or the statement is formulated using “may,” “might,” “could,” “can,” or other expressions differentiating a scientific hypothesis from a mere assumption. | 0 |
| A prediction or hypothesis addressing the topic is formulated. | 1 |
| The prediction/hypothesis is complemented by an explanation in one or more sentences. The guess/hypothesis is investigable. The guess/hypothesis is falsifiable. | 1 |
| The prediction/hypothesis specifies a relationship between to variables (can also be represented by bullet points or arrows/drawings). | 1 |
| Planning Experiments I/II | Points |
| No experiments are named or planned. | 0 |
| The student explicates planning (also partial steps). | 1 |
| The student plans (and executes 2) an experiment that is not suitable. | 2 |
| The student plans (and executes 2) an experiment that is suitable. | 3 |
| Observing and Measuring | Points |
| No observation or measurement is explicated or the observation/measurement is entirely incorrect or the observation/measurement does not address the topic. | 0 |
| The student explicates that he/she is observing/measuring. The observation/measurement is relevant to the topic and refers to what is happening in the experiment. Few mistakes are made in the (order of the) observation/measurement. | 1 |
| The observation/measurement contains the essential elements of what is happening in the experiment. Data are recorded correctly but using an unsuitable method of measurement. | 2 |
| The observation/measurement is purposeful, exhaustive and correct. Data are recorded correctly by using a suitable method of measurement. | 3 |
| Preparing Data for Analysis | Points |
| Task is not answered. | 0 |
| Correct type of diagram (line graph/bar chart) is chosen. Variables are correctly assigned to the axes. Axes labels (arrows, categories, or physical quantities and respective units of measurement) are correct. | 1 |
| Ratio scales start at zero or explicitly show that the range does not start at zero. Similar distances on a ratio scale denote similar differences in the physical quantity. Tick mark labels/category labels are provided. Lengths of the axes are chosen sensibly. | 1 |
| The diagram is neatly drawn. All data points/bars are plotted. Diagram does not extend beyond the specified drawing area. Data points/bars are legible and displayed uniformly and neatly. | 1 |
| Drawing Conclusions | Points |
| Task is not answered or answer does not address the topic. | 0 |
| The student names a result. | 1 |
| The student’s answer is related to the hypothesis (confirmation or rejection). | 1 |
| The student’s answer is based on his/her observation/measurement. | 1 |
1 Anchor example: general concept: “surface tension of liquids”; individual case: “surface tension of water”. 2 Only relevant for rating of SR skill “planning experiments I” in videotaped sequence.
References
- Zimmerman, C.; Klahr, D. Development of Scientific Thinking. In Stevens’ Handbook of Experimental Psychology and Cognitive Neuroscience, 4th ed.; Wixted, J.T., Ed.; John Wiley & Sons Inc.: New York, NY, USA, 2018; pp. 1–25. [Google Scholar]
- Zimmerman, C. The Development of Scientific Reasoning Skills. Dev. Rev. 2000, 20, 99–149. [Google Scholar] [CrossRef] [Green Version]
- Piaget, J. The Stages of the Intellectual Development of the Child. In Educational Psychology in Context. Readings for Future Teachers; Marlowe, B.A., Canestrari, A.S., Eds.; Sage Publications: Thousand Oaks, CA, USA, 2006; pp. 98–106. [Google Scholar]
- Lederman, N.G.; Niess, M.L. Problem Solving and Solving Problems: Inquiry About Inquiry. Sch. Sci. Math. 2000, 100, 113–116. [Google Scholar] [CrossRef]
- Windschitl, M. Inquiry projects in science teacher education. What can investigative experiences reveal about teacher thinking and eventual classroom practice? Sci. Educ. 2003, 87, 112–143. [Google Scholar] [CrossRef]
- Banchi, H.; Bell, R. The Many Levels of Inquiry. Sci. Child. 2008, 46, 26–29. [Google Scholar]
- Constantinou, C.P.; Tsivitanidou, O.E.; Rybska, E. What Is Inquiry-Based Science Teaching and Learning? In Professional Development for Inquiry-Based Science Teaching and Learning; Tsivitanidou, O.E., Ed.; Springer: Cham, Switzerland, 2018; Volume 5, pp. 1–23. [Google Scholar]
- Shavelson, R.J. On the measurement of competency. Empir. Res. Vocat. Educ. Train. 2010, 2, 41–63. [Google Scholar] [CrossRef]
- Shavelson, R.J. Assessing business-planning competence using the Collegiate Learning Assessment as a prototype. Empir. Res. Vocat. Educ. Train. 2012, 4, 77–90. [Google Scholar] [CrossRef]
- Hartmann, S.; Upmeier von Belzen, A.; Krüger, D.; Pant, H.A. Scientific Reasoning in Higher Education. Z. Psychol. 2015, 223, 47–53. [Google Scholar] [CrossRef]
- American Association for the Advancement of Science. Atlas of Science Literacy Volume 1; American Association for the Advancement of Science: Washington, DC, USA, 2007. [Google Scholar]
- Department for Education. Science Programmes of Study: Key Stage 4. 2014. Available online: https://www.gov.uk/government/uploads/system/uploads/attachment_data/file/381380/Science_KS4_PoS_7_November_2014.pdf (accessed on 15 August 2016).
- Kultusministerkonferenz. Bildungsstandards Im Fach Chemie Für Den Mittleren Schulabschluss. Beschluss Der Kultusministerkonferenz Vom 16.12.2004; Luchterhand: München, Germany, 2005; Available online: http://db2.nibis.de/1db/cuvo/datei/bs_ms_kmk_chemie.pdf (accessed on 27 March 2019).
- Kultusministerkonferenz. Bildungsstandards Im Fach Chemie Für Die Allgemeine Hochschulreife. Beschluss Der Kultusministerkonferenz Vom 18.06.2020; Wolters Kluwer: Bonn, Germany, 2020; Available online: https://www.kmk.org/fileadmin/Dateien/veroeffentlichungen_beschluesse/2020/2020_06_18-BildungsstandardsAHR_Chemie.pdf (accessed on 27 April 2021).
- Morrell, P.D.; Park Rogers, M.A.; Pyle, E.J.; Roehrig, G.; Veal, W.R. Preparing Teachers of Science for 2020 and Beyond. Highlighting Changes to the NSTA/ASTE Standards for Science Teacher Preparation. J. Sci. Teach. Educ. 2020, 31, 1–7. [Google Scholar] [CrossRef] [Green Version]
- Organisation for Economic Co-operation and Development. PISA 2006 Science Competencies for Tomorrow’s World. Volume 1: Analysis; OECD: Paris, France, 2007. [Google Scholar] [CrossRef]
- National Research Council. A Framework for K-12 Science Education: Practices, Crosscutting Concepts, and Core Ideas; The National Academies Press: Washington, DC, USA, 2012. [Google Scholar] [CrossRef]
- Hacıömeroğlu, E.S.; Hacıömeroğlu, G. Öğretmen adaylarının mantıksal düşünme becerilerinin incelenmesi: Longeot bilişsel gelişim testi. Türk Bilgisayar ve Matematik Eğitimi Dergisi 2018, 9, 413–448. [Google Scholar]
- Milli Eğitim Bakanlığı. Ortaöğretim Kimya Dersi öğretim Programı. (9, 10, 11 ve 12. siniflar). 2018. Available online: https://mufredat.meb.gov.tr/Dosyalar/201812102955190-19.01.2018%20Kimya%20Dersi%20%C3%96%C4%9Fretim%20Program%C4%B1.pdf (accessed on 18 August 2021).
- Bell, R.L.; Smetana, L.; Binns, I. Simplifying Inquiry Instruction. Assessing the Inquiry Level of Classroom Activities. Sci. Teach. 2005, 72, 30–34. [Google Scholar]
- Cheung, D. Facilitating Chemistry Teachers to Implement Inquiry-based Laboratory Work. Int. J. Sci. Math. Educ. 2007, 6, 107–130. [Google Scholar] [CrossRef]
- Capps, D.K.; Crawford, B.A.; Constas, M.A. A Review of Empirical Literature on Inquiry Professional Development. Alignment with Best Practices and a Critique of the Findings. J. Sci. Teach. Educ. 2012, 23, 291–318. [Google Scholar] [CrossRef]
- Kultusministerkonferenz. Ländergemeinsame Inhaltliche Anforderungen Für Die Fachwissenschaften und Fachdidaktiken in Der Lehrerbildung. Beschluss der Kultusministerkonferenz Vom 16.10.2008 i. d. F. vom 16.05.2019. Available online: https://www.kmk.org/fileadmin/Dateien/veroeffentlichungen_beschluesse/2008/2008_10_16-Fachprofile-Lehrerbildung.pdf (accessed on 14 July 2017).
- Mayer, J. Erkenntnisgewinnung als wissenschaftliches Problemlösen. In Theorien in der Biologiedidaktischen Forschung; Krüger, D., Vogt, H., Eds.; Springer: Berlin/Heidelberg, Germany, 2007; pp. 177–186. [Google Scholar]
- Opitz, A.; Heene, M.; Fischer, F. Measuring scientific reasoning—A review of test instruments. Educ. Res. Eval. 2017, 23, 78–101. [Google Scholar] [CrossRef]
- Kambach, M. Experimentierprozesse von Lehramtsstudierenden der Biologie; Logos-Verlag: Berlin, Germany, 2018. [Google Scholar]
- Kraeva, L. Problemlösestrategien von Schülerinnen und Schülern diagnostizieren; Logos-Verlag: Berlin, Germany, 2020. [Google Scholar]
- Nawrath, D.; Maiseyenka, V.; Schecker, H. Experimentelle Kompetenz. Ein Modell für die Unterrichtspraxis. Prax. Nat. Phys. Sch. 2011, 60, 42–49. [Google Scholar]
- Klahr, D.; Dunbar, K. Dual Space Search During Scientific Reasoning. Cogn. Sci. 1988, 12, 1–48. [Google Scholar] [CrossRef]
- Fischer, F.; Kollar, I.; Ufer, S.; Sodian, B.; Hussmann, H.; Pekrun, R.; Neuhaus, B.; Dorner, B.; Pankofer, S.; Fischer, M.; et al. Scientific Reasoning and Argumentation: Advancing an Interdisciplinary Research Agenda in Education. Frontline Learn. Res. 2014, 5, 28–45. [Google Scholar] [CrossRef]
- Kambeyo, L. The Possibilities of Assessing Students’ Scientific Inquiry Skills Abilities Using an Online Instrument. A Small-Scale Study in the Omusati Region, Namibia. Eur. J. Educ. Sci. 2017, 4, 1–21. [Google Scholar] [CrossRef]
- Yanto, B.E.; Subali, B.; Suyanto, S. Improving Students’ Scientific Reasoning Skills through the Three Levels of Inquiry. Int. J. Instr. 2019, 12, 689–704. [Google Scholar] [CrossRef]
- Wellnitz, N.; Fischer, H.E.; Kauertz, A.; Mayer, J.; Neumann, I.; Pant, H.A.; Sumfleth, E.; Walpuski, M. Evaluation der Bildungsstandards—eine fächerübergreifende Testkonzeption für den Kompetenzbereich Erkenntnisgewinnung. Z. Didakt. Nat. 2012, 18, 261–291. [Google Scholar]
- Krell, M.; Redman, C.; Mathesius, S.; Krüger, D.; van Driel, J. Assessing Pre-Service Science Teachers’ Scientific Reasoning Competencies. Res. Sci. Educ. 2020, 50, 2305–2329. [Google Scholar] [CrossRef]
- Chang, H.-P.; Chen, C.-C.; Guo, G.-J.; Cheng, Y.-J.; Lin, C.-Y.; Jen, T.-H. The Development of a Competence Scale for Learning Science. Inquiry and Communication. Int. J. Sci. Math. Educ. 2011, 9, 1213–1233. [Google Scholar] [CrossRef] [Green Version]
- Kunz, H. Professionswissen von Lehrkräften der Naturwissenschaften im Kompetenzbereich Erkenntnisgewinnung. Ph.D. Thesis, Universität Kassel, Kassel, Germany, 2011. Available online: https://kobra.bibliothek.uni-kassel.de/bitstream/urn:nbn:de:hebis:34-2012012040403/9/DissertationHagenKunz.pdf (accessed on 9 August 2021).
- Grube, C.R. Kompetenzen naturwissenschaftlicher Erkenntnisgewinnung. Untersuchung der Struktur und Entwicklung des wissenschaftlichen Denkens bei Schülerinnen und Schülern der Sekundarstufe, I. Ph.D. Thesis, Universität Kassel, Kassel, Germany, 2011. Available online: https://kobra.uni-kassel.de/handle/123456789/2011041537247 (accessed on 21 August 2021).
- Schwichow, M.G.; Croker, S.; Zimmerman, C.; Höffler, T.N.; Härtig, H. Teaching the control-of-variables strategy. A meta-analysis. Dev. Res. 2016, 39, 37–63. [Google Scholar] [CrossRef] [Green Version]
- Renkl, A.; Mandl, H.; Gruber, H. Inert Knowlede: Analyses and Remedies. Educ. Psychol. 1996, 31, 115–121. [Google Scholar] [CrossRef]
- Leuders, T.; Naccarella, D.; Philipp, K. Experimentelles Denken—Vorgehensweisen beim innermathematischen Experimentieren. J. Math.-Didakt. 2011, 32, 205–231. [Google Scholar] [CrossRef]
- Okada, T.; Simon, H.A. Collaborative Discovery in a Scientific Domain. Cogn. Sci. 1997, 21, 109–146. [Google Scholar] [CrossRef]
- Khan, S.; Krell, M. Scientific Reasoning Competencies: A Caseof Preservice Teacher Education. Can. J. Sci. Math. Technol. Educ. 2019, 19, 446–464. [Google Scholar] [CrossRef] [Green Version]
- Hilfert-Rüppell, D.; Looß, M.; Klingenberg, K.; Eghtessad, A.; Höner, K.; Müller, R.; Strahl, A.; Pietzner, V. Scientific reasoning of prospective science teachers in designing a biological experiment. Lehr. Auf. Dem. Prüfstand 2013, 6, 135–154. [Google Scholar]
- Hofstein, A.; Lunetta, V.N. The Laboratory in Science Education. Foundations for the Twenty-First Century. Sci. Educ. 2004, 88, 28–54. [Google Scholar] [CrossRef]
- Koenig, K.; Schen, M.; Bao, L. Explicitly Targeting Pre-service Teacher Scientific Reasoning Abilities and Understanding of Nature of Science through an Introductory Science Course. Sci. Educ. 2012, 21, 1–9. [Google Scholar]
- Bruckermann, T.; Schlüter, K. Forschendes Lernen im Experimentalpraktikum Biologie; Springer: Berlin/Heidelberg, Germany, 2017. [Google Scholar] [CrossRef]
- Fischer, R.A. Den Pulsschlag der Chemie fühlen—schon im Grundpraktikum. Angew. Chem. 2017, 129, 7792–7793. [Google Scholar] [CrossRef] [Green Version]
- Johnstone, A.H. Chemistry Teaching—Science or Alchemy? J. Chem. Educ. 1997, 74, 262. [Google Scholar] [CrossRef] [Green Version]
- Kirschner, P.A.; Sweller, J.; Clark, R.E. Why Minimal Guidance During Instruction Does Not Work. An Analysis of the Failure of Constructivist, Discovery, Problem-Based, Experiential, and Inquiry-Based Teaching. Educ. Psychol. 2006, 41, 75–86. [Google Scholar] [CrossRef]
- Hmelo-Silver, C.E.; Duncan, R.G.; Chinn, C.A. Scaffolding and Achievement in Problem-Based and Inquiry Learning. A Response to Kirschner, Sweller, and Clark (2006). Educ. Psychol. 2007, 42, 99–107. [Google Scholar] [CrossRef]
- Mulder, Y.G.; Lazonder, A.W.; de Jong, T. Using heuristic worked examples to promote inquiry-based learning. Learn. Instr. 2014, 29, 56–64. [Google Scholar] [CrossRef]
- Tuovinen, J.E.; Sweller, J. A comparison of cognitive load associated with discovery learning and worked examples. J. Educ. Psychol. 1999, 91, 334–341. [Google Scholar] [CrossRef]
- Leppink, J.; Paas, F.; van Gog, T.; van der Vleuten, C.P.M.; van Merriënboer, J.J.G. Effects of pairs of problems and examples on task performance and different types of cognitive load. Learn. Instr. 2014, 30, 32–42. [Google Scholar] [CrossRef]
- Singh, C. Interactive video tutorials for enhancing problem-solving, reasoning, and meta-cognitive skills of introductory physics students. AIP Conf. Proc. 2004, 720, 177–180. [Google Scholar] [CrossRef] [Green Version]
- Lazonder, A.W.; Kamp, E. Bit by bit or all at once? Splitting up the inquiry task to promote children’s scientific reasoning. Learn. Instr. 2012, 22, 458–464. [Google Scholar] [CrossRef]
- Lazonder, A.W.; Harmsen, R. Meta-Analysis of Inquiry-Based Learning. Rev. Educ. Res. 2016, 86, 681–718. [Google Scholar] [CrossRef]
- Lazonder, A.W.; Hagemans, M.G.; de Jong, T. Offering and discovering domain information in simulation-based inquiry learning. Learn. Instr. 2010, 20, 511–520. [Google Scholar] [CrossRef]
- Kaiser, I.; Mayer, J. The Long-Term Benefit of Video Modeling Examples for Guided Inquiry. Front. Educ. 2019, 4, 1–18. [Google Scholar] [CrossRef]
- Kant, J.M. Fostering the Acquisition of Scientific Reasoning with Video Modeling Examples and Inquiry Tasks. Ph.D. Thesis, Eberhard Karls Universität Tübingen, Tübingen, Germany, 2017. Available online: https://publikationen.uni-tuebingen.de/xmlui/handle/10900/74159 (accessed on 18 August 2021).
- Ramachandran, R.; Sparck, E.M.; Levis-Fitzgerald, M. Investigating the Effectiveness of Using Application-Based Science Education Videos in a General Chemistry Lecture Course. J. Chem. Educ. 2019, 96, 479–485. [Google Scholar] [CrossRef]
- Pulukuri, S.; Abrams, B. Improving Learning Outcomes and Metacognitive Monitoring. Replacing Traditional Textbook Readings with Question-Embedded Videos. J. Chem. Educ. 2021, 98, 2156–2166. [Google Scholar] [CrossRef]
- Jolley, D.F.; Wilson, S.R.; Kelso, C.; O’Brien, G.; Mason, C.E. Analytical Thinking, Analytical Action. Using Prelab Video Demonstrations and e-Quizzes to Improve Undergraduate Preparedness for Analytical Chemistry Practical Classes. J. Chem. Educ. 2016, 93, 1855–1862. [Google Scholar] [CrossRef] [Green Version]
- Lewis, R.A. Video introductions to laboratory. Students positive, grades unchanged. Am. J. Phys. 1995, 63, 468–470. [Google Scholar] [CrossRef]
- Campbell, J.; Macey, A.; Chen, W.; Shah, U.V.; Brechtelsbauer, C. Creating a Confident and Curious Cohort. The Effect of Video-Led Instructions on Teaching First-Year Chemical Engineering Laboratories. J. Chem. Educ. 2020, 97, 4001–4007. [Google Scholar] [CrossRef]
- Seery, M.K.; Agustian, H.Y.; Doidge, E.D.; Kucharski, M.M.; O’Connor, H.M.; Price, A. Developing laboratory skills by incorporating peer-review and digital badges. Chem. Educ. Res. Pract. 2017, 18, 403–419. [Google Scholar] [CrossRef] [Green Version]
- Stieff, M.; Werner, S.M.; Fink, B.; Meador, D. Online Prelaboratory Videos Improve Student Performance in the General Chemistry Laboratory. J. Chem. Educ. 2018, 95, 1260–1266. [Google Scholar] [CrossRef]
- Brame, C.J. Effective Educational Videos. Principles and Guidelines for Maximizing Student Learning from Video Content. CBE Life Sci. Educ. 2016, 15, 1–6. [Google Scholar] [CrossRef] [Green Version]
- Schnotz, W.; Kürschner, C.A. Reconsideration of Cognitive Load Theory. Educ. Psychol. Rev. 2007, 19, 469–508. [Google Scholar] [CrossRef]
- Mayer, R.E. (Ed.) The Cambridge Handbook of Multimedia Learning, 2nd ed.; Cambridge University Press: Cambridge, UK, 2014. [Google Scholar]
- Bravo, E.; Amante, B.; Simo, P.; Enache, M.; Fernandez, V. Video as a new teaching tool to increase student motivation. In Proceedings of the IEEE Global Engineering Education Conference (EDUCON), Amman, Jordan, 4–6 April 2011; pp. 638–642. [Google Scholar]
- Harwood, W.S.; McMahon, M.M. Effects of Integrated Video Media on Student Achievement and Attitudes in High School Chemistry. J. Res. Sci. Teach. 1997, 34, 617–631. [Google Scholar] [CrossRef]
- Jeno, L.M.; Vandvik, V.; Eliassen, S.; Grytnes, J.-A. Testing the novelty effect of an m-learning tool on internalization and achievement. A Self-Determination Theory approach. Comput. Educ. 2019, 128, 398–413. [Google Scholar] [CrossRef]
- Huang, W. Investigating the Novelty Effect in Virtual Reality on STEM Learning. Ph.D. Thesis, Arizona State University, Tempe, AZ, USA, 2020. Available online: https://repository.asu.edu/attachments/227504/content/huang_asu_0010E_20075.pdf (accessed on 18 August 2021).
- Hansford, B.C.; Hattie, J.A. The Relationship between Self and Achievement/Performance Measures. Rev. Educ. Res. 1982, 52, 123. [Google Scholar] [CrossRef]
- Marsh, H.W.; Craven, R.G. Reciprocal Effects of Self-Concept and Performance from a Multidimensional Perspective. Beyond Seductive Pleasure and Unidimensional Perspectives. Perspect. Psychol. Sci. 2006, 1, 133–163. [Google Scholar] [CrossRef] [PubMed]
- House, D.J. Noncognitive Predictors of Achievement in Introductory College Chemistry. Res. High. Educ. 1995, 36, 473–490. [Google Scholar] [CrossRef]
- Atzert, R.; John, R.; Preisfeld, A.; Damerau, K. Der Einfluss kriterialer, sozialer und individueller Bezugsnormen auf das experimentbezogene Fähigkeitsselbstkonzept. Z. Didakt. Nat. 2020, 26, 89–102. [Google Scholar] [CrossRef]
- Sudria, I.B.N.; Redhana, I.W.; Suja, I.W.; Suardana, I.N. Self-assessment of chemistry laboratory basic skills using performance scoring rubrics at the chemistry teacher training. IOP Conf. Ser. Mater. Sci. Eng. 2020, 959, 1–8. [Google Scholar] [CrossRef]
- Schöne, C.; Dickhäuser, O.; Spinath, B. Das Fähigkeitsselbstkonzept und seine Erfassung. In Diagnostik von Motivation und Selbstkonzept; Stiensmeier-Pelster, J., Rheinberg, F., Eds.; Hogrefe: Göttingen, Germany, 2002; pp. 3–14. [Google Scholar]
- Technische Universität Braunschweig Fakultät 6. Besonderer Teil der Prüfungsordnung für den Bachelorstudiengang Erziehungswissenschaft und den Zwei-Fächer-Bachelorstudiengang der der Technischen Universität Braunschweig inkl. der 8. Änderung; Nichtamtliche Lesefassung; Präsident der Technischen Universität Braunschweig, Ed.; Technischen Universität Braunschweig: Braunschweig, Germany, 2013; Available online: https://www.tu-braunschweig.de/index.php?eID=dumpFile&t=f&f=87690&token=ea5059c4421ac247a58e9a6031970b9c648b30bd (accessed on 12 November 2020).
- Bicak, B.E.; Borchert, C.E.; Höner, K. Strategy to implement inquiry instructions in an organic chemistry lab course; TU Braunschweig: Braunschweig, Germany, 2021; Manuscript in preparation. [Google Scholar]
- Christian, G.D. Analytical Chemistry, 4th ed.; John Wiley & Sons: New York, NY, USA, 1986. [Google Scholar]
- Danzer, K. Analytical Chemistry Theoretical and Meteorological Fundamentals; Springer: Berlin/Heidelberg, Germany, 2007. [Google Scholar]
- Hardcastle, W.A. Qualitative Analysis: A Guide to Best Practice; Royal Society of Chemistry: London, UK, 1998. [Google Scholar]
- Bicak, B.E.; Borchert, C.; Höner, K. Förderung von Erkenntnisgewinnung mit experimentellem Problemlösen und Lernvideos im organisch-chemischen Praktikum. In Naturwissenschaftlicher Unterricht und Lehrerbildung im Umbruch; Habig, S., Ed.; GDCP: Essen, Germany, 2021; Volume 41, pp. 334–337. Available online: https://www.gdcp-ev.de/wp-content/tb2021/TB2021_334_Bicak.pdf (accessed on 22 July 2021).
- Metzger, S.; Sommer, K. “Kochrezept” oder experimentelle Methode? MNU J. 2010, 68, 4–11. [Google Scholar]
- Baur, A.; Hummel, E.; Emden, M.; Schröter, E. Wie offen sollte offenes Experimentieren sein? Ein Plädoyer für das geöffnete Experimentieren. MNU J. 2020, 73, 125–128. [Google Scholar]
- Mackensen-Friedrichs, I. Förderung des Expertiseerwerbs durch das Lernen mit Beispielaufgaben im Biologieunterricht der Klasse 9. Ph.D. Dissertation, Christian-Albrechts-Universität Kiel, Kiel, Germany, 2004. [Google Scholar]
- Arnold, J.C.; Kremer, K.; Mayer, J. Understanding Students’ Experiments—What kind of support do they need in inquiry tasks? Int. J. Sci. Educ. 2004, 36, 2719–2749. [Google Scholar] [CrossRef]
- Lachmayer, S. Entwicklung und Überprüfung eines Strukturmodells der Diagrammkompetenz für den Biologieunterricht. Ph.D. Dissertation, Christian-Albrechts-Universität, Kiel, Germany, 2008. [Google Scholar]
- Technische Universität Braunschweig. Die Technische Universität Braunschweig in Zahlen 2020. Technische Universität Braunschweig. Available online: https://www.tu-braunschweig.de/fileadmin/Redaktionsgruppen/Stabsstellen/SPK/ordnungen-leitlinien-fakten/tubraunschweig_zahlen.pdf (accessed on 12 November 2020).
- American Psychological Association. Ceiling Effect. APA Dictionary of Psychology. 2020. Available online: https://dictionary.apa.org/ceiling-effect (accessed on 18 August 2021).
- Bhattacherjee, A. Social Science Research. Principles, Methods, and Practices, 2nd ed.; University of South Florida Scholar Commons: Tampa, FL, USA, 2012; Available online: https://digitalcommons.usf.edu/oa_textbooks/3/ (accessed on 18 August 2021).
- Schmitt, N. Uses and Abuses of Coefficient Alpha. Psychol. Assess. 1996, 8, 350–353. [Google Scholar] [CrossRef]
- Schecker, H. Überprüfung der Konsistenz von Itemgruppen mit Cronbachs α. In Methoden in der Naturwissenschaftsdidaktischen Forschung; Krüger, D., Parchmann, I., Schecker, H., Eds.; Springer-Spektrum: Berlin, Germany, 2014; Available online: https://static.springer.com/sgw/documents/1426184/application/pdf/Cronbach+Alpha.pdf (accessed on 30 November 2020).
- Cohen, J. A power primer. Psychol. Bull. 1992, 112, 155–159. [Google Scholar] [CrossRef]
- Liljequist, D.; Elfving, B.; Skavberg Roaldsen, K. Intraclass correlation—A discussion and demonstration of basic features. PLoS ONE 2019, 14, e0219854. [Google Scholar] [CrossRef] [Green Version]
- Cicchetti, D.V. Guidelines, criteria, and rules of thumb for evaluating normed and standardized assessment instruments in psychology. Psychol. Assess. 1994, 6, 284–290. [Google Scholar] [CrossRef]
- Csanadi, A.; Kollar, I.; Fischer, F. Pre-service teachers’ evidence-based reasoning during pedagogical problem-solving: Better together? Eur. J. Psychol. Educ. 2021, 36, 147–168. [Google Scholar] [CrossRef] [Green Version]
- Stiller, J.; Hartmann, S.; Mathesius, S.; Straube, P.; Tiemann, R.; Nordmeier, V.; Krüger, D.; Upmeier zu Belzen, A. Assessing scientific reasoning: A comprehensive evaluation of item features that affect item difficulty. Assess. Eval. High. Educ. 2016, 41, 721–732. [Google Scholar] [CrossRef]
- Krell, M.; Khan, S.; van Driel, J. Analyzing Cognitive Demands of a Scientific Reasoning Test Using the Linear Logistic Test Model (LLTM). Educ. Sci. 2021, 11, 472. [Google Scholar] [CrossRef]
- Bernholt, S.; Parchmann, I. Assessing the complexity of students’ knowledge in chemistry. Chem. Educ. Res. Pract. 2011, 12, 167–173. [Google Scholar] [CrossRef]
Publisher’s Note: MDPI stays neutral with regard to jurisdictional claims in published maps and institutional affiliations. |
© 2021 by the authors. Licensee MDPI, Basel, Switzerland. This article is an open access article distributed under the terms and conditions of the Creative Commons Attribution (CC BY) license (https://creativecommons.org/licenses/by/4.0/).