Article

The Part and Parcel of Doctoral Education: A Gap Analysis between the Importance and Satisfaction of the Experience

1
Research and Development Center for Physical Education Health and Information Technology, Graduate Institute of Educational Leadership & Development, Fu Jen Catholic University, New Taipei City 24205, Taiwan
2
Department of Education, National Chengchi University, Taipei City 116011, Taiwan
3
School of Teacher Education, University of Wyoming, Laramie, WY 82071, USA
*
Author to whom correspondence should be addressed.
Educ. Sci. 2021, 11(9), 481; https://doi.org/10.3390/educsci11090481
Submission received: 6 August 2021 / Revised: 26 August 2021 / Accepted: 27 August 2021 / Published: 30 August 2021
(This article belongs to the Special Issue Student Preferences and Satisfaction: Measurement and Optimization)

Abstract

:
The doctoral student experience is complex and multifaceted, and although it is increasingly examined in higher education research, there is still much to explore and understand about the topic. Despite expanding discourse, few investigations have been conducted in the East Asian context with multiple universities and fields of study. The present paper aimed to overcome these limitations with research conducted in two Taiwan universities with 94 doctoral student subjects. The study was designed as a quantitative cross-sectional survey using gap analysis. Results showed that within three dimensions (experience with mentors, peers, and curricular engagements) nine distinct variables were validated. The importance of peer interaction and support from mentors were noted as key components for a successful, enjoyable doctoral experience within the Taiwan context.

1. Introduction

Strict compliance with mask wearing and social distancing in Taiwan during the onset of the 2020 COVID-19 pandemic helped higher education institutions (HEIs) in the respective system to remain open [1,2]. Taiwan HEIs appeared to have fewer pandemic-related challenges in comparison to universities in other nations. Nonetheless, Taiwan HEIs continue to be confronted with systemic challenges that threaten the survival of universities nationwide [3]. These challenges stem partly from the need to obtain a more competitive stance in the global university rankings [4]. In tandem with this, the shrinking student population, due to consecutive years of declining birthrates [5] and escalating student dropout rates [6], adds to the fragility of Taiwan HEIs. Taiwan decision makers have responded with a shift from reliance on administration and policy for guidance to neoliberal management styles [7]. This shift blurs the academic identities of students, faculty, and staff who are involved with the core mission of HEIs for research, teaching, and service [8].
Scholars have noted the significance of academic identity, defined here as a product of social interaction within an institution [9,10] that exposes the accepted practices and social agents of groups and programs within university settings. Traditional definitions have encompassed the motivations, interests, and competencies of a specific profession [11] with emphasis on the development of academic identity to ensure a successful career in academia [12]. Academic identity is affected by an individual’s background, motivations, experiences, and perception of future academic careers [13]. Meaning that it is shaped by self-regulation [14] and the academic freedom to make decisions about teaching and research. Henkel [15] suggested there is a renewed focus in studies of academic identity because traditional definitions have become distorted with increasing reliance on neoliberal management styles.
Research addressing the complexity of academic identity in doctoral education has expanded [16,17,18,19]. Transitioning from previous professional lives with distinct identities to academic identities within the context of doctoral education is an arduous process with gaps in understanding. Many studies have emphasized that the doctoral journey initiates prospects for scientific research and contributes to the ongoing development of highly qualified specialists. Yet, doctoral education represents far more than hard work toward recognition of expertise in a field of study; in tandem with this is development of an academic identity that positively impacts future career aspirations and the overall sustainability of HEIs [20].
Despite the expanding discourse, few investigations have been conducted in the East Asian context with multiple universities and fields of study. Nor has previous research investigated the interactions between specific factors in terms of perceived importance and satisfaction with the type of experiences and the social agents involved. This area remains largely unexplored in the East Asian context. In response, the present paper aimed to overcome these limitations with research conducted in two Taiwan universities. The study was designed as a quantitative cross-sectional survey using gap analysis, wherein data were collected at one given point in time across a predefined group of doctoral students [21]. The aim was to what examine doctoral students identified as on-the-ground concerns and challenges encountered during their journey in doctoral education and formation of academic identities. Beginning research objectives included:
  • Validate an instrument to measure Taiwanese doctoral students’ experiences;
  • Perform a gap analysis between perceived importance and satisfaction;
  • Identify predictors of academic identity development in doctoral students.

2. Materials and Methods

2.1. Study Design and Participants

The study was designed as cross-sectional quantitative survey research [21]. Cross-sectional methods are useful for examining studies that cross different sections to make inferences about a population of interest at one point in time [22,23]. In November 2020, a call to participate was distributed by email to administrators of different doctoral programs, located within two comprehensive universities in the northern area of Taiwan. A convenience sampling technique [24] was used to select universities based on similarities in course offerings and contrast of institutional type (one public/national and one private).
Volunteer subjects were students enrolled in doctoral programs in the two universities. Consent to participate was provided together with a description of the research objectives and how collected data would be analyzed. Each subject received a small convenience store cash coupon as an incentive. A total of 120 surveys were distributed with 94 completed returns. Table 1 shows subjects background demographics.
The mean age of subjects was 41 years. Of the 94 subjects, 45 percent were female and 55 percent were male. Fifty-two percent of subjects were enrolled in a public/national university and forty-eight percent in a private institution. Forty-six percent were enrolled in programs dedicated to the natural sciences, including engineering, and fifty-one percent were enrolled in social science/humanities programs.

2.2. Gap Analysis

In recent decades, gap analyses have been used to assess the quality of education experience [25]. Researchers have often described student preferences and satisfaction in terms of gap analysis by using either importance–satisfaction or importance–performance models [26,27]. For the current study, the importance–satisfaction gap analysis was adapted to better understand doctoral students’ perceived importance and satisfaction of experiences with mentors, peers, and various curricular engagements (see Figure 1).

2.3. Measurement Instrument

2.3.1. Background Variables

Background variables included subjects’ age, gender, school type (public/national or private), and field of study (science or non-science). These variables were selected due to their perceived influence in formation of academic identities. For instance, in a study of public university faculty in the United States, findings noted that younger academics tended to associate themselves to be more research inclined [28]. In addition, gender disparity issues have always been of interest, not only within the doctoral education stage [29], but also during later promotion and tenureship [30]. Furthermore, university governance is also proven to influence later career decisions, wherein academics working in public institutions are more susceptible to academic identity tensions [31,32]. Lastly, academic identity is more likely to form within the boundaries of a common classification [33], this holds true since scholarly requirements for each discipline (or field of study) are equally distinct and different [34,35,36]. Cronbach’s [37] alpha reliability of the entire survey was computed at 0.91, signifying highly reliable internal consistency [21,38].

2.3.2. Career Outlook and Goals

Career outlook and goals are issues related to the academic profession. As the willingness to embark towards an academic profession progresses, academics become aware that the value and rewards of the career are more intrinsic [39]. Three variables were used to collect subjects’ overall career outlook and goals. Career goals were based on the two academic work ideologies: marketization (4 items) and scholarship (4 items) [31]. Sample items were “higher education is best promoted on the basis of market-demand and user-pays principles” and “universities are first and foremost learning institutions focused on intellectual rigor and scholarship.” Cronbach’s alpha values for reliability of marketization and scholarship goals were computed, with both having 0.70, signifying acceptable internal consistencies. The third variable, career outlook (8 items), was based on the various attitudes towards the academic profession [40]. Sample items included, “if I had to do it over again, I would not enroll in a doctoral education (reversely coded)” and “taking up doctoral education is a very worthwhile investment.” Data for these variables were collected using a five-point Likert-type [41] scale, with ratings from 1 (least agree) to 5 (most agree). Cronbach’s alpha for reliability of career outlook was computed at 0.73, denoting acceptable internal consistency.

2.3.3. Doctoral Experiences

Doctoral experiences in terms of the various interactions with mentors and peers, along with curricular engagement, were collected. These dimensions were as follows: experience with mentor, experience with peers, and curricular engagement. Items were conceptualized from the various academic involvement issues [42] and the different socio-environmental and motivational factors related to doctoral student satisfaction [43]. Data for the different doctoral education experiences were collected using a five-point Likert-type scale, with ratings from 1 (least agree) to 5 (most agree). Cronbach’s alpha for reliability of the various interactions with mentors, peers, and curricular engagement were computed at 0.83, 0.86, and 0.90, respectively, denoting good internal consistencies.

2.3.4. Academic Identity

For “preferred academic identity”, three items were used. Typically, academics classify themselves as either teaching, research, or dual academic identity [44]. Subjects were asked to rate the degree of preference for each of the identities using a five-point Likert-type scale with ratings from 1 (least preferred) to 5 (most preferred). Cronbach’s alpha for reliability of the three academic identity items was computed at 0.72, indicating acceptable internal consistency.

2.4. Statistical Analysis

Data from the survey were encoded and analyzed using the SPSS version 20.0 (IBM, Armonk, NY, USA), borrowed from the university. Descriptive statistics, such as the mean and standard deviation (SD), were completed to describe data distribution. Pearson’s correlation was used to calculate the correlation between variables. Factor analysis using structural equation modelling was completed using the SPSS AMOS version 26.0 (IBM, Armonk, NY, USA) on lease agreement from Hearne software. Several criteria were used as a basis for the model fit: standardized root mean square residual (SRMR; values < 0.08 indicating a good fit); significant Chi-square; Chi-square divided by degrees of freedom (CMIN/df; ratio between 2 and 5 indicating a reasonable fit); root mean square error of approximation (RMSEA; values < 0.08 indicating a good fit), including 90% confidence interval (90% CI); and goodness of fit index (GFI), Tucker–Lewis index (TLI), and comparative fit index (CFI), all of which should have values > 0.90 to indicate a good fit [45,46]. In addition, composite reliability (CR), discriminant validity (DV), and convergent validity (average variance extracted, AVE) were assessed [47,48,49,50]. Independent samples t-tests were used to assess for group differences, such as genders, school type, and field type. In addition, paired-samples t-tests were used to assess the gap analyses between the perceived importance and satisfaction of the different experience variables. Lastly, hierarchical multiple regression analysis was completed to determine the association between the experience variables and preferred academic identities.

3. Results

3.1. Doctoral Students’ Experience Instrument Validations

For the dimension, experience with mentor, a total of 12 items were generated. These items included the various mentorship and motivational roles that are generally expected between doctoral students and their mentor. The factorability of the items was examined using several criteria in the factor analysis. Firstly, correlations between the items were checked with a minimum of 0.30 correlations between at least one other item, while not exceeding 0.85 [51]. Secondly, factor loadings were checked with three of the items deleted. In practice, items should have at least a primary loading of 0.50 and no cross-loading of 0.32 or above [52]. Thirdly, the Kaiser–Meyer–Olkin (KMO) measure of sampling adequacy was computed at 0.78 (minimum cutoff value was 0.50) [53]. Fourthly, Bartlett’s test of sphericity was significant with χ2 (36) = 342.95 with p < 0.001, signifying sampling adequacy [54]. Lastly, communalities were computed with all of the values above the minimum cutoff of 0.40, confirming that each of the items shared some common variance [55].
To determine the latent variables within the items, principal component analysis with Varimax rotation was completed [56]. Results showed that the remaining 9 items loaded successfully into three variables explaining 72.12 percent of the total variance. In addition, structural equation modelling results exhibited a good model fit with SRMR = 0.05, CMIN (24) = 31.47 with p < 0.001, CMIN/df = 1.31, RMSEA = 0.06 (90% CI 0 and 0.11), GFI = 0.93, TLI = 0.97, and CFI = 0.98. All items were well within the prescribed cutoff values.
Table 2 shows the various variables and items for subjects’ experiences with mentor, together with the mean, SD, communalities, and factor loadings. Communalities and factor loadings were well within the accepted parameters. Table 2 displays the three distinct variables, wherein quality training refers to how mentors trained their students, career opportunity was defined as the provision of opportunities in helping students become either a researcher or instructor, and quality advising was noted as the depth of doctoral student advising. Within subjects’ perceived importance of the three variables, quality advising (M = 4.55) scored the highest, while provision of career opportunities (M = 3.72) scored the lowest. For the individual items, my mentor provides advice on my research (M = 4.65) scored the highest, while my mentor promotes my development as an instructor (M = 3.45) scored the lowest.
For the dimension, experience with peers, a total of 10 items were generated, including, subjects interact with classmates. The factorability of the items was also examined using several criteria in the factor analysis. Firstly, correlations between the items were checked with a minimum of 0.30 correlations between at least one of the other items, while not exceeding 0.85. Secondly, one item was deleted, because of failure to meet a primary loading of 0.50. Thirdly, the KMO measure of sampling adequacy was computed at 0.83, while the Bartlett’s test of sphericity was significant with χ2 (36) = 382.51 with p < 0.001. Lastly, communalities were computed with all values above the minimum cutoff of 0.40.
To determine the latent variables within the items, principal component analysis with Varimax rotation was computed. Results showed that the remaining 9 items loaded successfully into two variables, explaining 64.16 percent of the total variance. In addition, structural equation modelling results exhibited a good model fit with SRMR = 0.06, CMIN (25) = 25.56 with p < 0.001, CMIN/df = 1.18, RMSEA = 0.04 (90% CI 0 and 0.10), GFI = 0.93, TLI = 0.98, and CFI = 0.99, all of which were well within the acceptable values.
Table 3 shows the various variables and items for subjects’ experiences with peers, together with the mean, SD, communalities, and factor loadings. Communalities and factor loadings were within the accepted parameters. Table 3 displays two distinct variables, wherein mutual growth—refers to the tendencies of doctoral students to share resources and information with each other, and support building refers to the tendencies of doctoral students to provide mutual support for each other. Within the variables, the perceived importance of support building (M = 4.21) was higher than mutual growth (M = 4.14). Nonetheless, both variables were considered as moderately high in perceived importance. As for the individual items, the community values intellectual contribution from new members (M = 4.38) scored the highest, while shares information regarding scholarship/financial aids (M = 3.72) scored the lowest.
For the dimension curricular engagement, a total of 26 items were initially generated to examine doctoral students’ perceived course undertakings. Ten items were deleted due to inappropriateness and similarities of constructs [57]. The factorability of the items was then examined using several criteria in factor analysis. Correlations between the items were checked with a minimum of 0.30 correlations between at least one other item, while not exceeding 0.85. Three items were deleted due to low factor loadings. The KMO measure of sampling adequacy was computed at 0.82, while the Bartlett’s test of sphericity was significant with χ2 (78) = 697.40 with p < 0.001. Lastly, communalities were computed with all values above the minimum cutoff of 0.40.
To determine the latent variables, principal component analysis with Varimax rotation was completed. Results showed that the remaining 13 items loaded successfully into three variables, explaining 68.75 percent of the total variance. In addition, structural equation modelling results exhibited a mediocre model fit with SRMR = 0.07, CMIN (59) = 118.43 with p < 0.001, CMIN/df = 2.01, RMSEA = 0.10 (90% CI 0.08 and 0.13), GFI = 0.84, TLI = 0.88, and CFI = 0.91, most of which were within the minimum cutoff values.
Table 4 shows the various variables and items for curricular engagement, together with the mean, SD, communalities, and factor loadings. Communalities and factor loadings were within accepted parameters. Table 4 displays three distinct variables, representing being research-oriented, administration-oriented, and problem-solving-oriented. Items within the variables refers to the different perceived competencies doctoral students are able to learn from course offerings. Within the variables, the perceived importance of being research-oriented (M = 4.50) scored the highest, while being administration-oriented (M = 3.58) scored the lowest. For the individual items, both learn adequate research methodology techniques and build publication skills (M = 4.51) scored the highest, while better understand university’s mission (M = 3.31) scored the lowest.
Considering the overall mean of the perceived importance on the three dimensions, the overall experience with mentor (M = 4.22) scored the highest, followed by the overall experience with peers (M = 4.18) and overall curricular engagement (M = 4.09).

3.2. Descriptive Statistics and Correlations among the Variables

Table 5 shows the descriptive statistics, reliability, validity, and correlation matrix of the variables. Comparing the doctoral experience variables, quality advising (M = 4.55) was deemed the most important, followed by being research-oriented (M = 4.50), while being administration-oriented (M = 3.58) was the least important. Findings denote that subjects perceived these experiences to be of moderate to moderately high importance. In terms of the career outlook and goals, results show that subjects were not enthusiastic, given mean values of 3.11 to 3.94.
The composite reliability (CR) and convergent validity (average variance extracted—AVE) of the doctoral experience dimensions were computed. Table 5 shows that the CR was above 0.70 and 0.50 for AVE, which were within the cutoff value [48]. Similarly, discriminant validity (DV) was assessed by comparing the square root of AVE with the correlations of the variables, resulting with values higher than the correlations, signifying adequate construct validity with dimensions experience with mentor, experience with peers, and curricular engagement.
As for the correlational analyses, Table 5 also shows that all of the doctoral experience variables were significantly and positively correlated. Interestingly, the marketization goal was significantly and positively correlated only with being administration-oriented with r (94) = 0.21, p < 0.05 and problem-solving-oriented with r (94) = 0.22, p < 0.05. Similarly, the scholarship goal was also significantly and positively correlated with all variables with the exception of career opportunities and mutual growth. In addition, the variable preferred academic identities was consistently significant and positively correlated with career opportunity, while also correlating with some of the other variables. Lastly, age was found to be significantly and positively correlated with career outlook with r (94) = 0.22, p < 0.05. It was also significantly and negatively correlated with research inclined academic identity with r (94) = −0.22, p < 0.05.
To understand whether there were group differences within the variables, several independent samples t-tests were completed. Results show that there were no significant gender differences. Meanwhile, there were significant differences found within the research-inclined academic identity between the science (M = 3.81, SD = 1.18) and non-science (M = 3.24, SD = 1.14) fields of study, with t (92) = 2.48, p < 0.05. Significant differences were also found within quality advising between students enrolled in private (M = 4.43, SD = 0.63) and public (M = 4.65, SD = 0.44) universities, with t (78) = 2, p < 0.05, and within problem-solving skills between students enrolled in private (M = 4.02, SD = 0.80) and public (M = 4.36, SD = 0.63) universities, with t (84) = 2.25, p < 0.05.

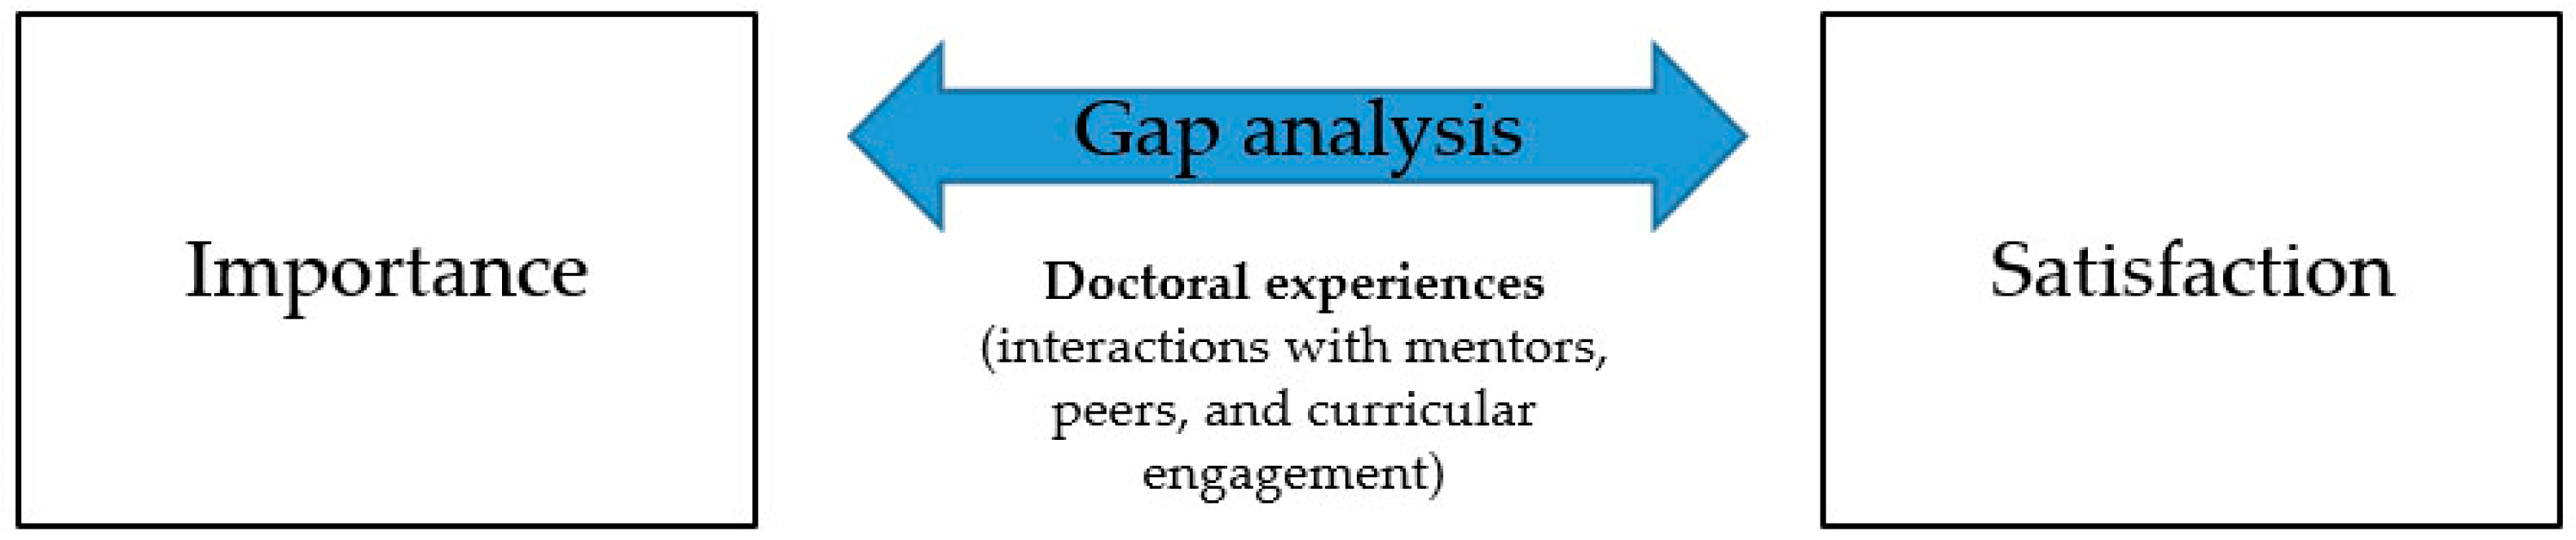
3.3. Gap Analysis between the Perceived Importance and Satisfaction

To understand if there were significant differences with perceived importance and satisfaction (gap analysis), several paired-samples t-test were completed. For the variable, experience with mentor, findings showed that there was significant difference between the quality advising perceived importance (M = 4.55, SD = 0.55) and satisfaction (M = 4.20, SD = 0.70) with t (94) = 4.77, p < 0.001 and a Cohen’s d value of 0.20, denoting moderate effect size [38] (see Table 6).
For the experience with peer variable, both mutual growth and support building shows significant gap differences. Paired-samples t-test results show that that there was significant difference between the mutual growth perceived importance (M = 4.14, SD = 0.68) and satisfaction (M = 3.65, SD = 1.08) with t (94) = 4.31, p < 0.001 and a Cohen’s d value of 0.45. Significant difference was also found between the support building perceived importance (M = 4.21, SD = 0.64) and satisfaction (M = 3.03, SD = 1.11) with t (94) = 10.40, p < 0.001 and a Cohen’s d value of 1.07. Both variables exhibited very large effect sizes (see Table 7).
For the curricular engagement variables, being both research-oriented and problem-solving-oriented showed significant gap differences. Paired-samples t-test results show that that there was significant difference between the perceived importance of being research-oriented (M = 4.50, SD = 0.54) and satisfaction (M = 3.63, SD = 1.01), with t (94) = 8.17, p < 0.001 and a Cohen’s d value of 0.84. In addition, a significant difference was also found between the perceived importance of being problem-solving-oriented (M = 4.20, SD = 0.73) and satisfaction (M = 3.82, SD = 0.87), with t (94) = 4.34, p < 0.001 and a Cohen’s d value of 0.45. Both variables exhibited very large effect sizes (see Table 8).
Lastly, Table 9 provides a summary of the gap analyses. Findings show that the variable support building exhibited the widest gap (−28%), with a significant difference of around 28 percent, followed by research-oriented (−19%) and mutual growth (−12%). Negative values denoted that the perceived satisfaction was lower than the perceived importance.

3.4. Variables Associated with the Doctoral Students’ Academic Identity

Hierarchical multiple regression analyses were conducted to reveal the significant associates for the doctoral students’ preferred academic identities (dual, teaching, and research). Variables associated with preferred academic identity were entered using a three-step procedure. Firstly, in order to control for possible effects of background demographic, the age (in years), gender (0 = female, 1 = male), school type (0 = private, 1 = public/national), and field type (0 = non-science, 1 = science), were entered into the equation as control variables. In the second step, the career outlook and goals (career outlook, marketization goals, and scholarship goals) were entered into the equation. Lastly, the variables, quality training, career opportunity, quality advising, mutual growth, support building, research-oriented, administration-oriented, and problem-solving-oriented were entered into the equation.
Table 10 displays the results of the hierarchical multiple regression analyses. For dual academic identity, only the variable of career opportunities (β = 0.398, t (78) = 3.101, p < 0.01) was revealed to have a significant association, explaining a total of 28.20 percent of the variance (F [15, 78] = 2.317, p < 0.05). For the teaching academic identity, among the control variables, age (β = 0.234, t (89) = 2.015, p < 0.05) and school (β = 0.264, t (89) = 2.473, p < 0.05), all revealed significant associations and explained 10.20 percent of the variance (F [4, 89] = 2.514, p < 0.05). Career opportunities (β = 0.325, t (78) = 3.534, p < 0.01) increased the total explained variance to 50.80 percent (F [15, 78] = 2.358, p < 0.05). Lastly, for the research academic identity, only the career opportunities variable (β = 0.432, t (78) = 3.534, p < 0.01) was revealed to have a significant association, explaining a total of 50.70 percent of the variance (F [15, 78] = 2.572, p < 0.05).

4. Discussion

The primary objective of investigation was to use gap analysis as a means of understanding doctoral students’ perceived importance and satisfaction of experiences with mentors, peers, and various curricular engagements. The survey instrument to measure doctoral students’ experiences was validated. Results showed that within the three dimensions (experience with mentors, peers, and curricular engagements), nine distinct variables were validated: quality training, career opportunity, quality advising, mutual growth, support building, research-oriented, administration-oriented, and problem-solving-oriented. No significant gender differences were found across variables. Comprehensively, the gap analysis suggested that subjects perceived lower satisfaction ratings across all doctoral education experiences.
Significant differences (highest) were noted with the variable support building, while mutual growth was rated third. Support building and mutual growth were variables within the experience with peers dimension. Although these variables were not the most important, the mean scores were moderately high. The importance of peer interaction and support were noted as key components for a successful, enjoyable doctoral experience within the Taiwan context. Shacham and Od-Cohen [58] examined the experiences and learning outcomes of doctoral students after participating in communities of practice (CoP), in which students frequently worked in small groups with other doctoral students to develop ideas, share challenges and successes, and receive feedback on research projects. A significant contributor to doctoral education in the Taiwan context could be the use of CoPs to facilitate the sharing of ideas, struggles, and coping strategies among doctoral students. Accordingly, the CoP could be a vehicle to enhance learning and increase the perceived meaningfulness of the doctoral experience [59].
In addition to peer support, interactions with mentors were paramount. Previous studies addressing doctoral student experiences have noted the importance of interactions with mentors [60,61] and the services provided [62]. Services include both institutional and curricular, as well as individual, meaning support from faculty [63]. Measuring which mattered most, subjects perceived that research-inclined training was more important than acquiring administrative skills. This is to be expected, given that doctoral education is considered to be a mostly research-oriented endeavor [64]; however, as noted by Nerad [65], doctoral students should not focus exclusively on research training because the majority of graduates would typically become university academics. However, in Taiwan, the current scenario of securing a tenured position as an academic in a university setting is not common and considered quite difficult [66]. As such, in Taiwan, more emphasis should be placed on developing versatile doctoral students. This means that doctoral programs and faculty should provide resources to help both science and humanities/social science doctoral students prepare to succeed in non-academic careers.
In reference to research- and problem-solving-oriented course content, a strong inclination for doctoral students is the need for more research training. This is an expected finding. The importance of problem-solving skills was recognized as a valuable skill area under the current neoliberal management. The mean score showed that subjects were more inclined towards scholarship than marketization goals. This is important given that doctoral education generally includes various dimensions of scholarship that are embedded in the core mission of HEIs for research, teaching, and service [67]. In general, doctoral education is viewed as a socialization process for disciplinary norms and identities that are innately distinct [68]. The inherent distinctions among disciplines are expected to become more pronounced as HEIs become marketized [69]. However, findings show that there were no significant differences within subjects’ career aspirations and goals.
Significant differences were noted within the research-inclined academic identity between the science and non-science fields of study. Subjects within science disciplines perceived significantly higher inclination towards a research-inclined academic identity. Although research-focused training within science disciplines is very important, previous studies noted a possible parallel, rather than opposing, relationship [70]. This concurs with Nerad [65], who proposed that both research and teaching are equally important aspects of the doctoral education process.
Another interesting finding was the significant differences between subjects enrolled in the private and public university in terms of quality advising and problem-solving-oriented courses. Subjects in the public institution perceived significantly higher importance in quality advising and problem-solving-oriented courses.
Lastly, in reference to the predictors of preferred academic identity, findings consistently showed career opportunity as the key predictor for the different academic identities. This is quite important, although the perceived importance placed by subjects on career opportunity was not high; this interaction is actually very crucial in determining future career aspirations.

5. Conclusions

Expectations for careers in academia are changing in many fields and across institutional types. Institutional pressure to secure a competitive stance in the global university rankings means that graduating doctoral students who strive for careers in HEIs will be required to publish in top-tier academic journals, procure external funding, and earn reputations for being the best among peers. The pressures that doctoral students face, and will continue to face, are immense and require professional support to meet challenges successfully.
It is the relationships students have and develop, within the academic community, that provide support. Findings from this study address how and why relationships matter to the formation of academic identity as part and parcel on the journey toward formation of academic identity, graduation, and future career options. Few studies in the Taiwan context have included the variety of relationships students deem critical to success. Clearly, more research is needed in a variety of disciplines to understand the influence of students’ multiple experiences on academic identity development.
In sum, the doctoral student experience is complex and multifaceted, and although it is increasingly examined in higher education research, there is still much to explore and understand about the topic. The present study aimed to uncover some of the empirically established factors that impact the experiences of doctoral students across disciplines and institution types. As such, it provides a useful starting point for future research.

Author Contributions

Conceptualization, G.S.C., Y.-L.H. and A.R.; Data curation, G.S.C.; Formal analysis, G.S.C., Y.-L.H. and A.R.; Funding acquisition, G.S.C.; Investigation, G.S.C., Y.-L.H. and A.R.; Methodology, G.S.C., Y.-L.H. and A.R.; Project administration, G.S.C., Y.-L.H. and A.R.; Resources, G.S.C., Y.-L.H. and A.R.; Software, G.S.C.; Supervision, Y.-L.H. and A.R.; Validation, G.S.C., Y.-L.H. and A.R.; Visualization, G.S.C.; Writing—original draft, G.S.C. and A.R.; Writing—review & editing, G.S.C. and A.R. All authors have read and agreed to the published version of the manuscript.

Funding

This research was funded by the Taiwan Ministry of Science and Technology under grant number MOST 109-2410-H-030-033-SSS.

Institutional Review Board Statement

The data collection procedure was accomplished in accordance with the guidelines of the Declaration of Helsinki for the protection of human research subjects. In addition, the protocol of the study was reviewed and approved by the committee members of the Fu Jen Catholic University Institutional Review Board under Case Number C108163.

Informed Consent Statement

Informed consent was obtained from all subjects involved in the study.

Data Availability Statement

Data for the current study is available at https://doi.org/10.6084/m9.figshare.14903460.v1 (accessed on 3 July 2021).

Acknowledgments

An initial version of the data analysis was presented in the 2021 Hawaii IAFOR International Conference on Education, but was since reorganized and reanalyzed based from the comments received during the presentation. The current study would like to thank the participants, the reviewers, and the academic editors for spending time and effort in making this publication possible.

Conflicts of Interest

The authors declare no conflict of interest.

References

  1. Cheng, S.-Y.; Wang, C.J.; Shen, A.C.-T.; Chang, S.-C. How to safely reopen colleges and universities during COVID-19: Experiences from Taiwan. Ann. Intern. Med. 2020, 173, 638–641. [Google Scholar] [CrossRef]
  2. Chiang, C.-H.; Chiang, C.-H.; Chiang, C.-H.; Chen, Y.-C. The practice of wearing surgical masks during the COVID-19 pandemic. Emerg. Infect. Dis. 2020, 26, 1962. [Google Scholar] [CrossRef] [PubMed]
  3. Ching, G.S. A decade of change: The past 10 years of Taiwan higher education institutions. Int. J. Res. Stud. Educ. 2021, 10, 49–63. [Google Scholar] [CrossRef]
  4. Shreeve, R.L. Globalisation or westernisation? The influence of global university rankings in the context of the Republic of China (Taiwan). Comp. A J. Comp. Int. Educ. 2020, 50, 922–927. [Google Scholar] [CrossRef]
  5. Grentzer, K. In Taiwan, a Shrinking Youth Population Sparks Competition among Universities. Available online: https://www.elsevier.com/connect/in-taiwan-a-shrinking-youth-population-sparks-competition-among-universities (accessed on 3 May 2021).
  6. Tsai, L.H. Has Educational Reform Succeeded in Taiwan? 4500-Percent Rise in Cram Schools over Past 30 Years. Available online: https://english.cw.com.tw/article/article.action?id=2639 (accessed on 2 May 2021).
  7. Shin, J.C.; Watanabe, S.P.; Chen, R.J.-C.; Ho, S.S.-H.H.; Lee, J.-K. Institutionalization of competition-based funding under neoliberalism in East Asia. Stud. High. Educ. 2020, 45, 2054–2062. [Google Scholar] [CrossRef]
  8. Liang, L.-F.; Lin, Y.-H. The struggle for “survival” in contemporary higher education: The lived experiences of junior academics in Taiwan. In The Palgrave Handbook of Institutional Ethnography; Luken, P.C., Vaughan, S., Eds.; Palgrave Macmillan: Cham, Switzerland, 2020; pp. 259–279. [Google Scholar]
  9. Billot, J.; King, V. The missing measure? Academic identity and the induction process. High. Educ. Res. Dev. 2017, 36, 612–624. [Google Scholar] [CrossRef]
  10. Trowler, P.R.; Knight, P.T. Coming to know in higher education: Theorising faculty entry to new work contexts. High. Educ. Res. Dev. 2000, 19, 27–42. [Google Scholar] [CrossRef]
  11. Meijers, F. The development of a career identity. Int. J. Adv. Couns. 1998, 20, 191–207. [Google Scholar] [CrossRef]
  12. Clegg, S. Learning and teaching policies in higher education: Mediations and contradictions of practice. Br. Educ. Res. J. 2003, 29, 803–819. [Google Scholar] [CrossRef]
  13. Giddens, A. Modernity and Self-Identity: Self and Society in the Late Modern Age; Polity Press: Cambridge, UK, 1991. [Google Scholar]
  14. McInnis, C. Changes in the nature of academic work. Aust. Univ. Rev. 1992, 35, 9–12. [Google Scholar]
  15. Henkel, M. Academic Identities and Policy Change in Higher Education; Jessica Kingsley Publishers: London, UK, 2000. [Google Scholar]
  16. Lee, A.; Boud, D. Writing groups, change and academic identity: Research development as local practice. Stud. High. Educ. 2003, 28, 187–200. [Google Scholar] [CrossRef] [Green Version]
  17. Gardner, S.K. Contrasting the socialization experiences of doctoral students in high- and low-completing departments: A qualitative analysis of disciplinary contexts at one institution. J. High. Educ. 2010, 81, 61–81. [Google Scholar] [CrossRef]
  18. Lovitts, B.E. Being a good course-taker is not enough: A theoretical perspective on the transition to independent research. Stud. High. Educ. 2005, 30, 137–154. [Google Scholar] [CrossRef]
  19. Neumann, R.; Rodwell, J. The ’invisible’ part-time research students: A case study of satisfaction and completion. Stud. High. Educ. 2009, 34, 55–68. [Google Scholar] [CrossRef]
  20. Martinsuo, M.; Turkulainen, V. Personal commitment, support and progress in doctoral studies. Stud. High. Educ. 2011, 36, 103–120. [Google Scholar] [CrossRef]
  21. Cohen, L.; Manion, L.; Morrison, K. Research Method in Education, 6th ed.; Routledge: Abingdon, UK, 2007. [Google Scholar]
  22. Prentice, T.; Mill, J.; Archibald, C.P.; Sommerfeldt, S.; Worthington, C.; Jackson, R.; Wong, T. Aboriginal youth experiences of accessing HIV care and treatment. J. HIV/AIDS Soc. Serv. 2011, 10, 395–413. [Google Scholar] [CrossRef]
  23. So, W.K.W.; Choi, K.C.; Chan, C.W.H.; Tang, W.P.Y.; Leung, A.W.Y.; Chair, S.Y.; Wan, R.W.M.; Mak, S.S.S.; Ling, W.M.; Ng, W.T.; et al. Perceived unmet supportive care needs and determinants of quality of life among head and neck cancer survivors: A research protocol. J. Adv. Nurs. 2013, 69, 2750–2758. [Google Scholar] [CrossRef]
  24. Stewart, D.W.; Shamdasani, P.N. Focus Groups: Theory and Practice; Sage Publications: Newbury Park, CA, USA, 1990. [Google Scholar]
  25. Jo Jackson, M.; Helms, M.M.; Ahmadi, M. Quality as a gap analysis of college students’ expectations. Qual. Assur. Educ. 2011, 19, 392–412. [Google Scholar] [CrossRef]
  26. Latif, L.A.; Bahroom, R.; Khalil, M.A.K.M. Prioritizing services and facilities in a higher education institution: Importance-satisfaction quadrant and gap analyses. Asian Assoc. Open Univ. J. 2016, 11, 64–77. [Google Scholar] [CrossRef]
  27. McLeay, F.; Robson, A.; Yusoff, M. New applications for importance-performance analysis (IPA) in higher education: Understanding student satisfaction. J. Manag. Dev. 2017, 36, 780–800. [Google Scholar] [CrossRef]
  28. Dugas, D.; Stich, A.E.; Harris, L.N.; Summers, K.H. ‘I’m being pulled in too many different directions’: Academic identity tensions at regional public universities in challenging economic times. Stud. High. Educ. 2020, 45, 312–326. [Google Scholar] [CrossRef]
  29. Stroude, A.; Bellier-Teichmann, T.; Cantero, O.; Dasoki, N.; Kaeser, L.; Ronca, M.; Morin, D. Mentoring for women starting a PhD: A “free zone” into academic identity. Int. J. Mentor. Coach. Educ. 2015, 4, 37–52. [Google Scholar] [CrossRef]
  30. Oleschuk, M. Gender equity considerations for tenure and promotion during COVID-19. Can. Rev. Sociol. 2020. [Google Scholar] [CrossRef] [PubMed]
  31. Winter, R.; O’Donohue, W. Understanding academic identity conflicts in the public university: Importance of work ideologies. In Research and Development in Higher Education: Connections in Higher Education; Brown, N., Jones, S.M., Adam, A., Eds.; HERDSA: Hammondville, Australia, 2012; Volume 35, pp. 340–351. [Google Scholar]
  32. Winter, R.P.; O’Donohue, W. Academic identity tensions in the public university: Which values really matter? J. High. Educ. Policy Manag. 2012, 34, 565–573. [Google Scholar] [CrossRef] [Green Version]
  33. Ybema, S.; Keenoy, T.; Oswick, C.; Beverungen, A.; Ellis, N.; Sabelis, I.H.J. Articulating identities. Hum. Relat. 2009, 62, 299–322. [Google Scholar] [CrossRef]
  34. Shin, J.C.; Cummings, W.K. Multilevel analysis of academic publishing across disciplines: Research preference, collaboration, and time on research. Scientometrics 2010, 85, 581–594. [Google Scholar] [CrossRef]
  35. Jenkins, A.; Healey, M.; Zetter, R. Linking Teaching and Research in Disciplines and Departments; The Higher Education Academy: York, UK, 2007. [Google Scholar]
  36. Healey, M. Linking research and teaching: Exploring disciplinary spaces and the role of inquiry-based learning. In Reshaping the University: New Relationships between Research, Scholarship and Teaching; Barnett, R., Ed.; McGraw Hill: New York, NY, USA, 2005; pp. 67–78. [Google Scholar]
  37. Cronbach, L.J. Coefficient alpha and the internal structure of tests. Psychometrika 1951, 16, 197–334. [Google Scholar] [CrossRef] [Green Version]
  38. Nunnally, J.C.; Bernstein, I.H. Psychometric Theory, 3rd ed.; McGraw-Hill: New York, NY, USA, 1994. [Google Scholar]
  39. Brewer, C.L. Reflections on an academic career: From which side of the looking glass? In The Teaching of Psychology: Essays in Honor of Wilbert J. McKeachie and Charles L. Brewer; Davis, S.F., Buskist, W., Eds.; Lawrence Erlbaum Associates: Mahwah, NJ, USA, 2002; pp. 499–507. [Google Scholar]
  40. Teichler, U.; Arimoto, A.; Cummings, W.K. The Changing Academic Profession: Major Findings of a Comparative Survey; Springer: New York, NY, USA, 2013. [Google Scholar] [CrossRef]
  41. Likert, R. A Technique for the Measurement of Attitudes; Columbia University Press: New York, NY, USA, 1932. [Google Scholar]
  42. Anderson, B.; Cutright, M.; Anderson, S. Academic involvement in doctoral education: Predictive value of faculty mentorship and intellectual community on doctoral education outcomes. Int. J. Dr. Stud. 2013, 8, 195–201. [Google Scholar] [CrossRef] [Green Version]
  43. Shin, J.C.; Kim, S.J.; Kim, E.; Lim, H. Doctoral students’ satisfaction in a research-focused Korean university: Socio-environmental and motivational factors. Asia Pac. Educ. Rev. 2018, 19, 159–168. [Google Scholar] [CrossRef]
  44. Lee, S.J.; Jung, H.; Shin, J.C. Changes in academics’ identity, job satisfaction, and job stress between 1992 and 2018 in South Korea. High. Educ. Forum 2020, 17, 207–223. [Google Scholar]
  45. Hu, L.-T.; Bentler, P.M. Cutoff criteria for fit indexes in covariance structure analysis: Conventional criteria versus new alternatives. Struct. Equ. Modeling A Multidiscip. J. 1999, 6, 1–55. [Google Scholar] [CrossRef]
  46. Byrne, B.M. Structural Equation Modeling with AMOS. Basic Concepts, Applications, and Programming, 2nd ed.; Taylor & Francis: New York, NY, USA, 2010. [Google Scholar]
  47. Ho, R. Handbook of Univariate and Multivariate Data Analysis and Interpretation with IBM SPSS; Taylor and Francis: New York, NY, USA, 2006. [Google Scholar]
  48. Fornell, C.; Larcker, D.F. Evaluating structural equation models with unobservable variables and measurement error. J. Mark. Res. 1981, 18, 39–50. [Google Scholar] [CrossRef]
  49. Anderson, J.C.; Gerbing, D.W. Structural equation modeling in practice: A review and recommended two-step approach. Psychol. Bull. 1988, 103, 411–423. [Google Scholar] [CrossRef]
  50. Bollen, K.A. Structural Equations with Latent Variables; Wiley-Interscience: New York, NY, USA, 1989. [Google Scholar]
  51. Kline, R.B. Principles and Practice of Structural Equation Modeling; Guilford Press: New York, NY, USA, 2011. [Google Scholar]
  52. Costello, A.B.; Osborne, J.W. Best practices in exploratory factor analysis: Four recommendations for getting the most from your analysis. Pract. Assess. Res. Eval. 2005, 10, 1–9. [Google Scholar]
  53. Kaiser, H.F. An index of factorial simplicity. Psychometrika 1974, 39, 31–36. [Google Scholar] [CrossRef]
  54. Henson, R.K.; Roberts, J.K. Use of exploratory factor analysis in published research: Common errors and some comment on improved practice. Educ. Psychol. Meas. 2006, 66, 393–416. [Google Scholar] [CrossRef] [Green Version]
  55. Worthington, R.L.; Whittaker, T.A. Scale development research: A content analysis and recommendations for best practices. Couns. Psychol. 2006, 34, 806–838. [Google Scholar] [CrossRef]
  56. Acal, C.; Aguilera, A.M.; Escabias, M. New modeling approaches based on varimax rotation of functional principal components. Mathematics 2020, 8, 2085. [Google Scholar] [CrossRef]
  57. Brosnan, K.; Grün, B.; Dolnicar, S. Identifying superfluous survey items. J. Retail. Consum. Serv. 2018, 43, 39–45. [Google Scholar] [CrossRef]
  58. Shacham, M.; Od-Cohenm, Y. Rethinking PhD learning incorporating communities of practice. Innov. Educ. Teach. Int. 2009, 46, 279–292. [Google Scholar] [CrossRef]
  59. Ching, G.S. Academic identity and communities of practice: Narratives of social science academics career decisions in Taiwan. Educ. Sci. 2021, 11, 388. [Google Scholar] [CrossRef]
  60. Zhao, C.M.; Golde, C.M.; McCormick, A.C. More than a signature: How advisor choice and advisor behaviour affect doctoral student satisfaction. J. Furth. High. Educ. 2007, 31, 263–281. [Google Scholar] [CrossRef]
  61. Cockrell, C.N.; Shelley, K. The relationship between academic support systems and intended persistence in doctoral education. J. Coll. Stud. Retent. Res. Theory Pract. 2011, 12, 469–484. [Google Scholar] [CrossRef]
  62. Nwenyi, S.; Baghurst, T. Demographic and attitudinal factors influencing doctoral student satisfaction. Can. Soc. Sci. 2013, 9, 47–56. [Google Scholar] [CrossRef]
  63. Greene, M. Come hell or high water: Doctoral students’ perceptions on support services and persistence. Int. J. Dr. Stud. 2015, 10, 501–518. [Google Scholar] [CrossRef]
  64. Altbach, P.G. Doctoral education: Present realities and future trends. In International Handbook of Higher Education; Forest, J.J.F., Altbach, P.G., Eds.; Springer: Dordrecht, The Netherlands, 2007; Volume 18, pp. 65–81. [Google Scholar]
  65. Nerad, M. Confronting common assumptions: Designing future-oriented doctoral education. In Doctoral Education and the Faculty of the Future; Ehrenberg, R.G., Kuh, C.V., Eds.; Cornell University Press: Ithaca, NY, USA, 2009; pp. 80–89. [Google Scholar]
  66. Chang, C.-W.; Shaw, W.-C. Expanding higher education in Taiwan: The case of doctoral education. High. Educ. Stud. 2016, 6, 1–14. [Google Scholar] [CrossRef] [Green Version]
  67. Austin, A.E.; McDaniels, M. Using doctoral education to prepare faculty to work within Boyer’s four domains of scholarship. In Analyzing Faculty Work and Rewards: Using Boyer’s Four Domains of Scholarship; Braxton, J.M., Ed.; John Wiley & Sons: Hoboken, NJ, USA, 2006; Volume 129, pp. 51–65. [Google Scholar]
  68. Golde, C.M. Signature pedagogies in doctoral education: Are they adaptable for the preparation of education researchers? Educ. Res. 2007, 36, 344–351. [Google Scholar] [CrossRef]
  69. Deem, R. Rethinking doctoral education: University purposes, academic cultures, mental health and the public good. In Structural and Institutional Transformations in Doctoral Education: Social, Political and Student Expectations; Cardoso, S., Tavares, O., Sin, C., Carvalho, T., Eds.; Palgrave Macmillan: Cham, Switzerland, 2020; pp. 13–42. [Google Scholar]
  70. Mars, M.M.; Bresonis, K.; Szelényi, K. Science and engineering doctoral student socialization, logics, and the national economic agenda: Alignment or disconnect? Minerva 2014, 52, 351–379. [Google Scholar] [CrossRef]
Figure 1. Theoretical framework.
Education 11 00481 g001
Table 1. Demographic profile of the participants.
DemographicsClassificationn%
GenderFemale4245
Male5255
School typePublic or National4952
Private4548
Field typeScience4346
Non-Science5154
Notes. N = 94. Mean age = 41 years old.
Table 2. Item means, communalities, and factor loadings for experience with mentor.
Variables and Items (Variance Explained/Alpha Reliability)Mean 1SDCommunalitiesFL
Quality training (28.44%, 0.80)4.390.65
My mentor creates learning opportunities that increased in complexity over time4.370.720.810.85
My mentor creates opportunities in which I learned to connect theory with practice4.410.710.820.85
Career opportunity (24.36%, 0.81)3.720.91
My mentor promotes my development as a researcher (research opportunities)3.880.930.740.85
My mentor promotes my development as an instructor (teaching opportunities)3.451.140.790.83
My mentor promotes my development as a scholar (conference/publication)3.841.110.710.78
Quality advising (19.33%, 0.81)4.550.55
My mentor provides constructive feedback4.630.660.690.78
My mentor gives feedback in a timely manner4.290.830.590.71
My mentor provides advice on my research4.650.540.550.71
My mentor helped me clarify my research topic4.620.710.800.88
Overall experience with mentor4.220.56
Notes: SD = standard deviation and FL = factor loading. Extraction method: principal component analysis. Rotation method: Varimax with Kaiser normalization. Rotation converged in 4 iterations. Overall alpha reliability = 0.83. 1 Mean values for the perceived importance.
Table 3. Item means, communalities, and factor loadings for experience with peers.
Variables and Items (Variance Explained/Alpha Reliability)MeanSDCommunalitiesFL
Mutual growth (35.33%, 0.82)4.140.68
Shares intellectual resources (articles, books, …)4.330.800.740.84
Shares opportunities for professional advancement (conference, seminar, …)4.280.800.750.87
Helps develop professional relationships with others in the field (networking …)4.210.830.660.79
Shares opportunities for scholarship development (co-author, co-presentation, …)4.180.870.520.63
Shares information regarding scholarship/financial aids3.721.130.400.60
Support building (28.83%, 0.82)4.210.64
The community values intellectual contribution from new members4.380.710.670.82
The community nurtures its members’ intellectual curiosity4.190.790.730.82
The community is large enough for members to learn from each other4.170.860.690.70
The community provide guidance and support for new members/classmates4.110.820.620.72
Overall experience with peers4.180.58
Notes: SD = standard deviation and FL = factor loading. Extraction method: principal component analysis. Rotation method: Varimax with Kaiser normalization. Rotation converged in 3 iterations. Overall alpha reliability = 0.86.
Table 4. Item means, communalities, and factor loadings for curricular engagement.
Variables and Items (Variance Explained/Alpha Reliability)MeanSDCommunalitiesFL
Research-oriented (28.41%, 0.79)4.500.54
Learn adequate research methodology techniques4.510.650.640.71
Understand theoretical knowledge4.490.670.760.86
Build publication skills4.510.620.710.83
Administration-oriented (22.73%, 0.89)3.580.84
Enhance leadership potential3.680.950.640.66
Better understand the purpose of higher education3.780.990.620.67
Better understand university’s mission3.311.210.810.87
Develop institutional citizenship3.471.130.680.74
Participate in policy making process3.650.960.650.80
Develop negotiation skills3.570.980.690.76
Problem-solving-oriented (17.61%, 0.84)4.200.73
Develop problem-solving skills4.290.900.690.72
Balance priorities4.090.980.780.81
Motivate for lifelong learning4.150.870.620.75
Become creative4.270.810.640.75
Overall curricular engagement4.090.57
Notes: SD = standard deviation and FL = factor loading. Extraction method: principal component analysis. Rotation method: Varimax with Kaiser normalization. Rotation converged in 5 iterations. Overall alpha reliability = 0.90.
Table 5. Descriptive statistics, reliability, validity, and correlation matrix of the variables.
VariablesPSMeanSDCRAVEDV 1123456789101112131415
1Quality training3–54.390.650.800.670.820.800.47 **0.46 **0.41 **0.43 **0.51 **0.42 **0.36 **−0.140.160.27 **0.130.17−0.06−0.02
2Career opportunity1–53.720.910.820.610.78 0.810.37 **0.45 **0.31 **0.43 **0.32 **0.31 **−0.07−0.010.060.38 **0.40 **0.33 **−0.06
3Quality advising2.5–54.550.550.820.530.73 0.810.26 *0.22 *0.36 **0.060.28 **−0.15−0.100.21 *0.150.25 *−0.050.07
4Mutual growth2–54.140.680.840.520.72 0.820.53 **0.54 **0.54 **0.35 **−0.030.170.170.21 *0.22 *0.170.05
5Support building2–54.210.640.800.510.72 0.820.43 **0.45 **0.42 **−0.020.180.33 **0.160.190.14−0.12
6Research-oriented2.33–54.500.540.790.560.75 0.790.36 **0.43 **0.010.140.31 **0.090.25 *−0.040.12
7Administration1.33–53.580.840.870.530.73 0.890.58 **0.160.21 *0.38 **0.190.23 *0.150.05
8Problem-solving 1.5–54.200.730.810.520.72 0.840.080.22 *0.37 **0.180.170.19−0.06
9Career outlook1.63–53.400.72 0.730.180.22 *0.170.100.070.22 *
10Marketization1–53.110.84 0.700.35 **−0.050.000.11−0.12
11Scholarship 2.25–53.940.72 0.700.100.12−0.04−0.08
12Dual1–53.531.09 0.53 **0.49 **0.04
13Teaching1–53.571.27 0.37 **0.18
14Research1–53.501.19 −0.22 *
15Age22–6440.5311.73
Notes. N = 94, PS = possible scores, SD = standard deviation, CR = composite reliability, AVE = average variance extracted, and DV = discriminant validity. 1 Computed using the square root of AVE. Numbers 1 to 15 correspond to the variables. Age is in years. * p < 0.05, ** p < 0.01. Internal consistency values: Cronbach’s alpha coefficients are on diagonals (values in bold). Pearson correlation coefficients are above the diagonals.
Table 6. Comparison between the perceived importance and satisfaction for experience with mentor.
Variables and ItemsImportanceSatisfactiontpd
MeanSDMeanSD
My mentor creates learning opportunities that increased in complexity over time4.370.724.230.93
My mentor creates opportunities in which I learned to connect theory with practice4.410.714.170.86
Quality training mean4.390.654.200.851.960.053
My mentor promotes my development as a researcher (research opportunities)3.880.933.771.17
My mentor promotes my development as a teacher (teaching opportunities)3.451.143.511.29
My mentor promotes my development as a scholar (conference/publication)3.841.113.601.19
Career opportunity mean3.720.913.621.050.840.404
My mentor provides constructive feedback4.630.664.290.86
My mentor gives feedback in a timely manner4.290.834.060.90
My mentor provides advice on my research4.650.544.340.81
My mentor helped me clarify my research topic4.620.714.120.84
Quality advising mean4.550.554.200.704.77<0.0010.20
Notes: t = Student’s t-test and d = Cohen’s d or effect size. N = 94.
Table 7. Comparison between the perceived importance and satisfaction for experience with peer.
Variables and ItemsImportanceSatisfactiontpd
MeanSDMeanSD
Shares intellectual resources (articles, books, …)4.330.803.891.13
Shares opportunities for professional advancement (conference, seminar, …)4.280.803.831.22
Helps develop professional relationships with others in the field (networking …)4.210.833.731.28
Shares opportunities for scholarship development (co-author, co-presentation, …)4.180.873.301.23
Shares information regarding scholarship/financial aids3.721.133.501.41
Mutual growth mean4.140.683.651.084.31<0.0010.45
The community values intellectual contribution from new members4.380.712.981.34
The community nurtures its members’ intellectual curiosity4.190.792.731.38
The community is large enough for members to learn from each other4.170.863.211.26
The community provide guidance and support for new members/classmates4.110.823.191.27
Support building mean4.210.643.031.1110.40<0.0011.07
Notes: t = Student’s t-test and d = Cohen’s d or effect size. N = 94.
Table 8. Comparison between the perceived importance and satisfaction for curricular engagement.
Variables and ItemsImportanceSatisfactiontpd
MeanSDMeanSD
Learn adequate research methodology techniques4.510.653.521.22
Understand theoretical knowledge4.490.673.621.17
Build publication skills4.510.623.761.12
Research-oriented mean4.500.543.631.018.17<0.0010.84
Enhance leadership potential3.680.953.591.20
Better understand the purpose of higher education3.780.993.761.25
Better understand university’s mission3.311.213.481.12
Develop institutional citizenship3.471.133.621.14
Participate in policy making process3.650.963.261.30
Develop negotiation skills3.570.983.601.36
Administration-oriented mean3.580.843.551.000.270.791
Develop problem solving skills4.290.903.721.07
Balance priorities4.090.983.961.05
Motivate for lifelong learning4.150.873.861.09
Become creative4.270.813.741.05
Problem-solving-oriented mean4.200.733.820.874.34<0.0010.45
Notes: t = Student’s t-test and d = Cohen’s d or effect size. N = 94.
Table 9. Summary of gap analyses.
VariableImportanceSatisfactionGap%
Quality training4.394.20−0.19 −4%
Career opportunity3.723.62−0.10 −3%
Quality advising *4.554.20−0.35 −8%
Mutual growth *4.143.65−0.49 −12%
Support building *4.213.03−1.18 −28%
Research-oriented *4.503.63−0.87 −19%
Administration-oriented3.583.55−0.03 −1%
Problem-solving-oriented *4.203.82−0.38 −9%
Notes. N = 94. * Variables with significant gap differences.
Table 10. Hierarchical multiple regression analyses for predicting doctoral students’ academic identities.
PredictorsF ChangetdfBSEβR2 Change
A. Dependent variable: dual academic identity
I.Constant 3.4330.565
Control variables0.078 4, 89 0.003
Age 0.335 0.0040.0110.041
Gender −0.346 −0.0830.241−0.038
School 0.074 0.0180.2450.008
Field −0.169 −0.0420.251−0.019
II.Career outlook and goals1.34 7, 86 0.048
Career outlook 1.543 0.2680.1740.175
Marketization goals −1.092 −0.1630.149−0.125
Scholarship goals 0.85 0.1480.1750.098
III.Doctoral experiences2.317 * 15, 78 0.231
Quality training −0.208 −0.0490.236−0.029
Career opportunity 3.101 ** 0.480.1550.398
Quality advising 0.313 0.0820.2610.041
Mutual growth 0.658 0.1560.2370.097
Support building 0.399 0.0890.2240.052
Research-oriented −1.554 −0.4410.284−0.218
Administration-oriented −0.080 −0.0170.21−0.013
Problem-solving-oriented 0.855 0.1830.2150.122
B. Dependent variable: teaching academic identity
I.Constant 2.2960.625
Control variables2.514 * 4, 89 0.102
Age 2.015 * 0.0250.0130.234
Gender −0.030 −0.0080.267−0.003
School 2.473 * 0.6690.270.264
Field −0.760 −0.2110.277−0.083
II.Career outlook and goals0.49 7, 86 0.117
Career outlook 0.502 0.0980.1950.055
Marketization goals −0.389 −0.0650.167−0.043
Scholarship goals 0.981 0.1920.1960.109
III.Doctoral experiences2.358 * 15, 78 0.289
Quality training −1.259 −0.3320.264−0.170
Career opportunity 2.634 * 0.4560.1730.325
Quality advising 0.976 0.2850.2920.123
Mutual growth −0.429 −0.1140.265−0.061
Support building 1.007 0.2520.250.127
Research-oriented 0.542 0.1720.3180.073
Administration-oriented 1.435 0.3370.2350.221
Problem solving-oriented −0.891 −0.2140.24−0.123
C. Dependent variable: research academic identity
I.Constant 3.7250.587
Control variables2.188 4, 89 0.09
Age −0.968 −0.0110.012−0.113
Gender −0.554 −0.1390.251−0.058
School 0.714 0.1810.2540.077
Field 1.865 0.4860.2610.205
II.Career outlook and goals0.875 7, 86 0.116
Career outlook 1.072 0.1950.1820.117
Marketization goals 0.931 0.1450.1560.103
Scholarship goals −1.067 −0.1950.183−0.119
III.Doctoral experiences2.572 * 15, 78 0.301
Quality training −1.753 −0.4280.244−0.234
Career opportunity 3.534 ** 0.5660.160.432
Quality advising −0.429 −0.1160.27−0.053
Mutual growth 0.717 0.1760.2460.101
Support building 0.45 0.1040.2320.056
Research-oriented −1.397 −0.4110.294−0.187
Administration-oriented −0.046 −0.010.217−0.007
Problem solving-oriented 1.148 0.2550.2220.157
Notes. N = 94, t = for within-set predictors, df = degrees of freedom, B = unstandardized coefficients, SE = standard error, and β = standardized coefficients. Age is in years. Gender was coded as binary with 0 = female and 1 = male. School type was coded in binary with 0 = private and 1 = public/national. Field type was coded in binary with 0 = non-science and 1 = science. * p < 0.05, ** p < 0.01.
Publisher’s Note: MDPI stays neutral with regard to jurisdictional claims in published maps and institutional affiliations.

