Abstract
The development and evaluation of valid assessments of scientific reasoning are an integral part of research in science education. In the present study, we used the linear logistic test model (LLTM) to analyze how item features related to text complexity and the presence of visual representations influence the overall item difficulty of an established, multiple-choice, scientific reasoning competencies assessment instrument. This study used data from n = 243 pre-service science teachers from Australia, Canada, and the UK. The findings revealed that text complexity and the presence of visual representations increased item difficulty and, in total, contributed to 32% of the variance in item difficulty. These findings suggest that the multiple-choice items contain the following cognitive demands: encoding, processing, and combining of textually presented information from different parts of the items and encoding, processing, and combining information that is presented in both the text and images. The present study adds to our knowledge of which cognitive demands are imposed upon by multiple-choice assessment instruments and whether these demands are relevant for the construct under investigation—in this case, scientific reasoning competencies. The findings are discussed and related to the relevant science education literature.
1. Introduction
An understanding of science and its procedures, capabilities, and limitations is crucial for a society facing complex problems. This significance was recently highlighted during the COVID-19 crisis, where misinformation through traditional and social forms of media appeared to be highly influential in shaping peoples’ opinions and actions about the crisis [1]. Science education can respond to these issues in part by supporting the development of scientific reasoning competencies (SRC) among students of science. Additionally, science teachers would benefit from strong SRC themselves to model and promote SRC among their students [2,3,4]. SRC are defined as the dispositions to be able to solve a scientific problem in a certain situation by applying a set of scientific skills and knowledge, and by reflecting on the process of scientific problem-solving at a meta-level [5,6,7,8]. SRC are also seen as a core element of 21st-century skills in science curricula, as they are assumed to help enable civic participation in socio-scientific issues facing societies and have been said to be indicative of a society’s future economic power [9,10]. Hence, SRC, such as developing scientific questions and hypotheses, modeling, generating evidence through experimentation, and evaluating claims, are addressed in science education policy papers and curriculum documents as a key outcome of science education in various countries around the world (e.g., [11,12,13]). SRC are also emphasized as part of science teachers’ professional competencies that should be developed during initial teacher education [14].
Existing studies suggest that pre-service science teachers typically have basic SRC, with pre-service secondary teachers outperforming pre-service primary or early childhood teachers [5]. For the specific skill of scientific modeling, it was shown that pre-service science teachers apply strategies and experience challenges similar to secondary school students [15]. Furthermore, longitudinal studies revealed that SRC slightly develop during science teacher education at university [16] and that specific teacher education programs can contribute to competence development in this field [17].
The development and evaluation of assessments that are capable of providing valid measures of respondents’ SRC have become an integral part of research in science education [8,18]; however, several authors have recently questioned the quality of many existing instruments to assess SRC. For example, Ding et al. [19] identified poor definitions of the underlying constructs to be measured and criticized that most scientific reasoning instruments, “[A]re in fact intended to target a broader construct of scientific literacy” (p. 623) rather than specific competencies needed for reasoning in science. In a review study, it was found that the psychometric quality of most published instruments to assess SRC was not evaluated satisfactorily [18]. Furthermore, Osborne [8] criticized a general lack of validity evidence for these available instruments and referred to the valid assessment of SRC, as, “[T]he 21st century challenge for science education.”
Arguably, an exception to these criticisms regarding the quality of instruments to assess SRC is a German multiple-choice instrument that has recently been developed to assess pre-service science teachers’ SRC during their course of studies at university [16,20]. English and Spanish adaptations of this instrument have also been developed and evaluated [5,21]. For the original German instrument, comprehensive sources of validity evidence have been considered following the recommendations in the Standards for Educational and Psychological Testing [22]. For example, the instrument has been developed based on a clear theoretical framework, distinguishing between two sub-competencies of scientific reasoning—conducting scientific investigations and using scientific models—and seven related skills of formulating research questions, generating hypotheses, planning investigations, analyzing data and drawing conclusions, judging the purpose of models, testing models, and changing models. Furthermore, standardized construction guidelines for item development were used based on this framework [23], and the whole process of item development was guided by a critical examination of various sources of validity evidence (e.g., [23,24]), as summarized in [16]. In this process, one validation study [24] analyzed the influence of item features on item difficulty. The authors found that item length (word count) and the use of visual images, tables, formulas, abstract concepts, and specialized terms in the items significantly contributed to item difficulty. Taken together, these features contributed to 32% of the variance in item difficulty. The authors argued that these findings still provide evidence for the valid interpretation of the test scores as measures of SRC because the identified effects of item features on item difficulty were in accordance with the theoretical background of item development, and they showed a plausible pattern of cognitive demands [24].
In general, the analysis of item features and their influence on item difficulty is a common approach to research in psychological and educational assessment [25,26,27,28]. The basic assumption in this context is that assessments should represent the construct under investigation and test items should stimulate cognitive processes that constitute the target construct (construct validity or construct representation, respectively, [29,30]). For example, items that are intended to assess the competencies of “analyzing evidence” might provide an experimental design and corresponding findings and ask students to interpret the evidence appropriately [28]. The development of test items has to account for item features and underlying cognitive processes so that the instrument allows for valid interpretations of obtained test scores [27]. Related to this, legitimate and illegitimate sources of item difficulty have been distinguished [24]. While legitimate sources of item difficulty are those that are intentionally implemented to assess skills or knowledge representative of the respective competency, illegitimate sources of item difficulty are not directly related to the target construct, such as reading capabilities in science or mathematics tests, and can negatively impact valid test score interpretation [24]. Identifying threats to validity, such as construct-irrelevant sources of item difficulty, however, has the potential to inform item development and thus improve the validity of assessments. Furthermore, construct-relevant sources of item difficulty can guide item development [27,31]. Nonetheless, “[W]hat constitutes construct-irrelevant variance is a tricky and contentious issue” [30] (p. 743) and depends on the definition of the respective construct. As a result, exploratory studies investigating the influence of item features on item difficulty of an existing assessment instrument can contribute to a better understanding of the cognitive demands of the instrument [26,28].
This study adds to this body of research by investigating the influence of item features on item difficulty of the above-mentioned German multiple-choice instrument. This study contributes to construct validation of this internationally employed testing instrument [16,21]. Furthermore, and independent from the specific instrument, this study provides insights about the influence of item features on item difficulty, and as a result, might be used by scholars to provide direction for systematically developing testing instruments that account for such features [27]. The focus of this study is on formal item features related to text complexity and the presence of external visual representations. There are already some studies that investigated the influence of formal item features on item difficulty in science education. For example, text length has been identified as a feature that tends to increase item difficulty [24,32]. In contrast to internal (i.e., mental) representations, external representations are defined as externalizations or materializations of more or less abstract thoughts in the form of gestures, objects, pictures and signs [33]. Taxonomies of (external) representations distinguish between descriptions and depictions, with descriptions including text, mathematical expressions, and formulas and depictions including photographs, maps, and diagrams [34]. Many representations are also combinations of different forms. For example, diagrams include textual (descriptive) and graphical (depictive) elements [35]. Formal item features, such as text length or task format, have been described as being part of the surface structure of test items; that is, such item features are often not directly related to the construct to be assessed [32,36]. On the other hand, the existence of formal item features is an inevitable part of item development, and hence, knowledge about how such features influence item difficulty is of significance for scholars interested in developing testing instruments.
2. Aims of the Study and Hypotheses
This study investigates the effect of item features on item difficulty for the English adaptation of the multiple-choice SRC assessment instrument described above. Item features related to text complexity and the presence of visual representations will be tested for their influence on item difficulty. This study complements existing evaluation studies on the English adaptation of the instrument that have not yet analyzed item features [5,21]. Furthermore, the present study also significantly adds to our knowledge of which cognitive demands appear to be imposed upon by multiple-choice assessment instruments and whether these demands are relevant for the construct under investigation—in this case, SRC [24,28,31].
The following assumptions undergird the study: (1) item difficulty is increased with an increase in the complexity of text included in the item because the complex text makes it more difficult to encode and process information relevant to identify the attractor (or the correct answer option) [24,32]; (2) item difficulty is increased for items that contain visual representations next to textual information because this addition requires respondents to simultaneously encode and process information that is presented in text and image, which, in turn, increases cognitive load [37].
3. Materials and Methods
3.1. Sample and Data Collection
Data of N = 243 pre-service science teachers from Australia (n = 103; mean age= 28), Canada (n = 112; mean age= 27), and the UK (n = 26; mean age= 31) were analyzed in this study. Some data partly originate from existing studies [2,3,5,21] and were secondarily analyzed for the purpose of this study. The UK sub-sample contains new data that have neither been analyzed nor published. Hence, this study made use of some available data sets in order to test the above hypotheses. Having an international sample with participants from three countries allowed the hypotheses to be tested independently from the specific context and, thus, potentially provide more generalizable findings. SRC are an important goal of science teacher education in all three countries [2,3].
In each case, participating pre-service science teachers voluntarily agreed to participate in this study and anonymously completed the instrument, which is why the sample sizes are relatively small (e.g., n = 26 from the UK). The study information was shared with participants digitally (i.e., via email) or in person, in science methods courses of the respective pre-service teacher education programs. Completing the instrument, however, occurred outside of courses and was not an obligatory part of the pre-service science teachers’ curriculum. Ethics approval was also obtained from local ethics approval committees. To ensure equivalence of testing conditions, the same standardized test instruction was used in all three subsamples—namely, background information about the study and the assessed competencies, and voluntary participation.
In all three subsamples, the above-mentioned English adaptation of the German SRC assessment instrument was administered. As described in [5,21], the English adaptation was systematically translated and evaluated based on the German original instrument [16]. For each of the seven skills of formulating research questions, generating hypotheses, planning investigations, analyzing data and drawing conclusions, judging the purpose of models, testing models, and changing models, the English instrument includes three multiple-choice items (i.e., 21 items in total). Each item is contextualized within an authentic scientific context, and the respondents have to apply their procedural and epistemic knowledge within this context to identify the attractor. (For sample items, see [21]; the full instrument is available upon request to the first author).
3.2. Item Analysis
The aim of this study was to analyze the influence of item features related to text complexity and the presence of visual representations on item difficulty. For this purpose, 21 items were analyzed by a trained student assistant and the first author to obtain information about text complexity and the presence of visual representations (i.e., figures or diagrams) in each item. The latter was scored with yes (=1) or no (=0) as this scoring was also conducted in earlier studies (e.g., [24,32]). For text complexity, three different readability measures were calculated, as described in [38]: the 4. Wiener Sachtextformel (WSTF), local substantival textual cohesion (LSTC), and global substantival textual cohesion (GSTC). These readability measures provide a sound statistical estimation of text complexity in science education [38].
The 4. Wiener Sachtextformel (WSTF) calculates a readability measure based on the percentage of words with more than two syllables (SYLL) and the average length (i.e., word count) of sentences (SENT) as follows [39]:
Substantival textual cohesion indicates text coherence based on substantives, either locally (i.e., in consecutive sentences) or globally (i.e., in the whole text) [40]. Global substantival textual cohesion (GSTC) is calculated by dividing the number of substantives that appear more than once in a text (SUB2) by the number of substantives that appear only once (SUB). Local substantival textual cohesion (LSTC) is calculated by dividing the number of substantially connected sentences (LSCS, i.e., consecutive sentences with the same substantive) by the total number of sentences (S) as follows:
Higher numbers of WSTF and lower numbers of LSTC and GSTC indicate more complex texts; 5.4 < WSTF < 8.4, 0.41 < LSTC < 0.65, and 0.70 < GSTC < 0.89 have been suggested as indicating appropriately understandable texts for science education [38].
3.3. Data Analysis: Linear Logistic Test Model
To estimate the influence of the different item features on an item’s difficulty, the linear logistic test model (LLTM) was applied [41,42] as this model was applied in several similar studies analyzing item features (e.g., [28,43]). The LLTM belongs to Rasch models, a family of established psychometric models utilized in psychological and educational research [44]. The family of Rasch models includes descriptive and explanatory psychometric models [45,46]. For example, the one-parameter logistic model (1PLM) is a descriptive psychometric model that allows for the estimation of individual person ability (θs) and item difficulty (βi) parameters. In 1PLM, it is assumed that the probability of a correct item response depends only on θs and βi [44].
In contrast to descriptive models such as 1PLM, explanatory models consider item or person features to further explain the item difficulty or person ability parameters, respectively [46]. The LLTM is an item explanatory model because it assumes that item difficulty is a linear (additive) combination of basic parameters αk [43]. Formally, the βi parameter of 1PLM is replaced with a linear combination of these basic parameters [41] as follows:
where αk as the regression coefficient for k (i.e., the estimated difficulty of the item feature k), and Χik as the given weight of item feature k on item i (i.e., the extent to which the respective item feature applies to item i). Hence, αk illustrates the contribution of item feature k to item difficulty [43]. If an LLTM can be shown to fit the given data, the estimated parameters αk provide measures for the item features’ contribution to item difficulty. More specifically, it is assumed that item difficulty can be sufficiently and totally explained with the specified parameters in the LLTM [42]. Therefore, the LLTM can be considered more restrictive and more parsimonious than the 1PLM [47].
To evaluate the model fit of an LLTM, a two-step procedure is proposed: first, 1PLM has to fit “at least approximately” [42] (p. 509) to the data. For testing the fit of a Rasch model to the given data, fit indices such as the sum of squared standardized residuals (MNSQs) are proposed. MNSQs provide a measure of the discrepancy between the assumptions of the Rasch model and the observed data [48]. Second, the decomposition of βi (Formula 5) needs to be checked for empirical validity. For this reason, the item difficulty parameters estimated in 1PLM, and the corresponding LLTM can be compared (e.g., graphically or by calculating Pearson correlation coefficient, [25]). High associations between both parameters indicate that the decomposition of βi might be valid [42]. Furthermore, information criteria, such as the Akaike information criterion (AIC) and the Bayesian information criterion (BIC), and the log-likelihood difference test can be applied to compare the fit of both models and different LLTMs [42]. In the present study, the R package eRm [49] was used for model specification and parameter estimation.
3.4. Model Specification
In this study, two LLTMs with the following variables were specified to estimate parameters αk. In the first LLTM–called LLTMbaseline–it was coded to which of the seven skills each item belongs (i.e., dummy coding). This procedure mirrors the assumption that there are specific cognitive demands to solve the items associated with each skill [23,50]. Hence, the assignment to the respective skills is assumed to sufficiently and totally explain the item difficulty in the LLTMbaseline.
The second LLTM—called LLTMextended—additionally included parameters for the readability measures WSTF, LSTC, and GSTC, and the presence of visual representations described above. Hence, the LLTMextended assumes that next to the scientific reasoning skills, the readability of text and the presence of visual representations also impose specific cognitive demands to process and encode information provided in the items, and to answer correctly [24,32,37,38].
4. Results
The Results Section is subdivided into three subsections: Basic Statistics, Descriptive Modeling, and Explanatory Modeling. The latter two sections refer to the two-step procedure of LLTM model evaluation, as described in Section 3.3.
4.1. Basic Statistics
Table 1 provides basic descriptive statistics and Pearson correlations for item difficulty and the variables considered in this study. Item difficulty was calculated as the proportion of correct responses (i.e., 1.0 = 100% correct responses). It is evident that the multiple-choice items had appropriate difficulty for the present sample, as about 47% of them were answered correctly (MItemDiff = 0.47). About 43% of the items contain a visual representation. Based on the WSTF and LSTC, the items would be considered rather easy to read. The LSTC is even higher than expected, indicating a very high local substantival textual cohesion. Only the average GSTC (MGSTC = 0.63) indicates low global substantival textual cohesion of the items. Statistically significant correlations (i.e., p < 0.05) were only found between LSTC and GSTC (r = 0.48; medium effect size). Due to the medium effect size of this correlation, no serious problem of multicollinearity for further analysis occurs. Notably, no statistically significant correlations were found between item difficulty (ItemDiff) and the variables WSTF, LSTC, GSTC, and VisRep.

Table 1.
Mean score (M), standard deviation (SD), and Pearson correlation coefficient (r) with related p-value for the respective variables. Expectance = values indicating appropriately understandable texts as suggested in [38]. ItemDiff = item difficulty; WSTF = 4. Wiener Sachtextformel; LSTC = local substantival textual cohesion; GSTC = global substantival textual cohesion; VisRep = item contains a visual representation (0 = no; 1 = yes).
For further illustration, sample items can be found in Appendix A. These items represent the median score of WSTF (M = 6.51), LSTC (M = 0.85), and GSTC (M = 0.61), respectively.
Figure 1 below illustrates how the variables shown in Table 1 differ between the tasks for the seven skills of scientific reasoning. Kruskal–Wallis tests indicate significant differences between the skills for the variables GSTC (H = 13.19, p = 0.040) and VisRep (H = 12.22, p = 0.045). For GSTC, items related to the skills planning investigations (M = 0.73) and analyzing data and drawing conclusions (M = 0.78) show rather high values, compared to lower values for the skills formulating research questions (M = 0.53), generating hypotheses (M = 0.55), judging the purpose of models (M = 0.66), testing models (M = 0.54), and changing models (M = 0.64). These five skills are below the suggested range of 0.70 < GSTC < 0.89, unlike the others, indicating appropriately understandable texts in science education [39]. For VisRep, it is evident that items related to formulating research questions, generating hypotheses, and planning investigations do not contain visual representations, while most items related to the other skills do.
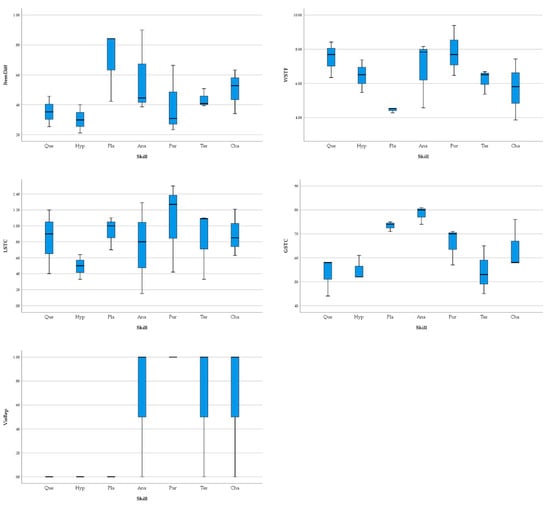
Figure 1.
Boxplots for the variables ItemDiff (top left), WSTF (top right), LSTC (middle left), GSTC (middle right), and VisRep (bottom left) separated for the items assessing the seven skills formulating research questions (Que), generating hypotheses (Hyp), planning investigations (Pla), analyzing data and drawing conclusions (Ana), judging the purpose of models (Pur), testing models (Tes), and changing models (Cha).
4.2. Descriptive Rasch Modeling: One-Parameter Logistic Model (1PLM)
The fit between data and 1PLM has been evaluated and documented in previous studies in detail [2,5,16,21]. Here, MNSQs are reported, which indicates the discrepancy between the assumptions of the Rasch model and the data. MNSQ values are always positive because statistically, they are chi-square statistics divided by their degrees of freedom [51]. MNSQ values should lie in the range of 0.5–1.5 (“productive for measurement”) or 1.5–2.0 (“unproductive for construction of measurement but not degrading”), respectively, but not be >2.0 (“distorts or degrades the measurement system”) [48]. MNSQs can be calculated in two different versions—the outfit and the infit MNSQ. As the outfit MNSQ is more sensitive to outliers than the infit MNSQ, both statistics should be considered [51].
The MNSQ values in this study range between 0.7 and 1.2 (outfit MNSQ), and between 0.9 and 1.1 (infit MNSQ), respectively. Furthermore, the Andersen likelihood ratio test with the external split criterion “country” (i.e., Australia, Canada, UK) is not significant (LR(40) = 46.22, p = 0.23), thus indicating item homogeneity [49]. Person separation reliability is rel. = 0.52 and similar to previous reliability estimates for this instrument (e.g., [5]: EAP/PV reliability = 0.55; [16]: Cronbach’s Alpha = 0.60).
4.3. Explanatory Rasch Modeling: Linear Logistic Test Model (LLTM)
MNSQ values for both LLTMs indicate a reasonable fit between data and model (LLTMbaseline: 0.7 < outfit MNSQ < 1.6; 0.7 < infit MNSQ < 1.5; LLTMextended: 0.5 < outfit MNSQ < 1.7; 0.7 < infit MNSQ < 1.6). Person separation reliability is rel. = 0.46 and 0.50, respectively. Pearson correlations between the item parameters estimated in the LLTMs and the 1PLM are large for both the LLTMbaseline (r = 0.65, p = 0.002; i.e., R2 = 0.42) and the LLTMextended (r = 0.86, p < 0.001; i.e., R2 = 0.75). The graphical model tests of the LLTMs and the 1PLM show that the item parameters scatter around the 45° line rather well for the LLTMextended, while less so for the LLTMbaseline (Figure 2). This is also indicated by the empirical regression line (blue lines in Figure 2), which is closer to the 45° diagonal when comparing item difficulty parameters of the 1PLM and the LLTMextended than when comparing these parameters of the 1PLM and the LLTMbaseline. In sum, the findings indicate that the item parameters estimated in the LLTMextended were closer to the estimated parameters from the 1PLM, than those estimated in the LLTMbaseline.
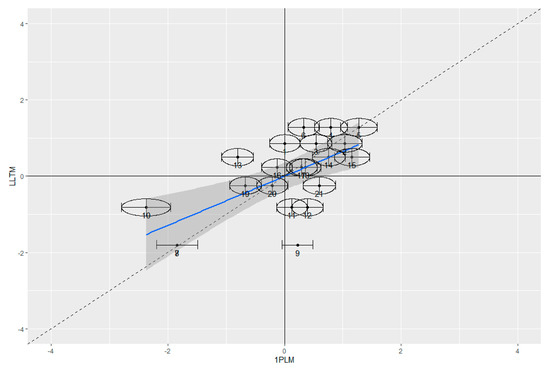
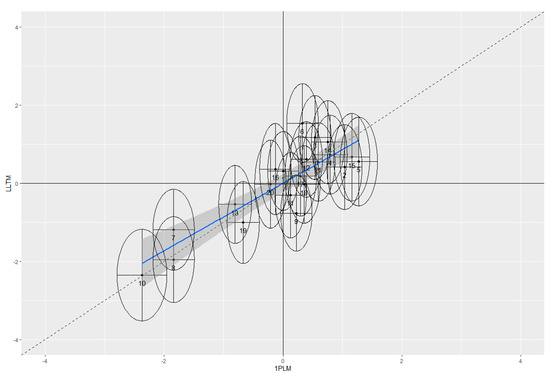
Figure 2.
Graphical model tests comparing the 1PLM (x-axis) and the LLTM (y-axis) by the estimated item parameters (logits) for the LLTMbaseline (top) and the LLTMextended (bottom). Each dot represents one item, with a 2*standard error of estimated item parameter (ellipses). The blue line is the empirical regression, with a 95% confidence interval in grey.
Table 2 provides the information criteria AIC and BIC and the log-likelihood difference test for model comparison between the 1PLM and the two LLTMs. AIC and BIC assess the relative model fit, with smaller values indicating the better fitting model. These values, therefore, indicate that the 1PLM fits better with the data than both LLTMs. The log-likelihood difference test also proposes a significantly better fit of the 1PL, compared to both LLTMs. Comparing both LLTMs, AIC and BIC indicate that the LLTMextended fits better to the data than the LLTMbaseline.
Table 2.
Model comparison between the 1PLM and both LLTMs (LogLik: marginal log-likelihood; AIC: Akaike information criterion; BIC: Bayesian information criterion; LD test: p-value of the log-likelihood difference test comparing the respective LLTM with the 1PLM).
Table 3 provides the αk parameters as estimated in the two LLTMs. Positive αk parameters indicate that the respective variable decreases item difficulty, while negative αk parameters illustrate an increase in item difficulty. For the dummy coded variables representing the seven skills of scientific reasoning, planning investigations was chosen as the baseline because the related items ended up being rather easy (Figure 1). As the confidence intervals of most parameters in Table 3 do not include zero, they can be assumed to be significantly different from zero at the 5% level. Exceptions are WSTF, Pur, Test, and Cha in the LLTMextended. Comparing the parameters in both LLTMs, it is evident the additional consideration of the variables WSTF, LSTC, GSTC, and VisRep reduces the effect of most of the dummy coded skills.
Table 3.
Parameters estimated in the two LLTMs (SE = standard error; 95% CI = 95% confidence interval); lines with 95% CI including zero are formatted in grey.
In the LLTMextended, the existence of visual representations (αk = −0.79) makes items harder to solve. Similarly, items related to the skills formulating research questions, generating hypotheses, and analyzing data and drawing conclusions are harder to solve than items related to the skill planning investigations (i.e., the baseline); this is also evident in Figure 1. As lower numbers of LSTC and GSTC are indicative of more complex texts, the αk parameters of GSTC are in line with what was expected: the lower the GSTC is, the more difficult are the items to solve. Unlike expected, lower LSTC values decreased item difficulty (αk = −1.89).
As described above (Formula (5)), each item’s difficulty is calculated in an LLTM as a linear (additive) combination of the item features’ difficulty, with αk as the estimated difficulty of item feature k. Based on the αk values in Table 3, this means for the LLTMextended that, for example, GSTC impacts item difficulty about seven times stronger than VisRep (5.61/0.79 = 7.1). It is important to note that αk values are unstandardized and do not take the different scales of item features into account (e.g., binary variable VisRep vs. continuous variable GSTC).
5. Discussion
The purpose of this study was to investigate the effect of item features on item difficulty for a multiple-choice SRC assessment instrument established in science education [5,16,21]. More specifically, item features related to text complexity (4. Wiener Sachtextformel: WSTF; local and global substantival textual cohesion: LSTC and GSTC) and the presence of visual representations as figures or diagrams (i.e., VisRep) were investigated for their influence on item difficulty. The findings revealed that LSTC and GSTC, as well as VisRep, significantly impacted item difficulty in the multiple-choice assessment instrument, while WSTF did not. These findings are discussed below while acknowledging the limitations of this study.
In this study, the item features considered in the LLTMextended explain about 75% of the variance in item difficulty estimated in the 1PLM—well above the limit of a large effect (R2 ≥ 0.26; [27]) and also higher than what has been found in similar studies (e.g., [28]: R2 = 0.43; [24]: R2 = 0.32). Conversely, a variance explanation of 75% means that 25% of the variance in item difficulty estimated in 1PLM cannot be explained with the parameters specified in the LLTMextended and might be attributable to individual differences. For example, general cognitive abilities such as verbal intelligence and problem-solving skills have been shown to significantly predict students’ SRC [52].
The difference in variance explanation between the two LLTMs specified in this study suggests that 33% of the variance in item difficulty can be explained with the additional parameters related to text complexity and the existence of visual representations included in the LLTMextended, that is, WSTF, LSTC, GSTC, and VisRep. The resulting amount of 33% is very similar to the result of an earlier study that found 32% [24] on item features affecting item difficulty in the German version of the instrument. This similarity in the effect of item features on item difficulty in both language versions of the instrument (English and German) is another indicator of test equivalence between the two versions [21].
A comparison of the parameters estimated in the LLTMbaseline and the LLTMextended (Table 3) reveals that with the additional consideration of parameters related to text complexity and the presence of visual representations, the significant effect of judging the purpose of models (PUR), testing models (TES), and changing models (CHA), which were found in the LLTMbaseline, disappeared. This finding indicates that the significant effects of PUR, TES, and CHA, identified in the LLTMbaseline, might be artifacts caused by the effect of item features not considered in the LLTMbaseline and confounded with PUR, TES, and CHA. For example, all items related to PUR contain visual representations (Figure 1), while, on average, this applies to only 43% of the items (Table 1). Hence, the effect of PUR, identified in the LLTMbaseline, might have been caused by the presence of visual representations as figures or diagrams in the items related to PUR.
While the correlation analysis (Table 1) revealed no significant association between item difficulty and the item parameters of WSTF, LSTC, GSTC, and VisRep, these associations were found for most of the parameters in the LLTMextended. This difference in findings is most likely caused by the fact that the correlation analysis was carried out based on the items (i.e., N = 21), a relatively small number to detect associations on a statistically significant level [26]. In contrast, the parameter estimation in the LLTM was performed based on a larger sample of individuals, or an N = 243 in this study.
Examining the individual parameters estimated in the LLTMextended (Table 3), items containing visual representations tended to be harder to solve. This finding was also reported in [24] and described as unexpected, and potentially caused by the fact that visual representations in the items, “were often used to show complex scientific models and, hence, may increase the difficulty” (p. 8). Another explanation might be that the simultaneous encoding and processing of information provided in text and image can increase cognitive load and, hence, item difficulty [37]. As expected, lower global substantival textual cohesion increased item difficulty, with GSTC calculated as the proportion of substantives that appear more than once in a text (Formula (2)); however, unexpectedly, lower local substantival textual cohesion decreased item difficulty, with LSTC as the proportion of sentences with the same substantive as the preceding or subsequent sentence (Formula (3)). Both GSTC and LSTC measures are established indicators for text complexity and readability, with lower values indicating more difficult text [38]. The effect of GSTC on item difficulty most likely indicates that solving the items requires the encoding and processing of complex textual information provided in the item text globally, a task that is even more difficult with text that is challenging to read [24,32]. For the present multiple-choice items, this processing might involve respondents having to encode, process, and combine information that is textually presented in different parts of the item, such as the item stem and the answering options [50]. Hence, if information in the item stem and the answering options are more coherently presented (in terms of substantives), an item becomes easier to solve. For example, signal words, occurring both in the item stem and the attractor, can ease item difficulty [28]. The unexpected findings related to the effect of LSTC on item difficulty should be investigated further, for example, qualitatively, using cognitive interviews. One plausible reason for the unexpected finding related to LSTC is that both GSTC and LSTC are typically used to analyze the readability of longer texts than what is included in the items of the present multiple-choice instrument [38]. Finally, the significant effects of some of the dummy coded skills (i.e., QUE, HYP, ANA; Table 3) illustrate that the items developed to assess the different skills of scientific reasoning require the application of specific procedural and epistemic knowledge to be solved [23].
The multiple-choice instrument under consideration in this study is already employed by scholars internationally in three language versions [2,16,21]. The findings of the present study shed light on specific cognitive demands that are necessary to correctly answering the items. These findings should be considered by scholars when interpreting test scores. Independent from the specific instrument, the study provides important insights about the influence of item features on item difficulty. These insights can inform the systematic development of a testing instrument that accounts for such features [27].
Naturally, this study has some limitations. The LLTM is well established for the analysis of item features and their influence on item difficulty within the approach of evaluating construct representation (e.g., [25,26]). Nevertheless, the assumption of an additive combination of the single features’ difficulty, as described in Formula (5), is also criticized [43]. For example, a multiplicative combination of each item feature’s influence on item difficulty might also be possible. Furthermore, in this study, only main effects were considered in LLTMs, but no interaction effects were considered between the specified variables. The variables considered in this study were also analyzed post hoc and were not systematically considered during item development; hence, the item features were not equally distributed across the items for the seven skills of SRC (e.g., items related to formulating research questions, generating hypotheses, and planning investigations do not contain visual representations at all; Figure 1). Finally, LLTMs assume that the specified item features completely (i.e., 100%) explain item difficulty [42], which was not the case in the present study. Despite a good explanation of item difficulty in the LLTMextended, there is a significantly better model fit for the 1PLM (Table 2). The comparatively poor model fit of an LLTM is a common finding (e.g., [25,43]), which is explained with the strict assumption of a complete explanation of item difficulty by the specified item features [41]. The model comparison based on the information criteria, on the other hand, does not allow any statement about the absolute fit of the models considered [53]. Since a relatively worse model fit does not necessarily indicate an absolutely bad model fit, a check of the difficulty parameters estimated in the LLTM in the sense of a prognostic validation by replication studies is proposed [27,41]. This approach could be employed in the present context by developing additional items with systematically varied item features, followed by testing these features’ influence on item difficulty again. Notwithstanding this issue of model fit, the comparison of the item difficulty parameters estimated in the 1PLM and both LLTMs allowed for an estimation of the amount of variance in item difficulty explained by the item features specified in the respective LLTM.
6. Conclusions
In this study, we investigated the effect of the item features WSTF, LSTC, GSTC, and VisRep on the difficulty of the items of a multiple-choice instrument to assess SRC in science education [5,21]. This analysis was based on the assumptions that the readability of text and the presence of visual representations impose specific cognitive demands to process and encode information provided in the items [24,32,37,38]. Furthermore, dummy-coded variables representing the specific skills of scientific reasoning were also considered in the analysis, assuming that specific cognitive demands (i.e., application of specific procedural and epistemic knowledge) are associated with each skill [23,50]. The findings illustrate that these variables, in sum, explain about 75% of the variance in item difficulty.
From a validity perspective, the similarity between the present findings and the previous study on the German version of the multiple-choice instrument [24] provides further evidence for test equivalence of both language versions [21]. From a cognitive point of view [25], the findings of the present study suggest that specific cognitive demands are imposed by the readability of text and the presence of visual representations in multiple-choice assessment instruments. Specifically, the multiple-choice items analyzed in the present study appear to demand the encoding, processing, and combining of textually presented information from different parts of the items—such as item stem and answering options—while simultaneously encoding and processing information that is presented in both the text and visual representations. It has been shown that to solve the multiple-choice items used in this study, the application of procedural and epistemic knowledge is required [23,50]. The findings of this study illustrate that multiple-choice items on this assessment impose additional cognitive demands due to the necessity of processing text and visual representations.
Author Contributions
Conceptualization, M.K.; methodology, M.K.; investigation, M.K., S.K., and J.v.D.; resources, M.K., S.K., and J.v.D.; writing—original draft preparation, M.K.; writing—review and editing, M.K., S.K., and J.v.D.; visualization, M.K.; funding acquisition, M.K., S.K., and J.v.D. All authors have read and agreed to the published version of the manuscript.
Funding
This research was funded by the FUB Center for International Cooperation, Grant Number FMEx2-2016-104, and the 2018 UBC-FUB Joint Funding Scheme, Grant Number FSP-2018-401.
Institutional Review Board Statement
The study was conducted according to the guidelines of the Declaration of Helsinki, and approved by the Institutional Review Boards (or Ethics Committees) of The University of Melbourne (ID 11530, approved 3 January 2018), of the University of British Columbia (ID H18-01801, approved 23 July 2018), and of the University of Dundee (ID E2018-94, approved 15 July 2019).
Informed Consent Statement
Informed consent was obtained from all subjects involved in the study.
Data Availability Statement
Data is available upon request to the first author.
Acknowledgments
The authors wish to thank Alexis Gonzalez and Song Xue in data collection and tabulation for the Canadian and UK samples, respectively, Christine Redman for her help with data collection for the Australian sample, and Jonna Kirchhof for her support in item analysis described in Section 3.2.
Conflicts of Interest
The authors declare no conflict of interest. The funders had no role in the design of the study; in the collection, analyses, or interpretation of data; in the writing of the manuscript, or in the decision to publish the results.
Appendix A
The below items represent the median score of WSTF (M = 6.51), LSTC (M = 0.85), and GSTC (M = 0.61), respectively. Note that the items are presented in a tabular format for better reading and not in the same way as they appeared in the testing instrument. The attractor of each item is highlighted in italics.
| Item “testing models 03” (MWSTF = 6.51) |
| Item stem Fraud with organic grocery bags? Under the influence of oxygen, bacteria and fungi transform organic material mainly into carbon dioxide and water. This process of transformation is called composting. A part of the resulting substances is transformed into humus (dead organic soil matter). The following report was published in a newspaper: “The Deutsche Umwelthilfe (German Environmental Relief) launch accusations against two supermarket chains: The allegedly 100 % compostable grocery bags are not biodegradable at all; therefore they are just as ecologically harmful as common plastic bags.” A team of experts has been asked to conduct a scientific investigation into how compostable are these organic grocery bags really? |
| Answering options Which scientific question might underlie this investigation? Tick one of the boxes below.
|
| Item “changing models 03” (MLSTC = 0.85) |
| Item stem Language Acquisition In physical reality, there is a variety of continuous transitions between different sounds, such as [ra] and [la]. While infants are aurally capable of perceiving all of these different transitions of sound, an imprint toward a specific language can be observed after the first year of life. Vocal expressions within different languages are then no longer perceived in their entirety but rather through a specific filter. For this phenomenon of language acquisition, the following model was developed: 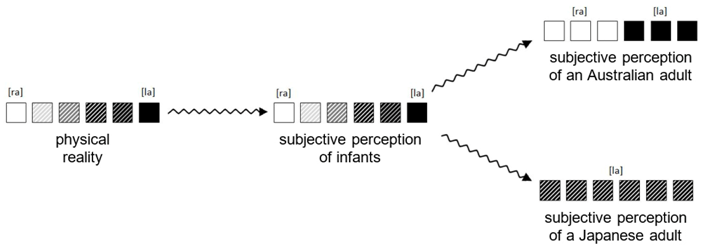 Figure. Model of language acquisition by sound perception. The model predicts that Australians and Japanese acquire their language in different ways and the subjective perception of sounds develops differently. |
| Answering options What reason would make it necessary to change the model? Tick one of the boxes below. The model has to be changed…
|
| Item “generating hypotheses 02” (MGSTC = 0.61) |
| Item stem In Outer Space After many years of space missions, we know that existing conditions in space, such as zero gravity and cosmic radiation, harm the human body in the long run. Previous stays in outer space were limited to a few months, whereas the scheduled flights to Mars will span many months—a considerably longer duration. In a study, the health impacts of such long-lasting stays in outer space are to be investigated. |
| Answering options Which scientific hypothesis might underlie this investigation? Tick one of the boxes below.
|
References
- Erduran, S. Science education in the era of a pandemic: How can history, philosophy and sociology of science contribute to education for understanding and solving the Covid-19 crisis? Sci. Educ. 2020, 29, 233–235. [Google Scholar] [CrossRef] [Green Version]
- Khan, S.; Krell, M. Scientific reasoning competencies: A case of preservice teacher education. Can. J. Sci. Math. Technol. Educ. 2019, 19, 446–464. [Google Scholar] [CrossRef] [Green Version]
- Krell, M.; Dawborn-Gundlach, M.; van Driel, J. Scientific reasoning competencies in science teaching. Teach. Sci. 2020, 66, 32–42. [Google Scholar]
- Mathesius, S.; Hartmann, S.; Upmeier zu Belzen, A.; Krüger, D. Scientific reasoning as an aspect of pre-service biology teacher education. In The Future of Biology Education Research: Proceedings of the 10th Conference of European Researchers in Didactics of Biology (ERIDOB); Tal, T., Yarden, A., Eds.; Technion: Haifa, Israel, 2016; pp. 93–110. [Google Scholar]
- Krell, M.; Redman, C.; Mathesius, S.; Krüger, D.; van Driel, J. Assessing pre-service science teachers’ scientific reasoning competencies. Res. Sci. Educ. 2018, 50, 2305–2329. [Google Scholar] [CrossRef]
- Lawson, A.E. The nature and development of scientific reasoning: A synthetic view. Int. J. Sci. Math. Educ. 2004, 2, 307–338. [Google Scholar] [CrossRef]
- Morris, B.J.; Croker, S.; Masnick, A.M.; Zimmerman, C. The emergence of scientific reasoning. In Current Topics in Children’s Learning and Cognition; Kloos, H., Morris, B.J., Amaral, J.L., Eds.; InTech: London, UK, 2012; pp. 61–82. [Google Scholar] [CrossRef] [Green Version]
- Osborne, J. The 21st century challenge for science education: Assessing scientific reasoning. Think. Ski. Creat. 2013, 10, 265–279. [Google Scholar] [CrossRef]
- European Commission. Science Education for Responsible Citizenship; European Commission: Luxembourg, 2015; Available online: https://op.europa.eu/de/publication-detail/-/publication/a1d14fa0-8dbe-11e5-b8b7-01aa75ed71a1 (accessed on 25 August 2021).
- OECD. The High Cost of Low Educational Performance: The Long-Run Economic Impact of Improving PISA Outcomes (PISA); OECD: Paris, France, 2010; Available online: https://www.oecd.org/pisa/44417824.pdf (accessed on 25 August 2021).
- Australian Curriculum, Assessment and Reporting Authority (ACARA). The Australian Curriculum F-10: The Three Interrelated Strands of Science; Australian Curriculum, Assessment and Reporting Authority: Sydney, Australia, 2018. Available online: https://www.australiancurriculum.edu.au/f-10-curriculum/science/structure/ (accessed on 16 June 2020).
- KMK. Bildungsstandards im Fach Biologie Für Die Allgemeine Hochschulreife; Wolters Kluwer: Hürth, Germany, 2020; Available online: https://www.kmk.org/fileadmin/Dateien/veroeffentlichungen_beschluesse/2020/2020_06_18-BildungsstandardsAHR_Biologie.pdf (accessed on 25 August 2021).
- NGSS Lead States (Ed.) Next Generation Science Standards: For States, by States; The National Academies Press: Washington, DC, USA, 2013. [Google Scholar]
- Osborne, J. Teaching Scientific Practices: Meeting the Challenge of Change. J. Sci. Teach. Educ. 2014, 25, 177–196. [Google Scholar] [CrossRef]
- Göhner, M.; Krell, M. Preservice Science Teachers’ Strategies in Scientific Reasoning: The Case of Modeling. Res. Sci. Educ. 2020, 1–20. [Google Scholar] [CrossRef]
- Krüger, D.; Hartmann, S.; Nordmeier, V.; Upmeier zu Belzen, A. Measuring scientific reasoning competencies. In Student Learning in German Higher Education; Zlatkin-Troitschanskaia, O., Pant, H., Toepper, M., Lautenbach, C., Eds.; Springer: Wiesbaden, Germany, 2020; pp. 261–280. [Google Scholar] [CrossRef]
- Stammen, A.; Malone, K.; Irving, K. Effects of modeling instruction professional development on biology teachers’ scientific reasoning skills. Educ. Sci. 2018, 8, 119. [Google Scholar] [CrossRef] [Green Version]
- Opitz, A.; Heene, M.; Fischer, F. Measuring scientific reasoning: A review of test instruments. Educ. Res. Eval. 2017, 23, 78–101. [Google Scholar] [CrossRef]
- Ding, L.; Wei, X.; Mollohan, K. Does higher education improve student scientific reasoning skills? Int. J. Sci. Math. Educ. 2016, 14, 619–634. [Google Scholar] [CrossRef]
- Hartmann, S.; Upmeier zu Belzen, A.; Krüger, D.; Pant, H.A. Scientific reasoning in higher education. Z. Für Psychol. 2015, 223, 47–53. [Google Scholar] [CrossRef]
- Krell, M.; Mathesius, S.; van Driel, J.; Vergara, C.; Krüger, D. Assessing scientific reasoning competencies of pre-service science teachers: Translating a German multiple-choice instrument into English and Spanish. Int. J. Sci. Educ. 2020, 42, 2819–2841. [Google Scholar] [CrossRef]
- American Educational Research Association; American Psychological Association; National Council on Measurement in Education. Standards for Educational and Psychological Testing; American Educational Research Association: Washington, DC, USA, 2014. [Google Scholar]
- Mathesius, S.; Upmeier zu Belzen, A.; Krüger, D. Kompetenzen von Biologiestudierenden im Bereich der naturwissenschaftlichen Erkenntnisgewinnung: Entwicklung eines Testinstruments. Erkenn. Biol. 2014, 13, 73–88. [Google Scholar]
- Stiller, J.; Hartmann, S.; Mathesius, S.; Straube, P.; Tiemann, R.; Nordmeier, V.; Krüger, D.; Upmeier zu Belzen, A. Assessing scientific reasoning: A comprehensive evaluation of item features that affect item difficulty. Assess. Eval. High. Educ. 2016, 41, 721–732. [Google Scholar] [CrossRef]
- Baghaei, P.; Kubinger, K. Linear logistic test modeling with R. Pract. Assess. Res. Eval. 2015, 20, 1–11. [Google Scholar]
- Embretson, S.; Daniel, R. Understanding and quantifying cognitive complexity level in mathematical problem solving items. Psychol. Sci. Q. 2008, 50, 328–344. [Google Scholar]
- Hartig, J.; Frey, A. Konstruktvalidierung und Skalenbeschreibung in der Kompetenzdiagnostik durch die Vorhersage von Aufgabenschwierigkeiten. Psychol. Rundsch. 2012, 63, 43–49. [Google Scholar] [CrossRef]
- Krell, M. Schwierigkeitserzeugende Aufgabenmerkmale bei Multiple-Choice-Aufgaben zur Experimentierkompetenz im Biologieunterricht: Eine Replikationsstudie. Z. Für Didakt. Der Nat. 2018, 42, 1–15. [Google Scholar] [CrossRef]
- Embretson, S. Construct validity. Psychol. Bull. 1983, 93, 179–197. [Google Scholar]
- Messick, S. Validity of psychological assessment. Am. Psychol. 1995, 50, 741–749. [Google Scholar] [CrossRef]
- Schecker, H.; Neumann, K.; Theyßen, H.; Eickhorst, B.; Dickmann, M. Stufen experimenteller Kompetenz. Z. Für Didakt. Der Nat. 2016, 22, 197–213. [Google Scholar] [CrossRef]
- Prenzel, M.; Häußler, P.; Rost, J.; Senkbeil, M. Der PISA-Naturwissenschaftstest: Lassen sich die Aufgabenschwierigkeiten vorhersagen? Unterrichtswissenschaft 2002, 30, 120–135. [Google Scholar]
- Krey, O.; Schwanewedel, J. Lernen mit externen Repräsentationen. In Theorien in Der Naturwissenschaftsdidaktischen Forschung; Krüger, D., Parchmann, I., Schecker, H., Eds.; Springer: Cham, Germany, 2018; pp. 159–175. [Google Scholar]
- Schnotz, W. lntegrated Model of Text and Picture Comprehension. In The Cambridge Handbook of Multimedia Learning; Mayer, R., Ed.; Cambridge University Press: New York, NY, USA, 2005; pp. 72–103. [Google Scholar]
- Wu, H.-K.; Puntambekar, S. Pedagogical affordances of multiple external representations in scientific processes. J. Sci. Educ. Technol. 2012, 21, 754–767. [Google Scholar] [CrossRef]
- Schnotz, W.; Baadte, C. Surface and deep structures in graphics comprehension. Mem. Cogn. 2015, 43, 605–618. [Google Scholar] [CrossRef] [Green Version]
- Paas, F.; Sweller, J. Implications of cognitive load theory for multimedia learning. In The Cambridge Handbook of Multimedia Learning; Mayer, R., Ed.; Cambridge University Press: New York, NY, USA, 2014; pp. 27–42. [Google Scholar]
- Kulgemeyer, C.; Starauschek, E. Analyse der Verständlichkeit naturwissenschaftlicher Fachtexte. In Methoden in Der Naturwissenschaftsdidaktischen Forschung; Krüger, D., Parchmann, I., Schecker, H., Eds.; Springer: Berlin, Germany, 2014; pp. 241–253. [Google Scholar]
- Bamberger, R.; Vanacek, E. Lesen-Verstehen-Lernen-Schreiben: Die Schwierigkeitsstufen Von Texten in Deutscher Sprache; Jugend und Volk: Wien, Austria, 1984. [Google Scholar]
- Starauschek, E. Der Einfluss von Textkohäsion und gegenständlichen externen piktoralen Repräsentationen auf die Verständlichkeit von Texten zum Physiklernen. Z. Für Didakt. Der Nat. 2006, 12, 127–157. [Google Scholar]
- Fischer, G. The linear logistic test model. In Rasch Models; Fischer, G., Molenaar, I., Eds.; Springer: New York, NY, USA, 1995; pp. 131–155. [Google Scholar]
- Fischer, G.H. Linear Logistic Test Models. In Encyclopedia of Social Measurement; Kempf-Leonard, K., Ed.; Elsevier: Amsterdam, The Netherlands, 2005; pp. 505–514. [Google Scholar]
- Hartig, J.; Frey, A.; Nold, G.; Klieme, E. An application of explanatory item response modeling for model-based proficiency scaling. Educ. Psychol. Meas. 2012, 72, 665–686. [Google Scholar] [CrossRef]
- Embretson, S.; Reise, S. Item Response Theory for Psychologists; Erlbaum: Mahwah, NJ, USA, 2000. [Google Scholar]
- Wilson, M.; de Boeck, P. Descriptive and explanatory item response models. In Explanatory Item Response Models; de Boeck, P., Wilson, M., Eds.; Springer: New York, NY, USA, 2004; pp. 43–74. [Google Scholar]
- Wilson, M.; de Boeck, P.; Carstensen, C. Explanatory Item Response Models: A Brief Introduction. In Assessment of Competencies in Educational Contexts; Hartig, J., Klieme, E., Leutner, D., Eds.; Hogrefe Publishing: Göttingen, Germany, 2008; pp. 83–110. [Google Scholar]
- Mair, P.; Hatzinger, R. Extended Rasch modeling. J. Stat. Softw. 2007, 20, 1–20. [Google Scholar] [CrossRef] [Green Version]
- Wright, B.; Linacre, J. Reasonable mean-square fit values. Rasch Meas. Trans. 1994, 8, 370. [Google Scholar]
- Mair, P.; Hatzinger, R.; Maier, M.J. eRm: Extended Rasch Modeling. 2020. Available online: https://cran.r-project.org/package=eRm (accessed on 25 August 2021).
- Mathesius, S.; Upmeier zu Belzen, A.; Krüger, D. Eyetracking als Methode zur Untersuchung von Lösungsprozessen bei Multiple-Choice-Aufgaben zum wissenschaftlichen Denken. In Lehr-und Lernforschung in Der Biologiedidaktik; Hammann, M., Lindner, M., Eds.; Studienverlag: Innsbruck, Austria, 2018; pp. 225–244. [Google Scholar]
- Linacre, J. What do Infit and Outfit, Mean-square and Standardized mean? Rasch Meas. Trans. 2002, 16, 878. [Google Scholar]
- Mathesius, S.; Krell, M.; Upmeier zu Belzen, A.; Krüger, D. Überprüfung eines Tests zum wissenschaftlichen Denken unter Berücksichtigung des Validitätskriteriums relations-to-other-variables. Z. Für Pädagogik 2019, 65, 492–510. [Google Scholar]
- Burnham, K.; Anderson, D. Multimodel inference. Sociol. Methods Res. 2004, 33, 261–304. [Google Scholar] [CrossRef]
Publisher’s Note: MDPI stays neutral with regard to jurisdictional claims in published maps and institutional affiliations. |
© 2021 by the authors. Licensee MDPI, Basel, Switzerland. This article is an open access article distributed under the terms and conditions of the Creative Commons Attribution (CC BY) license (https://creativecommons.org/licenses/by/4.0/).