
Mathematical Thinking Styles—The Advantage of Analytic Thinkers When Learning Mathematics


Abstract
1. Introduction
2. Theoretical Background
2.1. Mathematical Thinking Styles Theory
- Visual thinking style: Visual thinkers show preferences for distinctive internal pictorial imaginations and externalized pictorial representations as well as preferences for understanding mathematical facts and connections through holistic representations. The internal imaginations are mainly affected by strong associations with experienced situations.
- Analytical thinking style: Analytic thinkers show preferences for internal formal imaginations and for externalized formal representations. They are able to comprehend mathematical facts preferably through existing symbolic or verbal representations and prefer to proceed in a sequence of steps.
- Integrated thinking style: These persons combine visual and analytic ways of thinking and are able to switch flexibly between different representations or ways of proceeding.
2.2. Self-Efficacy Construct
- outcome expectation or outcome expectancies, and
- self-efficacy expectations or perceived self-efficacy.
3. Research Questions and Methodology
3.1. Research Questions
- 1.
- Do Chilean learners with a preference for analytic thinking have better grades than visual and integrated thinkers?
- 2.
- Do Chilean learners with a preference for analytic thinkers have a higher level of self-efficacy?
- 3.
- Do Chilean learners with a preference for analytic thinking have a preference for the internal style, and do the visual thinkers have a preference for the external style?
3.2. Instruments for Data Collection and Sample of the Study
3.3. Data Analysis Procedure
4. Results
4.1. Global Analysis
4.2. Local Analysis: Courses
4.3. Local Analysis: Courses and Their Teachers
4.4. C1T
4.5. C5T and C2T
5. Limitations of the Study
6. Discussion
Author Contributions
Funding
Informed Consent Statement
Conflicts of Interest
References
- Amelang, M.; Bartussek, D. Differentielle Psychologie und Persönlichkeitsforschung, 6th ed.; W. Kohlhammer: Stuttgart, Germany, 2006. [Google Scholar]
- Inzunza, J.; Campos, J. El SIMCE en Chile: Historia, problematización y resistencia. In Proceedings of the XI Seminario Internacional de la Red Estrado, Movimientos Pedagógicos y Trabajo Docente en Tiempos de Estandarización, México city, México, 16–18 November 2016. [Google Scholar]
- Vergara, C. Los efectos adversos de una evaluación nacional sobre las prácticas de enseñanza de las matemáticas: El caso del SIMCE en Chile. Rev. Iberoam. Eval. Educ. 2017, 10, 69–87. [Google Scholar] [CrossRef][Green Version]
- Entwistle, N. Approaches to studying and levels of understanding: The influences of teaching and assessment. In Higher Education: Handbook of Theory and Research; Smart, J.C., Ed.; Agathon Press: New York, NY, USA, 2000; Volume XV, pp. 156–218. [Google Scholar]
- Sternberg, R.J. Thinking Styles. 1997. Available online: https://www.cambridge.org/core/books/thinking-styles/1475ED3555FF4DA3DEA59DE0B635EF43 (accessed on 30 April 2021).
- Nancekivell, S.E.; Shah, P.; Gelman, S.A. Maybe they’re born with it, or maybe it’s experience: Toward a deeper understanding of the learning style myth. J. Educ. Psychol. 2020, 112, 221–235. [Google Scholar] [CrossRef]
- Scott, C. The enduring appeal of learning styles. Aust. J. Educ. 2010, 54, 5–17. [Google Scholar] [CrossRef]
- Borromeo-Ferri, R. Mathematical Thinking Styles and Word Problems. In Proceedings of the ICMI Study 14, Applications and Modelling in Mathematics Education, Dortmund, Germany, 13–17 February 2004. [Google Scholar]
- Borromeo-Ferri, R. Mathematical modelling in european education. J. Math. Educ. Teach. Coll. 2013, 4, 18–24. [Google Scholar] [CrossRef]
- Borromeo-Ferri, R. On the influence of mathematical thinking styles on learners’ modelling behaviour. J. Math. Didakt. 2010, 31, 99–118. [Google Scholar] [CrossRef]
- Sternberg, R.; Warner, R. MSG Thinking Styles Inventory. unreleased manuscript. In Thinking Styles, 1st ed.; Sternberg, R., Ed.; Cambridge University Press: New York, NY, USA, 1997. [Google Scholar]
- Hadamard, J. An Essay on the Psychology of Invention in the Mathematical Field; Princeton University Press: Princeton, NJ, USA, 1945. [Google Scholar]
- Burton, L. Mathematicians and their Epistemologies–and the Learning of Mathematics. In European Research in Mathematics Education I, Proceeding of the First Conference of the European Society for Research in Mathematics Education, Osnabrück, Germany; Schwank, I., Ed.; Forschungsinstitut für Mathematikdidaktik: Osnabrück, Germany, 1999; pp. 87–102. [Google Scholar]
- Burton, L. The practice of mathematicians: What do they tell us about coming to know mathematics. Educ. Stud. Math. 1999, 37, 121–143. [Google Scholar] [CrossRef]
- Borromeo Ferri, R. Mathematical Thinking Styles–An Empirical Study. In European Research in Mathematics Education III, Proceeding of the Third Conference of the European Society for Research in Mathematics Education, Bellaria, Italy; Mariotti, M.A., Ed.; Departament of Mathematics: Bellaria, Italy, 2003; pp. 1–9. [Google Scholar]
- Borromeo Ferri, R. Mathematical thinking styles in schools and across cultures. In Selected Regular Lectures from the 12th International Congress on Mathematical Education; Cho, S.J., Ed.; Springer: Cham, Switzerland, 2015; pp. 153–174. [Google Scholar] [CrossRef]
- Bandura, A. Self-Efficacy. The Exercise of Control, 11th ed.; W. H. Freeman and Company: New York, NY, USA, 1997. [Google Scholar]
- Baumert, J.; Kunter, M. Professionelle Kompetenz von Lehrkräften. In Zeitschrift für Erziehungswissenschaft; Gogolin, I., Kuper, H., Krüger, H.-H., Baumert, J., Eds.; Springer VS: Wiesbaden, Germany, 2013; pp. 277–337. [Google Scholar] [CrossRef]
- Schwarzer, R.; Jerusalem, M. Das Konzept der Selbstwirksamkeit. Z. Padagog. Beih. 2002, 44, 28–53. [Google Scholar]
- Schmitz, G.S.; Schwarzer, R. Selbstwirksamkeitserwartung von Lehrern: Längsschnittbefunde mit einem neuen Instrument. Z. Pädagog. Psychol. Ger. J. Educ. Psychol. 2000, 14, 12–25. [Google Scholar] [CrossRef]
- Talsma, K.; Schütz, B.; Schwarzer, R.; Norris, K. I believe, therefor I achieve (and vice versa): A meta-analytic cross-lagged panel analysis of self-efficacy and academic performance. Learn. Individ. Differ. 2018, 61, 136–150. [Google Scholar] [CrossRef]
- Honicke, T.; Broadbent, J. The influence of academic self-efficacy on academic performance. A systematic review. Educ. Res. Rev. 2016, 17, 63–84. [Google Scholar] [CrossRef]
- Reyes-Santander, P.; Aceituno, D.; Cáceres, P. Estilos de pensamiento matemático en estudiantes con talento académico. Rev. Psicol. 2018, 36, 49–73. [Google Scholar] [CrossRef]
- Huincahue, J.; Gaete-Peralta, C.; Garrido-Véliz, V. Thinking styles and computer engineering: An empirical study. Int. J. Cogn. Res. Sci. Eng. Educ. 2019, 7, 21–33. [Google Scholar] [CrossRef]
- Larson, M. What Is the Role of a Mathematics Teacher? National Council Teacher Mathematics. Available online: http://bit.ly/2LlOaPo (accessed on 30 April 2021).


| Internally Oriented Types | Externally Oriented Types | ||||||||
|---|---|---|---|---|---|---|---|---|---|
| Congruent | Incongruent | ||||||||
| (1) | Picture | Symbolic | Mixed | Picture– Picture | Mixed | Symbolic–Symbolic | Picture/ Symbolic | Symbolic/ Picture | |
| (2) | |||||||||
| Wholists | |||||||||
| Combiners | |||||||||
| Dissecters | |||||||||
| Central Questions | Dimension | N° Items |
|---|---|---|
| Which way of mathematical thinking do you prefer the most? | visual | 5 |
| analytic | 5 | |
| How do you solve a mathematical task? | dissected | 5 |
| holistic | 5 | |
| Do you like to work on mathematical problems alone or do you prefer group work? | internal | 4 |
| external | 4 | |
| How confident do you feel about having to solve the following mathematics tasks? | self-efficacy | 8 |
| Analytic | Visual | Holistic | Dissected | Internal | External | Self-Efficacy | Grades | |
|---|---|---|---|---|---|---|---|---|
| analytic | 1 | - | - | - | - | - | - | - |
| visual | - | 1 | - | - | - | - | - | - |
| holistic | 0.248 * | 0.152 | 1 | - | - | - | - | - |
| dissected | 0.298 * | 0.264 * | 0.332 * | 1 | - | - | - | - |
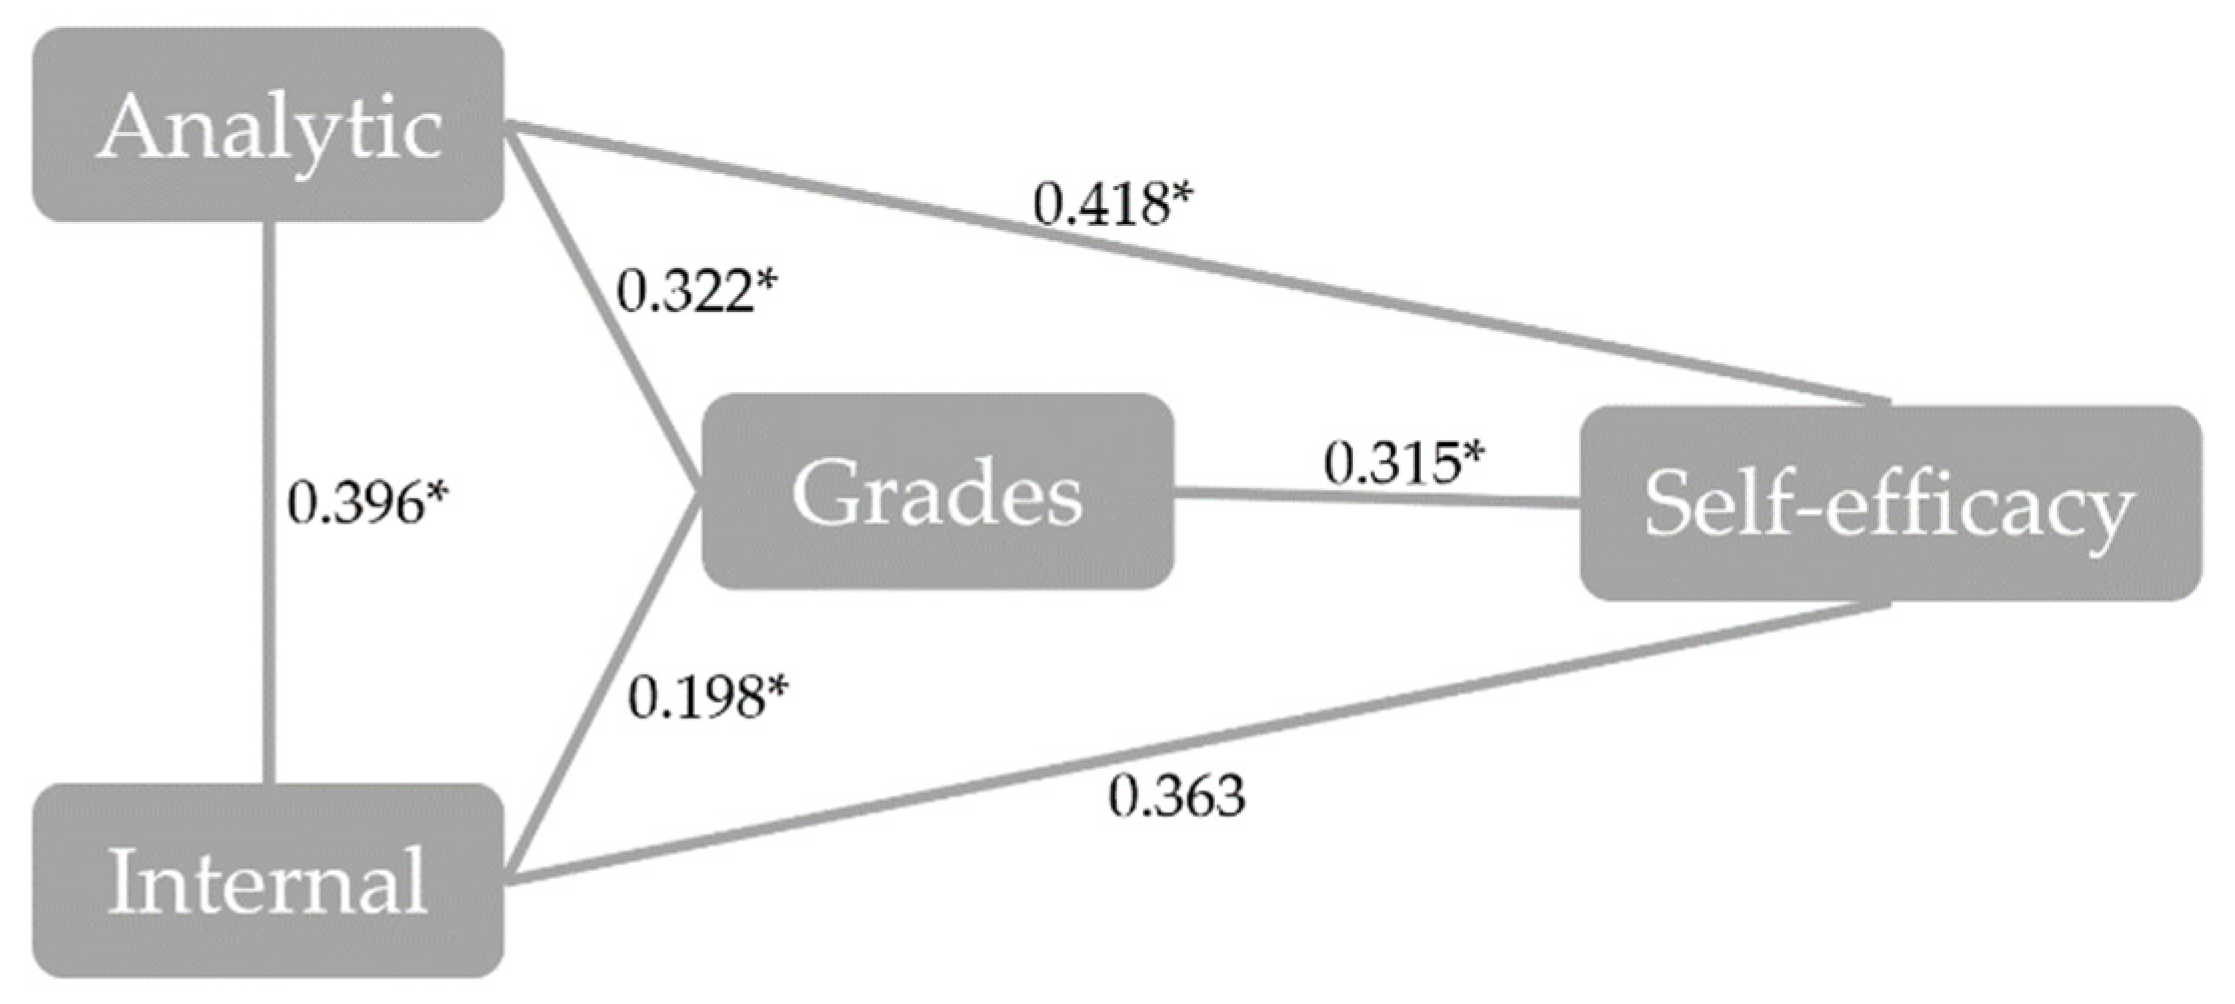
| internal | 0.396 * | - | 0.189 * | 0.222 * | 1 | - | - | - |
| external | - | 0.246 * | 0.229 * | 0.185 * | −0.363 * | 1 | - | - |
| self-efficacy | 0.418 * | 0.126 | 0.246 * | 0.340 * | 0.363 | - | 1 | - |
| grades | 0.322 * | - | 0.145 | 0.203 * | 0.198 * | - | 0.315 * | 1 |
| Dimensions | T1C | T5C | T2C |
|---|---|---|---|
| Analytic | 2.8 | 2.6 | 2.4 |
| Visual | 1 | 1.4 | 1 |
| holistic | 2 | 3.25 | 2.25 |
| Dissected | 2 | 1.4 | 2.2 |
| Internal | 1.5 | 2.75 | 2 |
| External | 2.75 | 1.25 | 2.75 |
Publisher’s Note: MDPI stays neutral with regard to jurisdictional claims in published maps and institutional affiliations. |
© 2021 by the authors. Licensee MDPI, Basel, Switzerland. This article is an open access article distributed under the terms and conditions of the Creative Commons Attribution (CC BY) license (https://creativecommons.org/licenses/by/4.0/).
Share and Cite
Huincahue, J.; Borromeo-Ferri, R.; Reyes-Santander, P.; Garrido-Véliz, V. Mathematical Thinking Styles—The Advantage of Analytic Thinkers When Learning Mathematics. Educ. Sci. 2021, 11, 289. https://doi.org/10.3390/educsci11060289
Huincahue J, Borromeo-Ferri R, Reyes-Santander P, Garrido-Véliz V. Mathematical Thinking Styles—The Advantage of Analytic Thinkers When Learning Mathematics. Education Sciences. 2021; 11(6):289. https://doi.org/10.3390/educsci11060289
Chicago/Turabian StyleHuincahue, Jaime, Rita Borromeo-Ferri, Pamela Reyes-Santander, and Viviana Garrido-Véliz. 2021. "Mathematical Thinking Styles—The Advantage of Analytic Thinkers When Learning Mathematics" Education Sciences 11, no. 6: 289. https://doi.org/10.3390/educsci11060289
APA StyleHuincahue, J., Borromeo-Ferri, R., Reyes-Santander, P., & Garrido-Véliz, V. (2021). Mathematical Thinking Styles—The Advantage of Analytic Thinkers When Learning Mathematics. Education Sciences, 11(6), 289. https://doi.org/10.3390/educsci11060289