
State of Research on Gamification in Education: A Bibliometric Survey


Institute of Management, University of Szczecin, Cukrowa 8, 71-004 Szczecin, Poland
Educ. Sci. 2021, 11(2), 69; https://doi.org/10.3390/educsci11020069
Submission received: 31 December 2020
/
Revised: 2 February 2021
/
Accepted: 4 February 2021
/
Published: 10 February 2021
(This article belongs to the Special Issue Trends on Educational Gamification: Challenges and Learning Opportunities)
Abstract
:Recent years have brought a rapid growth of scientific output in the area of gamification in education. In this paper, we try to identify its main characteristics using a bibliometric approach. Our preliminary analysis uses Google Scholar, Scopus, and Web of Science as data sources, whereas the main analysis is performed on 2517 records retrieved from Scopus. The results comprise the cross-coverage of databases, geographic distribution of research, forms of publication, addressed research areas and topics, preferred publishing venues, the most involved scientific institutions and researchers, collaboration among researchers, and research impact. The main conclusions underline the sustained growth of the research output in the area for at least seven years, the widespread interest in the area across countries and branches of science, and an effective research communication in the area documented by the number of citations and the map of co-citations.
1. Introduction
Since gamification rose to popularity in the early 2010s, it has become an object of interest for education researchers. A short but good explanation of this interest was provided by Karl M. Kapp, who not only called gamification “the ideal process for creating engaging learning environments” [1], but also defined it as “using game-based mechanics, aesthetics and game thinking to engage people, motivate action, promote learning, and solve problems” [1], implicitly pointing out its key virtue: the ability to build engagement and motivation.
Consequently, gamification has been applied at various levels of education (from preschool [2], through elementary [3], secondary [4], and higher [5], to adult education [6]), and to various subjects (including as diverse ones as anatomy and physiology [7], architecture [8], computer programming [9], chemistry [10], foreign language [4], mathematics [11], or organizational behavior [12]). Gamification models were designed [13], specialized frameworks developed [14], and dedicated tools implemented [15]. Both success stories [3] and failures [16] were reported.
In 2013, Simone de Sousa Borges et al. retrieved a total of 357 publications querying five bibliographic databases with the keyword “gamification” alone [17]. At the moment of writing these words, Google Scholar alone returns 19,000 results for the very same keyword. With such a flood of new knowledge, it becomes more and more difficult for a researcher to keep track of the state of gamification research even in his/her particular area of interest, such as education. This explains the demand for various kinds of literature surveys, providing a more or less comprehensive picture of the field. Searching for the keyword “literature” within the results of our main query on gamification in education (see Section 2 and Section 3), we were able to identify 22 publications in this vein that employed a systematic approach to data collection and covered more than 10 publications. They are listed in Table 1. The Scope column defines the subdomain to which a given study was restricted, the Items column provides the number of publications that were eventually analyzed (after filtering out the ones considered irrelevant), the Databases column lists the data sources used (for the sake of brevity, dataset details were omitted), and the Year column specifies the last year covered in a given survey. The table is sorted upon the number of covered publications.
Looking at the contents of Table 1, most of the listed surveys are focused on a specific education level [18,29,34], subject [20,25,26,27,30,31,33,34,36,37,38] or reported research type [22,28,32,35], with the remaining ones were either outdated [17,21,23] or using too restricted search criteria [19] and/or selection of sources [24] to achieve an adequate coverage of the state of research on gamification in education. We therefore identify a research gap in the lack of an up-to-date survey of the scientific output in this field, not restricted to its particular subdomain or type of research. The aim of this research is to satisfy this gap. Although we put our priority on wide coverage rather than deep coverage of the problem area, we consider our work as both a continuation and extension of the prior works listed in Table 1.
Considering the aim of the research, we state the following research questions:
RQ1. How has the scientific output with regard to gamification in education developed over time?
RQ2. Which countries contribute the most to the scientific output with regard to gamification in education?
RQ3. What publication types are mostly used to convey new research results with regard to gamification in education?
RQ4. In the context of which research areas and topics are the problems of gamification in education addressed?
RQ5. What are the publishing venues through which the results of gamification in education research are most often disseminated?
RQ6. Which scientific institutions are involved in the research on gamification in education?
RQ7. Who are the most prolific authors contributing to the research on gamification in education?
RQ8. Is there a wide collaboration among researchers of gamification in education?
RQ9. Are the results of gamification in education research widely acknowledged or do they only reach a small groups of followers?
In the following section, the methods and data sources used to answer the stated questions are described. The obtained results are presented in Section 3, and discussed in the final section.
2. Materials and Methods
In the context of both the stated research questions and the volume of data to be processed, we decided to apply the bibliometric approach to achieve our goal. Bibliometrics, according to Nicholas and Ritchie [39], is “the statistical or quantitative description of literature”, with “literature” understood as “a group of related documents”. The exemplary characteristics of literature that may be described are “subject, document form (…), language (…), date” [39]. Surveys based on the bibliometric approach have been proven feasible and effective in various research areas, including business studies [40], medicine [41], tourism research [42], and education sciences [43].
Three stages of the survey procedure have been defined:
- Survey planning: Selection of data sources and specification of search criteria.
- Preliminary analysis: Answering RQ1 and selecting the data source which provides the widest coverage of the scientific output with regard to gamification in education for further analysis.
- Main analysis: Answering the remaining RQs.
The necessary planning of the survey consisted in the selection of data sources for preliminary analysis and specification of search criteria. All data sources listed in the Databases column of Table 1 were considered for inclusion in the survey. Eventually, three sources were selected: Scopus, Web of Science (Core Collection) and Google Scholar, for the following reasons:
- they index the largest number of documents, far exceeding the other databases;
- most of the content of commercial publisher databases (e.g., Springer Link and ScienceDirect) is indexed by at least one of the three selected data sources;
- most of the other databases used in prior research (e.g., ACM Digital Library; AISeL, ASME Digital Collection, IEEE Xplore) are dedicated to specific topic areas (such as computer science, information systems, or mechanical engineering), and this survey was not restricted to any of these areas;
- ERIC is a database dedicated to an area consistent with the scope of the survey (education); however, it does not provide citation data which automatically excludes its use in the main analysis stage. Note that a simple query for peer-reviewed publications on “education” and “gamification” resulted in 262 items, which, while a small fraction of the number of items retrieved from the other sources, makes it a source to consider in future literature surveys on gamification in education.
With the abundance of literature on the survey topic, we wanted more to avoid false positives in the search results rather than minimize the number of false negatives. Therefore, we decided to use just two keywords: “education” and “gamification”. While we considered the inclusion of other terms, we abstained from doing so. In particular, “learning” was abandoned as denoting a wider concept than education, and “instruction” was abandoned as a term having multiple meanings, only one of them connected to education.
For the two bibliographic databases (Scopus and Web of Science), the following assumptions were taken into consideration:
- a paper relevant to gamification should have the term “gamification” mentioned in its title, keywords, or abstract;
- a paper relevant to education should either have the term “education” or “educational” mentioned in its title or keywords (we ignore abstracts here, as many papers on gamification in non-educational contexts mention education as an exemplary field of gamification in their abstracts), or be published in an educational context (in a journal, book, or proceedings of a conference dedicated to education).
The search was performed on a single day (29 December 2020). Having retrieved, respectively, 2820 items from Scopus and 1988 items from Web of Science, we defined additional constraints:
- papers from 2021 should be excluded (to avoid the false impression that the results cover the scientific output from 2021, whereas only few publications with such a publication date were found);
- papers not in English should be excluded (to avoid the false impression that the results cover scientific output in non-English languages, whereas only a small amount of such publications were found; a proper survey in this vein should include various national-level bibliographic databases);
- only the publications in the type of book, chapter, journal article, and conference paper should be included (to exclude all publications such as reviews, editorials, etc. that do not convey new research results).
Consequently, the following search terms were used:
- in Scopus: “(PUBYEAR < 2021) AND TITLE-ABS-KEY (gamification) AND (TITLE (education*) OR KEY (education*) OR CONFNAME (education*) OR SRCTITLE (education*)) AND (LIMIT-TO (DOCTYPE, “cp”) OR LIMIT-TO (DOCTYPE, “ar”) OR LIMIT-TO (DOCTYPE, “ch”) OR LIMIT-TO (DOCTYPE, “bk”)) AND (LIMIT-TO (LANGUAGE, “English”))”,
- in Web of Science: “(((TI = gamification OR AK = gamification OR AB = gamification) AND (TI = education* OR AK = education* OR SO = education* OR CF = education*) )) AND LANGUAGE: (English) AND DOCUMENT TYPES: (Article OR Book OR Book Chapter OR Proceedings Paper)”, with the following additional search criteria: “Indexes = SCI-EXPANDED, SSCI, A&HCI, CPCI-S, CPCI-SSH, BKCI-S, BKCI-SSH, ESCI Timespan = 1900–2020”.
As a result, 2517 items from Scopus and 1743 items from Web of Science were retrieved.
The case of Google Scholar is different. First of all, we were not able to define search criteria that would strictly resemble the queries performed on the other two databases. This is a well-known problem in the bibliometric literature (see e.g., [44]). Trying to make the search criteria as similar as possible, we decided to use two keywords: “education” and “gamification” with the “allintitle” option. Note that the exact search procedure performed by Google Scholar is not known, but the reader should be aware that the mentioned option does not mean that among the 1040 documents retrieved using these criteria, there were only those exactly containing the given keywords in the title (in fact, many of them did not).
Then, additional constraints were added: patents were excluded and the maximum year of publication was set to 2020; it was also ensured that only English-language documents were retrieved. This resulted in the following search results link: “https://scholar.google.com/scholar?hl=pl&lr=lang_en&as_sdt=1%2C5&as_yhi=2020&q=allintitle%3Aeducation+gamification”. A total of 980 items were retrieved with it.
3. Results
3.1. Preliminary Analysis
In order to address RQ1, first, the lists of publications retrieved from the three databases were combined using publication title and year as the matching key. Due to various notations of authors’ names, we decided not to include them in the matching key, however as the chance of two same-year publications from two distinct authors having exactly the same title is low, the effect of this decision on the obtained results is negligible. Note however, that the omission of the other metadata in the matching key (for instance, the journal or book title) inflated the number of duplicates, as all publications having the same title and year are treated as one: while such a situation does not happen frequently, sometimes it does (e.g., a paper is published first in conference proceedings and later the same year in a post-conference book or as a journal article).
Moreover, as we were aware of notable differences in letter case and interpunction of titles obtained from respective databases, the titles were matched considering only the alphanumeric characters, all converted to lowercase. As a result, 3944 unique items were identified (out of 5240 total retrieved items).
Table 2 shows the cross-coverage between three queried databases (given in the first column). For every row, corresponding to database D, the three columns (referred to as C2..4) list the share of publications retrieved from D that were also found in the database given in the respective header of C2..4 (note the denominator is the number of publications in D, hence the total of respective columns is not 100%). If the column denotes database D, the given number is the share of publications from D that were not found in either of the two other databases. The fifth column gives the share of items having duplicates in the same database. It should be reminded that the number of duplicates reported here results from the chosen data consolidation procedure (see the previous paragraph), and includes as duplicates many papers which are not actually duplicates. On the other hand, while the mentioned procedure helped to remove many actual duplicates, particularly from the Google Scholar results, we have found through manual examination of randomly chosen items that there still were multiple publications listed under several more or less modified titles (usually fragments of other metadata were included in the actual title, probably as a result of an imperfect automatic acquisition of metadata by Google Scholar). As we did not aim to ensure the quality of bibliographic data, we did not attempt to correct such issues.
The values in columns C2..5 in each respective row sum up to 100%. The sixth column is not related directly to the preceding four, and shows the share of items retrieved from database D in the combined list of 3944 unique items.
Looking at the obtained results, it is quite surprising—in the context of prior results such as those reported in [45], which indicated similar coverage at least of Scopus and Web of Science—how large the share of publications unique to just one database is. Even if we look only at the two bibliographic databases which were searched using criteria as alike as possible, it reaches about half (Web of Science) or more than half (Scopus) of their respective content. This is an important observation for future literature surveys on the topic, indicating the significant differences in coverage of the databases.
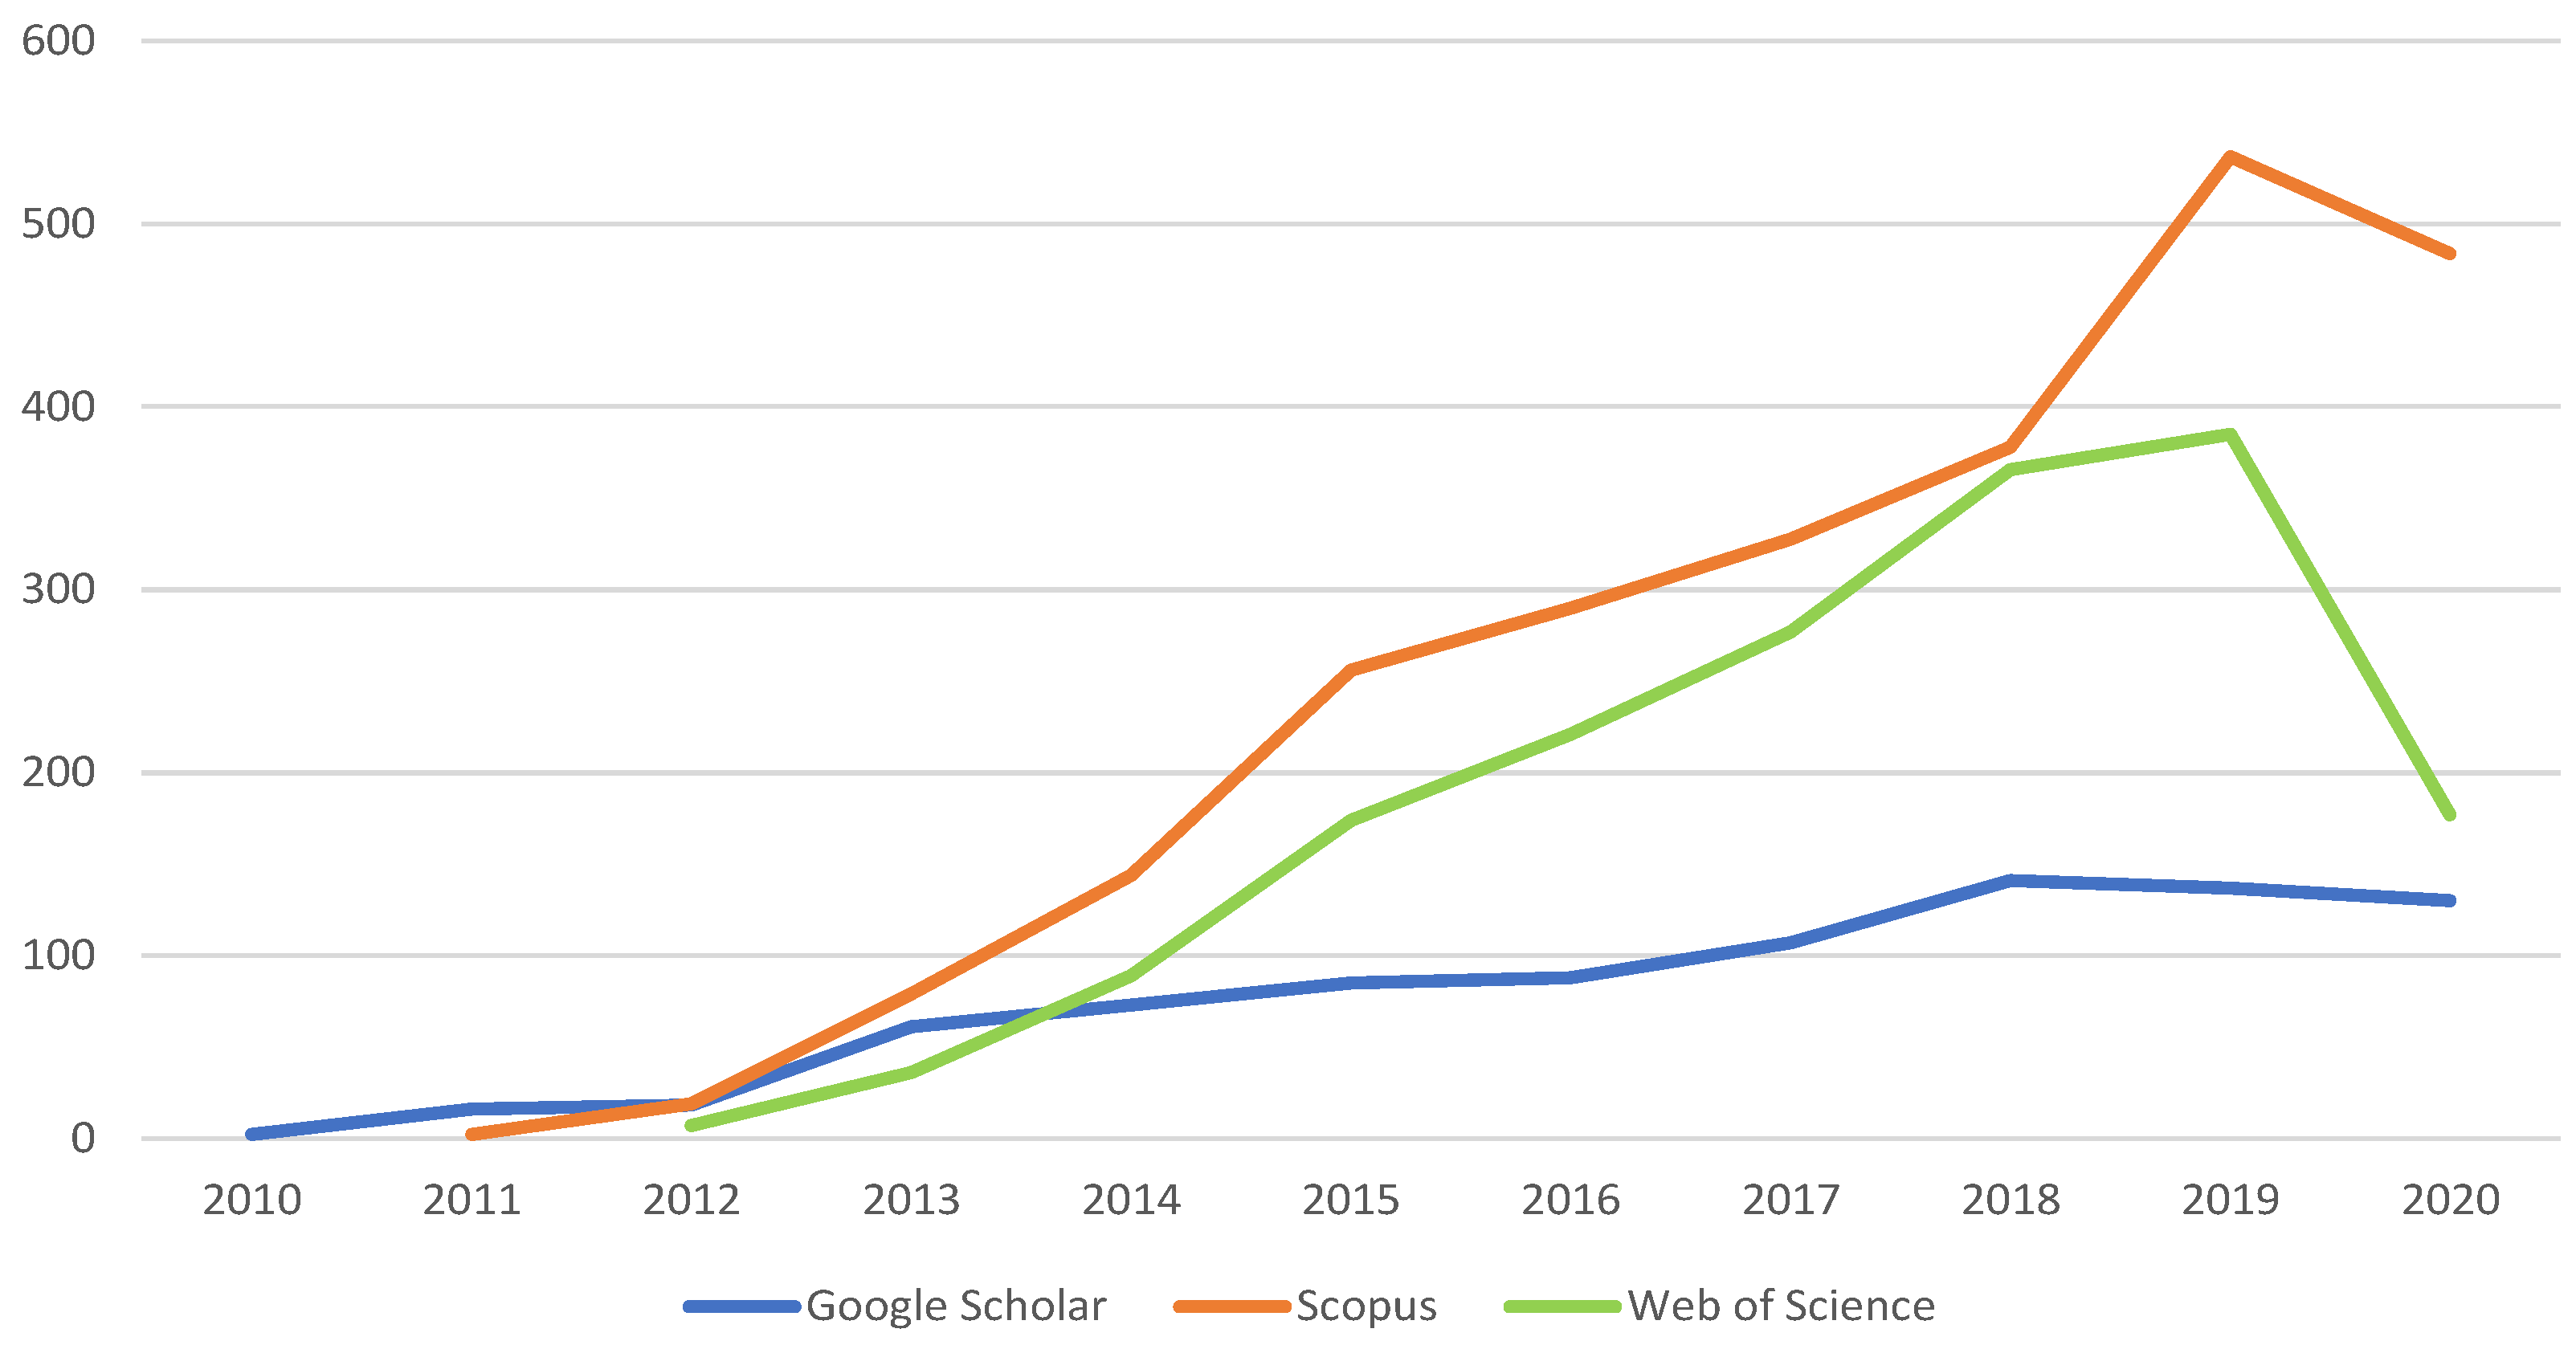
Figure 1 provides a visual answer to RQ1, showing the number of publications registered in respective databases in subsequent years. The items with no publication year indicated were omitted, as well as few publications having erroneous metadata listing year of publication before 2010 (even as early as 1982) whereas their actual year of publication was found to be much later (after 2010).
Looking at Figure 1, the earliest items retrieved from Google Scholar were published in 2010, from Scopus in 2011, and in Web of Science in 2012. The scientific output became considerable in 2013 and grew from that year on. According to data from both Scopus and Web of Science, the growth dynamics was high and continued until recently. The results obtained from Google Scholar paint a somewhat different picture: here, the growth was moderate and reached its peak in 2018.
Regarding the data for 2020, it must be taken into consideration that although the survey was performed at the end of 2020, there are many publications still in press which will have a publication year of 2020 (this applies to all three data sources), and there is a delay between when an item is published and when it is registered in a bibliographic database. This applies specifically to Scopus and Web of Science (especially the latter, having very long data processing periods, which explains the sharp drop in the number of publications for 2020).
For the purpose of performing the main analysis, the largest data source, Scopus, was chosen, as it covers a sufficient share (over 60%) of relevant publications identified in any of the considered databases and provides the complete set of information needed to answer all stated research questions. It is also the only source which provides unique author identification numbers, helping to avoid mistreatment of a single author publishing under different names or name forms as well as multiple authors having the same surname and first name initials. To illustrate the advantages of such precise identification of authors, among the 24 most prolific authors listed in Section 3.2.6, if the counts obtained by assigning publications to authors by their surname and initials were used instead, only 13 authors would have their publication count unchanged, of which only nine would retain their rank, and four authors would not even make it to the list.
3.2. Main Analysis
3.2.1. Geographic Distribution of Scientific Contribution
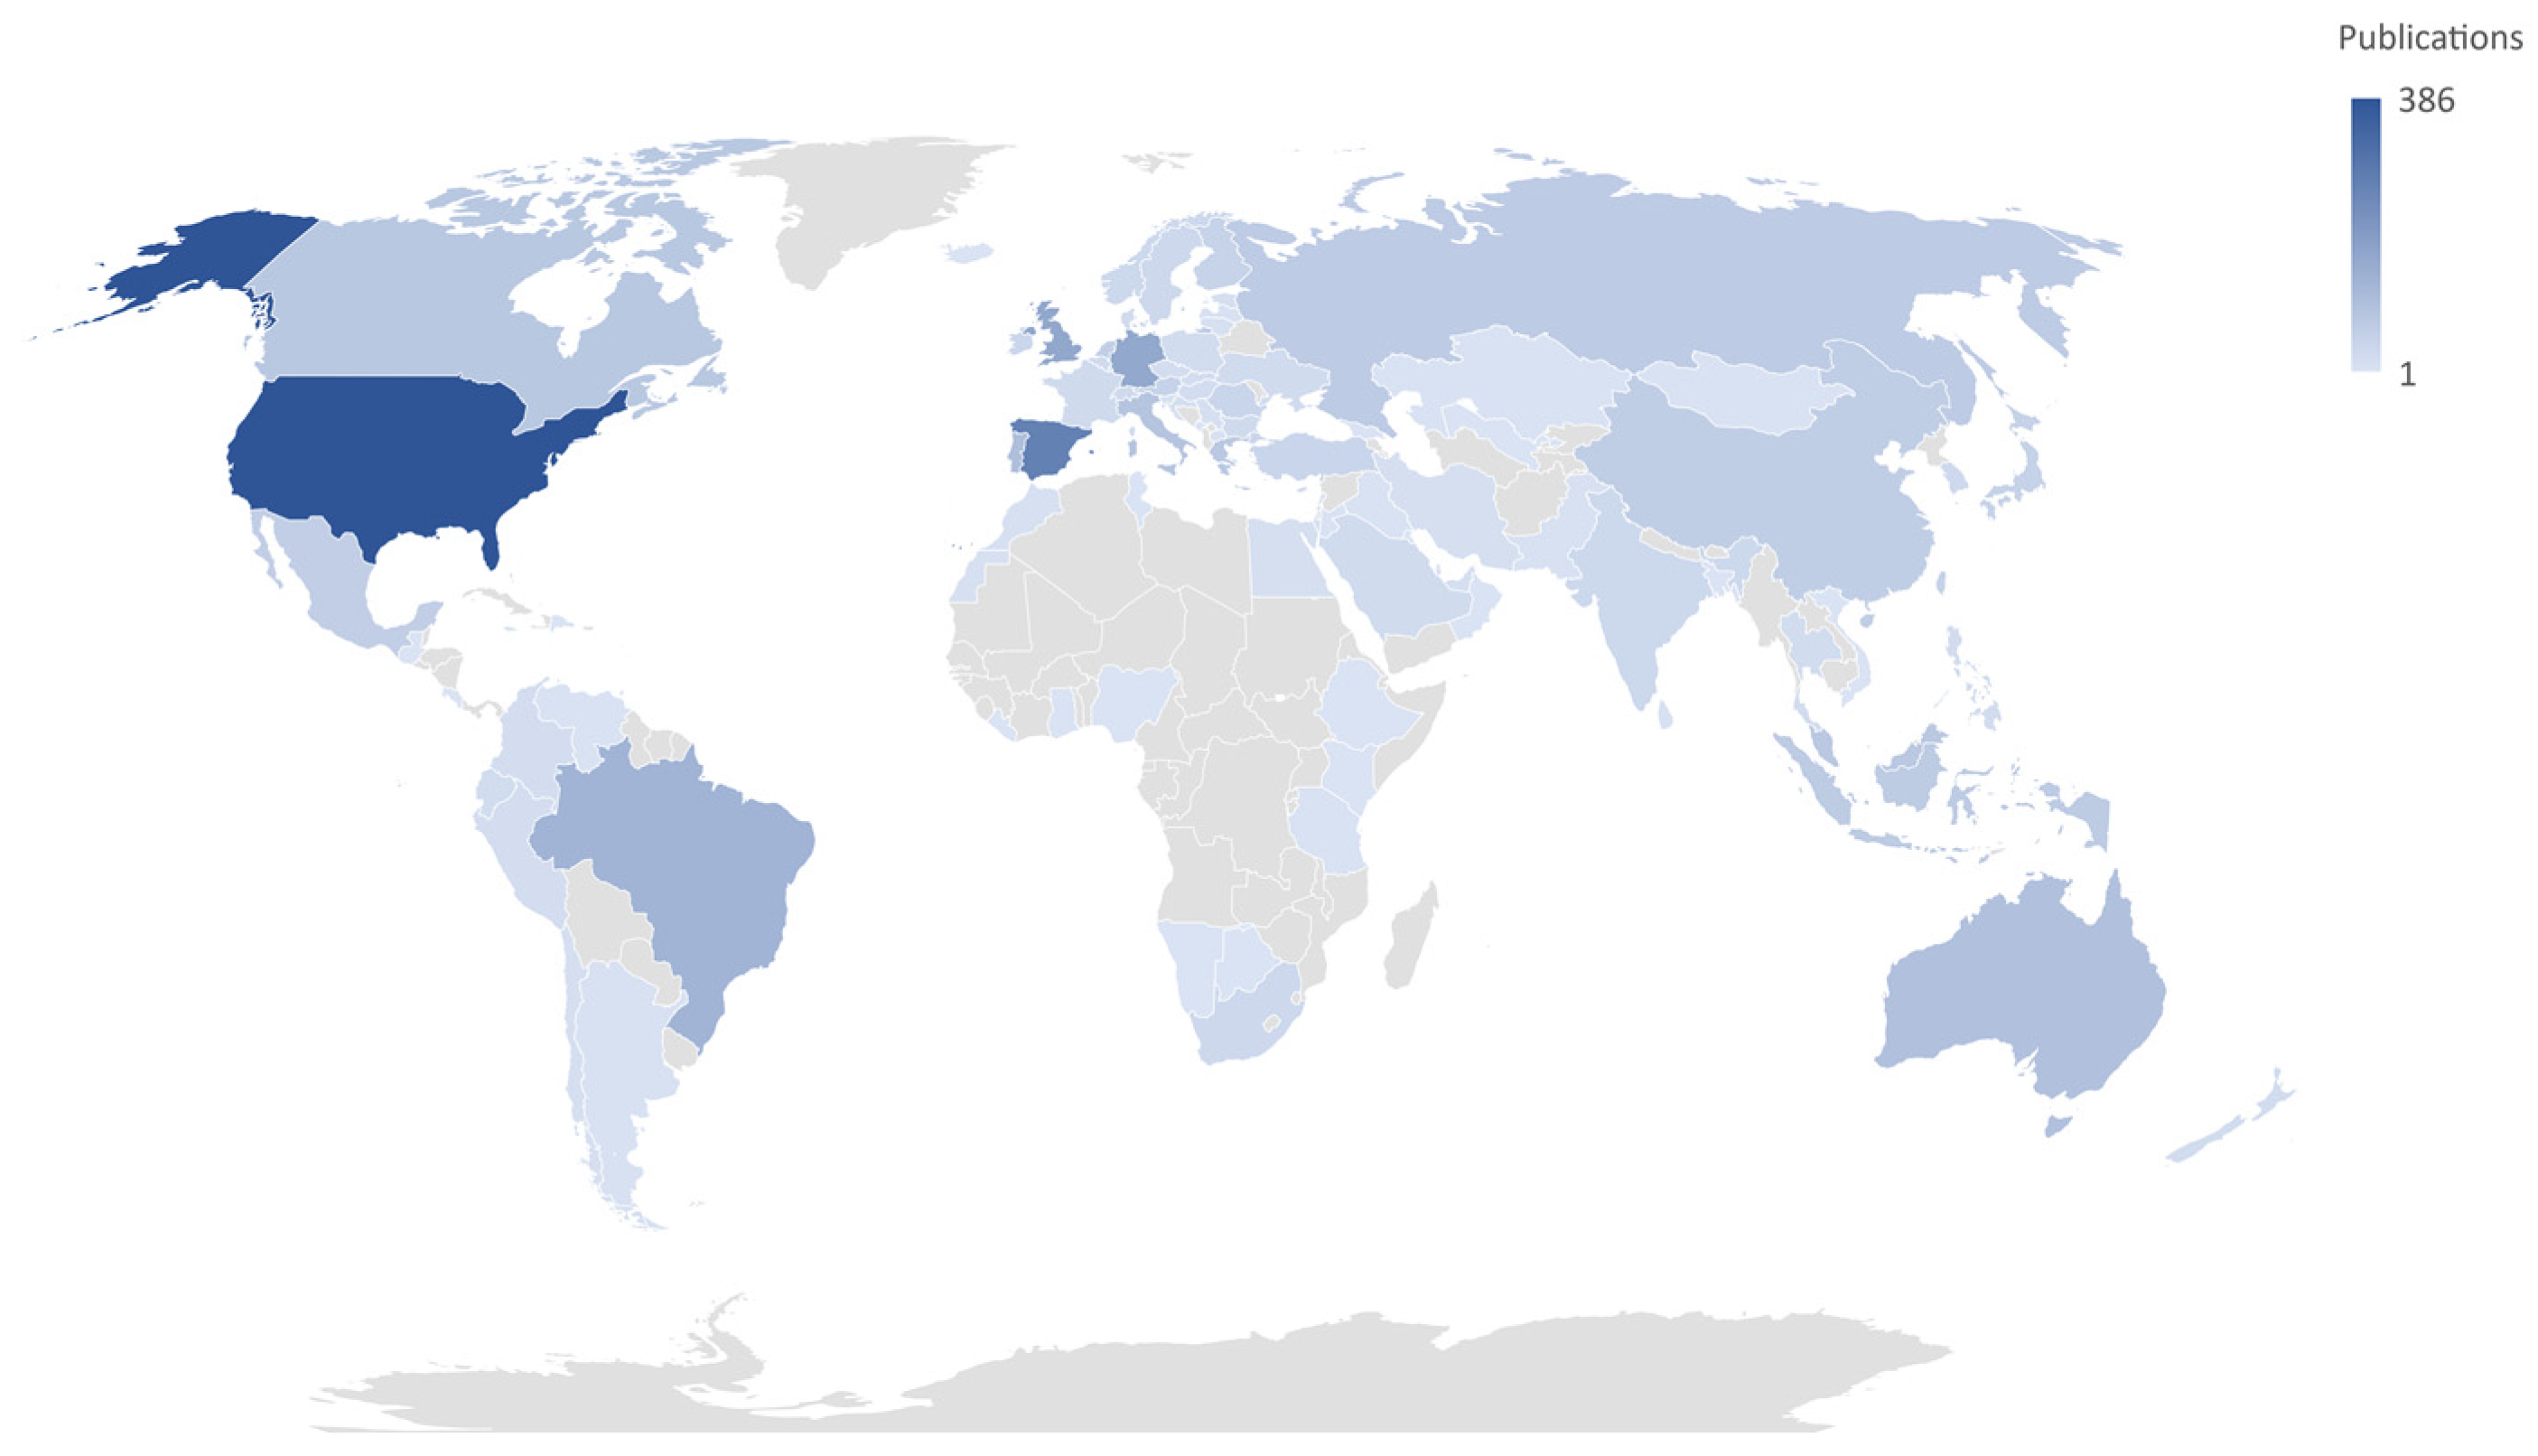
Figure 2 provides a visual answer to RQ2, showing the geographic distribution of the research based on data retrieved from Scopus regarding location of institutions with which the publication authors were affiliated. Researchers from exactly 100 countries and territories contributed to the studies on gamification in education. While, predictably, the largest share of research (almost 13% of publications) comes from United States of America, Spain comes closely behind (almost 9%), followed by United Kingdom and Germany (both 5.4%) and then Brazil (4.2%), Portugal (3.3%), and Australia 3.1%. The last three countries that qualified to the top 10 are Italy (2.8%), Canada, and Malaysia (both 2.5%). The combined output of the top 10 countries constitutes 50.9% of the whole analyzed data set.
3.2.2. Forms of Publication
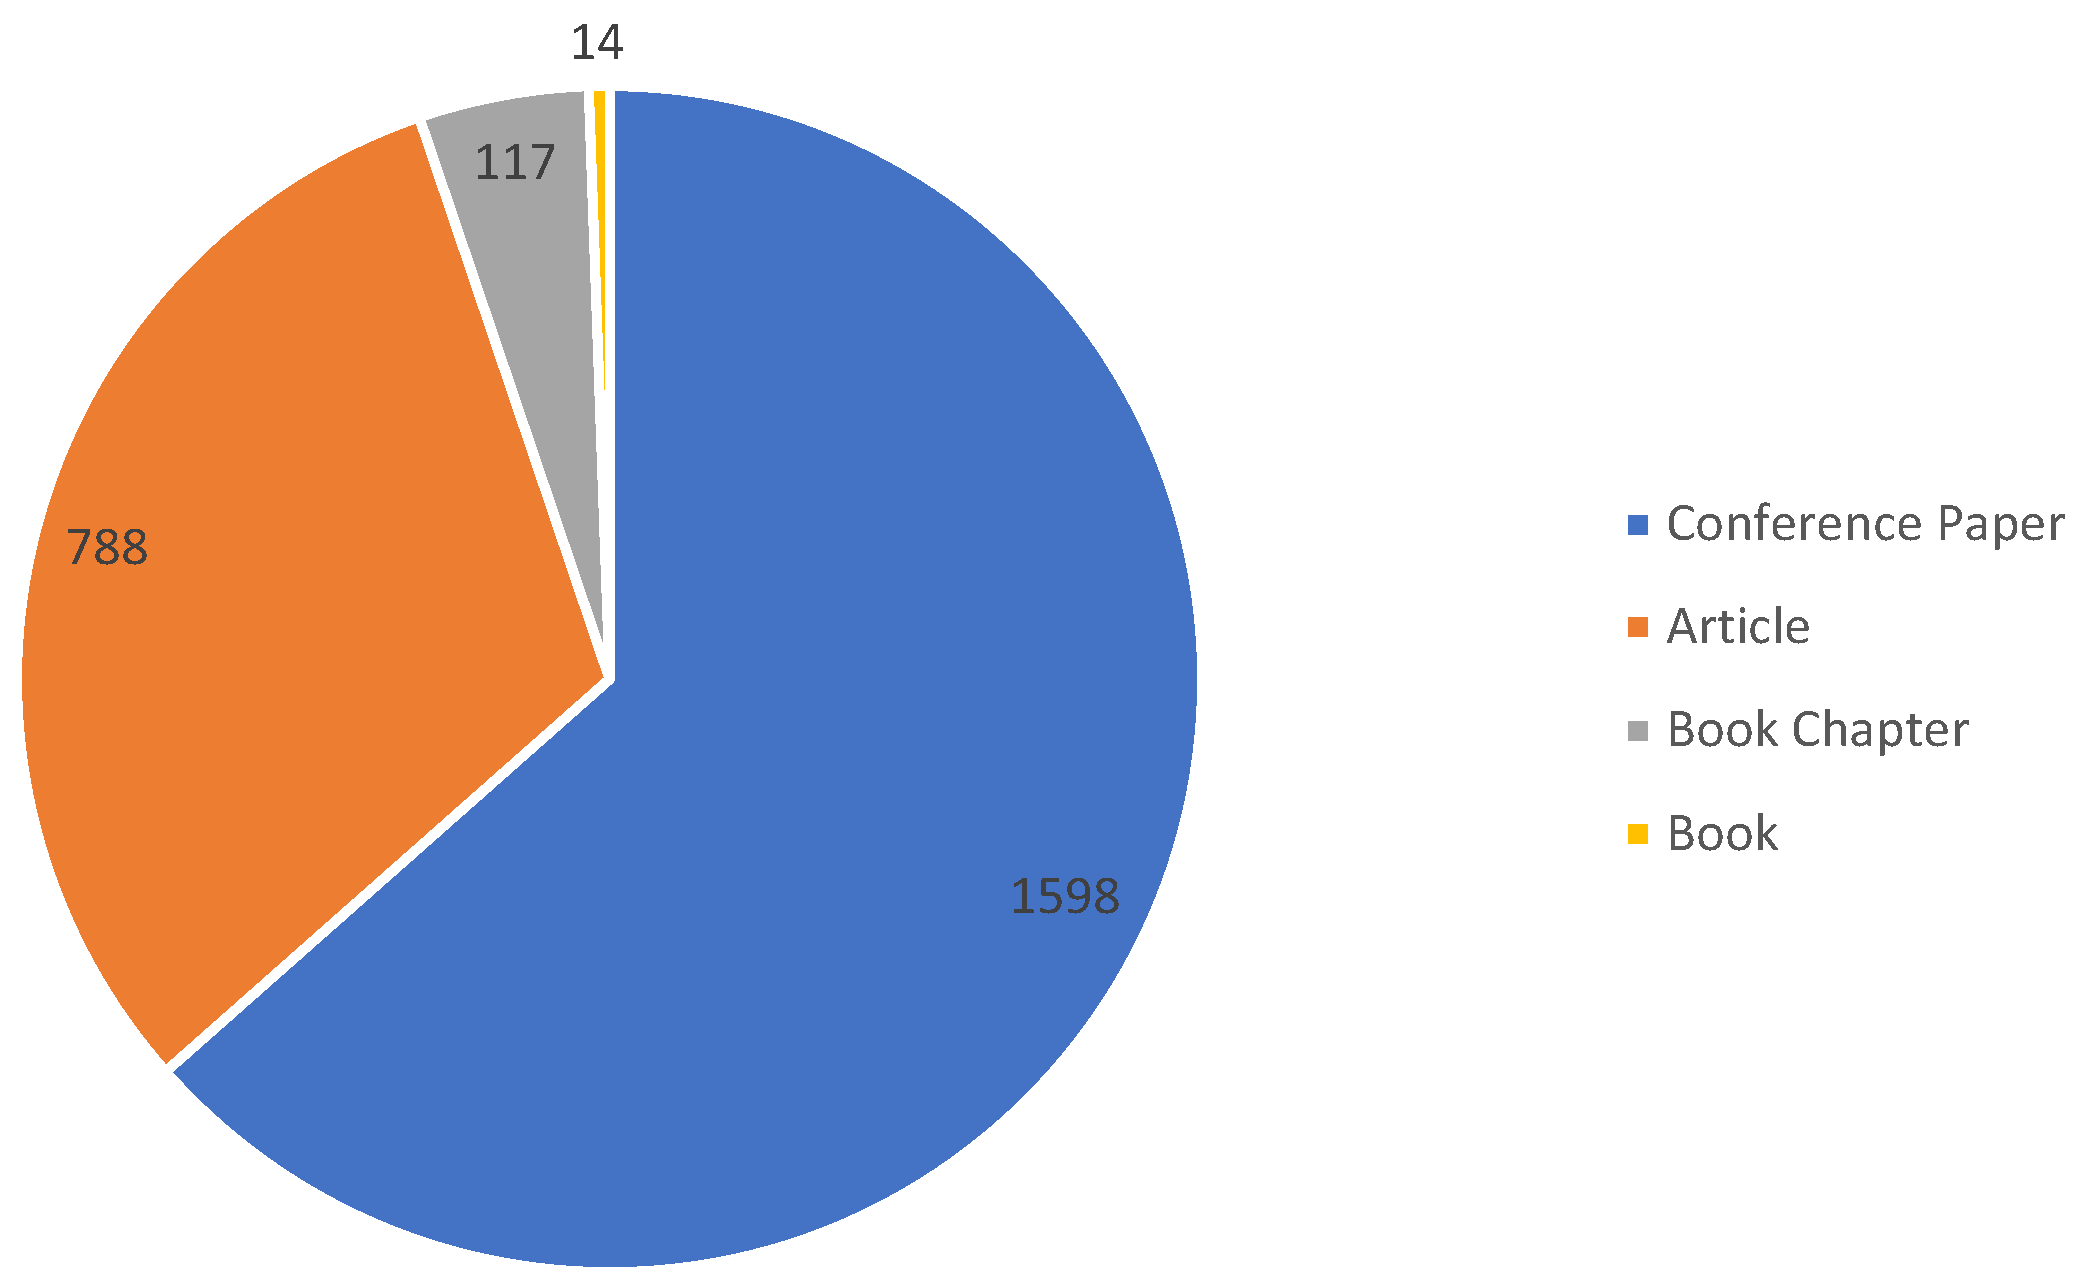
Figure 3 provides a visual answer to RQ3, showing the number of publications classified according to their types. As can be seen, over 63% of the analyzed items were conference papers, and a little less than 1/3rd were journal articles. Book chapters constitute less than 1/20th of the publications and books, about 1/180th of the whole set.
3.2.3. Addressed Research Areas and Topics
With regard to RQ4, Figure 4 shows the number of publications attributed to respective research areas according to the classification used by Scopus (note that the Social Sciences category includes education sciences). Only the areas with at least 10 publications were included in the chart, but there were publications found corresponding to every area defined by Scopus. Note that many publications were classified as belonging to more than one category.
Looking at Figure 4, Computer Science is the area presenting the most interest in gamification in education (about 1/3rd of the publications), followed by Social Sciences (about 1/4th), Engineering (about 1/7th), and Mathematics (about 1/14th). None of the remaining areas passed the threshold of 1/30th.
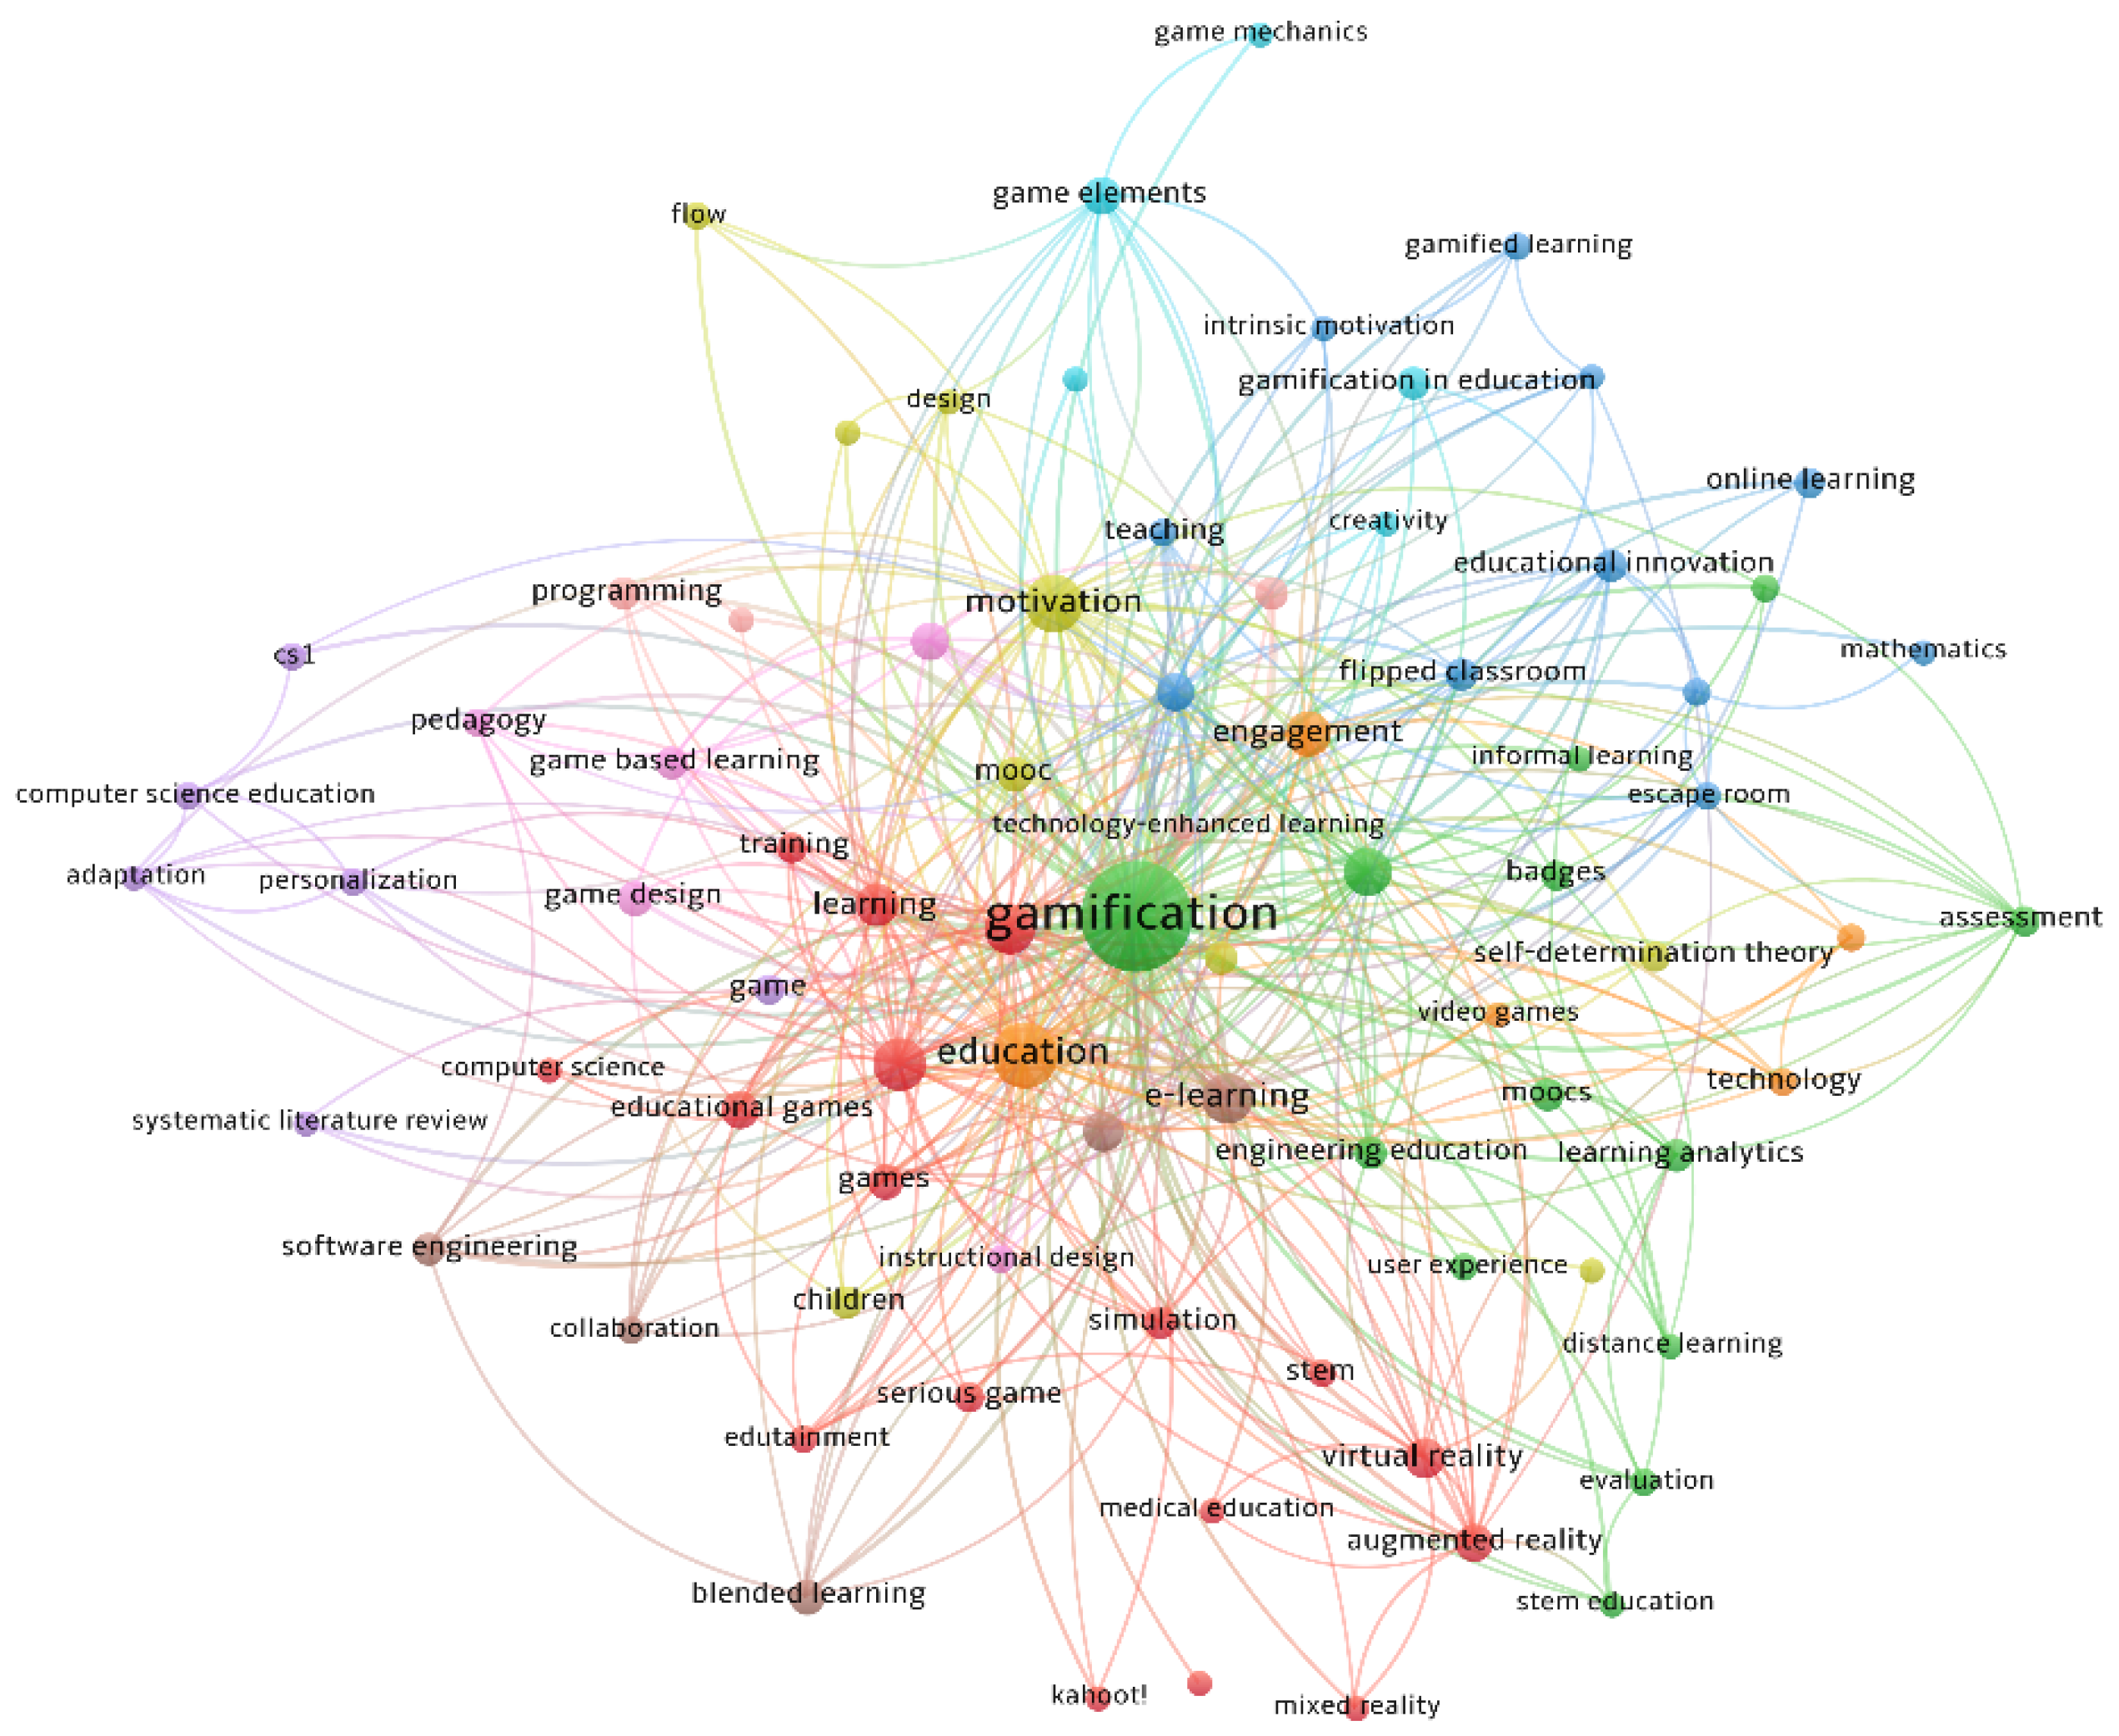
A more detailed information is provided in Figure 5, which addresses the question of specific topics covered by the research. It shows the map of co-occurrence of the most frequent keywords, generated using the VOS Viewer tool [46].
In Figure 5, the relative frequency of keywords is represented by their respective font size, the co-occurrence of keywords is represented with connecting lines, and the clusters of repeatedly co-occurring keywords are shown in the same color. Note that some keyword labels are missing for no other reason but the way VOS Viewer renders the graph.
Among the most frequent keywords, apart from gamification and education which were used in the query specification, four keywords passed the threshold of occurring in at least one percent of analyzed papers: motivation, serious games, game-based learning, and e-learning. Regarding the connections, apart from some easily predictable ones (e.g., learning—training, education—engagement, or gamified learning—intrinsic motivation) there are also some less obvious (e.g., virtual reality—medical education, blended learning—software engineering, or adaptation—computer science education).
3.2.4. Dissemination Channels
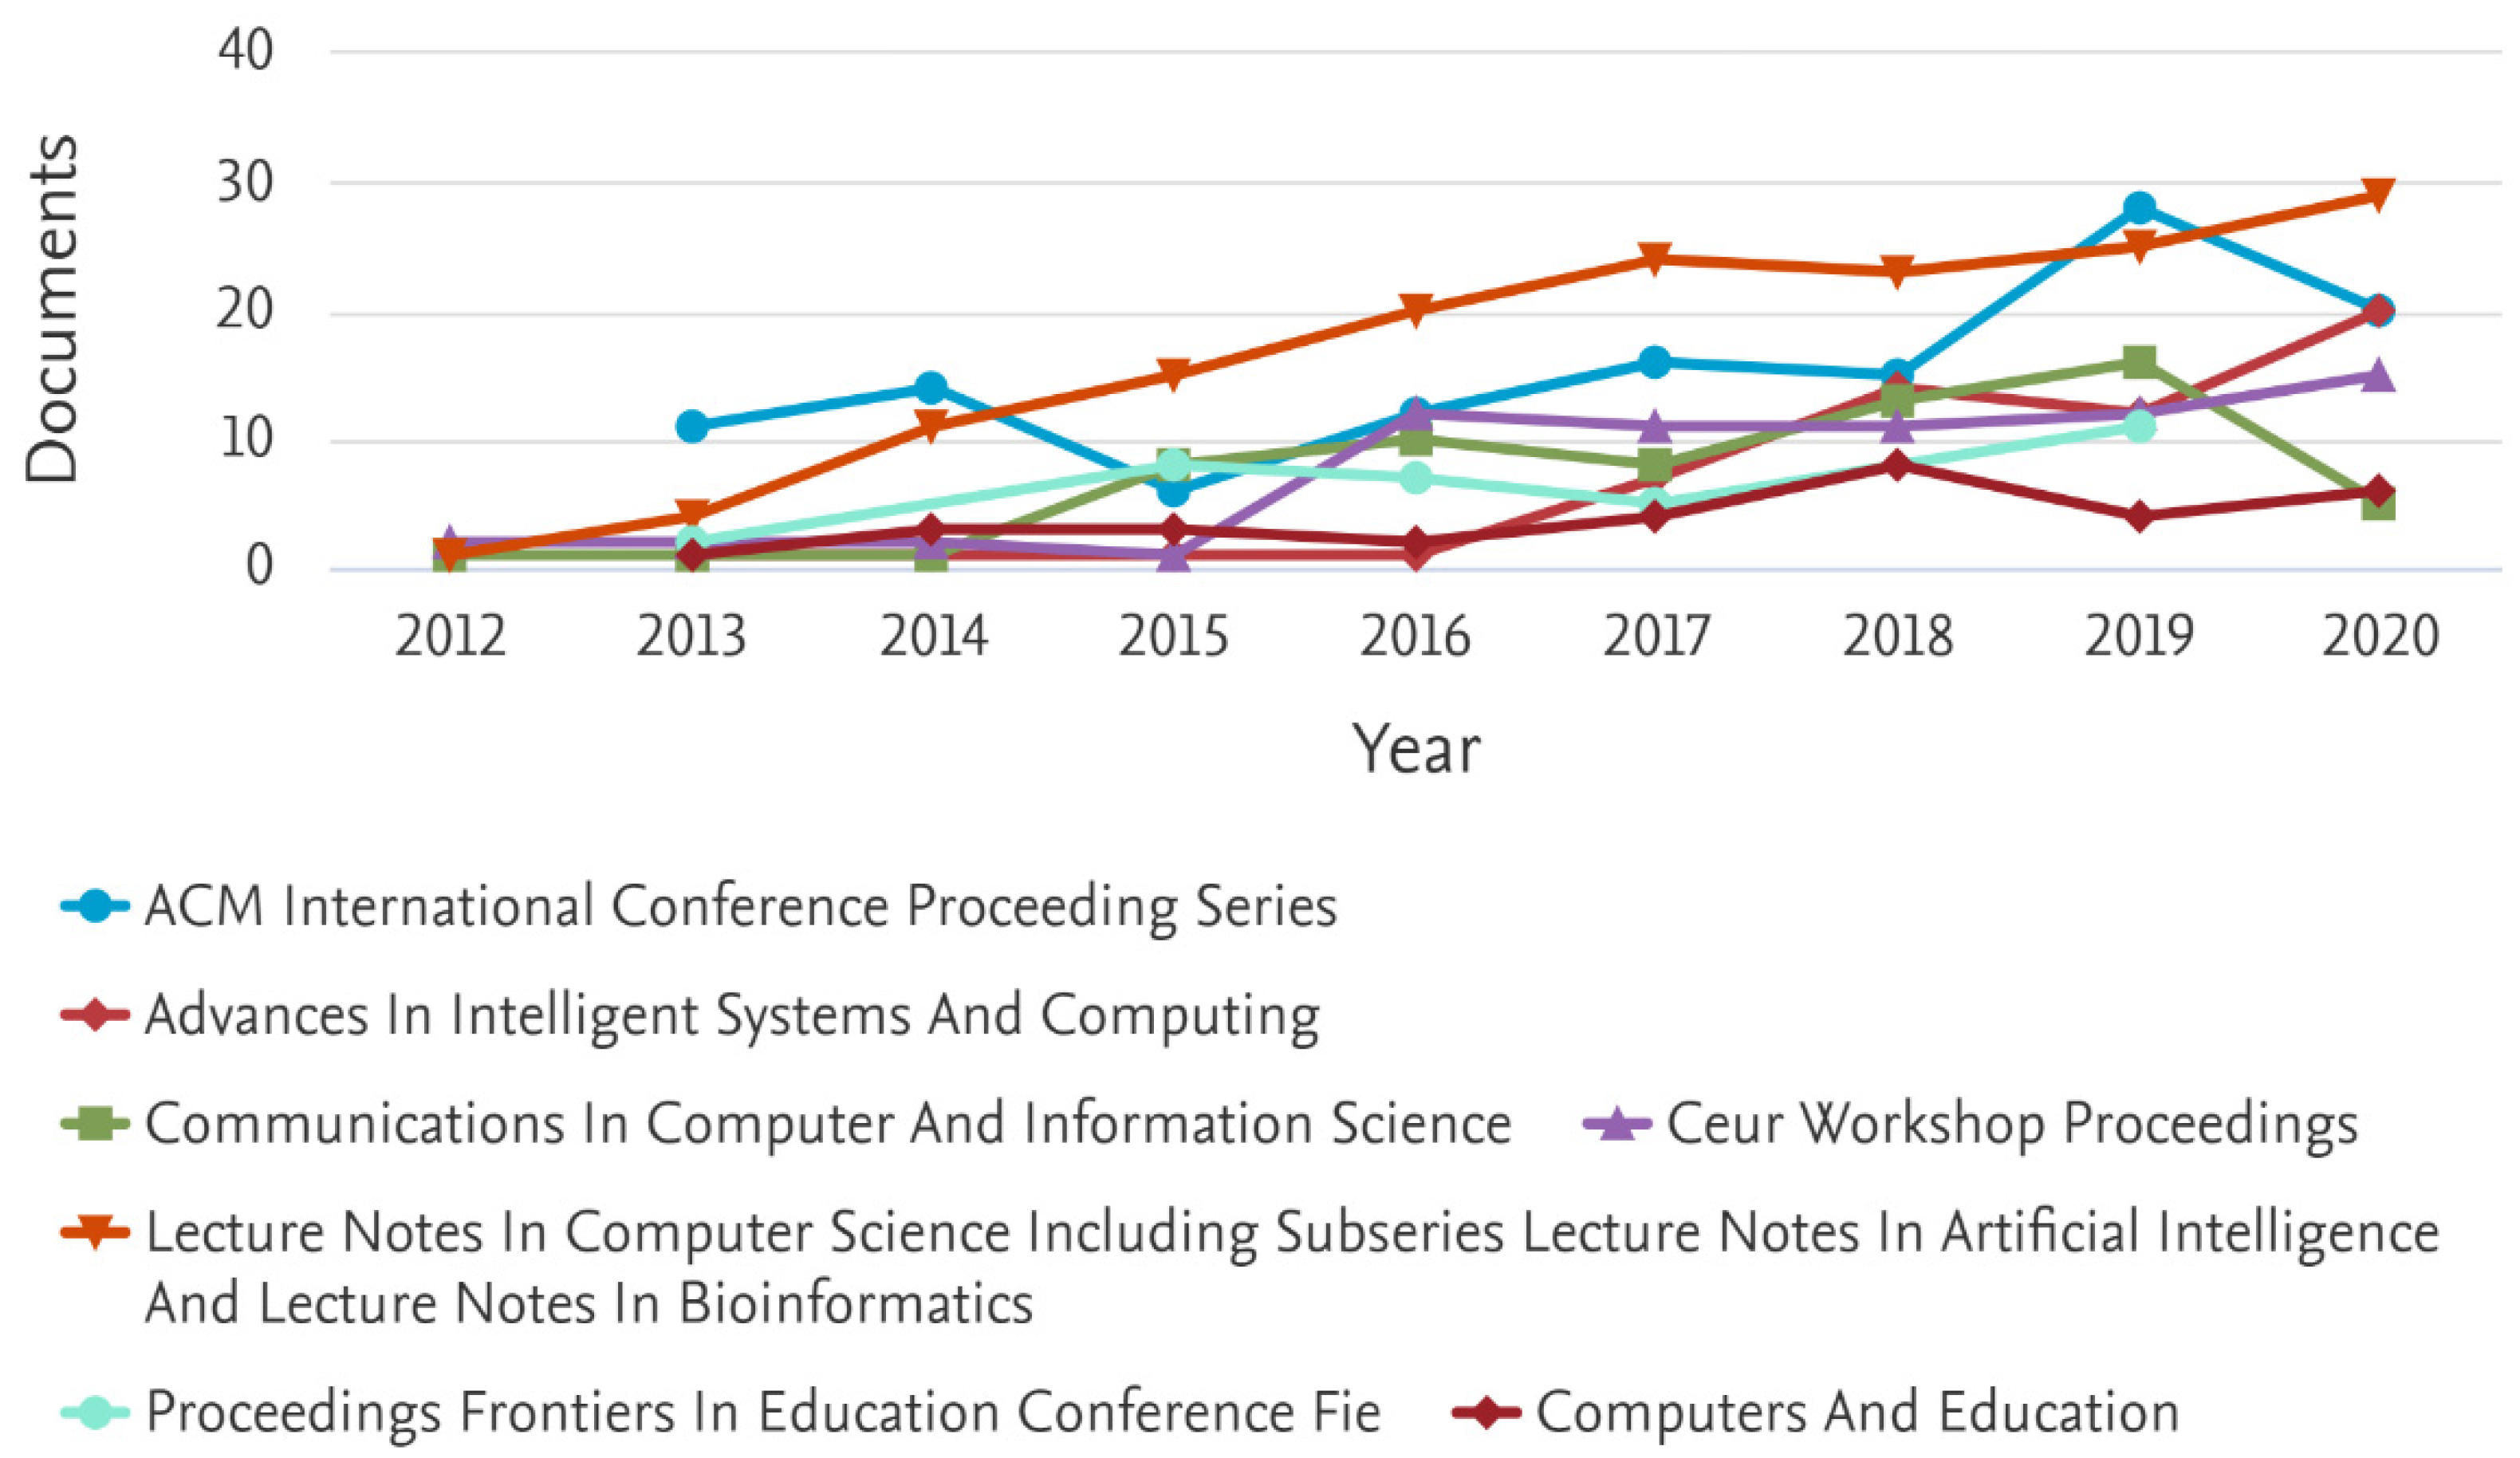
In response to RQ5, Figure 6 shows the seven publishing venues that were most often chosen by authors for dissemination of the research results on gamification in education. These include three conference proceedings series, three book series (also known to publish conference proceedings or post-proceedings) and only one journal. Together, these venues are responsible for 21% of the publications covered in the survey. The connected points depict the number of publications in each of these venues in respective years.
3.2.5. Most Involved Scientific Institutions
With regard to RQ6, altogether, there were 160 distinct institutions identified in the dataset retrieved from Scopus listed as an affiliation of at least one author. Table 3 lists the 20 most frequently encountered ones. Seven of them are based in Spain, which is quite a surprise even considering Figure 2. Similarly surprising is the fact than only one institution based in USA made it to the top-20 list.
3.2.6. Research Leaders
Addressing RQ7, Table 4 lists the authors of at least eight works covered in the query (their works combined constitute less than 1/3rd of the total analyzed output). There were 159 authors identified who authored at least three publications (this pertains to less than 3% of all contributors). While the most prolific authors are from Brazil, Portugal is the most represented country in the list with six authors.
3.2.7. Research Collaboration
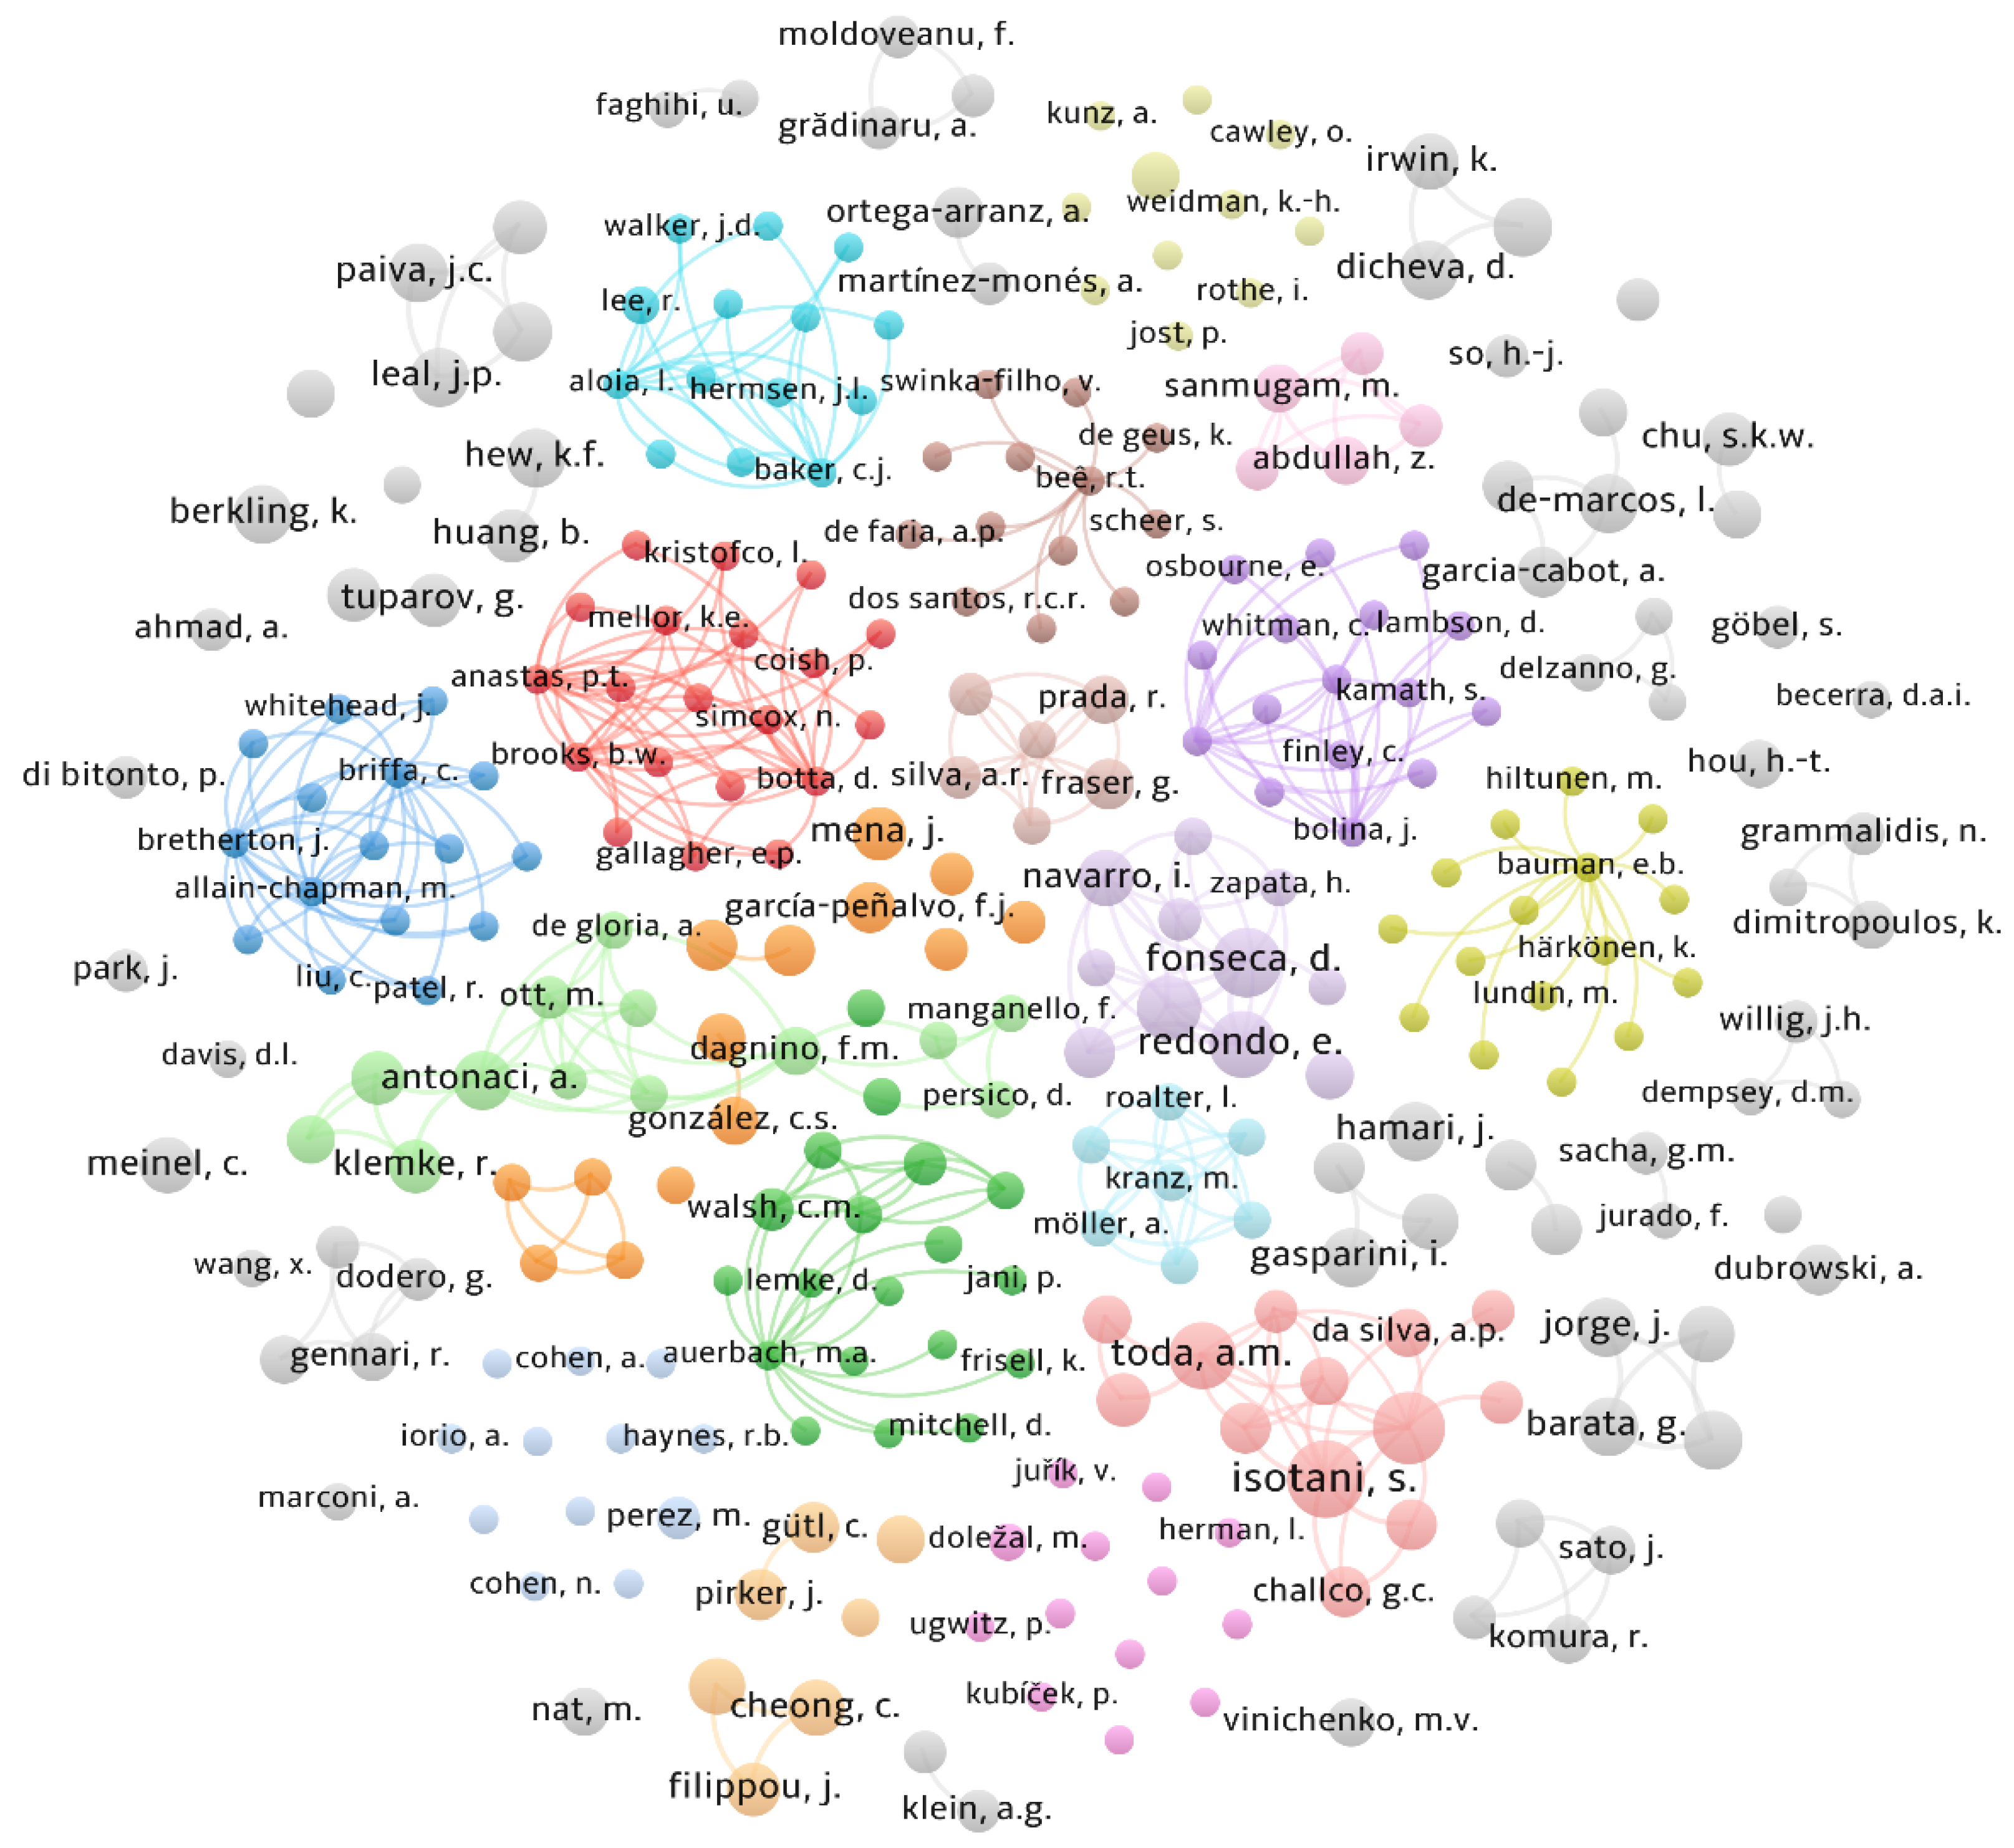
Addressing RQ8, Figure 7 shows the map of the most prolific co-authors, generated using the VOS Viewer tool [46]. The number of publications is represented by the circle and font size of their respective author name, the co-authoring of publications is represented with connecting lines, and the largest clusters of authors working together are shown in the same color. Note that some author name labels are missing for no other reason but the way VOS Viewer renders the graph.
Several large clusters are easily distinguishable; only few of them are built around the most prolific authors, including (as shown on Figure 7): Isotani and Toda (pale red), Fonseca and Redondo (heather) and Antonaci (pale green); more such clusters include only authors who contributed a small number of publications, such as: Anastas and Brooks (red), Walsh and Jani (green), Whitehead and Briffa (blue), Osbourne and Whitman (iris), Hiltunen and Bauman (olive) or Walker and Lee (cerulean).
3.2.8. Research Impact
With regard to RQ9, Table 5 lists the top 15 most cited works in the analyzed dataset. These works combined represent about 21% of the total number of citations (18,044, giving an average of 7.17 citations per indexed document). In total, 22 works (0.9%) passed the threshold of 100 citations, 379 works (15.1%) passed the threshold of 10 citations, and 1617 works (64.2%) were cited at least once.
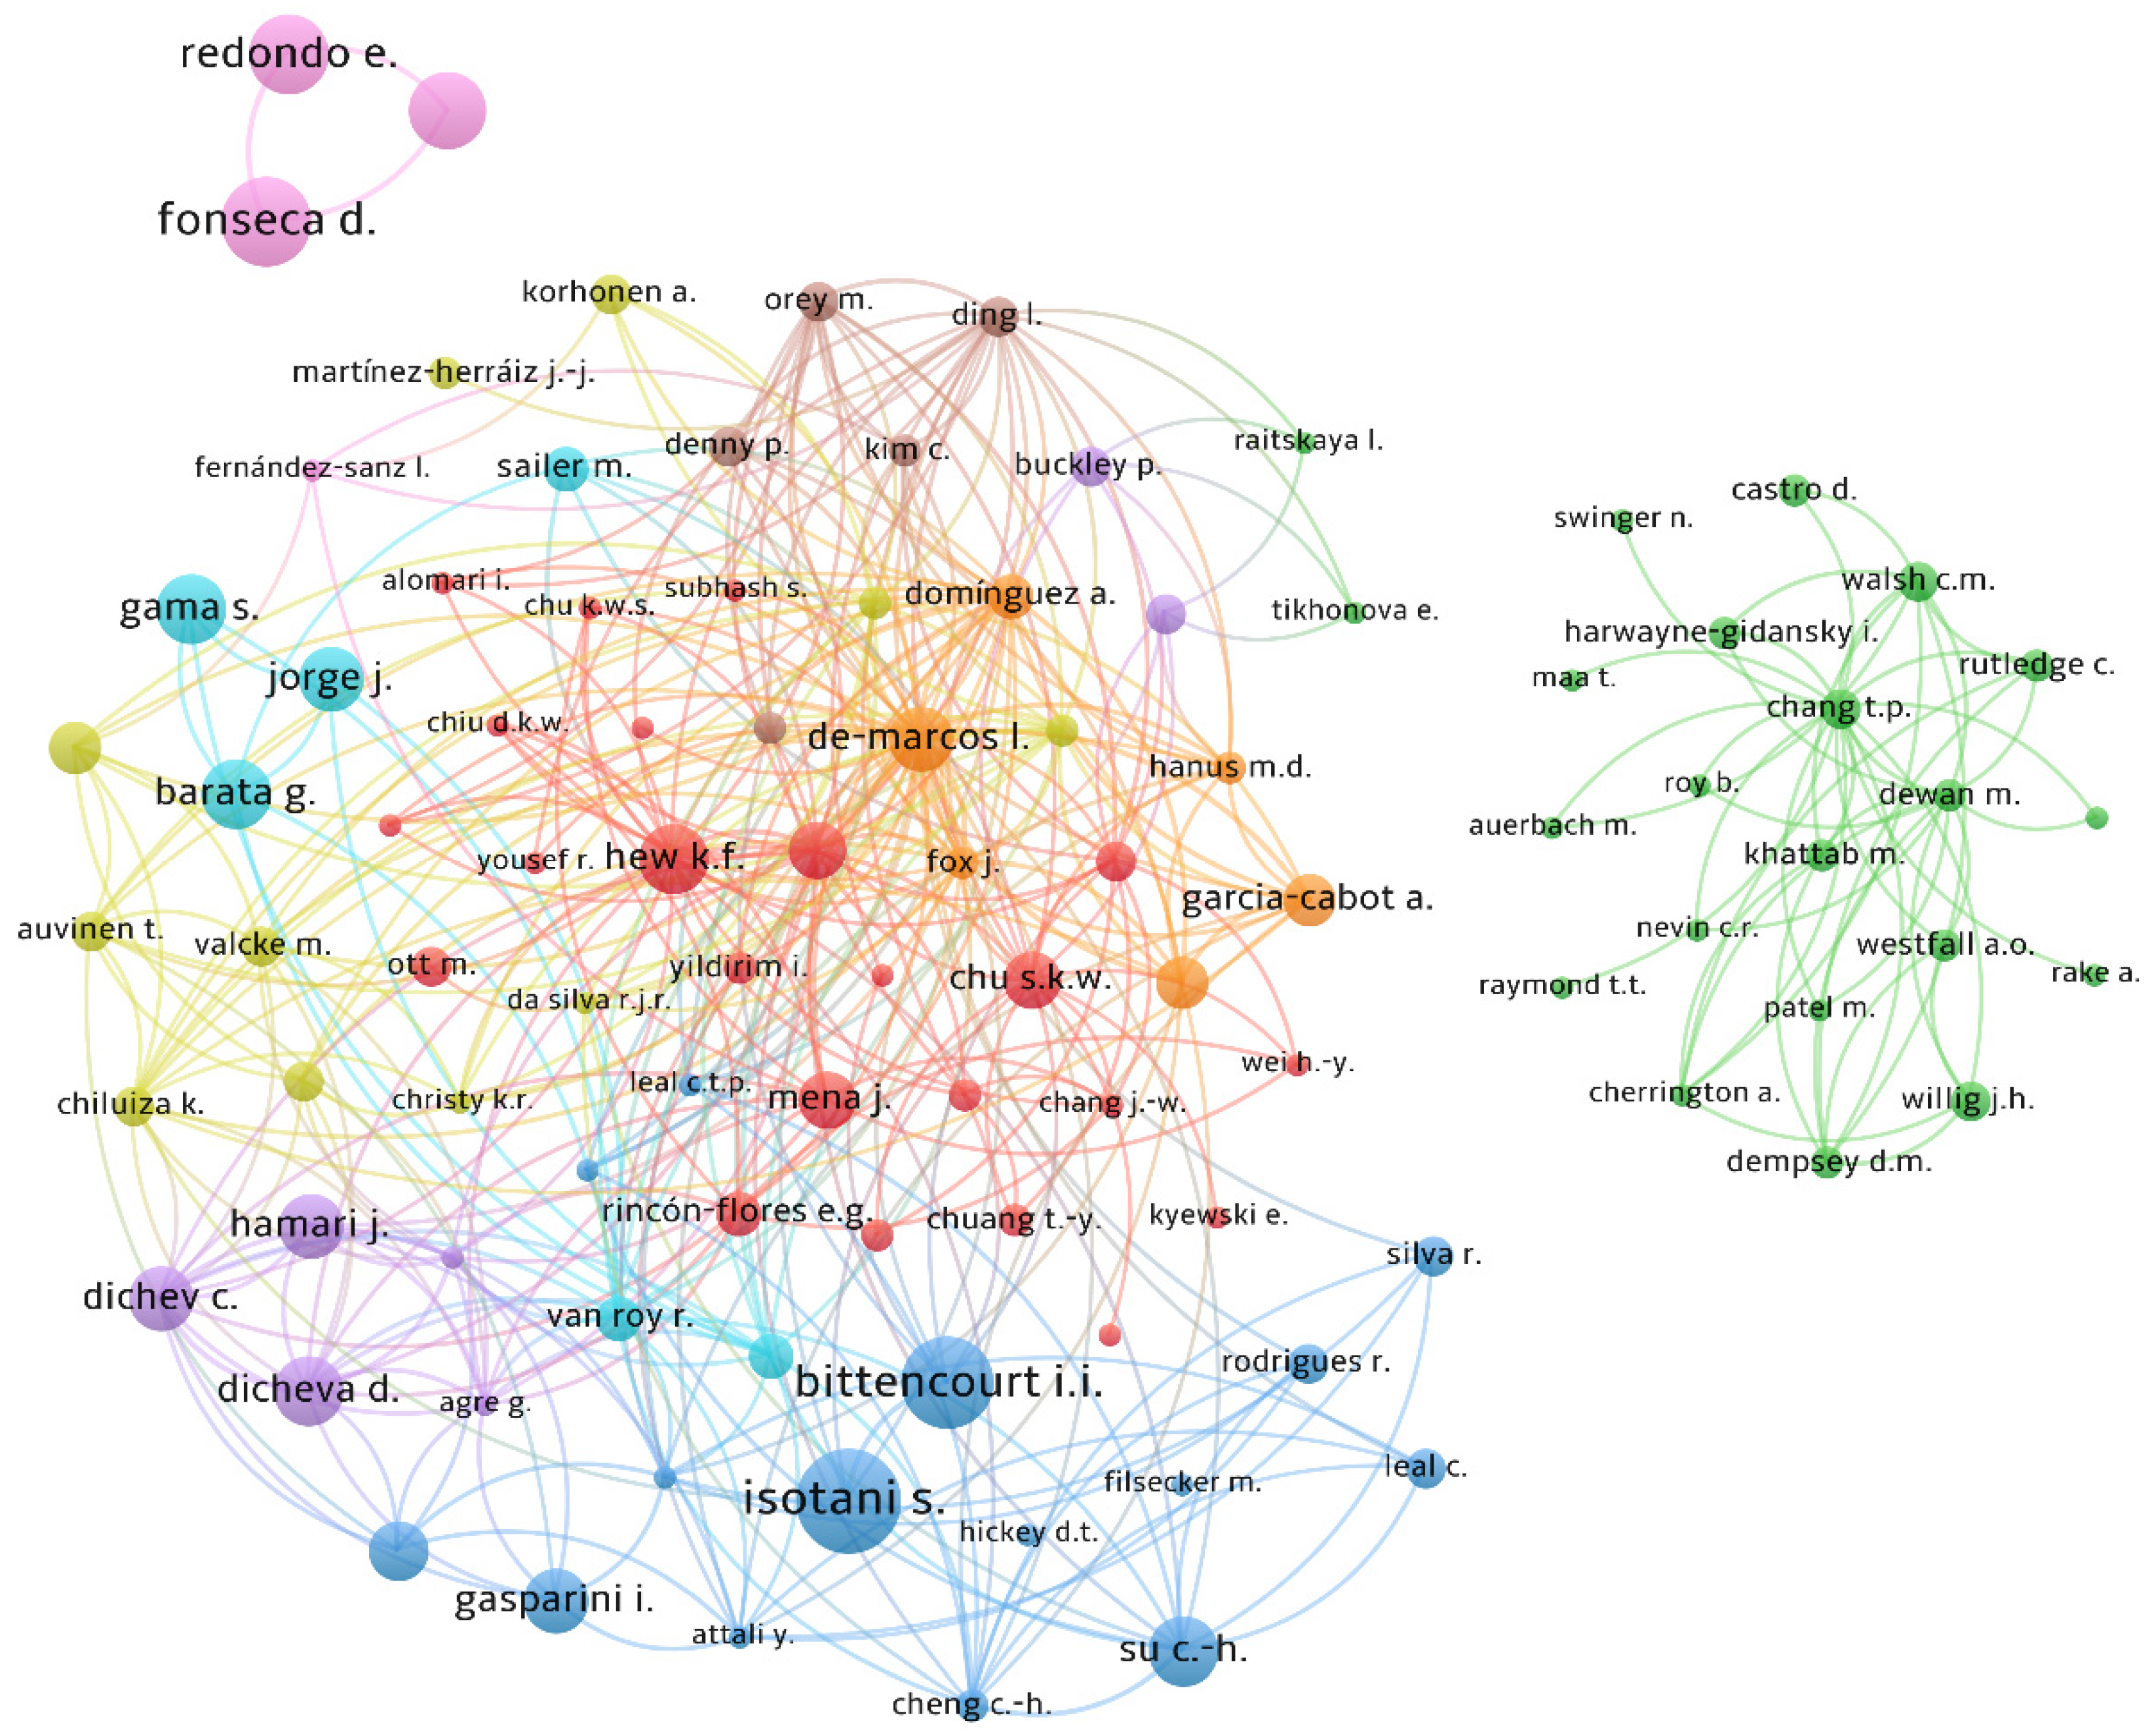
Figure 8 shows the map of co-citations for the 99 most prolific authors, generated using the VOS Viewer tool [46]. The number of 99 was fine-tuned to remove numerous outliers, with one large, one medium-sized, and just one small cluster remaining. The number of citations of an author is represented by the circle size, the co-citation of authors (a publication in which they are cited together) is represented with connecting lines, and the largest clusters of authors cited together are shown in the same color.
4. Discussion and Conclusions
By applying the bibliometric approach based on data retrieved from the Scopus database (and to a lesser extent, Web of Science and Google Scholar), and using simple visualization tools we were able to respond to all nine of the stated research questions.
Regarding RQ1, the presented results show that, since 2013, gamification in education is a vivid and quickly developing area of research, with hundreds of new relevant publications coming out every year. As the data for the last year (2020) are not reliable (many publications are still in the process of indexation in the databases), it cannot be said that interest in the topic has already passed its peak: the data from the preceding years argue for the contrary. This observation is supported with the prior literature surveys in the area mentioning an increasing number of publications (see Table 1 and the works listed therein).
As for RQ2, the presented results indicate that even though there are countries (USA, Spain, United Kingdom, and Germany) leading the research, it is not dominated neither by a single country or a group of them, and the interest in gamification in education is widespread as about half of countries and territories of the world contributed to the research in the area. These findings are consistent with the recent observations by Grosseck et al. [18].
With respect to RQ3, research results regarding gamification in education are mostly disseminated at conferences, and journals are the second choice of the authors. Book chapters and books other than conference proceedings are relatively scarce. Note that the domination of conference proceedings is much more notable compared to surveys covering a smaller number of publications, e.g. [19].
Considering RQ4, the notion of gamification in education has already spread to all the research areas defined by Scopus. The area most often dealing with it is Computer Science. This interest may be attributed to various reasons, such as:
- Computer Science is a somewhat difficult subject of education, therefore the support for engagement and motivation offered by gamification is especially demanded (note also the high interest from the fields of Engineering and Mathematics);
- Computer Science subjects are mostly taught using computers, making it easy to introduce gamification software in the process compared to subjects traditionally taught without the use of computers;
- a considerable part of publications on gamification in education is devoted to presentation of new software tools, which, regardless of the area of education they are applied to, are often published in Computer-Science-related venues.
Regarding RQ5, consistently with the fact that the most preferred dissemination channel for the results of gamification in education research are conferences, the proceedings series are the dominating publishing venues for the area. The only journal that managed to attract a number of publications large enough to be listed among the conference proceeding series is “Computers and Education”. This should serve as an indication for researchers coming to the area where to publish their results to reach the relevant audience.
With respect to RQ6, the interest in gamification in education is not limited to a handful of institutions, and those leading the field did not dominate it. As an illustration to the observed lack of dominance, the most frequent affiliation was one that none of the most prolific authors was affiliated with, and located in a country from outside the top 10 list (compare Table 3 and Table 4 and Section 3.2.1).
Regarding RQ7, there is no huge gap in the number of publications between the leaders (the first spot is taken by S. Isotani who contributed with 21 publications) and the other authors, especially compared to other areas of research (consider e.g., the signal-processing guru, Harold Vincent Poor’s 1809 publications indexed in Scopus). This may stem from the fact that gamification in education is relatively new field of research. The fact that only less than 3% of authors contributed with at least three publications indicates that research on gamification in education is usually a short-time activity rather than an area of scientific specialization.
In the context of RQ8, the presented results show that a number of collaborating researcher groups of various size have been established, however inter-group collaboration has been scarce so far. This may be interpreted in the context of the results of RQ7: in a short-time research there is little reason to reach out for collaboration outside of an established working group.
As for RQ9, both the high number of citations of the key works in the area and a large co-citation cluster involving multiple authors indicate that the research community acknowledges one another’s work on gamification in education.
The results of RQ9 also support the correctness of the choice of search phrases: all the identified most-cited authors are actually contributors to the area of gamification in education. For a comparison, the list of top-cited authors in [18] lists such names as Deterding, Zichermann, Werbach, or even Deci, all of whom have important contributions to gamification research yet outside of the covered educational area.
In conclusion, we would like to underline the key observations from the performed survey: The fast growth of the publications in the area of gamification in education continuing for at least seven years. The worldwide interest in the area is indicated by the number of countries in which the contributing authors are based and the number of institutions to which they are affiliated. An effective research communication in the area is documented by the high number of citations and the large cluster of co-citations. We believe these findings can inspire new research in this field, both by confirming the ongoing interest in the area, and by revealing data such as the unexpected keyword connections, which allows new research questions to be pursued.
Funding
This research received no external funding.
Institutional Review Board Statement
Not applicable.
Informed Consent Statement
Not applicable.
Data Availability Statement
Data were obtained from Web of Science, Scopus, and Google Scholar and are available from the author with the permission of their respective providers.
Conflicts of Interest
The author declares no conflict of interest.
References
- Kapp, K.M. The Gamification of Learning and Instruction: Game-Based Methods and Strategies for Training and Education; Pfeiffer: San Francisco, CA, USA, 2012. [Google Scholar]
- Lamrani, R.; Abdelwahed, E.H.; Chraibi, S.; Qassimi, S.; Hafidi, M. Gamification and Serious Games Based Learning for Early Childhood in Rural Areas. New Trends in Model and Data Engineering; Abdelwahed, E.H., Bellatreche, L., Benslimane, D., Golfarelli, M., Jean, S., Mery, D., Nakamatsu, K., Ordonez, C., Eds.; Springer: Cham, Switzerland, 2018; pp. 79–90. [Google Scholar]
- Alshammari, M.T. Evaluation of Gamification in E-Learning Systems for Elementary School Students. TEM J. 2020, 9, 806–813. [Google Scholar] [CrossRef]
- Buzko, V.; Bonk, A.; Tron, V. Implementation of Gamification and Elements of Augmented Reality during the Binary Lessons in a Secondary School. Pedahohika Vyshchoï Serednoï Shkoly 2018, 51, 74–83. [Google Scholar] [CrossRef] [Green Version]
- Varannai, I.; Sasvari, P.; Urbanovics, A. The Use of Gamification in Higher Education: An Empirical Study. Int. J. Adv. Comput. Sci. Appl. 2017, 8. [Google Scholar] [CrossRef] [Green Version]
- Abdulmenaf, G.; Cigdem, U.B. Gamification in Adult Learning. In Handbook of Research on Adult Learning in Higher Education; Mabel, C.P.O., Tinukwa, O., Boulder, C., Eds.; IGI Global: Hershey, PA, USA, 2020; pp. 570–597. [Google Scholar] [CrossRef]
- Denny, P.; McDonald, F.; Empson, R.; Kelly, P.; Petersen, A. Empirical Support for a Causal Relationship Between Gamification and Learning Outcomes. In Proceedings of the 2018 CHI Conference on Human Factors in Computing Systems—CHI’18, Montreal, QC, Canada, 21–26 April 2018; ACM Press: Montreal, QC, Canada, 2018; pp. 1–13. [Google Scholar] [CrossRef]
- Sánchez-Sepúlveda, M.; Fonseca, D.; Calvo, X.; Navarro, I.; Franquesa, J.; Redondo, E.; Gené, M. Innovation in Urban Design Education. In Proceedings of the Sixth International Conference on Technological Ecosystems for Enhancing Multiculturality—TEEM’18, Salamanca, Spain, 24–26 October 2018; ACM Press: Salamanca, Spain, 2018; pp. 729–736. [Google Scholar] [CrossRef] [Green Version]
- Kasahara, R.; Sakamoto, K.; Washizaki, H.; Fukazawa, Y. Applying Gamification to Motivate Students to Write High-Quality Code in Programming Assignments. In Proceedings of the 2019 ACM Conference on Innovation and Technology in Computer Science Education—ITiCSE ’19, Aberdeen, Scotland, 15–17 July 2019; Association for Computing Machinery: New York, NY, USA, 2019; pp. 92–98. [Google Scholar]
- Broman, K.; Maarell-Olsson, E. Application of Digital Tools in Chemistry Education: Virtual Reality, Augmented Reality and Gamification. 2019 ESERA; Umeå University, Interactive Media and Learning (IML): Umeå, Sweden, 2019. [Google Scholar]
- Goehle, G. Gamification and Web-based Homework. PRIMUS 2013, 23, 234–246. [Google Scholar] [CrossRef]
- Chapman, J.R.; Rich, P.J. Does educational gamification improve students’ motivation? If so, which game elements work best? J. Educ. Bus. 2018, 93, 315–322. [Google Scholar] [CrossRef]
- Dermeval, D.; Albuquerque, J.; Bittencourt, I.I.; Isotani, S.; Silva, A.P.; Vassileva, J. GaTO: An Ontological Model to Apply Gamification in Intelligent Tutoring Systems. Front. Artif. Intell. 2019, 2, 13. [Google Scholar] [CrossRef] [Green Version]
- Swacha, J.; Queirós, R.; Paiva, J.C.; Leal, J.P.; Kosta, S.; Montella, R. A Roadmap to Gamify Programming Education. In Proceedings of the First International Computer Programming Education Conference (ICPEC 2020), Porto, Portugal, 23–24 April 2020; Schloss Dagstuhl-Leibniz-Zentrum für Informatik: Wadern, Germany, 2020. [Google Scholar]
- Tenório, K.; Chalco Challco, G.; Dermeval, D.; Lemos, B.; Nascimento, P.; Santos, R.; Pedro da Silva, A. Helping Teachers Assist Their Students in Gamified Adaptive Educational Systems: Towards a Gamification Analytics Tool. In Artificial Intelligence in Education; Bittencourt, I.I., Cukurova, M., Muldner, K., Luckin, R., Millán, E., Eds.; Springer: Cham, Switzerland, 2020; pp. 312–317. [Google Scholar]
- Hanus, M.D.; Fox, J. Assessing the effects of gamification in the classroom: A longitudinal study on intrinsic motivation, social comparison, satisfaction, effort, and academic performance. Comput. Educ. 2015, 80, 152–161. [Google Scholar] [CrossRef]
- De Sousa Borges, S.; Durelli, V.H.S.; Reis, H.M.; Isotani, S. A systematic mapping on gamification applied to education. In Proceedings of the 29th Annual ACM Symposium on Applied Computing, Gyeongju, Korea, 24–28 March 2014; ACM: Gyeongju, Korea, 2014; pp. 216–222. [Google Scholar] [CrossRef]
- Grosseck, G.; Malita, L.; Sacha, G.M. Gamification in Higher Education: A Bibliometric Approach. In Proceedings of the 16th International Scientific Conference—eLearning and Software for Education, Bucharest, Romania, 30 April–1 May 2020; eLSE: Bucharest, Romania, 2020; pp. 20–30. [Google Scholar]
- Kocakoyun, S.; Ozdamli, F. A Review of Research on Gamification Approach in Education. In Socialization—A Multidimensional Perspective; Morese, R., Palermo, S., Nervo, J., Eds.; IntechOpen: London, UK, 2018. [Google Scholar] [CrossRef] [Green Version]
- Silva, R.J.R.; Rodrigues, R.G.; Leal, C.T.P. Gamification in Management Education: A Systematic Literature Review. BAR Braz. Adm. Rev. 2019, 16, e180103. [Google Scholar] [CrossRef] [Green Version]
- Martí-Parreño, J.; Méndez-Ibáñez, E.; Alonso-Arroyo, A. The use of gamification in education: A bibliometric and text mining analysis: Gamification in education. J. Comput. Assist. Learn. 2016, 32, 663–676. [Google Scholar] [CrossRef]
- Majuri, J.; Koivisto, J.; Hamari, J. Gamification of Education and Learning: A Review of Empirical Literature. In Proceedings of the 2nd International GamiFIN conference, Pori, Finland, 21–23 May 2018; pp. 11–19. [Google Scholar]
- Caponetto, I.; Earp, J.; Ott, M. Gamification and Education: A Literature. In Proceedings of the ECGBL 2014: Eighth European Conference on Games Based Learning, Berlin, Germany, 9–10 October 2014; pp. 50–57. [Google Scholar]
- De Fabricio, C. Using gamification in education: A systematic literature review. In Proceedings of the International Conference on Information Systems 2018—ICIS 2018, San Francisco, CA, USA, 13–16 December 2018. [Google Scholar]
- Legaki, N.; Hamari, J. Gamification in statistics education: A literature review. CEUR Workshop Proc. 2020, 2637, 41–51. [Google Scholar]
- Milosz, M.; Milosz, E. Gamification in Engineering Education—A Preliminary Literature Review. In Proceedings of the 2020 IEEE Global Engineering Education Conference (EDUCON), Porto, Portugal, 28–30 April 2020; pp. 1975–1979. [Google Scholar] [CrossRef]
- Klock, A.; Gasparini, I.; Pimenta, M.; Hamari, J. Tailored gamification: A review of literature. Int. J. Hum. Comput. Stud. 2020, 144, 102495. [Google Scholar] [CrossRef]
- Dicheva, D.; Dichev, C. Gamification in Education: Where Are We in 2015? In Proceedings of the E-Learn: World Conference on E-Learning in Corporate, Government, Healthcare, and Higher Education 2015, Kona, HI, USA, 19 October 2015; Association for the Advancement of Computing in Education (AACE): Kona, HI, USA, 2015; pp. 1445–1454. [Google Scholar]
- Subhash, S.; Cudney, E.A. Gamified learning in higher education: A systematic review of the literature. Comput. Hum. Behav. 2018, 87, 192–206. [Google Scholar] [CrossRef]
- Osatuyi, B.; Osatuyi, T.; de la Rosa, R. Systematic Review of Gamification Research in Is Education: A Multi-method Approach. Commun. Assoc. Inf. Syst. 2018, 42, 95–124. [Google Scholar] [CrossRef]
- Indriasari, T.; Luxton-Reilly, A.; Denny, P. Gamification of student peer review in education: A systematic literature review. Educ. Inf. Technol. 2020, 25, 5205–5234. [Google Scholar] [CrossRef]
- Dicheva, D.; Dichev, C.; Agre, G.; Angelova, G. Gamification in education: A systematic mapping study. Educ. Technol. Soc. 2015, 18, 75–88. [Google Scholar]
- Ortega-Arranz, A.; Muñoz-Cristóbal, J.A.; Martínez-Monés, A.; Bote-Lorenzo, M.L.; Asensio-Pérez, J.I. How Gamification Is Being Implemented in MOOCs? A Systematic Literature Review. In Data Driven Approaches in Digital Education; Lavoué, E., Drachsler, H., Verbert, K., Broisin, J., Pérez-Sanagustín, M., Eds.; Springer: Cham, Switzerland, 2017; pp. 441–447. [Google Scholar]
- Ortiz Rojas, M.E.; Chiluiza, K.; Valcke, M. Gamification in higher education and STEM: A systematic review of literature. In Proceedings of the Edulearn16: 8th International Conference on Education and New Learning Technologies, Barcelona, Spain, 4–6 July 2016; IATED: Barcelona, Spain, 2016; pp. 6548–6558. [Google Scholar]
- Hamari, J.; Koivisto, J.; Sarsa, H. Does Gamification Work?—A Literature Review of Empirical Studies on Gamification. In Proceedings of the 47th Annual Hawaii International Conference on System Sciences, Waikoloa, HI, USA, 6–9 January 2014; pp. 3025–3034. [Google Scholar] [CrossRef]
- Alhammad, M.M.; Moreno, A.M. Gamification in software engineering education: A systematic mapping. J. Syst. Softw. 2018, 141, 131–150. [Google Scholar] [CrossRef]
- Hallifax, S.; Serna, A.; Marty, J.C.; Lavoué, E. Adaptive Gamification in Education: A Literature Review of Current Trends and Developments. In Transforming Learning with Meaningful Technologies; Scheffel, M., Broisin, J., Pammer-Schindler, V., Ioan-nou, A., Schneider, J., Eds.; Springer: Cham, Switzerland, 2019; pp. 294–307. [Google Scholar]
- Gari, M.; Radermacher, A. Gamification in Computer Science Education: A Systematic Literature Review. In Proceedings of the 2018 ASEE Annual Conference and Exposition, Salt Lake City, UT, USA, 23–27 June 2018; Volume 2018. [Google Scholar]
- Nicholas, D.; Ritchie, M. Literature and Bibliometrics; OCLC: 3380191; Bingley: London, UK, 1978. [Google Scholar]
- Schaller, A.A.; Vatananan-Thesenvitz, R.; Pulsiri, N.; Schaller, A.M. The Rise of Digital Business Models: An Analysis of the Knowledge Base. In Proceedings of the 2019 Portland International Conference on Management of Engineering and Technology (PICMET), Portland, OR, USA, 25–29 August 2019; IEEE: Piscataway, NJ, USA, 2019; pp. 1–13. [Google Scholar]
- Baker, N.C.; Ekins, S.; Williams, A.J.; Tropsha, A. A bibliometric review of drug repurposing. Drug Discov. Today 2018, 23, 661–672. [Google Scholar] [CrossRef] [PubMed]
- Yoopetch, C.; Nimsai, S. Science Mapping the Knowledge Base on Sustainable Tourism Development, 1990–2018. Sustainability 2019, 11, 3631. [Google Scholar] [CrossRef] [Green Version]
- Hallinger, P.; Chatpinyakoop, C. A Bibliometric Review of Research on Higher Education for Sustainable Development, 1998–2018. Sustainability 2019, 11, 2401. [Google Scholar] [CrossRef] [Green Version]
- Giustini, D.; Boulos, M.N.K. Google Scholar is not enough to be used alone for systematic reviews. Online J. Public Health Inform. 2013, 5, 214. [Google Scholar] [CrossRef] [Green Version]
- Aksnes, D.W.; Sivertsen, G. A Criteria-based Assessment of the Coverage of Scopus and Web of Science. J. Data Inf. Sci. 2019, 4, 1–21. [Google Scholar] [CrossRef] [Green Version]
- Van Eck, N.J.; Waltman, L. Software survey: VOSviewer, a computer program for bibliometric mapping. Scientometrics 2010, 84, 523–538. [Google Scholar] [CrossRef] [PubMed] [Green Version]
Figure 1.
Number of publications meeting the search criteria in subsequent years.

Figure 2.
Number of publications coming from respective countries.

Figure 3.
Number of publications of respective type.

Figure 4.
Number of publications from respective science branches.
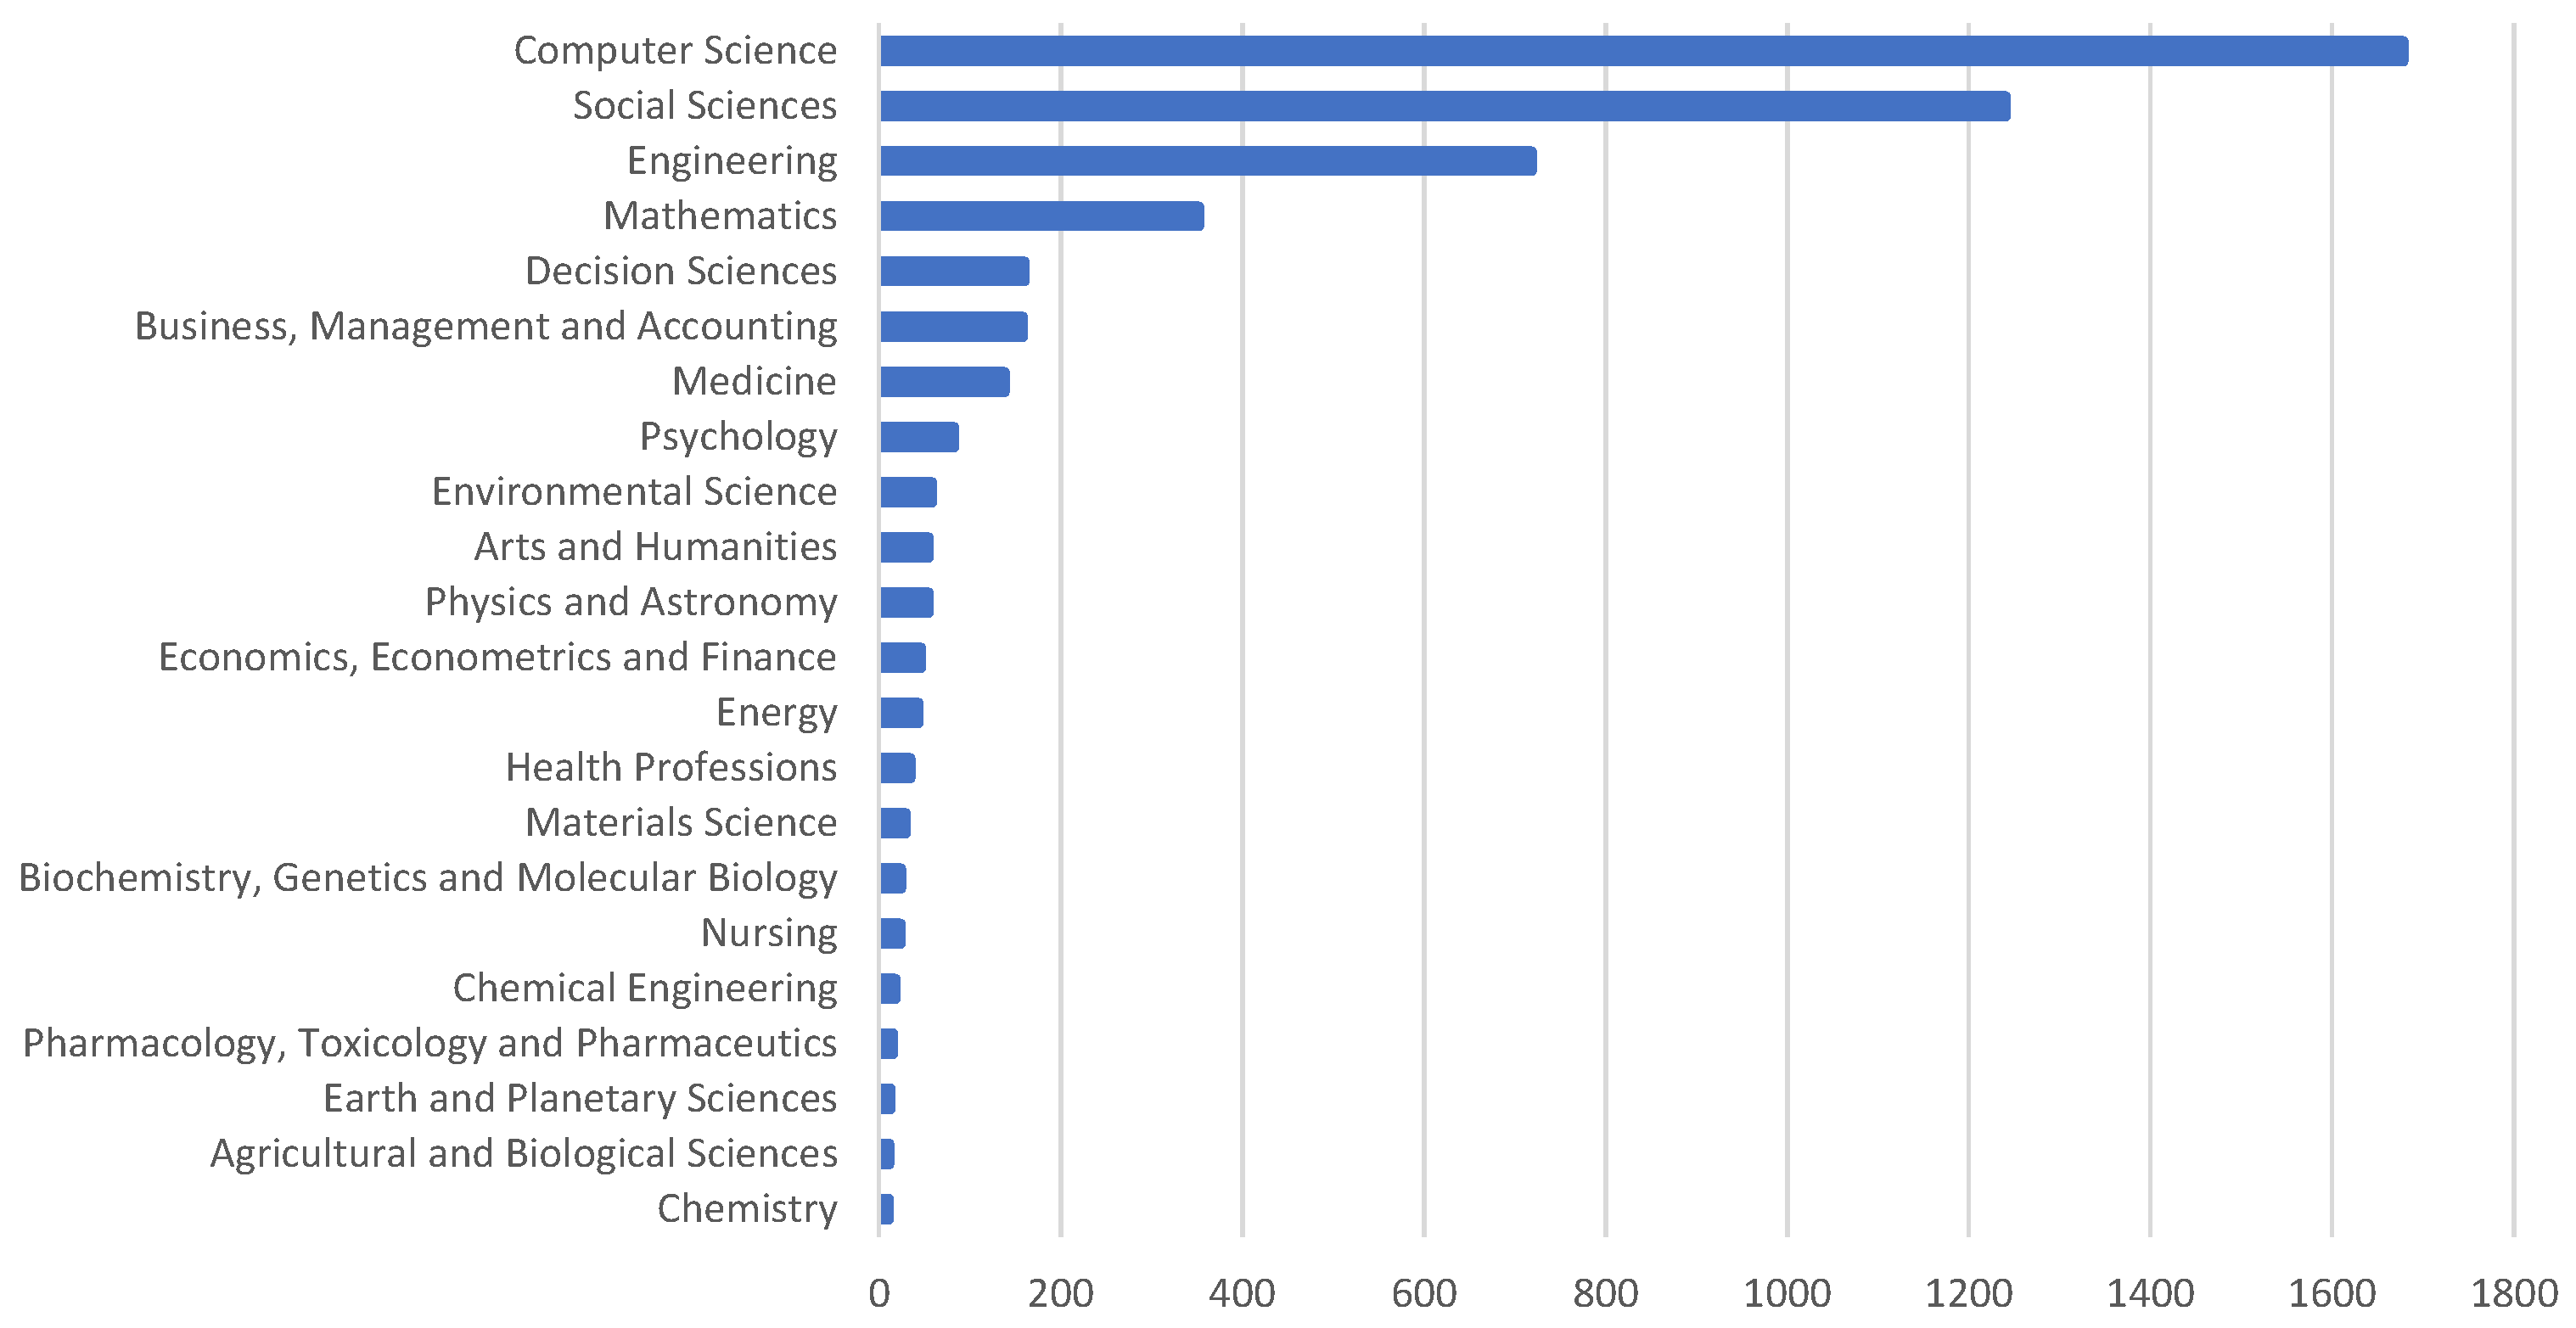
Figure 5.
The most frequent keywords and their co-occurrence.

Figure 6.
The most frequent publication venues.

Figure 7.
The map of co-authors.

Figure 8.
The map of co-citations.


Table 1.
Prior literature surveys in the area of gamification in education.
| Reference | Scope | Items | Databases 1 | Year |
|---|---|---|---|---|
| [18] | Higher education | 1029 | WoS | 2019 |
| [19] | (unrestricted) | 313 | WoS | 2018 |
| [20] | Management | 244 | Scopus, WoS | 2017 |
| [21] | (unrestricted) | 139 | WoS | 2014 |
| [22] | Empirical research | 128 | Scopus | 2015 |
| [23] | (unrestricted) | 119 | Scholar, WoS, Scopus, ResearchGate, Academia | 2014 |
| [24] | (unrestricted) | 95 | EBSCO, ScienceDirect, AISeL | 2018 |
| [25] | Statistics | 49 | Scopus, AISeL | 2019 |
| [26] | Engineering | 48 | IEEE | 2019 |
| [27] | Tailored gamification | 42 | ACM, IEEE, ScienceDirect, Scopus, Springer | 2019 |
| [28] | Empirical research | 41 | ACM, IEEE, ScienceDirect, Scopus, ERIC, Scholar | 2015 |
| [29] | Higher education | 41 | ACM, EBSCO, ASME, IEEE, PsychINFO, Scopus | 2017 |
| [30] | Information Systems | 41 | AISeL, ACM | 2016 |
| [31] | Peer review | 39 | ACM, IEEE, ScienceDirect, Springer, Scopus, WoS, ERIC | 2018 |
| [32] | Empirical research | 34 | ACM, IEEE, ScienceDirect, Scopus, Springer, ERIC, Scholar | 2014 |
| [33] | MOOCs | 34 | ACM, IEEE, ScienceDirect, Scopus, Springer, | 2017 |
| [34] | Higher education/STEM | 30 | WoS | 2016 |
| [17] | (unrestricted) | 26 | ACM, ScienceDirect, IEEE, Scopus, Springer | 2013 |
| [35] | Empirical research | 24 | EBSCO, Proquest, WoS, Scopus, ScienceDirect, Scholar, ACM, AISeL | 2013 |
| [36] | Software engineering | 21 | ACM, IEEE, Scopus, ScienceDirect, WoS | 2017 |
| [37] | Adaptive gamification | 20 | ACM, IEEE, ScienceDirect, Springer, Scholar | 2019 |
| [38] | Computer Science | 16 | ACM, IEEE, ProQuest, Web of Science | 2017 |
1 ACM: ACM Digital Library; ASME: ASME Digital Collection; IEEE: IEEE Xplore; Scholar: Google Scholar; Springer: Springer Link; WoS: Web of Science.
Table 2.
Co-occurrence of publications in the considered databases.
| Database | Google Scholar | Scopus | Web of Science | Duplicates | Coverage |
|---|---|---|---|---|---|
| Google Scholar | 66.7% | 10.2% | 6.2% | 16.8% | 20.7% |
| Scopus | 4.0% | 62.3% | 28.3% | 5.4% | 60.4% |
| Web of Science | 3.5% | 40.9% | 48.7% | 6.9% | 41.1% |
Table 3.
The most frequent affiliations of publication authors.
| Institution | Country | Share |
|---|---|---|
| Tecnologico de Monterrey | Mexico | 1.4% |
| Universidade de Sao Paulo—USP | Brazil | 1.0% |
| Universidad de Salamanca | Spain | 0.9% |
| Universidade Federal de Alagoas | Brazil | 0.8% |
| The University of Hong Kong | Hong Kong | 0.8% |
| Technische Universitat Graz | Austria | 0.8% |
| Universitat Ramon Llull | Spain | 0.8% |
| Universidade de Lisboa | Portugal | 0.8% |
| University of Toronto | Canada | 0.7% |
| Universidad Politécnica de Madrid | Spain | 0.7% |
| Universidad de la Laguna | Spain | 0.6% |
| Universitat Politècnica de Catalunya | Spain | 0.6% |
| Universidad Rey Juan Carlos | Spain | 0.6% |
| Pennsylvania State University | USA | 0.6% |
| Open University of the Netherlands | the Netherlands | 0.6% |
| IESCID Lisboa | Portugal | 0.6% |
| Universidad de Granada | Spain | 0.5% |
| Panepistimion Patron | Greece | 0.5% |
| Curtin University | Australia | 0.5% |
| Kazan Federal University | Russia | 0.5% |
Table 4.
The most prolific authors.
| Author | Country | Works |
|---|---|---|
| Isotani, S. | Brazil | 21 |
| Bittencourt, I.I. | Brazil | 16 |
| Fonseca, D. | Spain | 15 |
| Toda, A.M. | Brazil | 13 |
| Berkling, K. | Germany | 11 |
| Hew, K.F. | Hong Kong | 11 |
| Villagrasa, S. | Spain | 11 |
| Antonaci, A. | the Netherlands | 10 |
| Barata, G. | Portugal | 9 |
| Dicheva, D. | USA | 9 |
| Gama, S. | Portugal | 9 |
| Gasparini, I. | Brazil | 9 |
| Paiva, J.C. | Portugal | 9 |
| Su, C.H. | Taiwan | 9 |
| Dichev, C. | USA | 8 |
| Hamari, J. | Finland | 8 |
| Huang, B. | Hong Kong | 8 |
| Jorge, J. | Portugal | 8 |
| Klock, A.C.T. | Finland | 8 |
| Leal, J.P. | Portugal | 8 |
| Meinel, C. | Germany | 8 |
| Queirós, R. | Portugal | 8 |
| Redondo, E. | Spain | 8 |
| Sillaots, M. | Estonia | 8 |
Table 5.
The most cited works on gamification in education.
| Title | Authors | Year | Venue | Cited |
|---|---|---|---|---|
| Gamifying learning experiences: Practical implications and outcomes | Domínguez A., Saenz-De-Navarrete J., De-Marcos L., Fernández-Sanz L., Pagés C., Martínez-Herráiz J.-J. | 2013 | Computers and Education | 712 |
| Assessing the effects of gamification in the classroom | Hanus M.D., Fox J. | 2015 | Computers and Education | 528 |
| Defining gamification—A service marketing perspective | Huotari K., Hamari J. | 2012 | MindTrek Conference | 523 |
| Gamification in education: A systematic mapping study | Dicheva D., Dichev C., Agre G., Angelova G. | 2015 | Educational Technology and Society | 519 |
| An empirical study comparing gamification and social networking on e-learning | De-Marcos L., Domínguez A., Saenz-De-Navarrete J., Pagés C. | 2014 | Computers and Education | 249 |
| The effect of virtual achievements on student engagement | Denny P. | 2013 | Conference on Human Factors in Computing Systems | 229 |
| Foundations of Game-Based Learning | Plass J.L., Homer B.D., Kinzer C.K. | 2015 | Educational Psychologist | 197 |
| A recipe for meaningful gamification | Nicholson S. | 2015 | Gamification in Education and Business | 187 |
| A mobile gamification learning system for improving the learning motivation and achievements | Su C.-H., Cheng C.-H. | 2015 | Journal of Computer Assisted Learning | 186 |
| A systematic mapping on gamification applied to education | De Sousa Borges S., Durelli V.H.S., Reis H.M., Isotani S. | 2014 | ACM Symposium on Applied Computing | 172 |
| Gamification and serious games for personalized health | McCallum S. | 2012 | Studies in Health Technology and Informatics | 158 |
| Digital badges in education | Gibson D., Ostashewski N., Flintoff K., Grant S., Knight E. | 2015 | Education and Information Technologies | 150 |
Publisher’s Note: MDPI stays neutral with regard to jurisdictional claims in published maps and institutional affiliations. |
© 2021 by the author. Licensee MDPI, Basel, Switzerland. This article is an open access article distributed under the terms and conditions of the Creative Commons Attribution (CC BY) license (http://creativecommons.org/licenses/by/4.0/).
Share and Cite
MDPI and ACS Style
Swacha, J. State of Research on Gamification in Education: A Bibliometric Survey. Educ. Sci. 2021, 11, 69. https://doi.org/10.3390/educsci11020069
AMA Style
Swacha J. State of Research on Gamification in Education: A Bibliometric Survey. Education Sciences. 2021; 11(2):69. https://doi.org/10.3390/educsci11020069
Chicago/Turabian StyleSwacha, Jakub. 2021. "State of Research on Gamification in Education: A Bibliometric Survey" Education Sciences 11, no. 2: 69. https://doi.org/10.3390/educsci11020069
Note that from the first issue of 2016, this journal uses article numbers instead of page numbers. See further details here.