Abstract
The ability to analyse aspects of visual culture—works of art, maps or plans, graphs, tables and X-rays—quickly and efficiently is critical in decision-making in a broad range of disciplines. Eye tracking is a technology that can record how long someone dwells on a particular detail in an image, where the eye moves from one part of the image to the other, and the sequence the viewer uses to interpret visual information. These MP4 recordings can be played back and graphically enhanced with coloured dots and lines to point out this natural and fluent eye behaviour to learners. These recordings can form effective pedagogical tools for learning how to look at images through the eyes of experts by mimicking the patterns and rhythms of expert eye behaviour. This paper provides a meta-analysis of studies of this kind and also provides the results of a cross-disciplinary project which involved five different subject areas. The consensus arising from our meta-analysis reveals an emerging field with broad concerns in need of more integrated research. None of the studies cited in this article are interdisciplinary across the sciences and arts and, while some of them address higher education in medicine and computing, there are no interdisciplinary studies of how eye tracking is important for teaching in arts and science subjects at undergraduate and postgraduate levels. In addition, none of the studies address how learning practitioners find these eye recordings useful for their own understanding of learning processes. This establishes the unique contribution of this project.
1. Introduction
Eye tracking technology provides an effective means for capturing a person’s eye movements. It records what people are looking at, how long they dwell on an image and what they notice or ignore. This rich and valuable information of a person’s attention at a particular instant has many potential applications in the field of education. As a research tool, it has been increasingly employed to study the learning patterns of the students based on their visual attention. The gaze data captures the amount of time they spend looking at a particular section, the sequence in which they observe or grasp the course material and the focus areas that get the most attention. The analysis of the gathered clues to the visual attention allows one to assess the students’ viewing behaviour and gain insight into their thinking process. This individualised information on the students’ attention could help instructors improve the efficiency of their learning material and make it more engaging and interactive [,,]. Research affirms that this gaze-enhanced information can also be used as a pedagogical tool, utilised to guide the student’s attention based on the eye gaze patterns from a skillful expert []. Eye movement modelling examples (EMMEs) that are video-based have become a new kind of teaching material where the expert (model) demonstrates how to look at features of an image, on video, to a novice user in order for them to imitate.
2. Background
2.1. Observational Learning
Bandura’s observational learning and modelling from the social learning theory is of central importance, and lays the groundwork for other studies []. According to this theory, most of human behaviour comes from observing and trying to imitate others. The theory explains that human learning is determined by cognitive, behavioural and environmental influences. To secure this, certain factors such as attention to detail, retention (remembering what you paid attention to), reproducing observed behaviour and remaining motivated to do so, are considered vital. It is also important for observational learning that learners attend to and discern the notable features of the modelled behaviour accurately to promote learning. Schunk and Zimmerman [], extended Bandura’s theory, developing a four-phase, social cognitive model in reading and writing, where observation was treated as the first step in the learning process, followed by the learner emulating the model’s general style, internalising skills for independent demonstration, and finally the adaptation of these learned skills. Thus, observation is the first step and plays a powerful role in shaping the things we know and things we do. Research shows that observation helps promote learning in various domains such as reading and writing [], mathematics [], visual and verbal arts [] and medicine [,]. In the educational context, observational learning, or example-based learning, can be effectively achieved by presenting students with an eye movement modelling example (EMME) that depicts the eye pattern of the expert on the study material [,,].
2.2. Effective Multimedia Learning
Research on multimedia learning suggests that people learn better if the associated pictures are added to the text; a well-known “multimedia principle”, or multi-sensory experience, results in higher learning outcomes compared to learning with text alone []. The importance of multimedia instructions in educational materials has been accounted for in the literature for enhanced learning. However, to promote meaningful learning, it is essential that the learner is cognitively active [], and the instruction media is best designed in the light of how the human mind works, as far as we know it. The cognitive theory of multimedia learning [], explains that effective multimedia learning is achieved through instructional media which is designed to engage learners in the cognitive process of selecting, organizing and integrating information. The learner first selects the salient information from the presented text and image, organises the selected material in a coherent verbal/pictorial representation and finally integrates the textual and pictorial representation with each other, along with prior knowledge, to create a mental model. Several studies show that the lack of instructional support makes it difficult for learners to integrate information and make full use of the multimedia material [,,]. Successful and unsuccessful learners both differ in how they process the instructional media, and often learners fail to build a coherent mental model of multimedia material which leads to poor learning outcomes [,]. Research suggests that EMMEs are effective pedagogical tools for multimedia learning, helping to foster visual processing []. Research reveals that, regardless of the task relevance, a viewer’s attention can be easily distracted by salient/distinctive features [,,]. Others studied experts’ differences in perceiving and interpreting visual stimuli, and concluded that experts are skilled in distinguishing relevant information, and interpreting and carrying out tasks efficiently compared to novices, who tend to miss out on the relevant information [,,].
2.3. Eye Tracking as an Instructional Tool
Studies in the areas of radiology, puzzle solving, computing and reading [,,] showed that experts’ eye movements provide more detailed information than verbal explanation alone and could be treated as a guiding factor for the novice. Velichkovsky (1995) conducted experiments on cooperative problem-solving, where novices and experts were paired in order to combine different capabilities to solve puzzles []. The novice, who knew very little about the solution, acted on the problem while the expert guided him through his gaze. In another experiment, Grant and Spivey (2003) developed visual highlighting (cueing) based on the expert’s eye movements, and showed that it enhances learning for less skilful learners [].
Gaze tracking is very useful in understanding how a person interprets the visuals. In the field of medicine, Bond (2014) [] analysed an expert’s extraction of information from an electrocardiogram (ECG) through video recordings. They write, “[T]his research presents eye gaze results from expert ECG annotators and provides scope for future work that involves exploiting computerised eye tracking technology to further the science of ECG interpretation.” Another study by McLaughlin (2017) explored the use of eye tracking to examine the search strategies and the image interpretation techniques adopted by participants for X-ray images. McLaughlin, 2017 [] investigated image interpretation performance by diagnostic radiography students, diagnostic radiographers and reporting radiographers by computing eye gaze metrics using eye tracking technology. Reporting radiographers demonstrated a 15% greater accuracy rate, and took longer to clinically decide on all features compared to students. Reporting (student) radiographers also had a 15% greater accuracy rate and took longer to clinically decide on an image diagnosis. Reporting radiographers had a greater mean fixation and mean visit count within the areas of pathology compared to students. This suggests that students were too quick to make decisions on fewer fixations and fewer iterations of image aspects.
2.4. Learning through EMMEs
EMMEs are also effective instruction tools that help foster visual processing for multimedia learning. Studies for reading an illustrated text were conducted by Mason, Pluchino and Tornatora (2015) [], who showed how students enhance their understanding of the material by replaying the expert’s eye pattern. In their work, Mason et al. set up modelling (EMME) and non-modelling (no-EMME) conditions for high school students, and showed that those helped by EMME were able to establish more correspondences between the text and the graphical information, and were engaged in deeper learning. A similar experiment was conducted in the university context [], indicating that adult learners also benefit from the EMMEs. However, the study noted that it was important learners acquired a certain level of cognitive competence, such as prior knowledge, in order to interpret the presented information effectively. This meta-analysis of eye tracking as a pedagogical tool reveals that there has been no multi-disciplinary study (particularly in the humanities) attempted here.
3. Method
We recorded the eye behaviour of five experienced lecturers, and 23 students (five for each discipline except health science = 3). Some of these recordings were shown to students in full classes, and we provided a questionnaire to gauge their interest. Another strategy was to ask teachers to evaluate how these video clips of students’ eye movements helped them to reflect on their own pedagogical practice. The MP4 recordings avoided text-heavy information and complex linear explanation and helped students to learn through visual observation. Another important aspect was engagement: these videos captured students’ imagination and motivated learning. The project was divided into several phases over the two-year time span. The project began with various meetings to decide complementary and cooperative strategies.
The project recorded the eye behaviour of the lecturers in four different disciplines. Each lecturer was asked to choose a set of technical images that students needed to interpret in order to acquire competency for certain learning outcomes in the course. Recordings were made, edited, enhanced with graphics and integrated into the three courses on Canvas and Talis Aspire, as downloadable recordings. The courses included several disciplines: art history, computer science, psychology, medical health and comics. Each lecturer was asked to select images on which the eye gaze patterns were to be recorded.
For year one, the project started with (i) recording and enhancement, (ii) playback to pilot courses and (iii) evaluation for the courses chosen for the pilot group. The pilot group consisted of PSYCH 303, CM20216, ARTHIST 725 and ARTHIST 231/331. These were the only courses for which we had questionnaires and feedback, in year one of the project. It was important to establish student involvement and engagement and the results are provided below. In year two of the project, we attempted to focus on the lecturers themselves and how they interpreted the eye recordings for their own self-reflection on pedagogy. We believe that this mixed approach in the methodology clearly demarcates the different ways in which this technology is beneficial for both students and lecturers. Gaze recordings were created using a Tobii T120 eye gaze tracker. The eye tracker built into 17-inch TFT monitor had a resolution of 1280 × 1024 pixels. A variety of software was used to record, analyse and annotate gaze recordings, including Tobii Studio and custom applications. The end products were standard MP4 video files.
4. Courses and Study Material
4.1. ARTHIST 231/331 Framing the Viewer and ARTHIST 725 Concepts in Contemporary Art
ARTHIST 231/331 is appropriate as a pilot for recording gaze behaviour for several reasons. As the title of the course suggests, this course examines how artists attract the interest of viewers with eye-catching visual details. These artists produce visual conundrums and problems (a famous example is Escher, Dali or Op Art) which make viewers cognitively aware of how vision works, and how artists are able to create illusions. Gaze behaviour was recorded for reading eight distinct kinds of images, realism, Cubism and abstract art. A trained art historian’s gaze recording was contrasted with those of a novice to see differences and provide discussion points. We recorded the eye behaviour of four novices. Particularly important is the sequence of details or objects viewed in a painting and the time spent on key areas which strongly influence how one learns or retells the “story” or meaning of the painting or works up analytical, or emotional states. Meanwhile, ARTHIST 725 is a postgraduate course of 10 students who research a broad survey of contemporary artworks; they learn techniques of interpretation established by art historians, critics, curators and artists.
4.2. CM20216 Designing Interactive Systems
This is a second-year undergraduate Computer Science course that teaches some material on user interface design. An important part of this subject is to introduce students to the complex eye behaviour involved in human–computer interaction. Gaze recordings will be used to illustrate how experts and users look at user interfaces: webpages, apps and other applications.
A selection of user interfaces (websites) was chosen (see Figure 1 for an example) that included two categories: good and slightly inadequate design choices in creating the interface. We had eight tasks in each category. Good design choices had good usability and where it was easier to spot things in the interface. And the rest were non-intuitive, making it difficult for the user to browse and look for the right information.
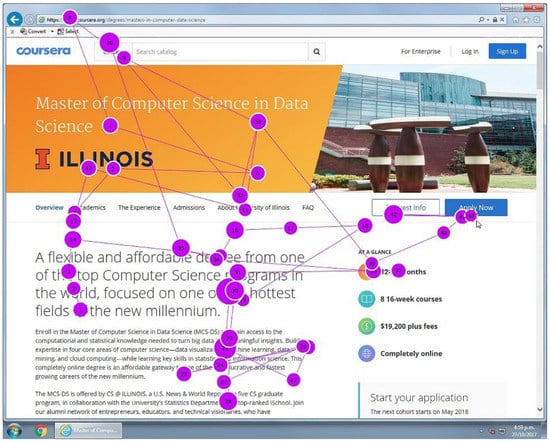
Figure 1.
Example of interfaces examined as part of CM20216 Designing Interactive Systems, showing pattern of student’s eye movements.
4.3. PSYCH 303 Cognitive Science
Change blindness refers to surprising failures to notice changes to a scene following a visual interruption. In both cases, eye movement recordings have demonstrated a “looking without seeing” effect, in which observers may look directly at relevant parts of a scene but fail to “see” important stimuli. This was an elegant way to show how students themselves can focus on something but not register it because they were distracted. To explain the inattentional blindness, scientists demonstrated in their “The Invisible Gorilla” experiment that people while retaining their attention on one thing tend to ignore other some very obvious things in the field of vision []. This very popular experimental video demonstrating the phenomenon of human perception was chosen by the lecturer along with other images related to visual attention where students were surprised to learn that visual attention and consciousness of that attention are sometimes dissonant: even while looking at things we may not register the thing looked at, as revealed by eye recordings. These videos were then fine-tuned to suit the requirements of the eye gaze recording software (Tobii Studio).
4.4. HLTHPSYC 715 Research Methods in Health Psychology
This course includes six lectures on using statistics with SPSS, a software package. Students learn to interpret the output from the program, which includes tables and graphs. Some of the tables/graphs contain more relevant information than others when trying to interpret the results. Students learn which tables contain the information regarding the main findings. The images used for this study were part of a previous exam question. The question asked students to write a results section based on the output from statistical analyses. The analysis was a multiple hierarchical regression. The question was on page 1, with tables on the subsequent three pages and graphs on the fourth page. The question was worth 10 marks out of 100 in a 2-h exam, which means students had around 12 min to answer the question.
4.5. MEDIA 222/327 Comics and Visual Narrative
Beginning with a history of graphic sequential art and an introduction to the technical language of comics, the course also adopts literary approaches to narrative and a variety of theories of image analysis to enable an understanding of the unique language of comics: the “comixture” of word and image that is essential to the comic book form. The use of new media technologies also requires some consideration of the development of web comics and the “digital native” comics designed for use on phones and tablets.
5. Procedure
The project was set up on the Tobii Studio and the eye movements for the participants (novice users) and the lecturer were recorded for each course. The output videos showed the eye tracking data represented as coloured dots and lines overlaying the actual image/video. The size of the dots varied depending on how long the participant gazed at a location. Due to different course content, the requirement of how these output files get played in these courses was different. To deal with this, we customised the videos as per the lecturer’s needs.
The selected material for the pilot course PSYCH 303 consisted of some videos related to inattentional blindness (the gorilla experiment) and change blindness, where the image flickers off and on again and the observer fails to notice the change. The first 30 s of the interaction was recorded for the expert and novice participants.
A similar strategy was adopted for other courses with some modifications. For ARTHIST 231/331 and ARTHIST 725, the participants were involved in free viewing of the paintings. The first 10 s of interaction with the images was recorded and the output file was generated with gaze data that showed the sequence of objects viewed in the painting and the amount of time spent on the key areas. For each image selected, the final video for playback consisted of the novices’ gaze recording followed by expert gaze recording of the same image but represented with different coloured dots. The students got to see both novices’ and the expert’s eye behaviour and were able to compare how an expert’s way of looking at the visuals differs from a novices’ eye behaviour.
The course CM20216 required participants to be recorded on the user interfaces (UIs), for which the initial step was to select a good number of web UIs (webpages) based on different visual design elements. The webpages were selected such that they included some typical examples of the good and bad UI designs. After finalizing the webpages, a task was designed for each webpage based on a realistic situation. These tasks, and the related webpages, were then presented to the participants in the sequential order. While the participants were performing the given task, their eye behaviour and their interaction with the system were recorded. It was observed that the participants took longer in completing the tasks with bad design webpages and were able to quickly complete the task with structured/good design webpages. The output visual files clearly depict the gaze behaviour and the interaction of the participants with the webpages.
The final videos were then used by the lecturer for playback in the course.
6. Results
A large majority of the replies from students were positive (see Figure 2 below) with many students remarking on how they had never considered the importance of eye movements, and how one can vary them in gaining new insights of images and visual information.
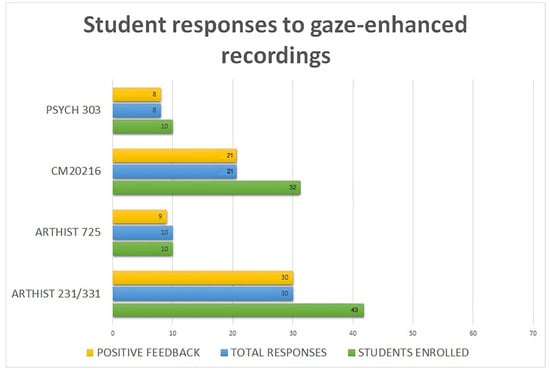
Figure 2.
A summary of sample of courses and feedback. ‘Students enrolled’ does not indicate how many students attended class on those days. The sample size was 69 students, across the different courses.
7. Discussion
For HLTHPSYC 715 Research Methods in Health Psychology, three postgraduate students plus the course coordinator viewed the images and completed the exam question. Their eye gaze data and scores are summarised in Table 1. The results indicate that the course coordinator spent longer continuous periods of time on the model summary in particular, as well as the coefficients table than the students who tended to shift their gaze more frequently. The course coordinator also spent the longest total time on the task, with students spending less than the 12 min that they should have allocated to the question.

Table 1.
Sections of time spent on aspects of the test in HLTHPSYC 715 Research Methods in Health Psychology compared with expert (course -co-ordinator).
These results suggest that the students may not be as familiar with where to look for the relevant numbers that are necessary to answer the question. The main areas the students missed out on marks were from (i) not reporting the coefficients table sufficiently and (ii) incorrectly copying numbers from the model summary and ANOVA tables. This suggests that more time should be spent teaching students to look at these tables in particular ways, and which numbers to use.
As a control experiment, for MEDIA 327/222 Comics and Visual Narrative, we chose pages from a 1939 Superman story that, aside from the half-page title panel, obeyed a regular eight-panel page (Figure 2). To this we added examples of contemporary comics that, while observing elements of the iconic grid, also presented specific issues such as reading across a double-page (Figure 3). We chose these because we were especially interested to examine the tension between reading and looking at images. Reading includes the linear and disciplined reading of captions and speech balloons as well as following the conventional Z-shaped navigation through the page. By contrast, scanning often involves looking at the whole page, or parts of the page, before reading properly starts. This is akin to the scanpaths mentioned in the section on art above. As James Elkins has noted [], this play between reading and looking takes place in any visual medium, but it is especially interesting in a medium where a set of differentiated units that form a serial narrative are all available to view at once.
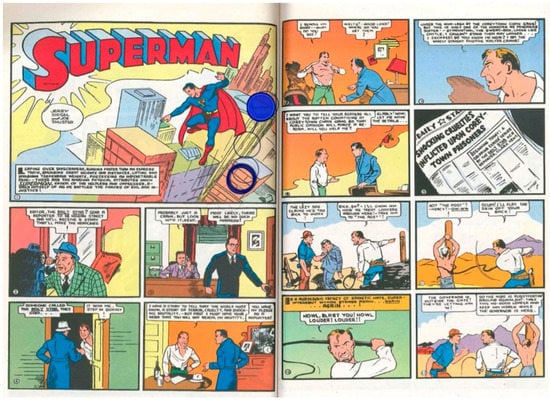
Figure 3.
An example of how a student reads the classic comic strip Superman from left to right.
The early Superman comics (Figure 3) produced the most disciplined readings. The first page is a half-page title panel with four symmetrical panels beneath it, while page two is a regular grid of eight symmetrical panels. Here, the large title panel immediately drew the eye, but it was interesting to see how viewers moved around the visual element of the large panel before moving to the text, with two of the readers even using the image of Superman on the left-hand side of the panel to scan a vector up to the first panel of page two and down to the second panel of page one before alighting on the first text box. Even when the reading had properly begun, though, it was interesting to see the play between reading the textual component of the panel and scanning the visual component, with readers clearly setting up rhythms as they moved between the two planes of signification. It was also notable how, even in this relatively straightforward story, readers often moved backwards to revisit material as a result of acquiring new information in the panel they had just read.
This ebb and flow was even more pronounced in the double-page taken from The Homeland Directive (Figure 4). Here the reader is asked to follow a strip across both pages before moving down. It is also a highly dynamic page as the majority of it depicts an attempted assassination in a hotel room. The requirement to move across the page did not cause a problem for viewers, but what was noticeable was that without having already established a reading rhythm and without a strong opening panel (such as the titular panel in the Superman comic), many readers started close to the middle of the double page before moving towards the start point in the top left-hand corner, with one viewer actually spending some time digesting the final panel (bottom right) before moving to the top of the left-hand page. Additionally, of interest here is the fact that the pages were not text-heavy. While the Z-movement is one way of establishing reading direction, the positioning of text is another key component used to direct the movement of the eye. In the absence of this component, the scanpaths became much more pronounced and also idiosyncratic, although it was possible to detect circular movements around sections of four of five panels as different viewers sought to make sense of the co-presence of elements. Using eye-tracking technology for the comics course provided an excellent heuristic device and an important pedagogical tool in that we can now show students exactly what people do when they “read” comics. It perfectly illustrates the ebb and flow across current and previous elements within a series, the play between textual and visual components within a panel, the difference between reading and looking (and often the priority of looking), the irregularity and non-linear navigation of the page and the significance of all the elements being co-present and available to be “read” simultaneously. It was also really useful for getting students to think about the page or the double-page as a single aesthetic unit that, much like a painting, sets up dynamic relationships among elements that can all be seen together. It thus provides an important tool in both the study of the medium and the creation of comics.
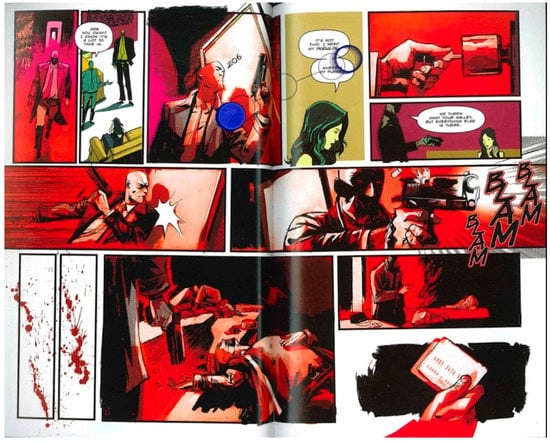
Figure 4.
A page from Homeland Directive, showing more chaotic eye movement because of fewer texts prompts.
For CM20216 Designing Interactive Systems, it was surprising to see how casual users simply overlook interface elements such as buttons if they are not clearly marked or if they are buried in visual clutter. Gaze recordings showed this quite nicely and prepared aspiring user interface designers. Experts, on the other hand, have their own systematic way of looking at user interfaces, and again, this could be useful for students to learn from. The contrast between baseline, novice gaze recordings and expert gaze recordings was used as a learning tool or diagnostic exercise, with the option of examining the gaze behaviour of students who have learned from recordings to see what tips they have picked up. The gaze tracking videos of users performing tasks on well-designed and ill-designed web user interfaces helped explain principles of interaction design with the use of relevant examples of good and bad practice, underlining the positive pedagogical efficacy of this eye tracking technology. This ability to reflect on teaching practice was also noted for the comics course, where the lecturer felt that the structural composition of various images affected eye behaviour, and that this could be discussed as part of the lecture. While there were aspects of invariant behaviour, there were also some highly personalised strategies adopted to inspect images and the interaction between text and images, as with interactive systems, was highly complex, but revealed interesting interplay between nonlinear (pictorial) and linear (textual) searching and reading.
This was also the case for the HLTHPSYC 715 Research Methods in Health Psychology, where students struggled to read and understand complex charts (Figure 5) and did not properly focus on the correct numerical information, contrasting greatly with the expert’s eye behaviour (Figure 6). The video showing novices’ mistakes and the expert’s examination of the images was an important and effective teaching tool for the lecturer, clearly demonstrating how students could improve their understanding of the data by adopting, in a mindful manner, the expert’s repeated eye movements—horizontally with very little vertical distractions.
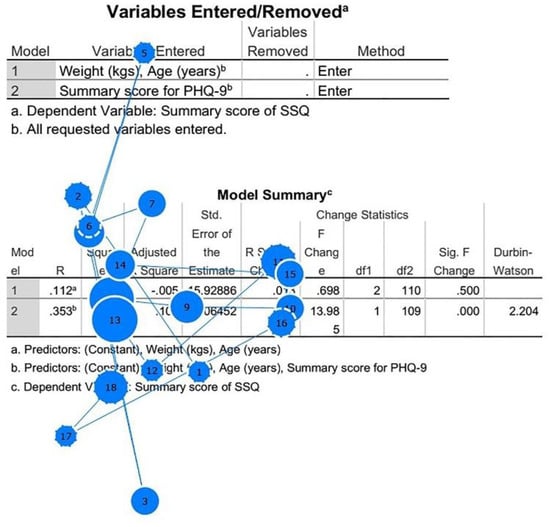
Figure 5.
Students looking at a large number of features not relevant for the task.
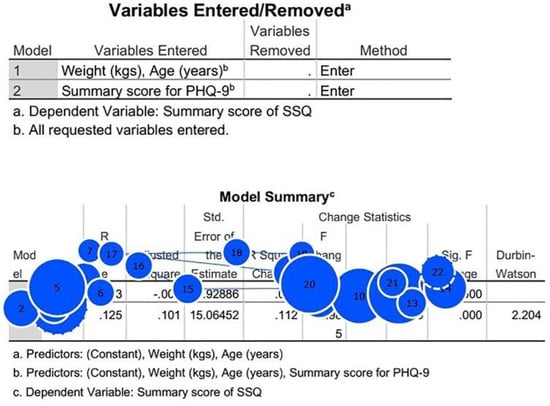
Figure 6.
Record of expert’s eye movements dwelling on the correct and pertinent information, ignoring irrelevant information.
In PSYCH 303 Cognitive Science, the lecturer played back the video to students to show the principle of change blindness. Visual attention is a central topic of this course. Integrating eye movement recordings within the teaching of this topic improved pedagogical practice by adding a directly experiential element. This was especially useful in the context of discussing topics such as inattentional blindness and change blindness. The former refers to the dramatic failures of perception that can be seen when an individual’s attention is engaged on another task. Inattentional blindness appears to be a major component of the driver distraction effects caused by conversing on hands-free or hand-held cell phones while driving. Students remarked on how one can verbally describe this phenomenon, but the video provided a direct and dramatic experiential element to this phenomenon (see Table 2), so that one could “feel” how it is possible to overlook something by following the movements of groups of people. Importantly one could also see that, from the eye tracking, subjects actually looked at the gorilla in the room, but did not register it, because they were paying attention to the actions of the group, passing the basketball to each other.

Table 2.
PSYCH 303 Cognitive Science. Sample quotes from student questionnaires (see Appendix A for questions asked).
In ARTHIST 231/331 Framing the Viewer, eye tracking technology revealed how viewers adopted various nonlinear scanpaths for viewing images and how long they dwelled on these aspects; it was also important to see what was ignored. The patterns of the scanpaths focussed on Picasso’s Guernica (1935) (Figure 7) show a very consistent pattern of oscillatory rhythms from left to right among the four novices recorded. Remarkably, all four individuals ignored the same dark areas, in-between figures, and fixated on facial details and areas of higher luminosity. However, the expert also had more varied and configual (that is, general) viewing habits which included peripheral and darker areas and relationships that pick out a deeper understanding of structural possibilities beyond the obviously salient features. These findings are consistent with Zangemeister et al. (1995) [], who studied the eye behaviour of art experts and novices, and found that those with little experience of viewing artworks tended to move their eyes across shorter distances, particularly when viewing abstract art, compared to those more acquainted with art who moved their eyes over the whole picture. This is also what artists tend to do [], which suggests that configual viewing takes in the broader aspects of a composition. This coheres well with results presented by Cela-Conde et al. which show that experts process configural and global shapes and forms rather than fixating on particular details []. The expert is able to focus on particular fine-grained structures when required, while working memory keeps the global representation in mind. In Rudolph Arnheim’s gestalt psychology, the mind naturally seeks integrated structures as a form of visual behaviour, and vision automatically fixes the centre and periphery, verticals and horizontals and various kinds of shape recognition as “perception centres”, reading relationships between them: “motifs like rising and falling, dominance and submission, weakness and strength, harmony and discord, struggle and conformance” []. In other words, the organisation of complex concepts becomes analogous with the geometric arrangement of perceptual cues in the artwork. For Arnheim, the end result of art is to establish a pleasing order or balance of stresses—an aesthetic concept superimposed over a perceptual tendency identified as “natural”. What needs to be avoided at all costs are conditions of imbalance, where “the artistic statement becomes incomprehensible. The ambiguous pattern allows no decision on which of the possible configurations is meant” [].
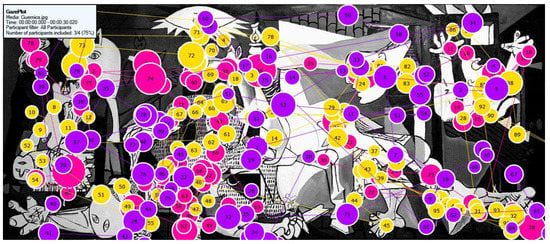
Figure 7.
Two different students look at similar features of the picture (Picasso’s Guernica, 1933) in pink and yellow. The lecturer, however, indicated in purple, looks at more areas not viewed by students, and configurally—with a broader sweep of the painting.
In addition to repeated scanpaths and dwell times, vision has built into it recursive patterns, often spirals, which create order and also erratic variations, sometimes striking out a random path in pursuit of an eye catching detail. This created a rhythmic set of dynamics, somewhere between chaos and order. However, those works which are not abstract, and which do not encourage free-viewing, control eye behaviour in more predictable ways. Our examination of eye behaviour of these different works shows how, broadly speaking, we can have controlled, purposeful eye behaviour which is looking for something to match to a prior search term, or more capricious and involuntary eye behaviour.
Alfred Yarbus, a Russian psychologist, showed that the scanpaths followed depend on the task that the observer has to perform []. For example, viewers were asked different questions about a famous painting An Unexpected Visitor painted by Ilya Repin in 1884. One question was “how old are the people in this painting?”. This caused rapid inspection of faces across the canvas. Another question was “how poor are the people in this painting?” which caused eye sight to be directed at the furnishing and clothes depicted.
Thus, although we are fond of praising conscious and efficient viewing, this may not be the same as purposeless and pleasurable visual observation where the viewer is discovering new structures and relationships suggested by the artworks. When we played back the expert’s ways of viewing configually and inspecting normally ignored areas, students were able to adopt more critical, but no less pleasurable ways of engaging with and learning how artists structure visuals to communicate information. It is perhaps useful to use the terms “consecutive vision” to denote many dwell times and focal points and “simultaneous vision” for a general view of the whole scene. Large areas of relatively empty space play their part in information-rich areas of scenes and images, either as a way to provide peripheral framing or boundary areas, or as resting places for absorbing or reflecting on information.
Finally, we used a famous abstract expressionist painting by Jackson Pollock (Figure 8). Figure 8 shows three novices with the different colours with the numbers showing the order by which each novice looked at things (1–45). We tend to understand vision, particularly that employed in looking at art, as a so-called free viewing experience. We tend to understand that individual differences in looking at things are common, but our team recorded the eye behaviour of individuals looking at the image revealing a remarkable consistency. Particularly striking are the areas ignored by vision. When played back to students, they learned that they could possibly try and look at low contrast areas as well as high contrast areas in order to get a more global and configural view of the image. It is also interesting that vision adopts various complex dynamics to inspect an image, and importantly this vision is only a reflection of the nonlinear dynamic aspects of thought. It is almost as if we believe that we think like a text from start to finish in sequential order but in fact our thought, our stream of consciousness, continually goes back and forth and jumbles up thought and sensations, as we have seen examples of in all the disciplines participating in this project. Students learn the importance of mindful visual searching as a great enhancement and demonstration by looking, in addition to instructions. This layered learning across the senses enforces and increases learning and aid memory and retrieval. This kind of multisensory learning should appeal to different abilities, learning styles and cultural backgrounds. This is somewhat different from comics, where stable anchor points were provided by the text areas.
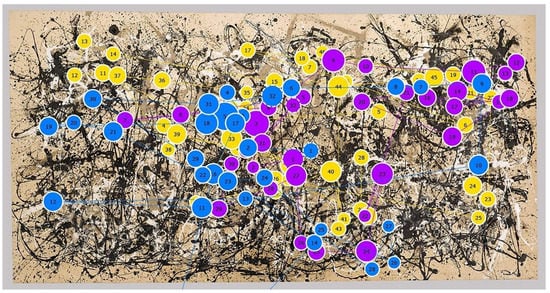
Figure 8.
Students tend to ignore the same areas and follow higher contrast features. We can teach them to look at the low contrast areas so as to gain a better overall view of the composition.
Eye tracking played an important role in increasing students’ engagement and provided a sense of agency viewing images that they feel can be explored rather than passively received (Table 3). From these comments, and many others that repeated similar points, we can conclude that the shift to visual learning using eye tracking in these different disciplinary contexts supports and consolidates learning in a way that can capture the imagination: “seeing through others’ eyes”, and in ways that can be easily recalled (Table 4). Exposure to the working methods and behaviour of experts, and importantly, the study of mistakes made by novices (Table 2 and Table 5) provided immediate knowledge of different viewing methods and showed students what to avoid in their own engagements with visual material in the different disciplines.

Table 3.
ARTHIST 231/331 Framing the Viewer. Student feedbackSample quotes from questionnaire (see Appendix A for questions asked).

Table 4.
ARTHIST 725 Concepts in Contemporary Art. Sample quotes from student questionnaires (see Appendix A for questions asked).

Table 5.
CM20216 Designing Interactive Systems. Sample quotes from student questionnaires (see Appendix A for questions asked).
These recordings were also used for lectures in an honours/advanced course of 10 students.
The aim of the project was to use scientific technology, demonstrating the latest vision science, for four undergraduate courses and two postgraduate courses in multiple disciplines and faculties. Studying the eye behaviour of viewers looking at technical charts, graphs, statistics, computer design interfaces, artworks and comics increased teachers’ understanding of how students learn, and what they tend to find difficult, while students in their questionnaires found these videos engaging and illuminating. Learning where to look for the most important information in images, and how to adopt methods of effective visual searching are quickly absorbed lessons. The project illustrates that not only do teachers use these videos to reflect on teaching practice but also the novelty of the images increases student curiosity, engagement and learning directly, and through experiential demonstration.
Author Contributions
S.S.: writing, original draft preparation, data curation; project administration; G.M.: conceptualization, methodology, review and editing, writing, funding acquisition, supervision; G.W., C.L., A.L.: methodology, software, formal analysis, investigation, data curation; N.C., E.B.: writing, investigation, formal analysis. All authors have read and agreed to the published version of the manuscript.
Funding
This research was funded by The University of Auckland Learning Enhancement Grants, Vice-Chancellor’s office.
Conflicts of Interest
The authors declare no conflict of interest.
Appendix A
Questionnaire on eye tracking technology.
The aim of this questionnaire is to find out how useful students found recordings of eye behaviour shown in lectures, we would like your feedback on how to improve this new feature!
Did you find the recordings informative? Y/N
Did you find the recordings interesting? Y/N
Why?
Did you feel you learned how people look at things? Y/N
What?
How does this technology help students to learn?
References
- Holsanova, J.; Holmberg, N.; Holmqvist, K. Reading information graphics: The role of spatial contiguity and dual attentional guidance. Appl. Cognit. Psychol. Off. J. Soc. Appl. Res. Mem. Cognit. 2009, 23, 1215–1226. [Google Scholar] [CrossRef]
- Louwerse, M.M.; Graesser, A.C.; McNamara, D.S.; Lu, S. Embodied conversational agents as conversational partners. Appl. Cognit. Psychol. Off. J. Soc. Appl. Res. Mem. Cognit. 2009, 23, 1244–1255. [Google Scholar] [CrossRef]
- Schwonke, R.; Berthold, K.; Renkl, A. How multiple external representations are used and how they can be made more useful. Appl. Cognit. Psychol. Off. J. Soc. Appl. Res. Mem. Cognit. 2009, 23, 1227–1243. [Google Scholar] [CrossRef]
- Van Gog, T.; Jarodzka, H.; Scheiter, K.; Gerjets, P.; Paas, F. Attention guidance during example study via the model’s eye movements. Comput. Hum. Behav. 2009, 25, 785–791. [Google Scholar] [CrossRef]
- Bandura, A. Social Foundations of Thought and Action; Prentice Hall: Upper Saddle River, NJ, USA, 1986. [Google Scholar]
- Schunk, D.H.; Zimmerman, B.J. Social origins of self-regulatory competence. Educ. Psychol. 1997, 32, 195–208. [Google Scholar] [CrossRef]
- Couzijn, M.; Rijlaarsdam, G. Learning to read and write argumentative text by observation of peer learners. In Effective Learning and Teaching of Writing; Springer: Berlin/Heidelberg, Germany, 2005; pp. 241–258. [Google Scholar]
- Schunk, D.H. Peer models: Influence on children’s self-efficacy and achievement. J. Educ. Psychol. 1985, 77, 313. [Google Scholar] [CrossRef]
- Groenendijk, T.; Janssen, T.; Rijlaarsdam, G.; Bergh, H. The effect of observational learning on students’ performance, processes, and motivation in two creative domains. Br. J. Educ. Psychol. 2013, 83, 3–28. [Google Scholar] [CrossRef]
- Seppänen, M.; Gegenfurtner, A. Seeing through a teacher’s eyes improves students’ imaging interpretation. Med. Educ. 2012, 46, 1113–1114. [Google Scholar] [CrossRef]
- Jarodzka, H.; Balslev, T.; Holmqvist, K.; Nyström, M.; Scheiter, K.; Gerjets, P.; Eika, B. Conveying clinical reasoning based on visual observation via eye-movement modelling examples. Instruct. Sci. 2012, 40, 813–827. [Google Scholar] [CrossRef]
- Jarodzka, H.; Gog, T.; Dorr, M.; Scheiter, K.; Gerjets, P. Learning to see: Guiding students’ attention via a Model’s eye movements fosters learning. Learn. Instruct. 2013, 25, 62–70. [Google Scholar] [CrossRef]
- Mayer, R.E. Multimedia learning. In Psychology of Learning and Motivation; Elsevier: Amsterdam, The Netherlands, 2002; Volume 41, pp. 85–139. [Google Scholar]
- Mayer, R.E. Introduction to Multimedia Learning. In The Cambridge Handbook of Multimedia Learning; Cambridge University Press: Cambridge, UK, 2005; pp. 1–16. [Google Scholar]
- Mayer, R.E. A cognitive theory of multimedia learning: Implications for design principles. J. Educ. Psychol. 1998, 91, 358–368. [Google Scholar]
- Scheiter, K.A. Signals foster multimedia learning by supporting integration of highlighted text and diagram elements. Learn. Instruct. 2015, 36, 11–26. [Google Scholar] [CrossRef]
- Seufert, T. Supporting coherence formation in learning from multiple representations. Learn. Instruct. 2003, 13, 227–237. [Google Scholar] [CrossRef]
- Seufert, T.A. Cognitive load and the format of instructional aids for coherence formation. Appl. Cognit. Psychol. Off. J. Soc. Appl. Res. Mem. Cognit. 2006, 20, 321–331. [Google Scholar] [CrossRef]
- Hegarty, M.A.-A. Constructing mental models of machines from text and diagrams. J. Mem. Lang. 1993, 32, 717–742. [Google Scholar] [CrossRef]
- Mason, L.; Pluchino, P.; Tornatora, M.C. Using eye-tracking technology as an indirect instruction tool to improve text and picture processing and learning. Br. J. Educ. Psychol. 2016, 47, 1083–1095. [Google Scholar] [CrossRef]
- Theeuwes, J. Top-down and bottom-up control of visual selection. Acta Psychol. 2010, 135, 77–99. [Google Scholar] [CrossRef] [PubMed]
- Franconeri, S.L.; Simons, D.J. Moving and looming stimuli capture attention. Percept. Psychophys. 2003, 65, 999–1010. [Google Scholar] [CrossRef]
- Yantis, S.; Jonides, J. Abrupt visual onsets and selective attention: Evidence from visual search. J. Exp. Psychol. Hum. Percept. Perform. 1984, 10, 601. [Google Scholar] [CrossRef]
- Underwood, G.; Chapman, P.; Brocklehurst, N.; Underwood, J.; Crundall, D. Visual attention while driving: Sequences of eye fixations made by experienced and novice drivers. Ergon. 2003, 46, 629–646. [Google Scholar] [CrossRef]
- Jarodzka, H.; Scheiter, K.; Gerjets, P.; Van Gog, T. In the eyes of the beholder: How experts and novices interpret dynamic stimuli. Learn. Instruct. 2010, 20, 146–154. [Google Scholar] [CrossRef]
- Grant, E.R.; Spivey, M.J. Eye movements and problem solving: Guiding attention guides thought. Psychol. Sci. 2003, 14, 462–466. [Google Scholar] [CrossRef] [PubMed]
- Canham, M.A. Effects of knowledge and display design on comprehension of complex graphics. Learn. Instruct. 2010, 22, 155–166. [Google Scholar] [CrossRef]
- Velichkovsky, B.M. Communicating attention: Gaze position transfer in cooperative problem solving. Pragmat. Cognit. 1995, 3, 199–223. [Google Scholar] [CrossRef]
- Bond, R.A. Assessing computerised eye tracking technology for gaining insight into expert interpretation of the 12-lead electrocardiogram: An objective quantitative approach. J. Electrocardiol. 2014, 47, 895–906. [Google Scholar] [CrossRef]
- McLaughlin, L.A. Computing eye gaze metrics for the automatic assessment of radiographer performance during X-ray image interpretation. Int. J. Med. Inform. 2017, 05, 11–21. [Google Scholar] [CrossRef]
- Mason, L.; Pluchino, P.; Tornatora, M.C. Eye-movement modeling of integrative reading of an illustrated text: Effects on processing and learning. Contemp. Educ. Psychol. 2015, 41, 172–187. [Google Scholar] [CrossRef]
- Scheiter, K.A. Self-regulated learning from illustrated text: Eye movement modelling to support use and regulation of cognitive processes during learning from multimedia. Br. J. Educ. Psychol. 2018, 88, 80–94. [Google Scholar] [CrossRef]
- Chabris, C.A. The Invisible Gorilla: And Other Ways Our Intuitions Deceive Us; Harmony: New York, NY, USA, 2010. [Google Scholar]
- Elkins, J. The Domain of Images; Cornell University Press: Ithaca, NY, USA, 2001. [Google Scholar]
- Zangemeister, W.A. Evidence for a global scanpath strategy in viewing abstract compared with realistic images. Neuropsychol. 1995, 33, 1009–1025. [Google Scholar] [CrossRef]
- Nodine, C.A. How do viewers look at artworks? Bull. Psychol. Arts 2003, 4, 65–68. [Google Scholar]
- Cela-Conde, C.J. The neural foundations of aesthetic appreciation. Prog. Neurobiol. 2011, 94, 39–48. [Google Scholar] [CrossRef] [PubMed]
- Arnheim, R. Entropy and Art: An Essay on Disorder and Order; Univ of California Press: Berkeley, CA, USA, 1974. [Google Scholar]
- Yarbus, A.L. Eye Movements and Vision; Springer: Berlin/Heidelberg, Germany, 2013. [Google Scholar]
© 2020 by the authors. Licensee MDPI, Basel, Switzerland. This article is an open access article distributed under the terms and conditions of the Creative Commons Attribution (CC BY) license (http://creativecommons.org/licenses/by/4.0/).