Article

Spanish Adaptation of Motivational Climate in Education Scale with University Students

by
Antonio Granero-Gallegos
and
María Carrasco-Poyatos
*
Department of Education, Faculty of Education Sciences, Health Research Center, University of Almeria, 04120 Almeria, Spain
*
Author to whom correspondence should be addressed.
Educ. Sci. 2020, 10(6), 157; https://doi.org/10.3390/educsci10060157
Submission received: 23 May 2020 / Revised: 3 June 2020 / Accepted: 7 June 2020 / Published: 9 June 2020
(This article belongs to the Special Issue New Research and Trends in Higher Education)

Abstract

:
The aim of this study was to provide evidence of the validity and reliability of the dimensionality of the Spanish adaptation of two correlated subscales to assess motivational climate in the university education context: Mastery motivational climate and performance motivational climate. Two different studies with cross-sectional design and different samples of university students were used to accomplish this research (Study 1: 181 students, mean age = 20.83, SD = 1.76; Study 2: 354 students, mean age = 21.84; SD = 1.98). In Study 1, Exploratory Structural Equation Modeling, Confirmatory Factor Analysis (CFA), and reliability analysis of the scale were conducted. In Study 2, CFA, reliability analysis, discriminant validity, temporal stability, factorial invariance across gender, and nomological validity were managed through a regression model measuring the relationships between democratic and autocratic behavior, mastery climate, and performance climate. The final version of the Motivational Climate in Education Scale showed acceptable goodness of fit and values of discriminant validity, reliability, temporal stability, and invariance across gender. According to its nomological validity, democratic behavior was shown to be a statistically significant predictor of mastery climate, and the teacher’s autocratic behavior was shown to be a statistically significant predictor of performance climate. This scale is a valid and reliable instrument to assess mastery climate and performance climate in the Spanish university educational context.

1. Introduction

In recent years, various studies have shown that teaching style could affect motivation during the students’ training process [1,2,3] and, in addition, as other authors state [4], decades of research confirm that one of the keys to determining the quality of the students’ experience is the motivational climate created by teachers in their classes. The relationship between dispositional and environmental factors has been demonstrated, such as the motivational climate created by other people (e.g., the teacher) [5], with different academic variables: Motivation [6,7], the perception of competence and autonomy [8,9], school commitment [10], adolescent adjustment [11], academic achievement [12], or academic performance [13]. For this reason, the role of the teacher is recognized amongst these environmental factors [14], and the motivational climate that their role generates is so important that some authors emphasize that it may be responsible for the students’ academic success or failure [15].
The Achievement Goal Theory (AGT) [14,16,17], framed within the cognitive–social theories from an interactional perspective, has also developed research in the educational field. This theory starts from the basic idea that people are intentional organisms directed by our objectives, and that we rationally act according to them. In achievement settings, such as the educational environment, the main objective is to show competence [14]. These achievement goals are related to motivational patterns of adaptation and maladjustment, and constitute the main mechanism for determining whether success or, conversely, failure results [14,16]. The classroom motivational climate is assumed to affect individual outcomes through the student’s individual achievement goal, which is established according to the surrounding goal climate [18].
According to the AGT theory, two motivational climates predominate in the social contexts of achievement situations, such as classes in the educational environment: The mastery climate (also the task-involving motivational climate) and/or the performance climate (the ego-involving motivational climate) [19,20,21]. An ego-involving motivational climate is associated with performance and with normative standards, and judges a student’s performance compared to that of others in the class [22]. Both teachers and students tend to adopt ability-demonstration goals, and this is associated with boredom, minimal effort, negative classroom experiences, and lack of teacher support [23,24,25]. On the other hand, this motivational theory argues that, in social contexts promoting involvement in learning and mastery (i.e., task-involving), the teacher values cooperation, effort, and improvement, which favor cognitive, affective, and adaptive behavioral responses on the part of the students [26]. The perception of this mastery climate is focused on personal improvement and achievement, and is based on the belief that success comes from work and perseverance [22]. Student achievement has been shown to be more effective when teachers strive to create a climate of learning and mastery rather than when they are more concerned with avoiding failure or demonstrating ability [27,28,29].
The motivational classroom climate generated by the teacher has been widely studied in different educational contexts, especially in primary [8,30] and secondary education [9,31,32,33]. Some studies have also been carried out in the university context [34,35].
Although several scales have been used to measure the classroom motivational climate in the Spanish non-university educational context, such as the Learning and Performance Orientations in Physical Education Classes Questionnaire [36] or the Classroom Motivational Climate Questionnaire [37], no scale has been adapted to measure the motivational climate generated by the teacher in university classrooms. It should be noted that the Motivational Orientation and Climate Scale [34] from the original Norwegian version of the Perception of Success Questionnaire [38] has recently been validated in Spanish (from the Dominican Republic, Latin America) [34]; this measures both the orientation and the motivational climate. However, despite the importance of studying the motivational climate and the influence on various variables at the academic level, a scale that specifically measures the university student’s perception of the mastery climate (i.e., task-involving) and the performance climate (i.e., ego-involving) has not been validated in the Spanish educative context. This is the present work’s main contribution to the international literature, since it is intended to adapt and validate a scale that allows one to specifically measure these two variables in Spanish classrooms, including university classrooms.
For all of the above, two different studies have been proposed, in which it is hypothesized that the factorial structure of two perceived motivational climate subscales will show adequate goodness of fit, and that the two factors will negatively correlate. Furthermore, the teacher’s democratic behavior is expected to be a predictor of the mastery climate, while the teacher’s autocratic behavior is expected to be a predictor of the performance climate. Therefore, the objective of the present study is to provide evidence of reliability and validity for the dimensionality of two correlated subscales from the Spanish version, measuring the motivational climate in university education. The “Strengthening the Reporting of Observational Studies in Epidemiology” (STROBE) initiative [39] was used for the descriptions of Study 1 and Study 2.

2. Study 1

2.1. Materials and Methods

2.1.1. Study Design

This is an observational, descriptive, cross-sectional, and non-randomized study. Spanish university students from the University of Almeria (Spain) participated in the first study. The data were collected during the first semester of the 2019/2020 course. The inclusion criterion to participate in the research was to be a graduate student in a presential university course. The exclusion criteria were: (i) Not giving consent for the use of the data in research and (ii) not completely filling out the data collection form.

2.1.2. Outcomes and Instruments

Motivational Climate in Education: In order to assess the motivational climate in educative classrooms, two dimensions that assess motivational climate perceptions were selected from the Norwegian version of the Perception of Success Questionnaire [38]. These two dimensions are made up of seven items and measure the motivational climate perceived by university students in class. The mastery motivational climate dimension (four items) implies that students are encouraged to improve their skills in relation to their own achievement level (e.g., “the teacher expects us to learn new skills and gain new knowledge”), while the performance motivational climate dimension (three items) stimulates competitiveness and social comparison (e.g., “students are encouraged to outperform others”). For the responses, a Likert scale was used from 1 (strongly disagree) to 5 (strongly agree).

2.1.3. Procedure

Firstly, the items from the two subscales of the Motivational Orientation and Climate Scale (MOC)—mastery motivational climate and performance motivational climate [38]—were translated using back translation [40]. Two translators translated the seven items into Spanish. Subsequently, two further translators proceeded to translate the items back into their original language (back translation). To judge the accuracy of the translation, the degree of coincidence with the original version was considered. The final version obtained was analyzed by a group of four education experts [41] to guarantee the items’ adequate design in the construct measure, which was intended to measure and maintain the original meaning [40]. The experts evaluated the relevance and understanding of each item on a scale from 1 (strongly disagree) to 4 (strongly agree). If the mean item scores were <2.5, they were reviewed. If an item was not classified by at least three of the four experts within the theoretical dimensions of the scale, it was reviewed again. The global agreement of four experts on the relevance and understanding of the items was measured with the Intraclass Correlation Coefficient (ICC), using a mixed effects model and assuming an absolute agreement definition; the values obtained were: ICC = 0.85 for relevance and ICC = 0.92 for understanding. The Spanish version was administered to 45 higher education students between the ages of 18 and 30, all of whom expressed full understanding of the items. Thus, the final version of the Spanish Motivation Climate in Education Scale (MCES) was obtained.
Subsequently, the professors and those in charge at the education faculty were contacted asking for their collaboration and to give information regarding the purpose of the research. Students were informed by email to participate in the study. The instrument was finally administered via an online form, in which the importance of the research and how to complete the scale were briefly explained, as well as informing participants that they could leave the study at any time. All subjects gave their informed consent to be included before participating in the study. The study was conducted in accordance with the Helsinki Declaration, and the protocol was approved by the Bioethics Committee at the University of Almeria.

2.1.4. Risk of Bias Assessment

In terms of bias control, it should be noted that there was no sample randomization since convenience sampling was followed. However, there was blinding between the participants and the researchers in charge of data treatment and analysis. Regarding selection bias, it was indicated that participation in the study was voluntary and the communication with students was by email.

2.1.5. Sample Size

Regarding the sample size (n = 181), the provisions set by Carretero-Dios and Pérez [42] were complied with in relation to the preliminary study of the items for scale validation: Between 50 and 100 participants with characteristics similar to those of the population, and between 5 and 10 participants for each item on the scale. According to the mean standard deviation established in a previous study [38] (SD = 1.12, performance motivational climate; 0.80, mastery motivational climate) and an estimated error (d) of 0.17 (performance motivational climate) and 0.12 (mastery motivational climate), a valid sample size for a 95% confidence interval (CI) was between 167 and 171 (n = CI2 × d2/SD2). A total of 181 students completed the study.

2.1.6. Data Analysis

The factorial structure was evaluated using Exploratory Structural Equation Modeling (ESEM) and a Confirmatory Factor Analysis (CFA). After verifying each item of the factorial structure and obtaining a final model, a CFA was performed to verify the factorial structure of the ESEM. The factors were correlated taking into account that the data were collected from different classes or groups of students; to avoid the non-dependence of the observations, the Mplus cluster option and COMPLEX function were used. The ESEM model was estimated by considering the recommendations of Marsh, Morin, Parker, and Kaur [43] so that all of the rotated loadings were freely estimated, and the Geomin oblique rotation was chosen with an epsilon value of 0.5 in order to facilitate the subsequent comparison of the factorial structure obtained [44]. Furthermore, in the absence of a secondary factor loading of >0.32, primary factor loadings of >0.50 were considered adequate [45] to maintain an item in a factor. Standardized factorial loadings (λ) were reported.
The models (ESEM and CFA) were tested using the robust maximum likelihood estimation method for continuous variables (MLR) [46], and the evaluation of the models was based on the following goodness-of-fit indexes: χ2/df ratio values, the Comparative Fit Index (CFI), the Tucker–Lewis Index (TLI), the Root Mean Square Error of Approximation (RMSEA) with its 90% confidence interval (CI), and the Standardized Root Mean Square Residual (SRMR). For the χ2/df ratio, values <2.0 or <5.0 were considered excellent [47] or acceptable [48], respectively, <0.95 or between 0.90 and 0.95 (CFI and TLI), below 0.06 or 0.10 (RMSEA), respectively, indicating an excellent or marginally acceptable fit [49], and SRMR values <0.08 [48]. The descriptive statistics were calculated with SPSS 24.0, and the rest of the models (ESEM and CFA) were performed with Mplus 7.0.
The reliability of the scale was evaluated using different parameters: Composite reliability using McDonald’s ω [50], Average Variance Extracted (AVE) [51], and Cronbach’s alpha (α). Compared with the values traditionally used to assess reliability, such as α, the ω has the advantage of considering the strength of association between the items and the constructs, as well as the measurement errors specific to each item [52]. Reliability values >0.70 were considered acceptable. In addition, a temporal stability analysis was performed using the ICC and its 95% CI, considering values ≥0.70 as being adequate [53].

2.2. Results

2.2.1. Participants

A total of 181 university students participated, aged between 19 and 25 years old (M = 20.83; SD = 1.76). Of these, 76.2% were male. A further 19 students did not give their consent to participate in the data collection, so they were not included in the study. The data were collected in December 2019. There were no missing values in the data of the included sample.

2.2.2. Exploratory Structural Equation Modeling

The descriptive statistics of the items and the ESEM results are shown in Table 1. The ESEM (i.e., the preliminary exploratory analysis) verified the factorial structure of the MCES in two factors. The ESEM results showed high primary factorial loadings (>0.67) and secondary factorial loadings below 0.04. The two factors were made up of seven items—four items in factor 1 (F1) and three items in factor 2 (F2); they showed the following goodness of fit: χ2/df = 1.00, p = 0.288; CFI = 0.99; TLI = 0.99; RMSEA = 0.034 (90% CI = 0.000; 0.098), SRMR = 0.014 (Table 1).

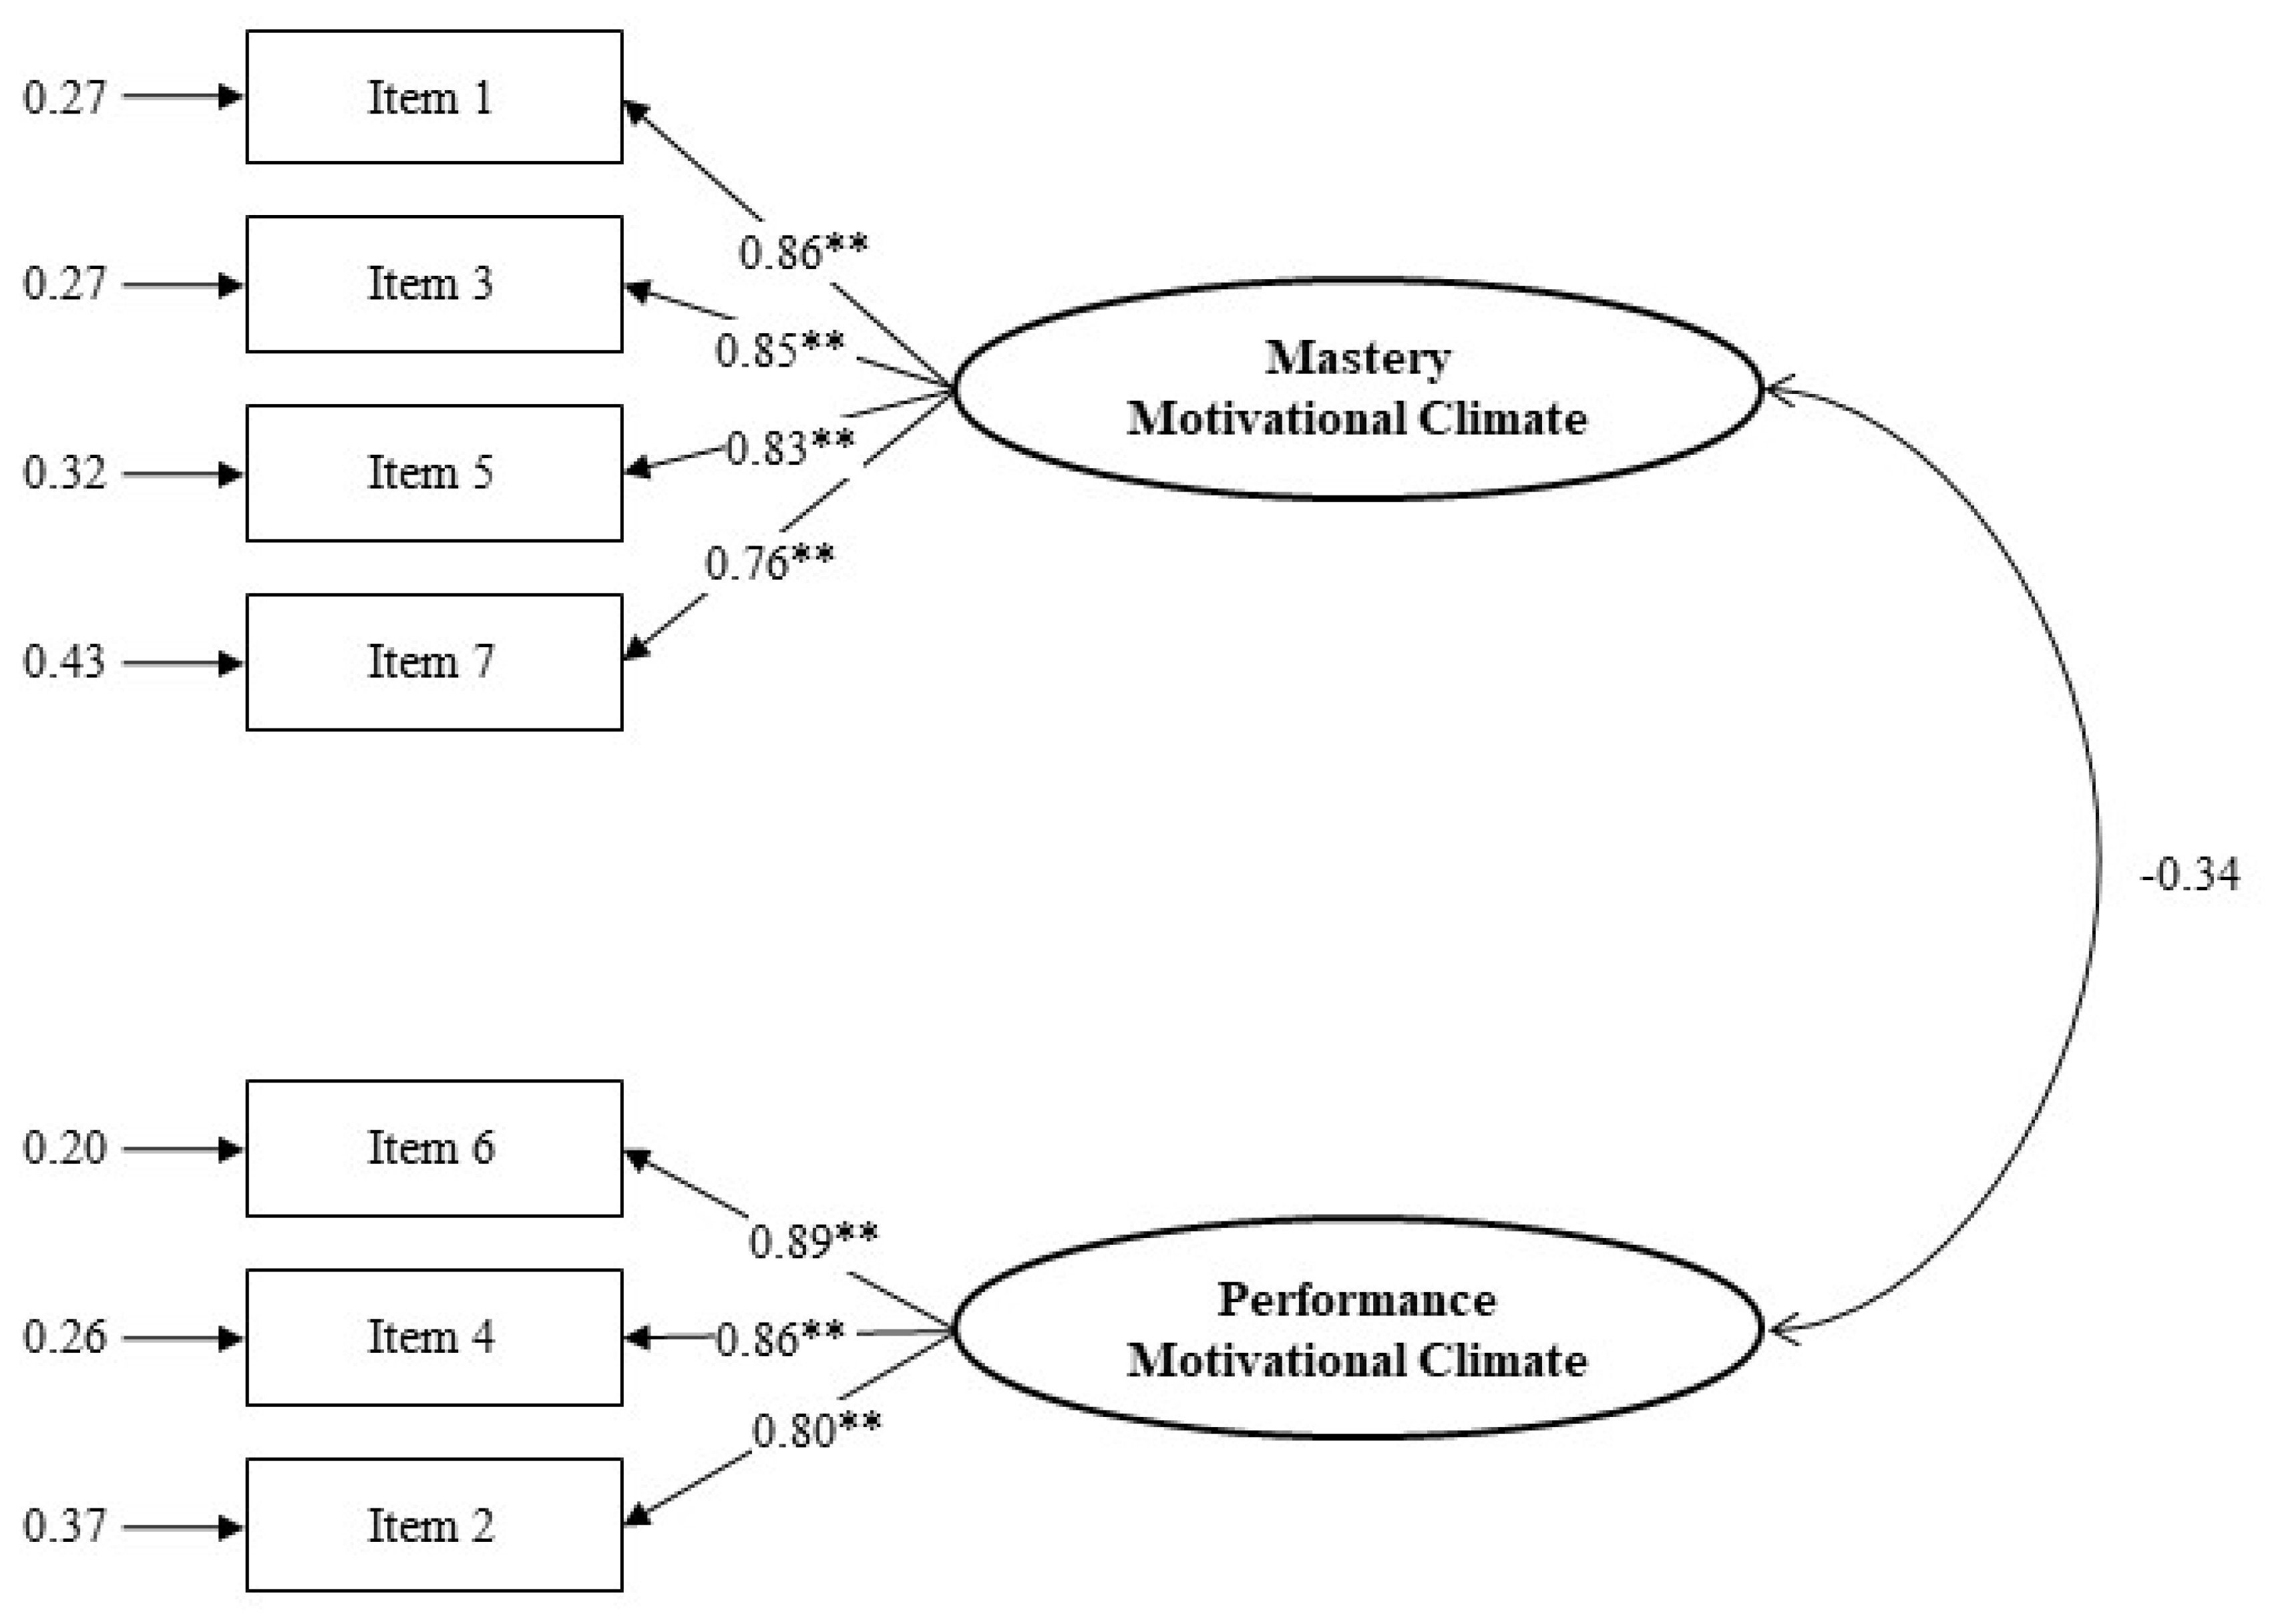
2.2.3. Confirmatory Factor Analysis

Next, a CFA was performed with the seven-item model consisting of two correlated factors (Table 2). The model’s goodness-of-fit indices were excellent: χ2/df = 2.00, p = 0.023; CFI = 0.978; TLI = 0.965; RMSEA = 0.071 (90% CI = 0.026; 0.113), SRMR = 0.053. The standardized factorial loadings of the CFA can be verified in Table 1. Likewise, the reliability values were as follows: The mastery motivational climate (F1)—ω = 0.89, α = 0.88, and AVE = 0.65; the performance motivational climate (F2)—ω = 0.87, α = 0.87, and AVE = 0.70.

3. Study 2

3.1. Materials and Methods

3.1.1. Study Design

This is an observational, descriptive, cross-sectional, and non-randomized study. Spanish university students from the University of Almeria (Spain) participated in this second study, but were from different courses from those in Study 1. The data were collected during the second semester of the 2019/2020 course. The inclusion criterion was to be a graduate student of a presential-mode university degree. The exclusion criteria were: (i) Not giving consent for the use of data in research, (ii) not completely filling out the data collection form, and (iii) having participated in Study 1.

3.1.2. Outcomes and Instruments

Motivational Climate: The MCES version used was the same as in Study 1.
The Scale of Democratic Behavior and Autocratic Behavior (ECDA): The Democratic Behavior (e.g., “encourages students to make suggestions on how to give classes”) and Autocratic Behavior (e.g., “presents their ideas in a forceful way”) subscales were used; they were validated in the Spanish university context [54] and were derived from the original Leadership Scale for Physical Education [55]. Each factor is represented by three items that are answered using a Likert-type scale from 1 (never) to 5 (always). In the present study, this scale showed an excellent goodness of fit: χ2/df = 1.34, p = 0.220; CFI = 0.99; TLI = 0.99; RMSEA = 0.031 (90% CI = 0.000, 0.074), SRMR = 0.02. Reliability: Democratic behavior—ω = 0.76, α = 0.85; AVE = 0.56; autocratic behavior—ω = 0.76, α = 0.78; AVE = 0.52.

3.1.3. Procedure

The professors and those in charge of the education faculty were contacted to request collaboration and to report on the purpose of the investigation. The education students were asked by email to participate in the study. The instrument was finally administered via an online form, in which the importance of the research and how to complete the scale were briefly explained, as well as informing participants that they could leave the study at any time. All subjects gave their informed consent to be included before participating in the study. The study was conducted in accordance with the Helsinki Declaration, and the protocol was approved by the Bioethics Committee at the University of Almeria.

3.1.4. Risk of Bias Assessment

Related to risk of bias, in this second study, it should be noted that there was no sample randomization, since convenience sampling was followed. Despite this, there was blinding between the participants and the researchers in charge of data treatment and analysis. Regarding selection bias, it was indicated that participation in the study was voluntary, and the communication with students was by email.

3.1.5. Sample Size

With the total sample (n = 354), the confirmatory analysis requirements [42] of 10 participants for each item on the scale were met. For the nomological validity analysis, an a priori power analysis conducted using the Free Statistics Calculator v.4.0 software [56] indicated that a minimum sample size of 166 would be sufficient for the model structure to detect small effect sizes (i.e., f2 = 0.10) with a power level of 0.95 and a two-tailed significance level of α = 0.05 in a structural equation model (SEM) with four latent variables and thirteen observed variables. A total of 354 students completed the study.

3.1.6. Data Analysis

The descriptive statistics and correlations were calculated with SPSS 24 (IBM, Chicago, IL, USA). The CFA model to verify the factorial structure of the MCES from Study 1 was calculated with Mplus 7.0 [57]; hence, the two factors were correlated: Task-involving climate (items 1, 3, 5, 7) and performance-involving climate (items 2, 4, 6). Insomuch as the data were collected from different classrooms, and to avoid the likely non-independence of the observations, the cluster option and the COMPLEX function of Mplus were used. Standardized factor loadings (λ) were reported. The model (CFA) was tested employing the MLR estimation method [46]. The same combination of fit indices was used as in Study 1 in order to check the model’s goodness of fit (χ2/df, CFI, TLI, RMSEA, SRMR). Scale score reliability estimates were also computed using three parameters: ω for composite reliability [50], AVE [51], and α. In addition, a temporal stability analysis was performed using the ICC and its 95% CI, considering values ≥0.70 to be adequate [53]. To obtain evidence supporting the discriminant validity of the constructs, the heterotrait–monotrait ratio (HTMT) of the correlations between factors was obtained, and values <0.85 were considered adequate [58]. The MCES invariance was tested across sex, employing the MLR estimation. Four progressively more restrictive models were run for each of the two factors: (1) Configural invariance, (2) weak invariance (i.e., invariance of the factor loadings/cross-loadings), (3) strong measurement (i.e., invariance of the factor loadings/cross-loadings and intercepts), and (4) strict invariance (i.e., invariance of the factor loadings/cross-loadings, intercepts, and residual variances). In regards to the measurement invariance, the nested models were compared taking into account the changes (Δ) in the goodness-of-fit indices (i.e., increases in RMSEA of at least 0.015 or decreases in CFI and TLI of at least 0.010 indicated a lack of invariance) [59]. To provide evidence of nomological validity, we conducted regression model analysis (direct effects) between factors of democratic behavior and autocratic behavior (latent variables) on mastery motivational climate and performance motivational climate (latent variables).

3.2. Results

3.2.1. Participants

The participants were 354 university students (59.6% male) from Education Sciences, aged between 19 and 29 years old (M = 21.84; SD = 1.98) from the University of Almeria, Spain. The participants were different from those in Study 1. In the data collected (January–February 2020), there were no missing values from the total sample. Apart from the total sample, twelve questionnaires were discarded because they were incomplete, and seven people did not consent to participate in this study.

3.2.2. Structure and Reliability Factor

Table 3 shows the descriptive statistics and correlations of the MCES items. The standardized factor loadings of the four items for the task motivational climate (F1) and the three items for the performance motivational climate (F2) of the MCES are shown in Figure 1. The seven-item model with CFA achieved an acceptable fit, as demonstrated by the goodness-of-fit values: χ2/df = 4.00, p < 0.0001; CFI = 0.967; TLI = 0.946; RMSEA = 0.082 (90% CI = 0.067, 0.119), SRMR = 0.044. The reliability analyses showed the following values: Mastery motivational climate: ω = 0.90, α = 0.89, AVE = 0.68; performance motivational climate: ω = 0.89, α = 0.89, AVE = 0.72. The temporal stability analysis was evaluated using the ICC for the two factors, with values obtained >0.82, for which the instrument was administered to an independent sample on two occasions with an interval of four weeks between the two data collections. Regarding the discriminant validity, the value of the HTMT proportion in the correlation between the different dimensions was <0.85 [58].

3.2.3. Measurement Invariance

The invariance according to gender (i.e., male = 211, female = 143) of the MCES was evaluated based on the CFA model, the results of which are shown in Table 4. Starting with a configural invariance (M0) model, invariance constraints were progressively added to the loading factors (i.e., weak invariance, M1), intercepts (i.e., strong invariance, M2), and residual variances (i.e., strict invariance). The values of these restrictive models were acceptable, except for the strict invariance, since the results were outside the cut-off values in the CFI. The weak and strong configural invariance models did not exceed the recommendations for RMSEA (Δ > 0.015), CFI (Δ > 0.01), and TLI (Δ > 0.01), but, as can be seen in Table 4, the strict invariance showed a decrease that slightly exceeded the limits of the recommended values (ΔCFI = 0.013). However, the RMSEA and TLI values did not exceed the MCES recommended limits for invariance by gender in university students.

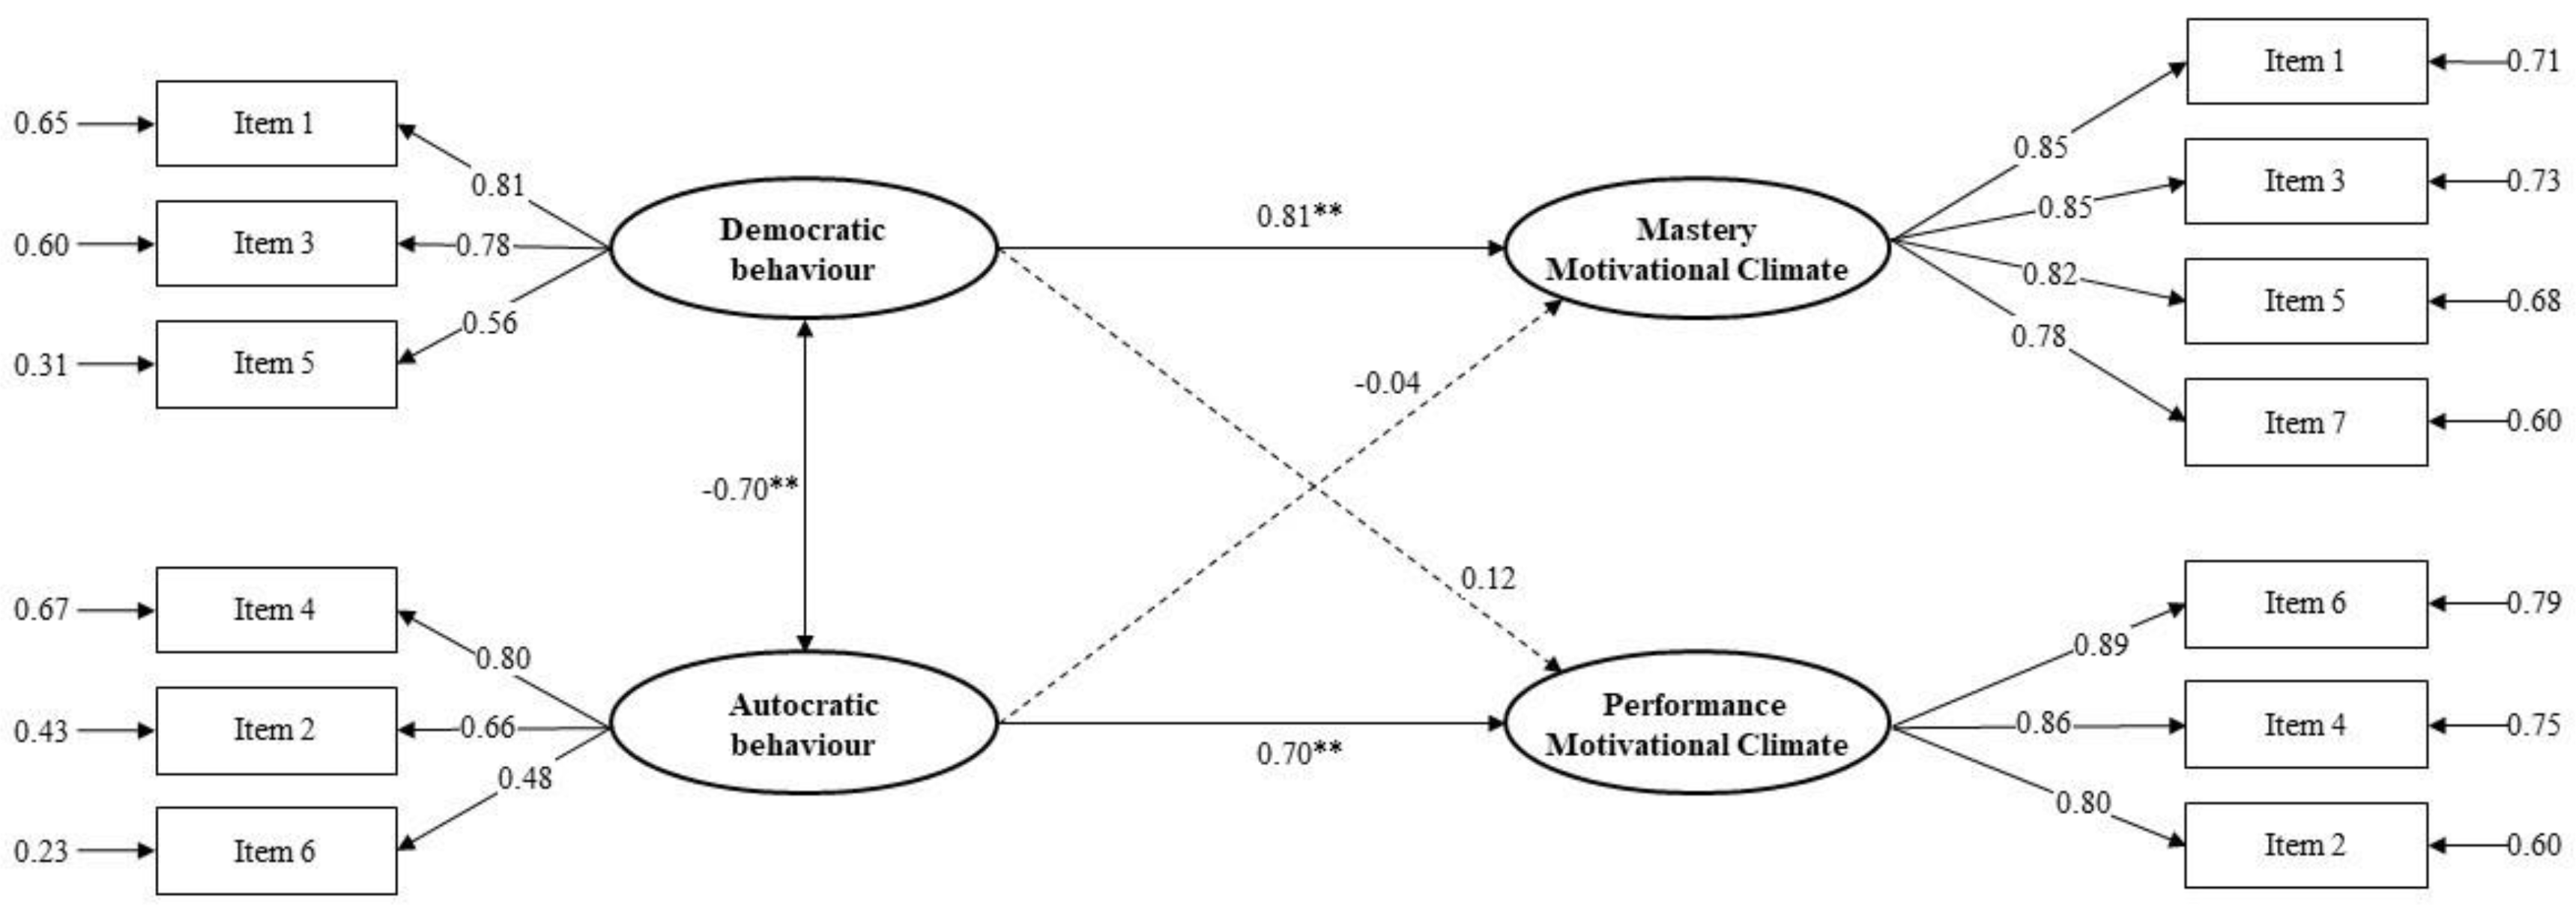
3.2.4. Nomological Validity

The regression model (SEM) was performed with the bootstrapping technique (5000 samplings) because the Mardia coefficient presented a high value (18.78). Thirteen observed variables and four latent variables were introduced into the analysis. The results of the regression model estimated sample demonstrated a good fit with the data: χ2/df = 2.89, p < 0.001; CFI = 0.954; TLI = 0.954; RMSEA = 0.073 (90% CI = 0.061, 0.086), SRMR = 0.048. The factor loadings of the indicators across all of the model’s latent variables ranged between 0.48 and 0.89. In our model (see Figure 2), the direct relationships between democratic behavior and the performance motivational climate were not significant, nor were the relationships between autocratic behavior and the mastery motivational climate. Table 5 also presents the point estimates as well as the bias-corrected bootstrapped 95% confidence intervals for the mediated effects. A significant positive relationship and high effect size was found between democratic behavior and the mastery motivational climate (β = 0.81), and between autocratic behavior and the performance motivational climate (β = 0.70). The model accounted for 70% of the variance in the mastery motivational climate and 38% of the variance in the performance motivational climate.

4. Discussion

The objective of this study was to provide psychometric evidence on the dimensionality of the Spanish version of two correlated subscales of the MOC [38] in order to measure the perceived motivational climate with higher education students (MCES). Through the psychometric analysis of the scale of two factors correlated by two different studies, the final version of the MCES shows adequate levels of factor validity, discriminant validity, reliability, and temporal stability, as well as gender-based invariance. Thus, the first hypothesis is fulfilled. Furthermore, for nomological validity, democratic behavior was shown as a predictor of the mastery motivational climate, whereas the teacher’s autocratic behavior was shown as a predictor of the performance motivational climate. Accordingly, the second hypothesis posed in this study is also fulfilled.
The present work focused on validating the two motivational climate factors (i.e., mastery and performance) of the original Stornes and Bru scale [38] for use in education. Like other validated scales for measuring the motivational climate in other contexts [36,60,61], a factorial structure with only these two correlated factors has been used. The adaptation of this scale to the educational context with university students has presented adequate values for the goodness-of-fit indices of the CFA. The original Stornes and Bru scale [38] also presented adequate goodness-of-fit indices at the psychometric level, but with four factors. In this regard, it should be noted that the four-factor original by Stornes and Bru [38] has recently been validated in Portuguese and Latin American Spanish (The Dominican Republic) by Gutiérrez, Tomás, Gómez, and Moll [62] to measure the orientation and the motivational climate in students from 14 to 18 years of age, and that, in general, it has presented adequate psychometric fits, both in the Portuguese version with the Angolan population and in the version with the Dominican Republic population. Likewise, Gutiérrez and Tomás [34] adapted this four-factor scale to the university population in the Dominican Republic, although this validation presents some indices below the acceptable value, such as the TLI value and the χ2/df ratio.
Regarding reliability, the results of the present study demonstrate the high reliability of the two motivational climate dimensions, with values for α and composite reliability (ω) >0.86. In the study by Stornes and Bru [38], the α values for these two factors showed adequate reliability with scores >0.70; on the other hand, in the Dominican Republic university education version by Gutiérrez and Tomás [34], both the mastery climate factor and the performance climate factor presented α values <0.70, although the composite reliability values were adequate (>0.70). In the aforementioned adaptation by Gutiérrez and Tomás [34], the performance climate also presented α values below 0.70 in both the Angolan and Dominican Republic student samples, and the mastery climate achieved α values of <0.70 in the Angolan sample.
For the AVE values, the present study showed adequate indices in the two dimensions of the motivational climate with values >0.67, taking into account that the cut-off for the minimum acceptable values is >0.50 [53]. The scale also demonstrated adequate temporal stability. These are notable contributions made by this research to the literature, since none of the cited versions of this scale [34,38,62] show AVE values for these factors or a temporal stability analysis for the scale. In relation to the discriminant validity, it should be pointed out that an analysis using the HTMT ratio has also been performed in the present study, showing adequate values. The other cited studies do not conduct this HTMT analysis, although the correlation found between the mastery climate and performance climate was negative.
In relation to the analysis of invariance by gender, the scale is invariant at the configural level—weak and strong—although not in the strict invariance model. In the other four-factor versions of this scale, no factor invariance by gender analysis has been shown, although Gutiérrez et al. [62] presented invariance by country.
Regarding the relationship of the two motivational climate dimensions with teacher leadership, the results show coherence with the previous literature, given that democratic behavior is predictive of the mastery motivational climate, while autocratic behavior is predictive of the performance motivational climate. These results are in line with previous studies, such as that by Mohammadzade, Zardoshtian, and Hossini [63], which demonstrated the positive predictive relationship between autocratic behaviors by the coach and the performance climate, whereas this relationship was not significant between democratic behaviors and the performance climate. Likewise, Alfermann, Lee, and Würth [64] (in athletes) and Bekiari [65] (in students) found a high and positive correlation between the teacher’s democratic behavior and the motivational climate towards mastery, while the relationship between the teacher’s autocratic behavior and the motivational climate towards performance was also positive and significant. Authors such as Barić and Bucik [66] and Smith, Fry, Ethington, and Li [67] (in athletes) and Habibullah and Sinha [68] (in the business environment) also highlighted the positive and significant relationships between democratic behavior and the mastery climate and between authoritarian behavior and the performance climate.
Despite the strengths and relevant results in relation to the psychometric properties of the MCES, this study also presents certain limitations that must be pointed out. First, the sample was selected according to convenience, not randomly, so the results obtained cannot be generalized. Second, the sample analyzed was made up of university students from a single university. Future research should examine the psychometry of this scale in students belonging to different educational levels (i.e., primary or secondary education) and other universities to determine if the factorial structure remains invariant based on this variable.

5. Conclusions

The Motivational Climate in Education Scale constitutes a valid and reliable instrument for evaluating the mastery motivational climate and the performance motivational climate during the teaching–learning process in the Spanish educational context. This two-correlated-factor version of the instrument presents a better fit than the four-factor scale (including the dispositional orientation and the motivational climate), and could contribute to more deeply analyzing the influence of the motivational climate generated by the teacher on the motivation, commitment, and academic achievement of students within their training process. These aspects are interesting from the teaching point of view, since a well-channeled motivational climate (i.e., mastery climate) based on work, consistency, improvement, and self-improvement could contribute to a greater teaching efficiency and favor students’ cognitive, affective, and behavioral responses.

Author Contributions

Conceptualization, A.G.-G.; data curation, M.C.-P.; formal analysis, A.G.-G.; investigation, A.G.-G. and M.C.-P.; methodology, A.G.-G.; project administration, A.G.-G. and M.C.-P.; writing—original draft, A.G.-G. and M.C.-P.; writing—review and editing, A.G.-G. and M.C.-P. All authors have read and agreed to the published version of the manuscript.

Funding

This research received no external funding.

Acknowledgments

This work was carried out with the aid received from the call of Grupos Docentes de Innovación y Buenas Prácticas, University of Almeria; biennium 2020–2021 [Project: Metodologías activas y aprendizaje competencial en educación superior (Active methodologies and competency learning in higher education)].

Conflicts of Interest

The authors declare no conflict of interest.

References

  1. Reeve, J. Teachers as Facilitators: What Teachers Do and Why Their Students Benefit. Elem. Sch. J. 2006, 106, 225–236. [Google Scholar] [CrossRef] [Green Version]
  2. Watt, H.M.G.; Richardson, P.W.; Smith, K. Why Teach? How Teachers’ Motivations Matter around the World. In Global Perspectives on Teacher Motivation, 1st ed.; Watt, H.M.G., Richardson, P.W., Smith, K., Eds.; Cambridge University Press: Cambridge, UK, 2018; pp. 1–21. [Google Scholar]
  3. Weiss, M.R.; Phillips, A.C. Motivation in Youth Sport and Physical Activity: Developmental Perspectives. In International Encyclopedia of the Social & Behavioral Sciences, 2nd ed.; Wright, J.D., Ed.; Elsevier: Amsterdam, The Netherlands, 2015; pp. 914–920. [Google Scholar] [CrossRef]
  4. Duda, J.L.; Papaioannou, A.G.; Appleton, P.R.; Quested, E.; Krommidas, C. Creating adaptive motivational climates in sport and physical education. In Routledge Companion to Sport and Exercise Psychology; Routledge: London, UK, 2014; pp. 544–558. Available online: http://hdl.handle.net/20.500.11937/63378 (accessed on 23 April 2020).
  5. Harwood, C. Doing Sport Psychology? Critical Reflections of a Scientist-Practitioner. In Sport and Exercise Psychology Research; Raab, M., Wylleman, P., Seiler, R., Elbe, A.M., Hatzigeorgiadi, A., Eds.; Elsevier Inc.: London, UK, 2016; pp. 229–249. [Google Scholar] [CrossRef]
  6. Froiland, J.M.; Worrel, F.C. Longitudinal prediction of 1st and 2nd grade English oral reading fluency in ELL. Psychol. Sch. 2016, 53, 274–283. [Google Scholar] [CrossRef]
  7. Granero-Gallegos, A.; Baena-Extremera, A. Predicción de la motivación autodeterminada según las orientaciones de meta y el clima motivacional en Educación Física. Retos 2008, 26, 501–516. (In Spanish) [Google Scholar]
  8. Cox, A.; Williams, L. The roles of perceived teacher support, motivational climate, and psychological need satisfaction in students’ physical education motivation. J. Sport Exerc. Psychol. 2008, 30, 222–239. [Google Scholar] [CrossRef] [Green Version]
  9. Weeldenburg, G.; Borghouts, L.B.; Slingerland, M.; Vos, S. Similar but different: Profiling secondary school students based on their perceived motivational climate and psychological need-based experiences in physical education. PLoS ONE 2020, 15, 1–17. [Google Scholar] [CrossRef]
  10. Fonsêca, P.N.; Lopes, B.J.; Palitot, R.M.; Estanislau, A.M.; Couto, R.N.; Coelho, G.L.H. Engajamento escolar: Explicação a partir dos valores humanos. Psicol. Esc. Educ. 2016, 20, 611–620. [Google Scholar] [CrossRef] [Green Version]
  11. Travers, L.V.; Bohnert, A.M.; Randall, E.T. Brief report: Adolescent adjustment in affluent communities: The role of motivational climate and goal orientation. J. Adolesc. 2013, 36, 423–428. [Google Scholar] [CrossRef]
  12. Skaalvik, E.M.; Federici, R.A. Relations between classroom goal structures and students’ goal orientations in mathematics classes: When is a mastery goal structure adaptive? Soc. Psychol. Educ. 2016, 19, 135–150. [Google Scholar] [CrossRef]
  13. Sevil, J.; Aibar, A.; Abós, Á.; García-González, L. El clima motivacional del docente de Educación Física: ¿Puede afectar a las calificaciones del alumnado? Retos 2017, 31, 94–97. [Google Scholar]
  14. Nicholls, J.G. The Competitive Ethos and Democratic Education; Harvard University Press: Cambridge, MA, USA, 1989. [Google Scholar]
  15. Ntoumanis, N.; Biddle, S.J.H. A review of motivational climate in physical activity. J. Sports Sci. 1999, 17, 643–665. [Google Scholar] [CrossRef]
  16. Ames, C. Achievement goals, motivational climate and motivational processes. In Motivational in Sport and Exercise; Roberts, G.C., Ed.; Human Kinetics: Champaign, IL, USA, 1992; pp. 161–176. [Google Scholar]
  17. Nicholls, J.G. Achievement motivation: Conceptions of ability, subjective experience, task choice, and performance. Psychol. Rev. 1984, 91, 328–346. [Google Scholar] [CrossRef]
  18. Jaitner, D.; Rinas, R.; Becker, C.; Niermann, C.; Breithecker, J.; Mess, F. Supporting Subject Justification by Educational Psychology: A Systematic Review of Achievement Goal Motivation in School Physical Education. Front. Educ. 2019, 4, 70. [Google Scholar] [CrossRef] [Green Version]
  19. Walling, M.D.; Duda, J.L. Goals and Their Associations with Beliefs about Success in and Perceptions of the Purposes of Physical Education. J. Teach. Phys. Educ. 2016, 14, 140–156. [Google Scholar] [CrossRef]
  20. Wang, C.K.J.; Biddle, S.T.H.; Elliot, A.J. The 2 × 2 achievement goal framework in a physical education context. Psychol. Sport Exerc. 2007, 8, 147–168. [Google Scholar] [CrossRef]
  21. Xiang, P.; Lee, A. The development of self-perceptions of ability and achievement goals and their relations in physical education. Res. Q. Exerc. Sport 1998, 69, 231–241. [Google Scholar] [CrossRef] [PubMed]
  22. Roberts, G.C.; Treasure, D.C.; Conroy, D.E. Understanding the dynamics of motivation in sport and physical activity. An achievement goal interpretation. In Handbook of Sport Psychology; New Tenenbaum, G., Eklund, R.C., Eds.; John Wiley and Sons: Hoboken, NJ, USA, 2007; pp. 3–24. [Google Scholar]
  23. Butler, R. Teachers’ achievement goal orientations and associations with teachers’ help seeking: Examination of a novel approach to teacher motivation. J. Educ. Psychol. 2007, 99, 241–252. [Google Scholar] [CrossRef]
  24. Butler, R.; Shibaz, L. Achievement goals for teaching as predictors of students’ perceptions of instructional practices and students’ help seeking and cheating. Learn. Instr. 2008, 18, 453–467. [Google Scholar] [CrossRef]
  25. Carpenter, P.J.; Morgan, K. Motivational Climate, Personal Goal Perspectives, and Cognitive and Affective Responses in Physical Education Classes. Eur. J. Phys. Educ. 1999, 4, 31–44. [Google Scholar] [CrossRef]
  26. Duda, J.L.; Balaguer, I. Coach-created motivational climate. In Social Psychology in Sport; Jowett, S., Lavallee, D., Eds.; Human Kinetics: Champaign, IL, USA, 2007; pp. 117–130. [Google Scholar]
  27. Baena-Extremera, A.; Gómez-López, M.; Granero-Gallegos, A.; Martínez-Molina, M. Modelo de predicción de la satisfacción y diversión en Educación Física a partir de la autonomía y el clima motivacional. Univ. Psychol. 2016, 15, 15–25. [Google Scholar] [CrossRef] [Green Version]
  28. Granero-Gallegos, A.; Gómez-López, M.; Abraldes, J.A.; Rodríguez-Suárez, N. Motives of practice in the field of non-competitive physical activity. Espiral 2011, 4, 15–22. [Google Scholar] [CrossRef] [Green Version]
  29. Ortiz-Camacho, M.M.; Granero-Gallegos, A.; Baños, R.; Baena-Extremera, A.; De Deus, H.L. The Relationship between Perceived Motivational Climate and 2 × 2 Achievement Goals with Self-Determined Motivation in Physical Education. Trav. Hum. 2017, 8, 1555–1564. [Google Scholar]
  30. Hastie, P.A.; Rudisill, M.E.; Boyd, K.; Johnson, J.L. Examining the Pathway to Motor Skill Competence in a Mastery Motivational Climate: An Appreciative Inquiry. Res. Q. Exerc. Sport 2019, 90, 259–269. [Google Scholar] [CrossRef] [PubMed]
  31. Alonso-Tapia, J.; Ruiz, M.A.; Huertas, J.A. Differences in classroom motivational climate: Causes, effects and implications for teacher education. A multilevel study. An. Psicol. 2019, 36, 122–133. [Google Scholar] [CrossRef] [Green Version]
  32. Baena-Extremera, A.; Granero-Gallegos, A.; Pérez-Quero, F.J.; Bracho-Amador, C.; Sánchez-Fuentes, J.A. Motivation and motivational climate as predictors of perceived importance of physical education in Spain. S. Afr. J. Res. Sport Phys. Educ. Recreat. 2013, 35, 1–13. [Google Scholar]
  33. Bortoli, L.; Bertollo, M.; Vitali, F.; Filho, E.; Robazza, C. The effects of motivational climate interventions on psychobiosocial states in high school physical education. Res. Q. Exerc. Sport 2015, 86, 196–204. [Google Scholar] [CrossRef] [Green Version]
  34. Gutiérrez, M.; Tomás, J.M. Motivational Class Climate, Motivation and Academic Success in University Students. Rev. Psicodidact. 2018, 23, 94–101. [Google Scholar] [CrossRef]
  35. Perlman, D.J.; Mckeen, K. Implementation of a motivational climate-classroom or physical education teachers: Examination of preservice teachers ability to implement a motivational climate within physical education Publication Details. Heal. Phys. Educ. 2012, 69, 29–35. Available online: http://ro.uow.edu.au/sspapers/241 (accessed on 15 March 2020).
  36. Cervelló, E.; Jiménez, R.; Fenoll, A.; Ramos, L.; Del Villar, F. A social-cognitive approach to the study of coeducation and discipline in Physical Education Classes. SOCIOTAM 2002, 11, 43–64. [Google Scholar]
  37. Alonso-Tapia, J.; Fernández, B. Development and initial validation of the Classroom Motivational Climate Questionnaire (CMCQ). Psicothema 2008, 20, 883–889. [Google Scholar]
  38. Stornes, T.; Bru, E. Perceived motivational climates and self-reported emotional and behavioural problems among Norwegian secondary school students. Sch. Psychol. Int. 2011, 32, 425–438. [Google Scholar] [CrossRef]
  39. Von Elm, E.; Altman, D.G.; Egger, M.; Pocock, S.J.; Gotzsche, P.C.; Vandenbroucke, J.P. The Strengthening the Reporting of Observational Studies in Epidemiology (STROBE) statement: Guidelines for reporting observational studies. Gac. Sanit. 2008, 22, 144–150. Available online: http://scielo.isciii.es/scielo.php?script=sci_arttext&pid=S0213-91112008000200011 (accessed on 15 March 2020). [CrossRef] [PubMed] [Green Version]
  40. Muñiz, J.; Elosua, P.; Hambleton, R.K. Directrices para la traducción y adaptación de los tests: Segunda edición. Psicothema 2013, 25, 151–157. [Google Scholar] [CrossRef] [PubMed] [Green Version]
  41. Lynn, M. Determination and quantification of content validity. Nurs. Res. 1986, 35, 382–385. [Google Scholar] [CrossRef] [PubMed]
  42. Carretero-Dios, H.; Pérez, C. Normas para el desarrollo y revisión de estudios instrumentales. Int. J. Clin. Health Psychol. 2005, 5, 521–551. [Google Scholar]
  43. Marsh, H.W.; Morin, A.J.S.; Parker, P.D.; Kaur, G. Exploratory Structural Equation Modeling: An Integration of the Best Features of Exploratory and Confirmatory Factor Analysis. Annu. Rev. Clin. Psychol 2014, 10, 85–110. [Google Scholar] [CrossRef] [Green Version]
  44. Schmitt, T.A.; Sass, D.A. Rotation criteria and hypothesis testing for exploratory factor analysis: Implications for factor pattern loadings and interfactor correlations. Educ. Psychol. Meas. 2011, 71, 95–113. [Google Scholar] [CrossRef]
  45. Costello, A.; Osborne, J.W. Denpasar Declaration on Population and Development. Pract. Assess. Res. Eval. 2005, 10, 1–9. [Google Scholar] [CrossRef]
  46. Li, C.H. Confirmatory factor analysis with ordinal data: Comparing robust maximum likelihood and diagonally weighted least squares. Behav. Res. Methods 2016, 48, 936–949. [Google Scholar] [CrossRef] [Green Version]
  47. Tabachnick, B.G.; Fidell, S.A. Using Multivariate Statistics, 5th ed.; Allyn and Bacon: Boston, MA, USA, 2007. [Google Scholar]
  48. Hu, L.T.; Bentler, P.M. Cutoff criteria for fit indexes in covariance structure analysis: Conventional criteria versus new alternatives. Struct. Equ. Model. 1999, 6, 1–55. [Google Scholar] [CrossRef]
  49. West, S.G.; Taylor, A.B.; Wu, W. Model fit and model selection in structural equation modeling. In Handbook of Structural Equation Modeling; Hoyle, R.H., Ed.; Guilford: New York, NY, USA, 2012; pp. 209–231. [Google Scholar]
  50. McDonald, R.P. the Theoretical Foundations of Principal Factor Analysis, Canonical Factor Analysis, and Alpha Factor Analysis. Br. J. Math. Stat. Psychol. 1970, 23, 1–21. [Google Scholar] [CrossRef]
  51. Fornell, C.; Larcker, D. Structural equation models with unobservable variables and measurement error: Algebra and statistics. J. Mark. Res. Adv. Methods Mark. Res. 1981, 18, 382–388. [Google Scholar] [CrossRef]
  52. Dunn, T.J.; Baguley, T.; Brunsden, V. From alpha to omega: A practical solution to the pervasive problem of internal consistency estimation. Br. J. Psychol. 2014, 105, 399–412. [Google Scholar] [CrossRef] [PubMed] [Green Version]
  53. Hair, J.F.; Black, W.C.; Babin, B.J.; Anderson, R.E.; Tatham, R.L. Multivariate Data Analysis, 7th ed.; Pearson Prentice Hall: New Tork, NJ, USA, 2006. [Google Scholar]
  54. Burgueño, R.; Sicilia, Á.; Lirola, M.J.; Alcaraz-Ibáñez, M. Psychometric properties of the democratic behaviour and autocratic behaviour scale. J. Sport Health Res. 2017, 9 (Suppl. 1), 143–150. [Google Scholar]
  55. Koka, A.; Hagger, M.S. Perceived teaching behaviors and self-determined motivation in physical education: A test of self-determination theory. Res. Q. Exerc. Sport 2010, 81, 74–86. [Google Scholar] [CrossRef]
  56. Soper, D.S. A-priori Sample Size Calculator for Structural Equation Models [Software]. Available online: http://wwwdanielsopercom/statcalc (accessed on 3 February 2020).
  57. Muthén, L.K.; Muthén, B.O. Mplus Version 7: User’s guide, 7th ed.; Los Muthén & Muthén: Angeles, CA, USA, 2015. [Google Scholar]
  58. Henseler, J.; Ringle, C.M.; Sarstedt, M. A new criterion for assessing discriminant validity in variance-based structural equation modeling. J. Acad. Mark. Sci. 2015, 43, 115–135. [Google Scholar] [CrossRef] [Green Version]
  59. Chen, F.F. Sensitivity of goodness of fit indexes to lack of measurement invariance. Struct. Equ. Model. 2007, 14, 464–504. [Google Scholar] [CrossRef]
  60. Balaguer, I.; Guivernau, M.; Duda, J.L.; Crespo, M. Análisis de la validez de constructo y de la validez predictiva del cuestionario de clima motivacional percibido en el deporte (PCMSQ-2) con tenistas espanoles de competición. Rev. Psicol. Del. Deport. 1997, 6, 41–58. [Google Scholar]
  61. Balaguer, I.; Mayo, C.; Atienza, F.L.; Duda, J.L. Factorial validity of the Perceived Motivational climate in Sport Questionnaire-2 in the case of Spanish elite female handball teams. J. Sport Exerc. Psychol. 1997, 19, 27. [Google Scholar]
  62. Gutiérrez, M.; Tomás, J.M.; Gómez, A.; Moll, A. Clima motivacional, satisfacción, compromiso y éxito académico en estudiantes angoleños y dominicanos. Psicol. Esc. Educ. 2019, 23, e188764. [Google Scholar] [CrossRef] [Green Version]
  63. Mohammadzade, Y.; Zardoshtian, S.; Hossini, R.N.S. The Relationship between leadership styles of coaches with motivational climate of Iranian Elite Male Volleyball Players. Int. J. Acad. Res. Bus. Soc. Sci. 2012, 2, 91–95. [Google Scholar]
  64. Alfermann, D.; Lee, M.J.; Würth, S. Perceived Leadership Behavior and Motivational Climate as Antecedents of Adolescent Athletes’ Skill Development. Athl. Insight Online J. Sport Psychol. 2005, 7, 14–36. [Google Scholar]
  65. Bekiari, A. Insights Into Instructors’ Verbal Aggressiveness and Students’ Machiavellianism Through Leadership Style and Motivational Climate. Eur. Sci. J. 2016, 12, 90. [Google Scholar] [CrossRef] [Green Version]
  66. Barić, R.; Bucik, V. Motivational differences in athletes trained by coaches of different motivational and leadership profiles. Kinesiology 2009, 41, 181–194. [Google Scholar]
  67. Smith, S.L.; Fry, M.D.; Ethington, C.A.; Li, Y. The effect of female athletes’ perceptions of their coaches’ behaviors on their perceptions of the motivational climate. J. Appl. Sport Psychol. 2005, 17, 170–177. [Google Scholar] [CrossRef]
  68. Habibullah, A.H.M.; Sinha, J.B.P. Motivational Climate and Leadership Styles. Vikalpa J. Decis. Mak. 1980, 5, 85–94. [Google Scholar] [CrossRef]
Figure 1. Confirmatory Factor Analysis—standardized factor loadings and residual variances. Note: The ellipses represent the latent factors and the rectangles represent the items; ** p < 0.001.
Education 10 00157 g001
Figure 2. Regression model measuring the relationships of democratic and autocratic behavior with mastery motivational climate and performance motivational climate. Note: ** p < 0.001; broken lines represent non-significant relations.
Education 10 00157 g002
Table 1. Item descriptions and exploratory structural equation modeling of the Motivation Climate in Education Scale (MCES).
ESEM
ItemsMSDQ1Q2F1 (λ)F2 (λ)
1. El/la profesor/a espera que aprendamos nuevas habilidades y obtengamos nuevos conocimientos y habilidades (The teacher expects us to learn new skills and gain new knowledge)2.911.070.01−0.610.860.00
2. El/la profesor/a solo tiene en cuenta a los estudiantes con mejor rendimiento (Only successful students are taken notice of)2.871.230.04−1.0−0.210.68
3. El/la profesor/a se involucra para ampliar nuestra comprensión de los contenidos de la asignatura (The teacher is engaged in broadening our understanding of the subject)2.811.10−0.03−0.580.850.03
4. El/la profesor/a presta más atención a los estudiantes con éxito (The teacher gives the most attention to the successful students)2.971.240.13−0.92−0.010.81
5. El/la profesor/a anima a los estudiantes a practicar habilidades con las que aún no han tenido éxito (The students are encouraged to practice skills that they have not yet been successful with)3.261.10−0.18−0.740.81−0.04
6. El/la profesor/a anima a los estudiantes a superar a los demás (Students are encouraged to outperform others)2.711.210.12−0.990.030.94
7. La mejora es importante para cada estudiante (Improvement is important for every student)3.181.17−0.18−0.790.73−0.01
Note. ESEM = Exploratory Structural Equation Modeling; M = mean; SD = standard deviation; Q1 = skewness; Q2 = kurtosis; F1 = mastery motivational climate; F2 = performance motivational climate; λ = standardized factor loadings; factor loadings >0.50 (primary) are highlighted in bold.
Table 2. Confirmatory factor analysis, standardized factor loadings for the confirmatory factor analysis (CFA) solutions.
ItemsCFA
F1F2
Item 10.85 **
Item 30.84 **
Item 50.82 **
Item 70.73 **
Item 6 0.91 **
Item 4 0.83 **
Item 2 0.76 **
F1 with F2−0.32
Note: CFA = Confirmatory Factorial Analysis; F1 = mastery motivational climate; F2 = performance motivational climate; ** p < 0.001.
Table 3. Descriptive statistics and correlations for the items of MCES.
Items1234567
1 (F1)-
2 (F2)−0.33 **-
3 (F1)0.75 **−0.27 **-
4 (F2)−0.18 **0.68 **−0.21 **-
5 (F1)0.69 **−0.31 **0.70 **−0.22 **-
6 (F2)−0.19 **0.71 **−0.18 **0.78 **−0.22 **-
7 (F1)0.64 **−0.34 **0.62 **−0.22 **0.67 **−0.16 **-
Mean2.853.012.703.123.132.843.07
Standard deviation1.081.241.121.271.111.231.17
Skewness0.02−0.030.05−0.015−0.060.01−0.04
Kurtosis0.70−1.04−0.70−0.1.04−0.82−1.05−0.85
Note. **p < 0.001; F1 = mastery motivational climate; F2 = performance motivational climate.
Table 4. Invariance test across gender for the MCES.
Model χ2 df RMSEA [90% IC] CFI TLI ΔRMSEA ΔCFI ΔTLI
Measurement across gender
1.- Configural invariance101.733 *260.075 [0.056–0.112]0.9400.923
2.- Weak invariance121.780 *310.073 [0.053–0.109]0.9380.922−0.02−0.002−0.001
3.- Strong invariance139.044 *360.078 [0.059–0.110]0.9320.9250.03−0.0060.003
4.- Strict invariance160.160 *430.082 [0.065–0.118]0.9270.9290.07−0.0050.004
Note. χ2 = Chi square; df = degrees of freedom; RMSEA = root mean square error of approximation; 90% CI = 90% confidence interval of the RMSEA; CFI = comparative fit index; TLI = Tucker–Lewis index; * p < 0.01.
Table 5. Analysis predicting mastery motivational climate and performance motivational climate with bootstrapping (5000 samplings).
Bβ
CI95%SE CI95%
SebscalesEstLLULEstLLULSEpR2
Mastery Motivational Climate 0.70
Democratic behavior0.830.631.110.120.810.651.000.090.000
Autocratic behavior−0.05−0.270.240.13−0.04−0.220.180.140.640
Performance Motivational Climate 0.38
Democratic behavior0.15−0.110.590.180.12−0.090.460.140.309
Autocratic behavior1.050.701.660.250.700.481.030.140.000
Note: B = regression weights; SE = standard error; β = standardized regression weights; Est = estimate; IC = confidence intervals; LL = lower limit; UL = upper limit; R2 = variance.

