Article

Where to from Here? Women Remain Absent from Senior Academic Positions at Aotearoa New Zealand’s Universities

1
Te Pūnaha Matatini: A New Zealand Centre of Research Excellence for Complex Systems and Networks, New Zealand, University of Auckland, Auckland 1010, New Zealand
2
Auckland War Memorial Museum, Auckland 1010, New Zealand
3
Motu Economic and Public Policy Research, Wellington 6142, New Zealand
4
School of Biological Sciences, University of Auckland, Auckland 1010, New Zealand
5
Department of Physics, University of Auckland, Auckland 1010, New Zealand
*
Author to whom correspondence should be addressed.
Educ. Sci. 2020, 10(6), 152; https://doi.org/10.3390/educsci10060152
Submission received: 9 March 2020 / Revised: 21 April 2020 / Accepted: 29 April 2020 / Published: 1 June 2020
(This article belongs to the Section Higher Education)

Abstract

:
In light of policies and programs designed to address the domination of academic positions by male, frequently white individuals, we review the participation of women, one of multiple minority identities within the academy, in Aotearoa New Zealand’s academic workforce using employment data from eight universities from 2002–2017. While the number of women employed continues to improve, the rate has slowed in recent years and senior roles remain heavily dominated by men. Women were more likely to be employed at lower levels of seniority, to advance to seniority more slowly than male colleagues, and were more likely to be employed part-time. We call for active strategies to address the cultural and structural bias in universities that favour the hiring and promotion of men to improve workforce diversity at all levels of seniority.

1. Introduction

Academics do not float outside social and political spheres, without pre-constituted values or interests; they are engaged, but specifically placed, individuals with the means to critique received knowledge [1]. Given this, it is vital that academic identities are broadly representative of the societies they sit within, enabling performance of their role as both critic and conscience, and as educators of the next generation [2]. However, this is not possible while universities continue to be dominated internationally by older, usually white, better-paid, heterosexual men [3,4,5,6,7,8,9,10].
The underrepresentation of women within the academy, while being only one marginalized identity, is well documented both across the world and across disciplines [3], with men more likely to be hired into academic roles and paid higher salaries than women [4,5]. The more senior the academic position, the less likely that it will be filled by a woman, even when accounting for differences in productivity due to career interruptions [8,9,10,11]. This attrition of academic women frequently begins following doctoral completion with fewer women being recruited into the academy [12], and this disparity only grows further up the academic ladder [9,13,14]. Furthermore, it has recently been demonstrated that academic women in Aotearoa New Zealand are likely to receive 400,000 NZD less pay than their male colleagues over the course of their career, even after controlling for age and research performance [15].
Reasons for women’s under-representation in academia are numerous, complex and interrelated; they encompass dimensions of both personal decision-making and structural barriers [16]. In the late 1990s and early 2000s, the observed disparities were often attributed to differences in gender socialisation, perceptions about the women’s suitability of academic careers within certain fields, and even suggestions of intrinsic differences in aptitude [9]. However, these explanations are insufficient, given that women are increasingly receiving doctorates at similar rates to men [17,18] and given the increasing empirical evidence that women within the academy are equally committed to their careers [4]. This suggests that the gender imbalance is a consequence of women not being hired and promoted, rather than insufficient supply [4,19].
Meanwhile, structural barriers that hinder women’s academic careers include lack of support, unequal opportunities during early career stages, work culture, sexual harassment, and greater domestic responsibilities [4,20,21,22]. For women who have children, these structural barriers are further compounded [23,24]. However, even accounting for women disproportionately taking on child-bearing and familial responsibilities during critical periods of career development [25], women still transition to higher levels of academia at slower rates and in smaller numbers than men [4,26].
These challenges result in a male-dominated professoriate that, unconsciously or not, renews the employment landscape that produced it [27] by, for example, disproportionately selecting male symposia speakers [28] and journal reviewers [29]. Meanwhile, female staff are more likely than their male colleagues to be engaged in recruiting minority undergraduates, organizing diversity workshops, and taking on pastoral care roles within the department [30,31,32,33].
In recent decades, mentoring has been the primary means internationally of aiding women through the hurdles of their academic careers. Active interventions include the Athena Swan Charter (UK) [34] and Science in Gender Equity (Australia) [35]. Both programs have focused on advancing women in STEM, but the strategies can be applied in other fields to break down barriers to career advancement for women and develop a healthier work environment for all. To date, the only active, national intervention to support academic women in Aotearoa New Zealand is the New Zealand Universities Women in Leadership (NZUWiL) program, which selects two women from the academic and professional staff pools of each university each year to participate in a five-day residential program and follow-up symposia [36]. The program was run for the first time in 2007. While there is evidence that participation in the course helps academic women develop greater confidence and strong support networks, it is difficult to determine how participation influences career trajectory or career satisfaction [37,38,39] in part because participants are frequently self-selected and what constitutes effective mentoring is difficult to generalize [40,41]. This intervention also targets a very small proportion of the talent pool annually and any benefits are therefore focused on a small number of individuals, potentially limiting the scale of impact. Where change has occurred internationally, both top-down and bottom-up actions are most effective when working together to change the work culture.
Aotearoa New Zealand has eight universities (as defined under Section 162 of the Education Act 1989 [2] to differentiate them from other tertiary education organisations that operate in Aotearoa New Zealand including wānanga; Table 1). The largest is the University of Auckland with over 40,000 students (full-time and part-time) and the smallest is Lincoln University with approximately 6000 students. The universities host several university- and faculty-level programs for women’s professional development. However, NZUWiL is the only national program.
In 2012, a census of women’s participation in Aotearoa New Zealand’s university workforce showed that it was no exception to the international pattern, with women making up only 24.4% of senior academics (an increase of 8.56% from 2003 [42]). While less extreme, these disparities also exist amongst higher-level professional staff at the University of Auckland [43]. Furthermore, the challenges of an academic career are not uniform for all women. In particular, Māori and Pasifika scholars face additional challenges in academic career advancement [6,7,44], and historically, improvements for women in Aotearoa New Zealand’s universities often have not translated into improvements for Māori and Pasifika women [45,46,47].
Our primary objective was to review the progress towards parity in men and women’s participation in the academy by analysing recent employment data. We consider our findings in the context of concurrent changes to the academic landscape at a national level, in particular the addition of measures to support women’s participation, but also shifts in the metrics used to audit academics. Using employment data collected by the universities themselves, we reviewed current representation of men and women both overall and at different levels of seniority for the total university workforce. This is in contrast to the recent Brower and James study [15], which examined the relationship between research performance and the gender pay gap and academic grade using metrics based on the Performance-Based Research Fund (PBRF; instituted in 2003). The results of these assessments of individual academics determines the level of funding each university receives and is based primarily upon the number and quality of research outputs, principally journal articles [37]. While our dataset, based on employment only, provides less data on research performance, it does capture a greater proportion of staff on fixed-term contracts who are less likely to be eligible for the PBRF process, including those on teaching contracts such as tutors [56].
We compare employment across the eight universities and for each institution individually in the hope that it will be provide a basis and spur for each institution to consider the characteristics of their workforce. Given that equity has been a listed priority in the tertiary education strategy for the government and is a listed priority for many of our sampled universities [57], we would expect to find a steady increase in the total number of women in academia. Furthermore, because NZUWiL is a national program, we also expect a steady increase in the number of women in senior academic positions. We focus on academics with full-time employment who are more likely to be eligible for both PBRF and professional development programs. However, because academics may transition into and out of part-time work at different times in their careers, we also include some basic descriptive data about the proportion of men and women with part-time employment.
Based on the barriers that women face, we would also expect men to progress through academic grades faster than women. To determine how rates of promotion may contribute to the observed pattern of employment, we simulate the distribution of academic women across the academic grades using a model of promotion generated from our observed distribution of academic men. Because women are more likely to face career interruptions and opt to take on more flexible work, we also compare the proportions of academic men and women in part-time and full-time employment.
By conducting this research, we aimed to identify key areas for improvement and further investigation within Aotearoa New Zealand’s academic workforce. In addition to supporting the careers of women already within academia and producing a new generation of role models, ensuring the place of women within the academy has significant implications for curriculum and research design and delivery.

2. Materials and Methods

2.1. Data Acquisition

Data were acquired by emailing the Ministry of Education through the Education Counts website [58] as outlined by McAllister et al. [7] and Naepi [6]. Our data account for the number of full-time and part-time male and female academic staff employed or contracted by each of the eight Aotearoa New Zealand universities from 2002–2017; the number of male and female academic staff employed or contracted by the eight Aotearoa New Zealand universities by academic group (2012–2017); and the number of male and female academic staff pooled across the eight universities grouped by age group, ethnicity and academic level (2012–2017). These data are reported by universities to the Ministry of Education annually in the format specified on the Education Services website [59]. Information regarding data collection by universities was unavailable, but it is assumed that they each use their own HR systems to collate the data.
There are several caveats associated with the data presented in this paper. Firstly, the data collection methods differ across the period of collection. From 2012–2015, data were collected as a snapshot in the first week of August, meaning that new academics who began employment after the first week of August would not be captured. After 2015, data were collected for the full calendar year and consequently are probably more accurate. Data on academic seniority prior to 2012 were not available from the Ministry of Education and were not available for our part-time data. Secondly, data for non-response rates were not readily available, making it difficult to ascertain how many academic staff are not captured in these surveys.
In this paper, we report data distributed across five academic staff levels: (1) other academic staff/tutorial assistants; (2) lecturers and tutors; (3) senior lecturers; (4) associate professors and head of departments (HOD); and (5) professors and deans. These staff levels were provided to us by the Ministry of Education and we were therefore unable to disaggregate, for example, HODs and associate professors. These data do not capture post-doctoral and research fellows on fixed-term contracts because they are considered research staff and not academic staff. We assume that a large proportion of the staff captured in our full-time dataset are largely permanent. Furthermore, the data lack acknowledgement that gender is non-binary and therefore we do not have data on academics who do not identify as women or men. We note that the University of Auckland has begun offering a third option for gender in staff surveys and strongly implore other universities to follow suit in close consultation with the non-binary academic community.

2.2. Data Analysis

2.2.1. Progress Towards Gender Parity

We found evidence of curvature in the percentage of women employed, so, in addition to a simple linear model of the proportion of women employed each year, we fitted models with second and third order polynomials. Models were ranked and corrected Akaike information criterion (AICc) tables were generated using the R package AICcmodavg [60]. Using this method, our models with second and third order polynomials were equally weighted and explained a greater amount of variation than the simple linear model. Because of a recent plateau in the percentage of academic women, both polynomial models predicted that the number of women would continue to decrease. That the pattern should wholly reverse seems unlikely given the historic absence of women from the academy. We do not have employment data preceding 2002 but, as one example, the University of Auckland, the largest of the eight institutions, appointed its first women professors in 1975 and 1981 [61]. If we assume a steady increase in women’s participation from those historical cases to the present, the recent reduction cannot be confidently interpreted as a sign that the number of women employed will continue to decrease. For this reason, we adopt a more conservative but more optimistic linear model, which still accounts for a large proportion of the observed variation (adjusted-R2 = 0.835).

2.2.2. Do Gender Differences in the Age Distribution of Academic Staff Explain Why There Are Few Women at Senior Levels?

We asked the extent to which the gender difference in distribution of staff over academic levels is driven by the difference in age distribution of male and female academics. Between 2012 and 2017, we calculated the distribution of male staff over academic levels in each of the age groups under 30, 30 to 49, 50 to 59, 60 to 64 and 65 and over. We then combined these distributions with the actual number of female staff in each age group to calculate the counterfactual number of female staff at each academic level that would be expected if female staff had the same distribution of academic levels as men of the same age.

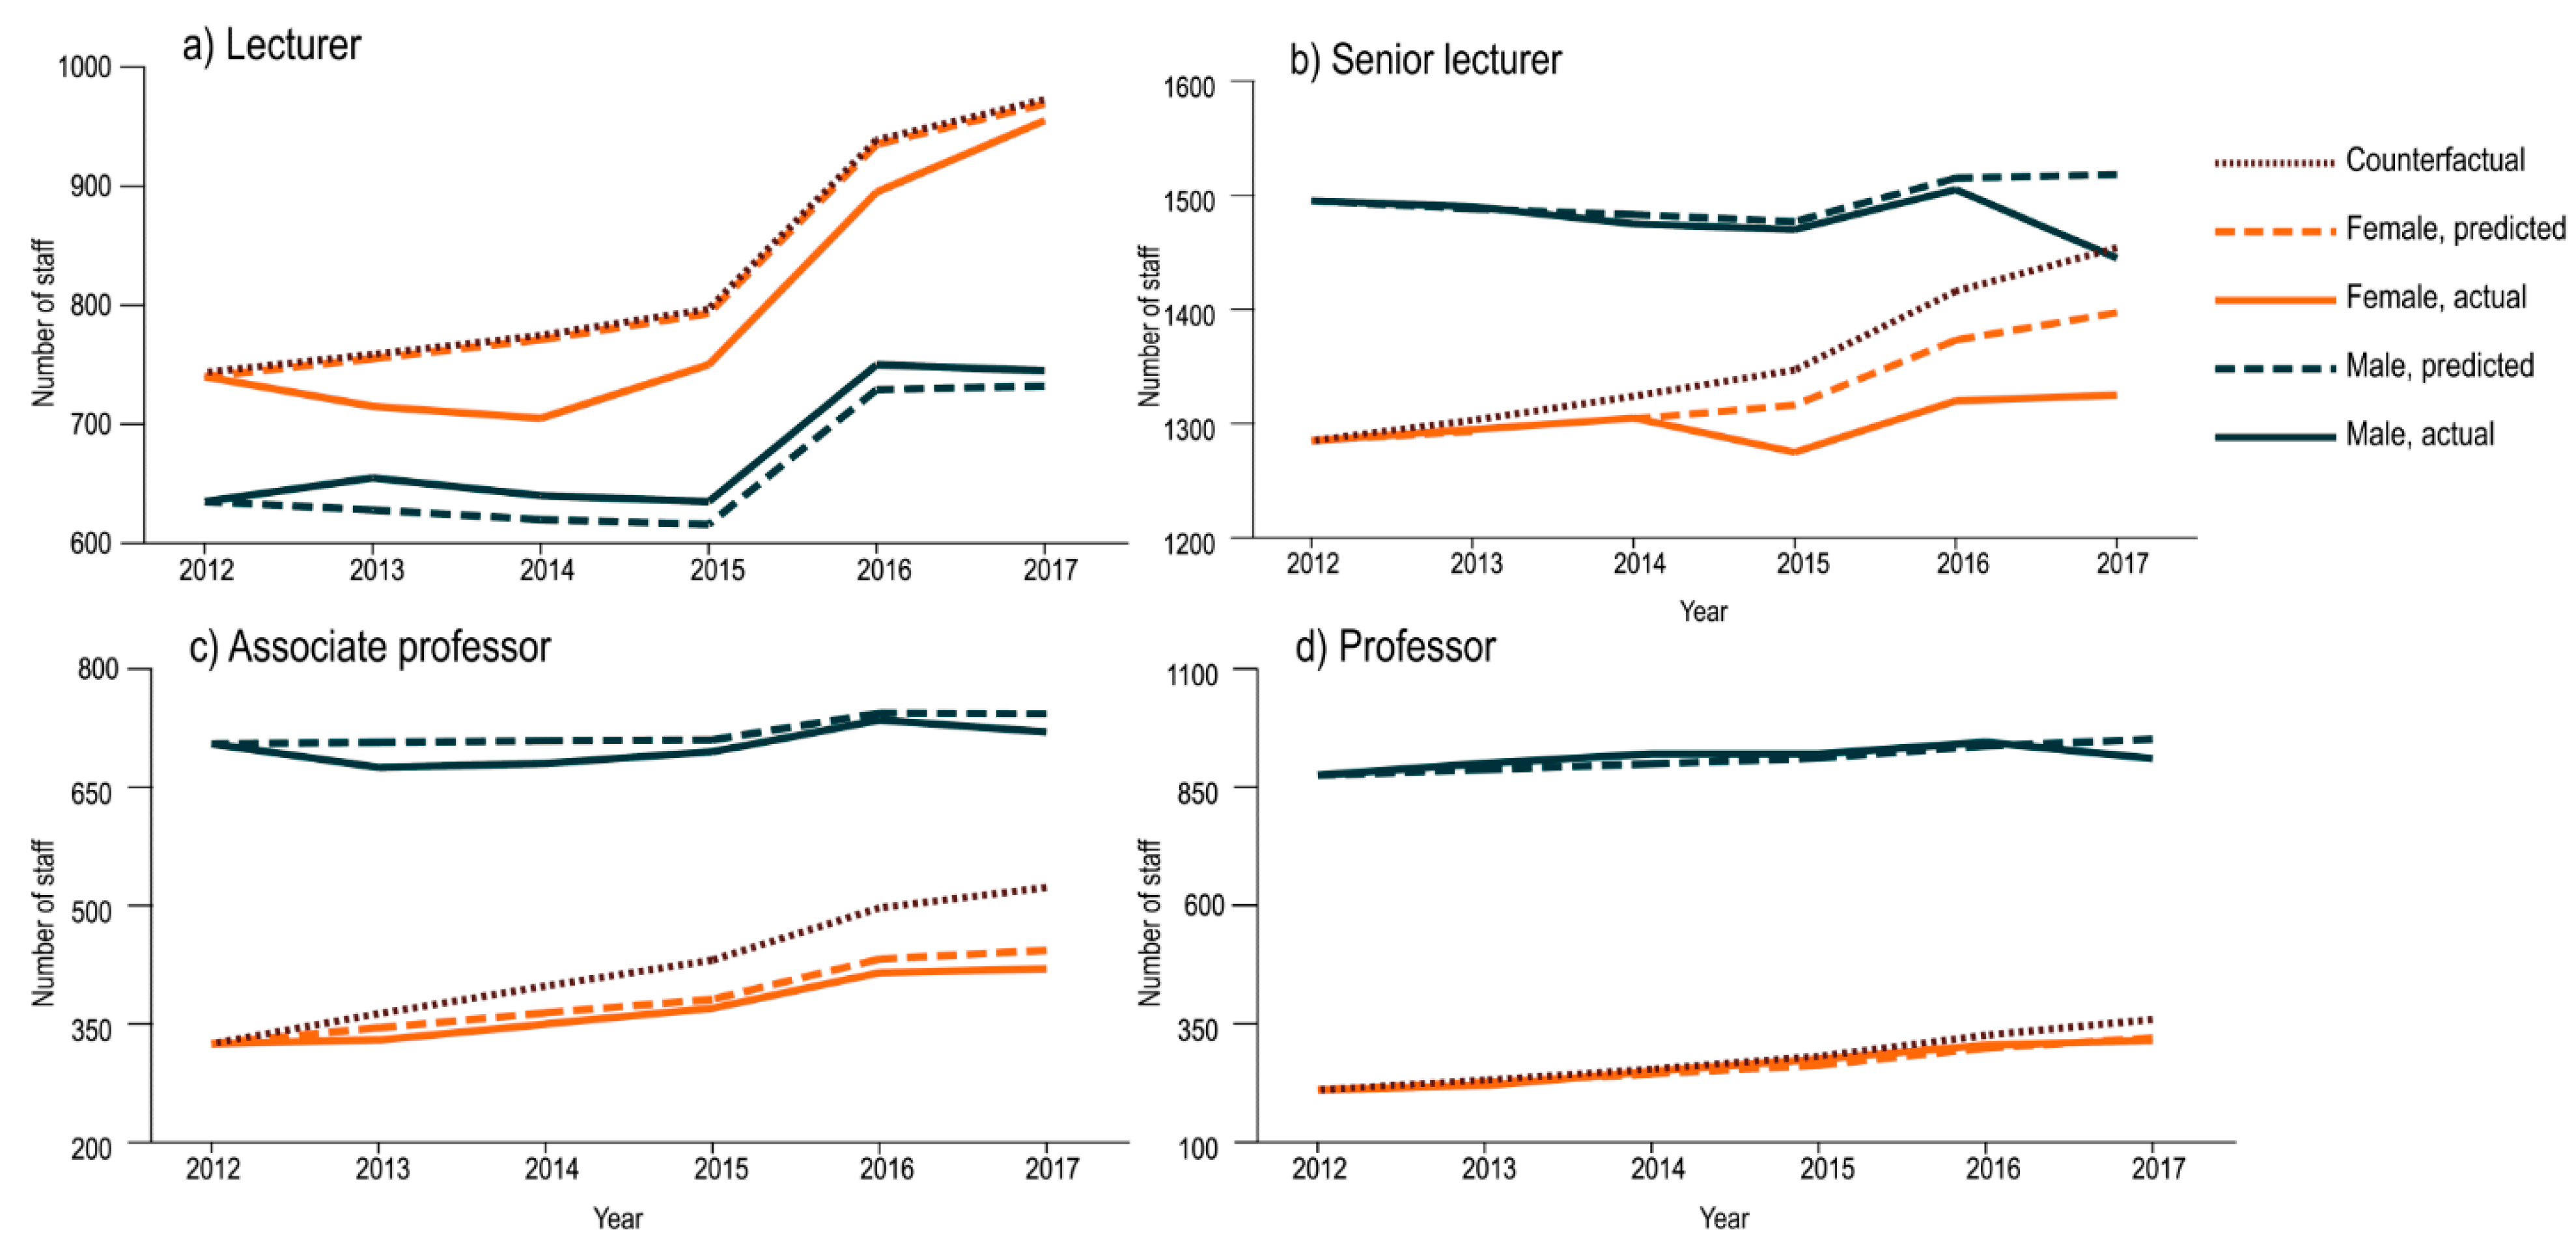
2.2.3. Do Women Advance at the Same Rate as Men?

We used aggregated data to estimate rates of promotion for men and women in academia and constructed a counterfactual of how the number of academic women at different levels would have evolved between 2012 and 2017 if they had been subjected to the same rate of promotion as academic men. For the purpose of this analysis, we omitted the academic level “Other academic staff/Tutorial assistants” because such staff may be on a different career trajectory.
To estimate rates of promotion, we ran an ordinary least squares regression of the number of academics of the gender, age group, and academic level in the year (additional details are available in Appendix A). We used the coefficients from these regressions to estimate rates of promotion for men and women. The model makes two simplifying assumptions. Firstly, we assumed that the rate of promotion is the same at each level within genders. Secondly, we did not explicitly model being promoted out of a level, although this is allowed for.
Using these estimates of promotion level, we constructed “predicted” staff levels by gender at each academic level by applying the growth given by the model from 2012 to 2017 to observed staff numbers in 2012. A comparison of these predicted values with actual values is a test of how well the functional form of the model fits the data. We then constructed “counterfactual” female staff levels at each academic level by applying our modelled male promotion rate to the actual number of female staff in 2012. These female counterfactual data are an estimate of how the number of academic women at different levels would have changed between 2012 and 2017 if women had experienced the same promotion rate as men.

3. Results

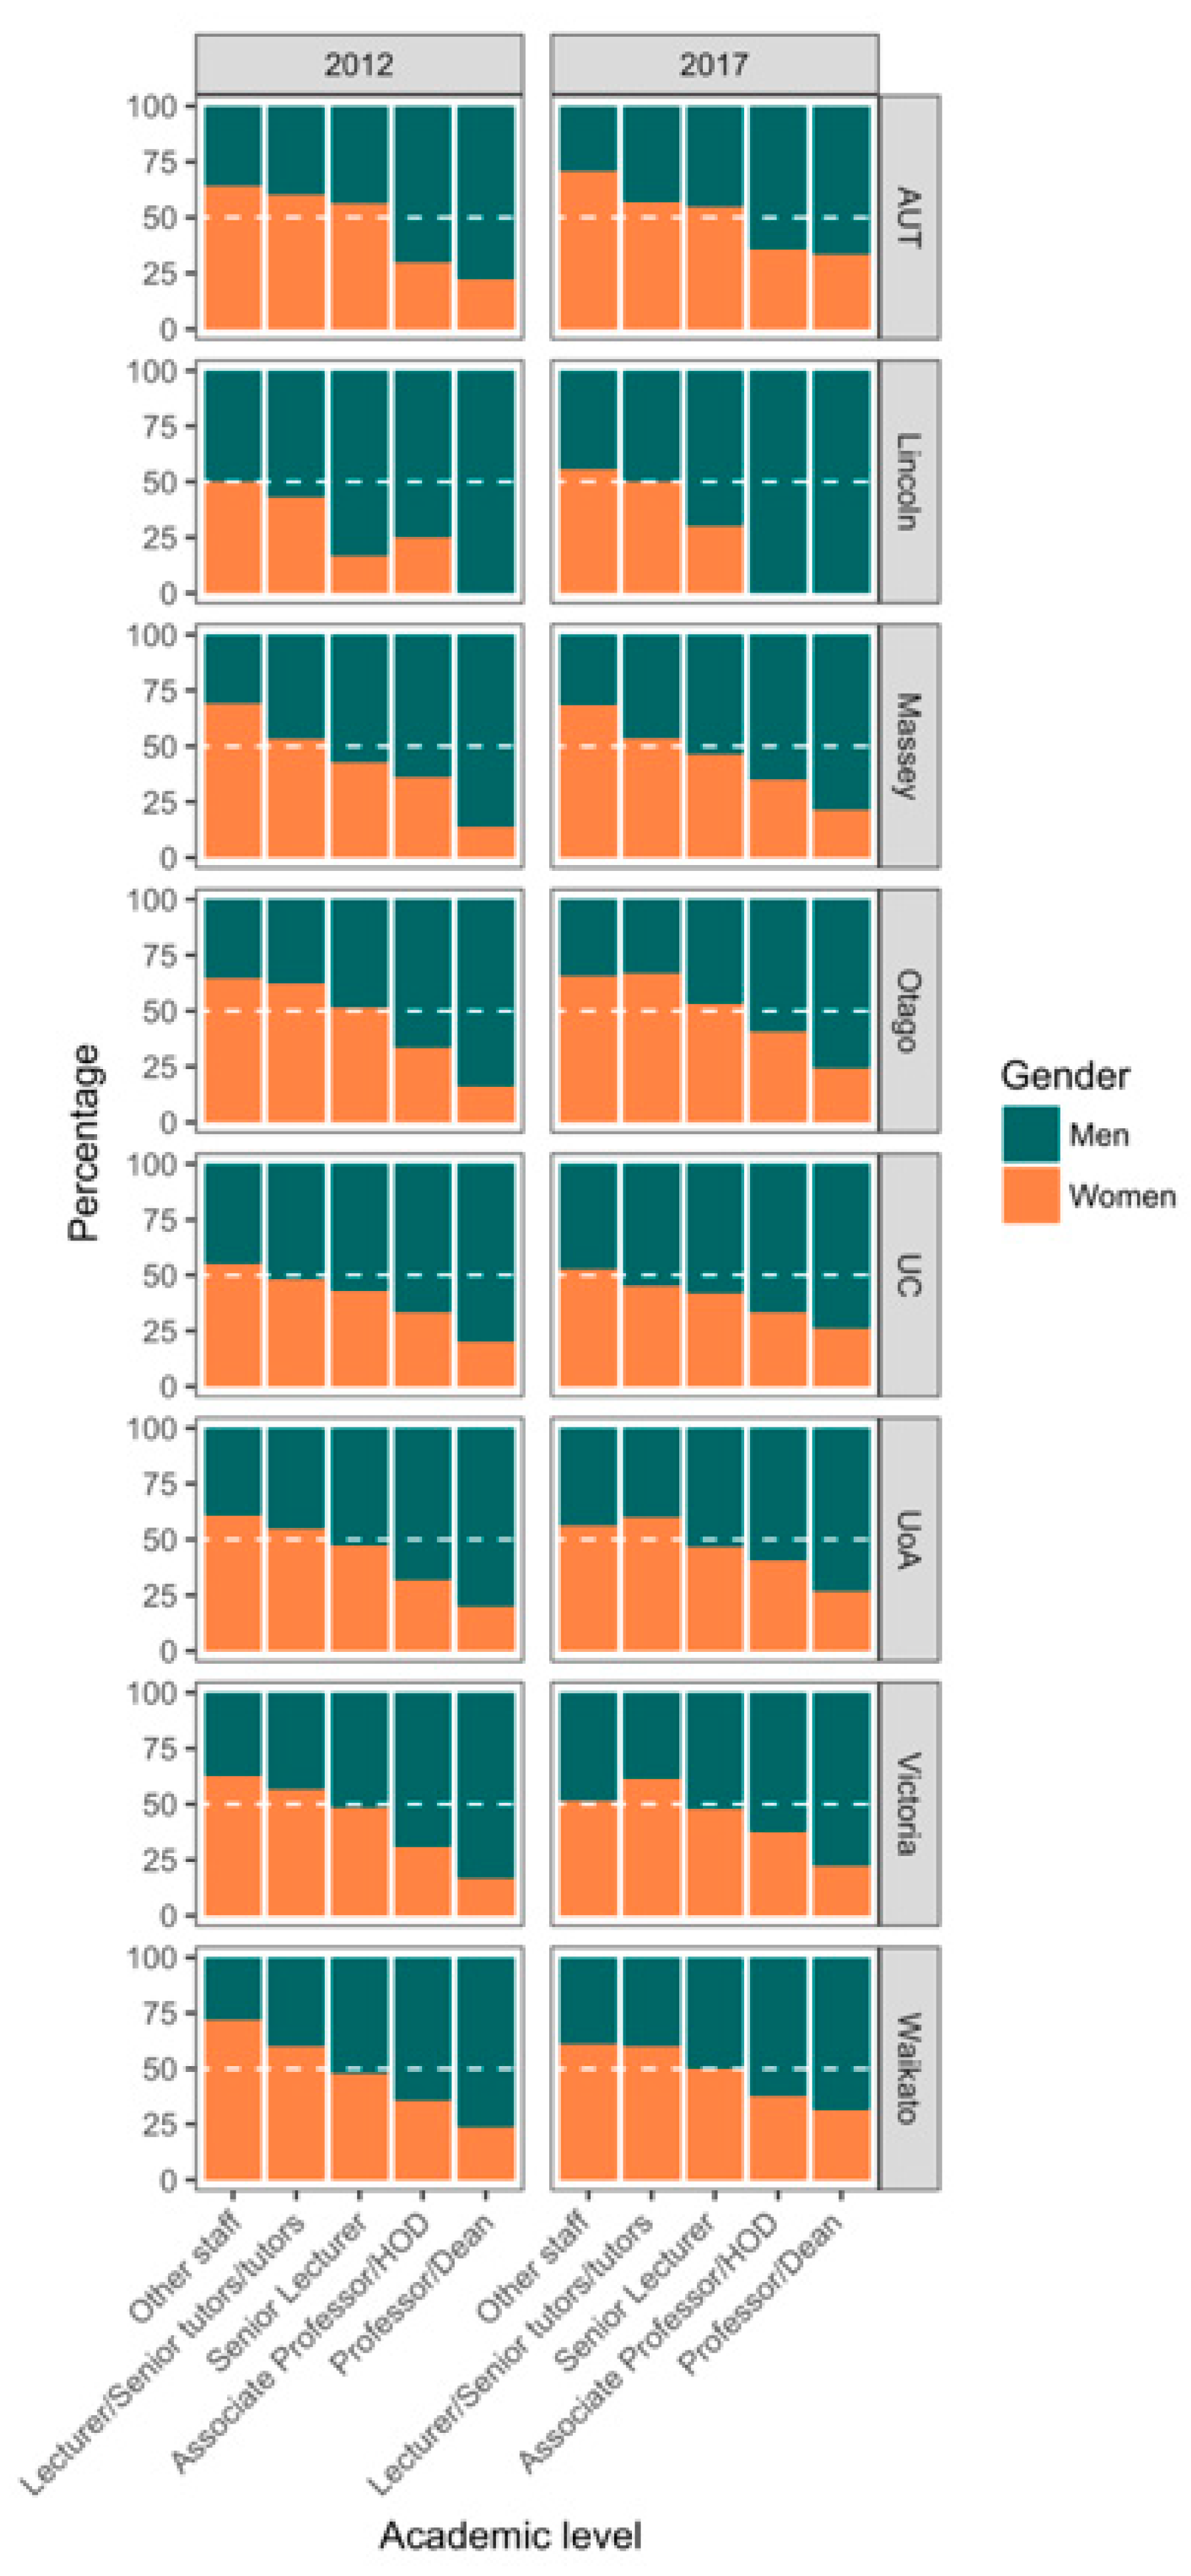
3.1. Women’s Participation in the Aotearoa New Zealand Academy

Between 2002 and 2017, Aotearoa New Zealand’s academic workforce grew from 8615 academic staff to 10,360, a 20.3% increase. As of 2017, the combined number of men and women employed as full-time staff at Aotearoa New Zealand universities was approaching 50:50, although the ratio was highly variable across universities (Figure 1 and Figure 2). Although the percentage of full-time academic staff who are women increased slightly between 2002 and 2017 (from 36% to 42%), at each of the eight universities over half of full-time academic staff are men (Figure 1 and Figure 2).
For full-time academic staff, the Auckland University of Technology and the University of Waikato were closest to a 50:50 ratio of men to women (averages: 48.8% and 45.8%, respectively; Table 2), and Lincoln University and the University of Canterbury were furthest from gender parity with the lowest proportion of female staff (averages: 24.6% and 33.1%, respectively; Table 2).

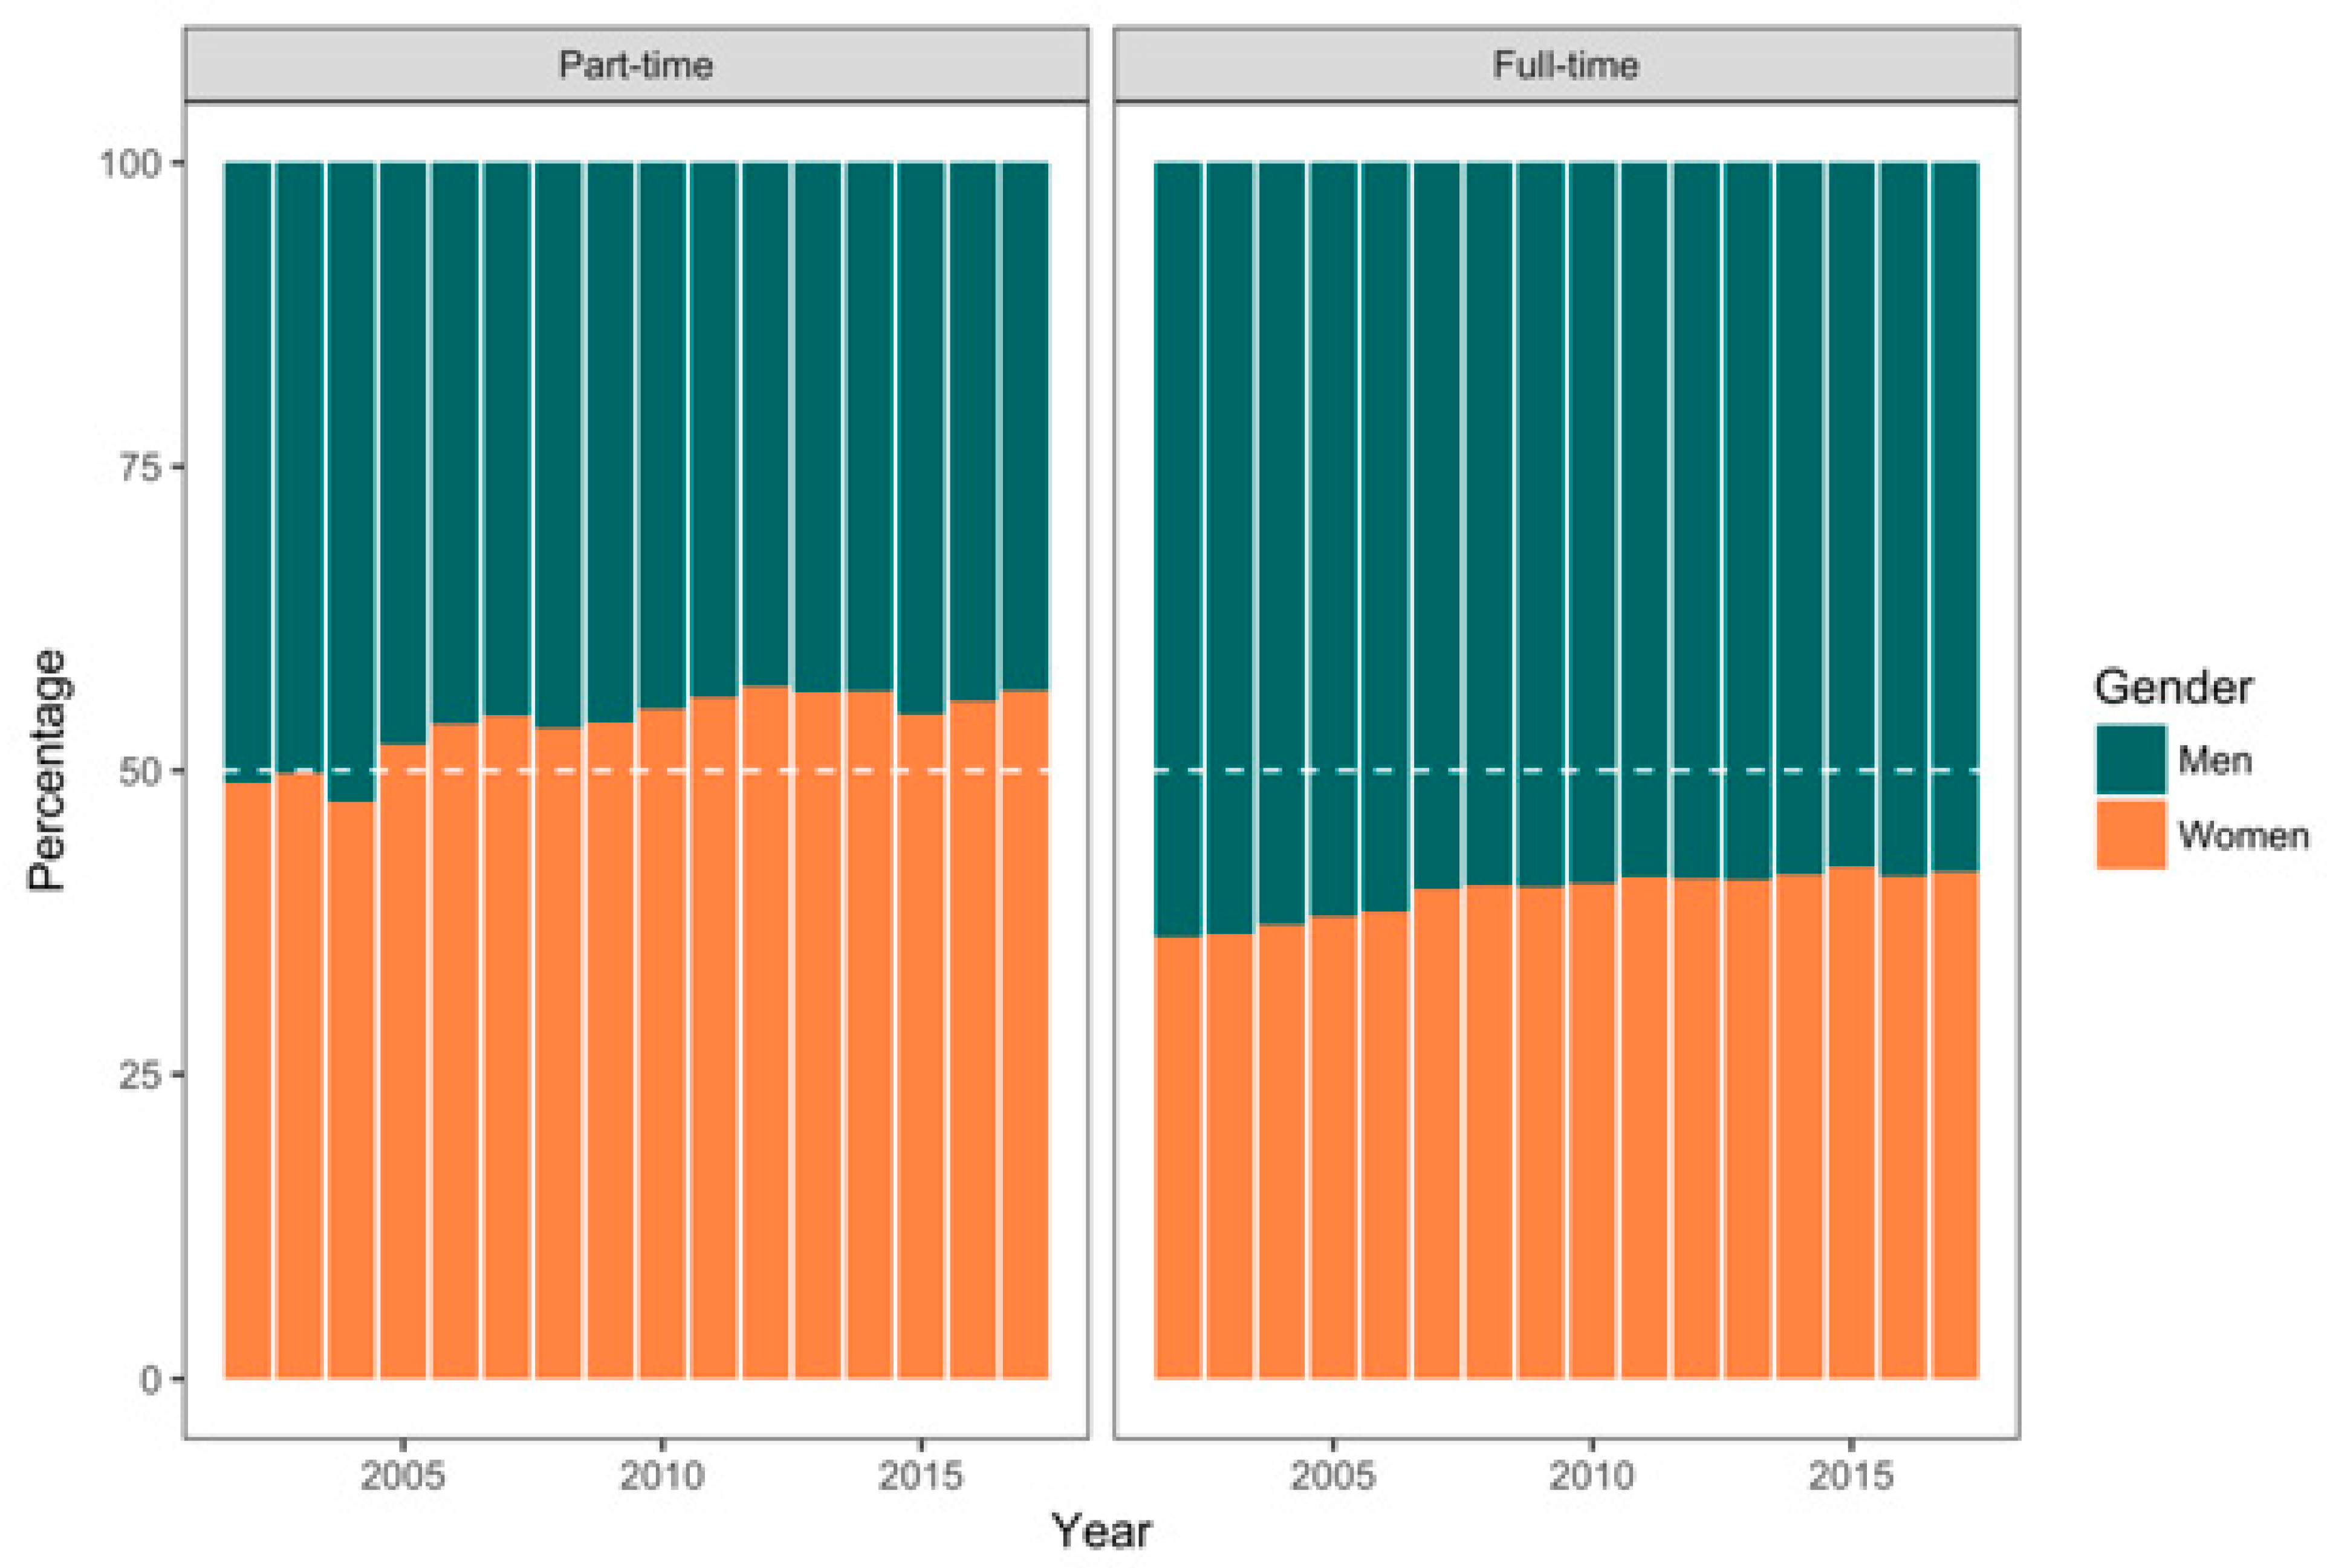
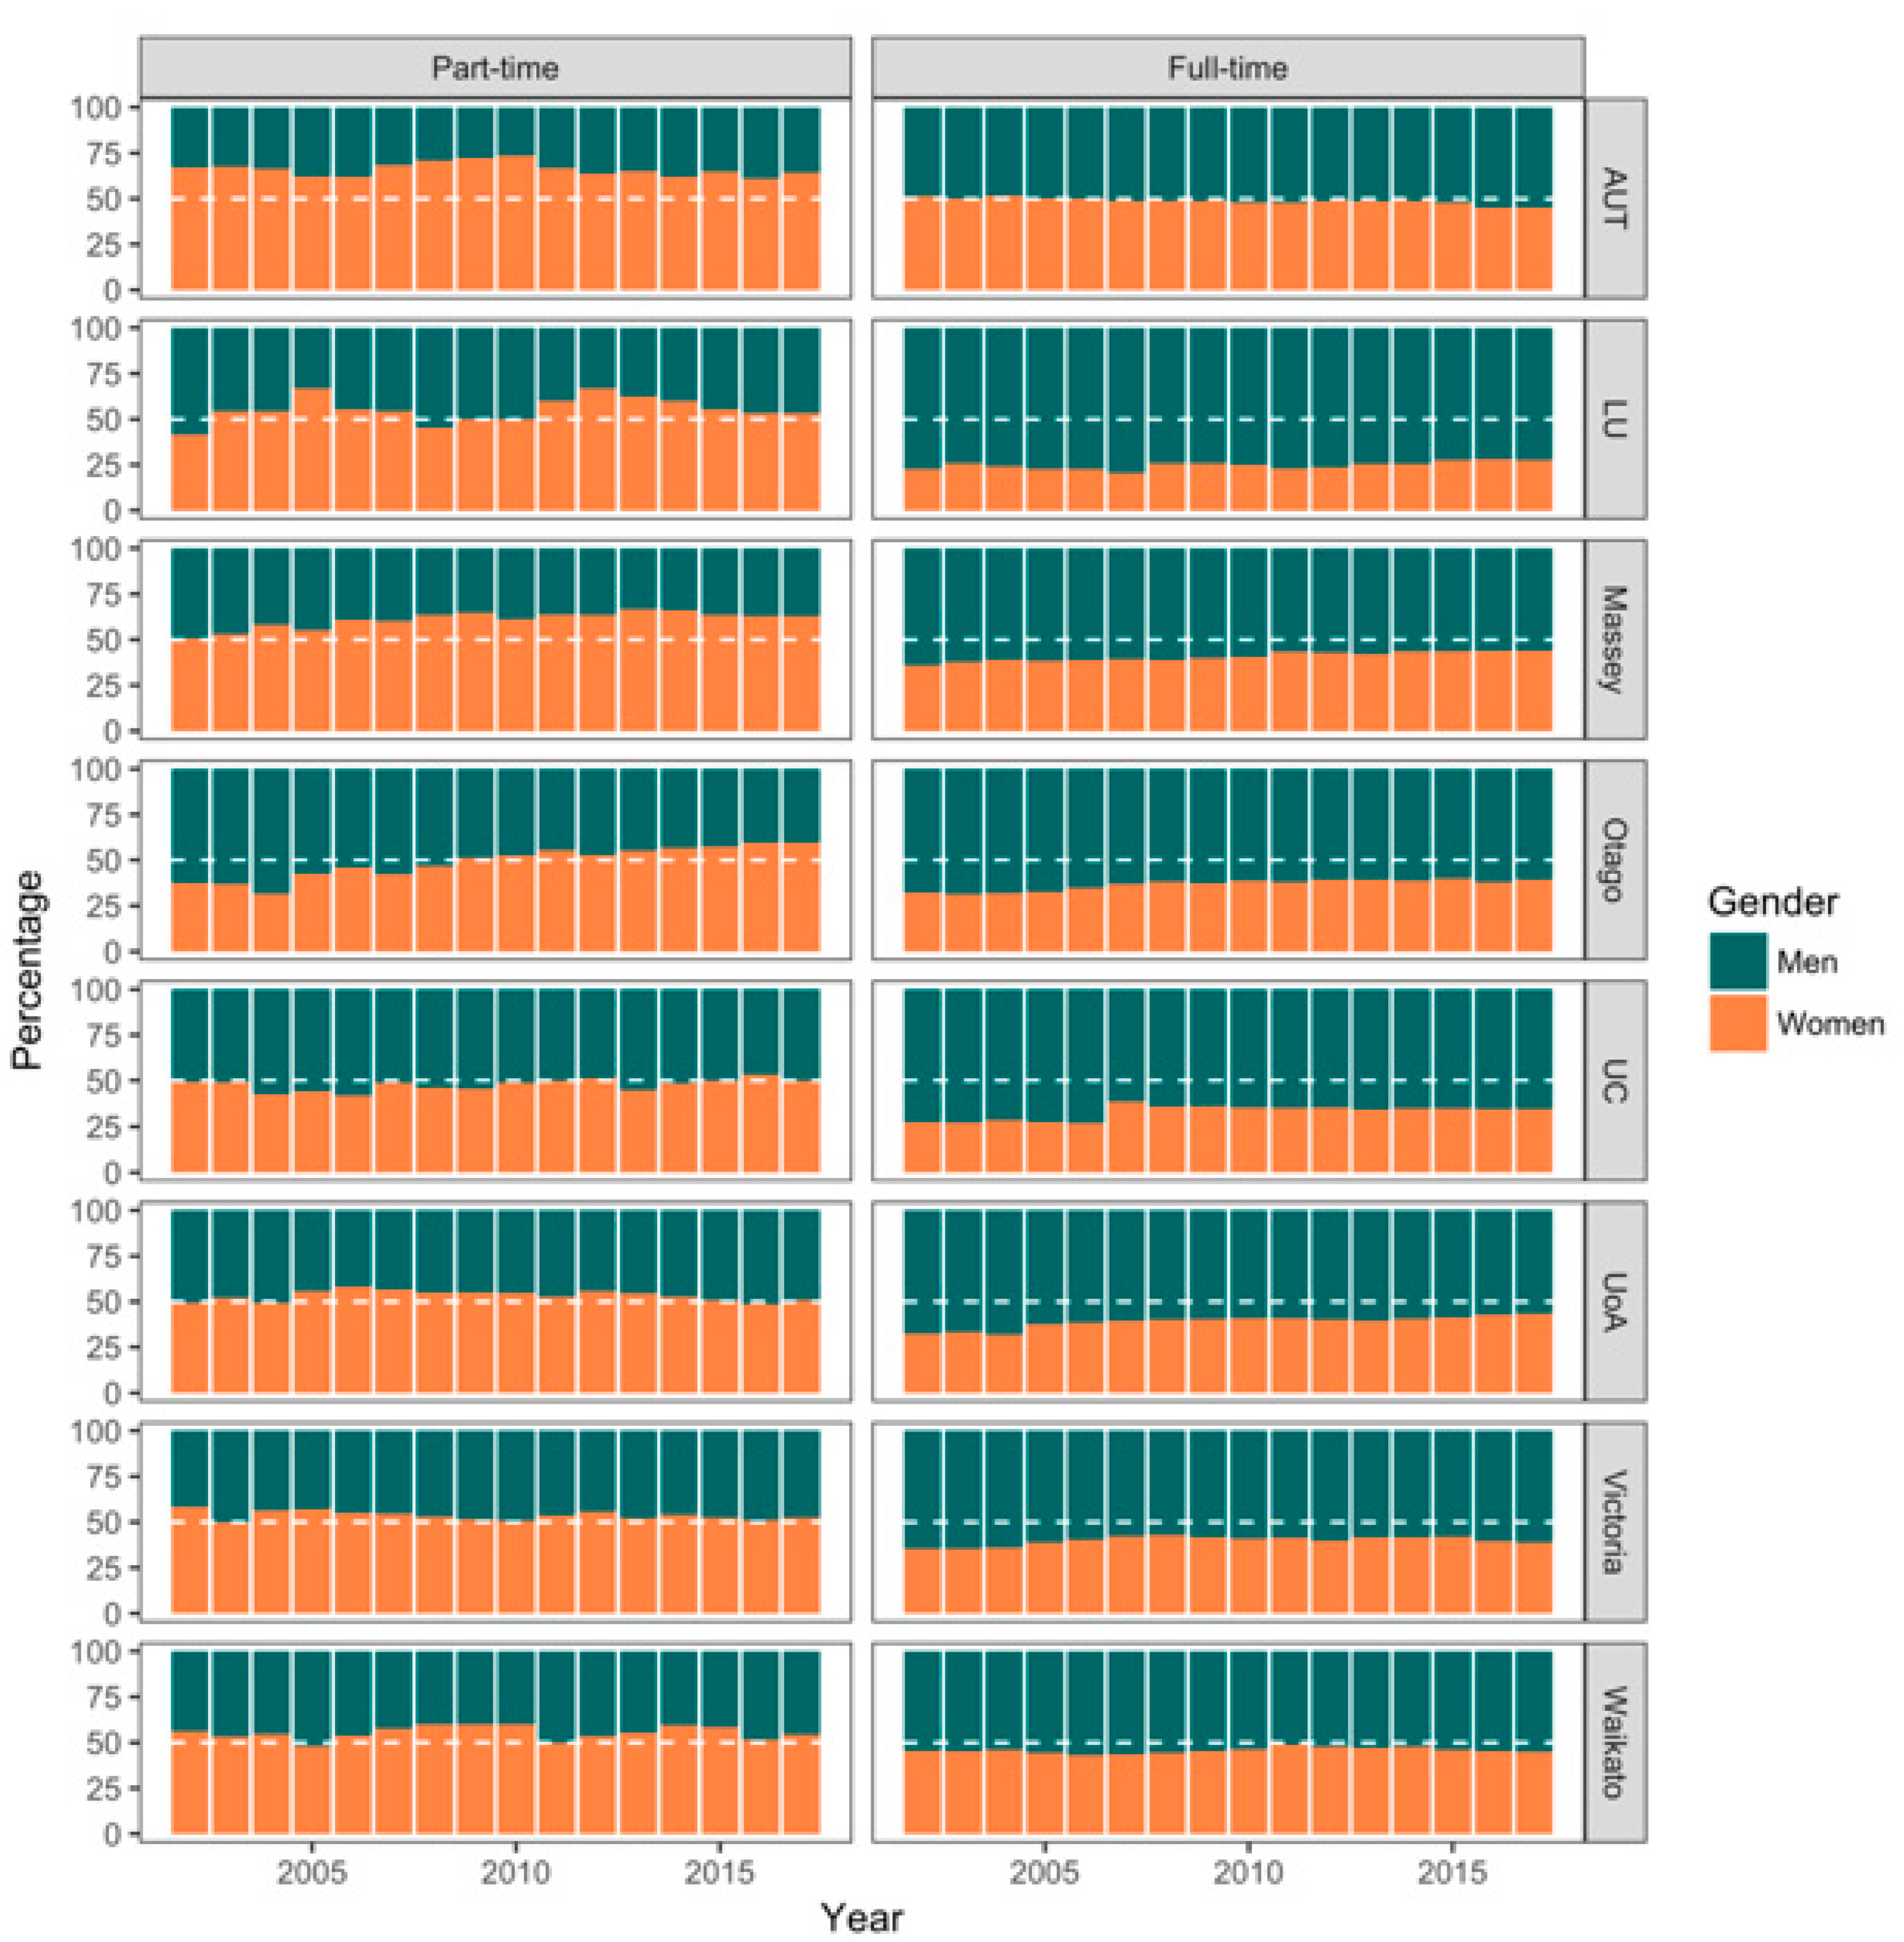
3.1.2. Part-Time vs. Full-Time Staff

Of the 8615 academic staff employed by Aotearoa New Zealand’s eight universities in 2002, 3305 were on part-time contracts (with 5310 employed on full-time contracts). By 2017, while the actual number of full-time staff remained largely unchanged (5330; a 0.4% increase), there was a significant increase in the number of part-time staff (5030; a 52.2% increase). The percentage of women among part-time academic staff has increased slightly, from 49% in 2002 to 57% in 2017 (Figure 1). The percentage of women among part-time academic staff also varies among institutions (Figure 2, Table 2).

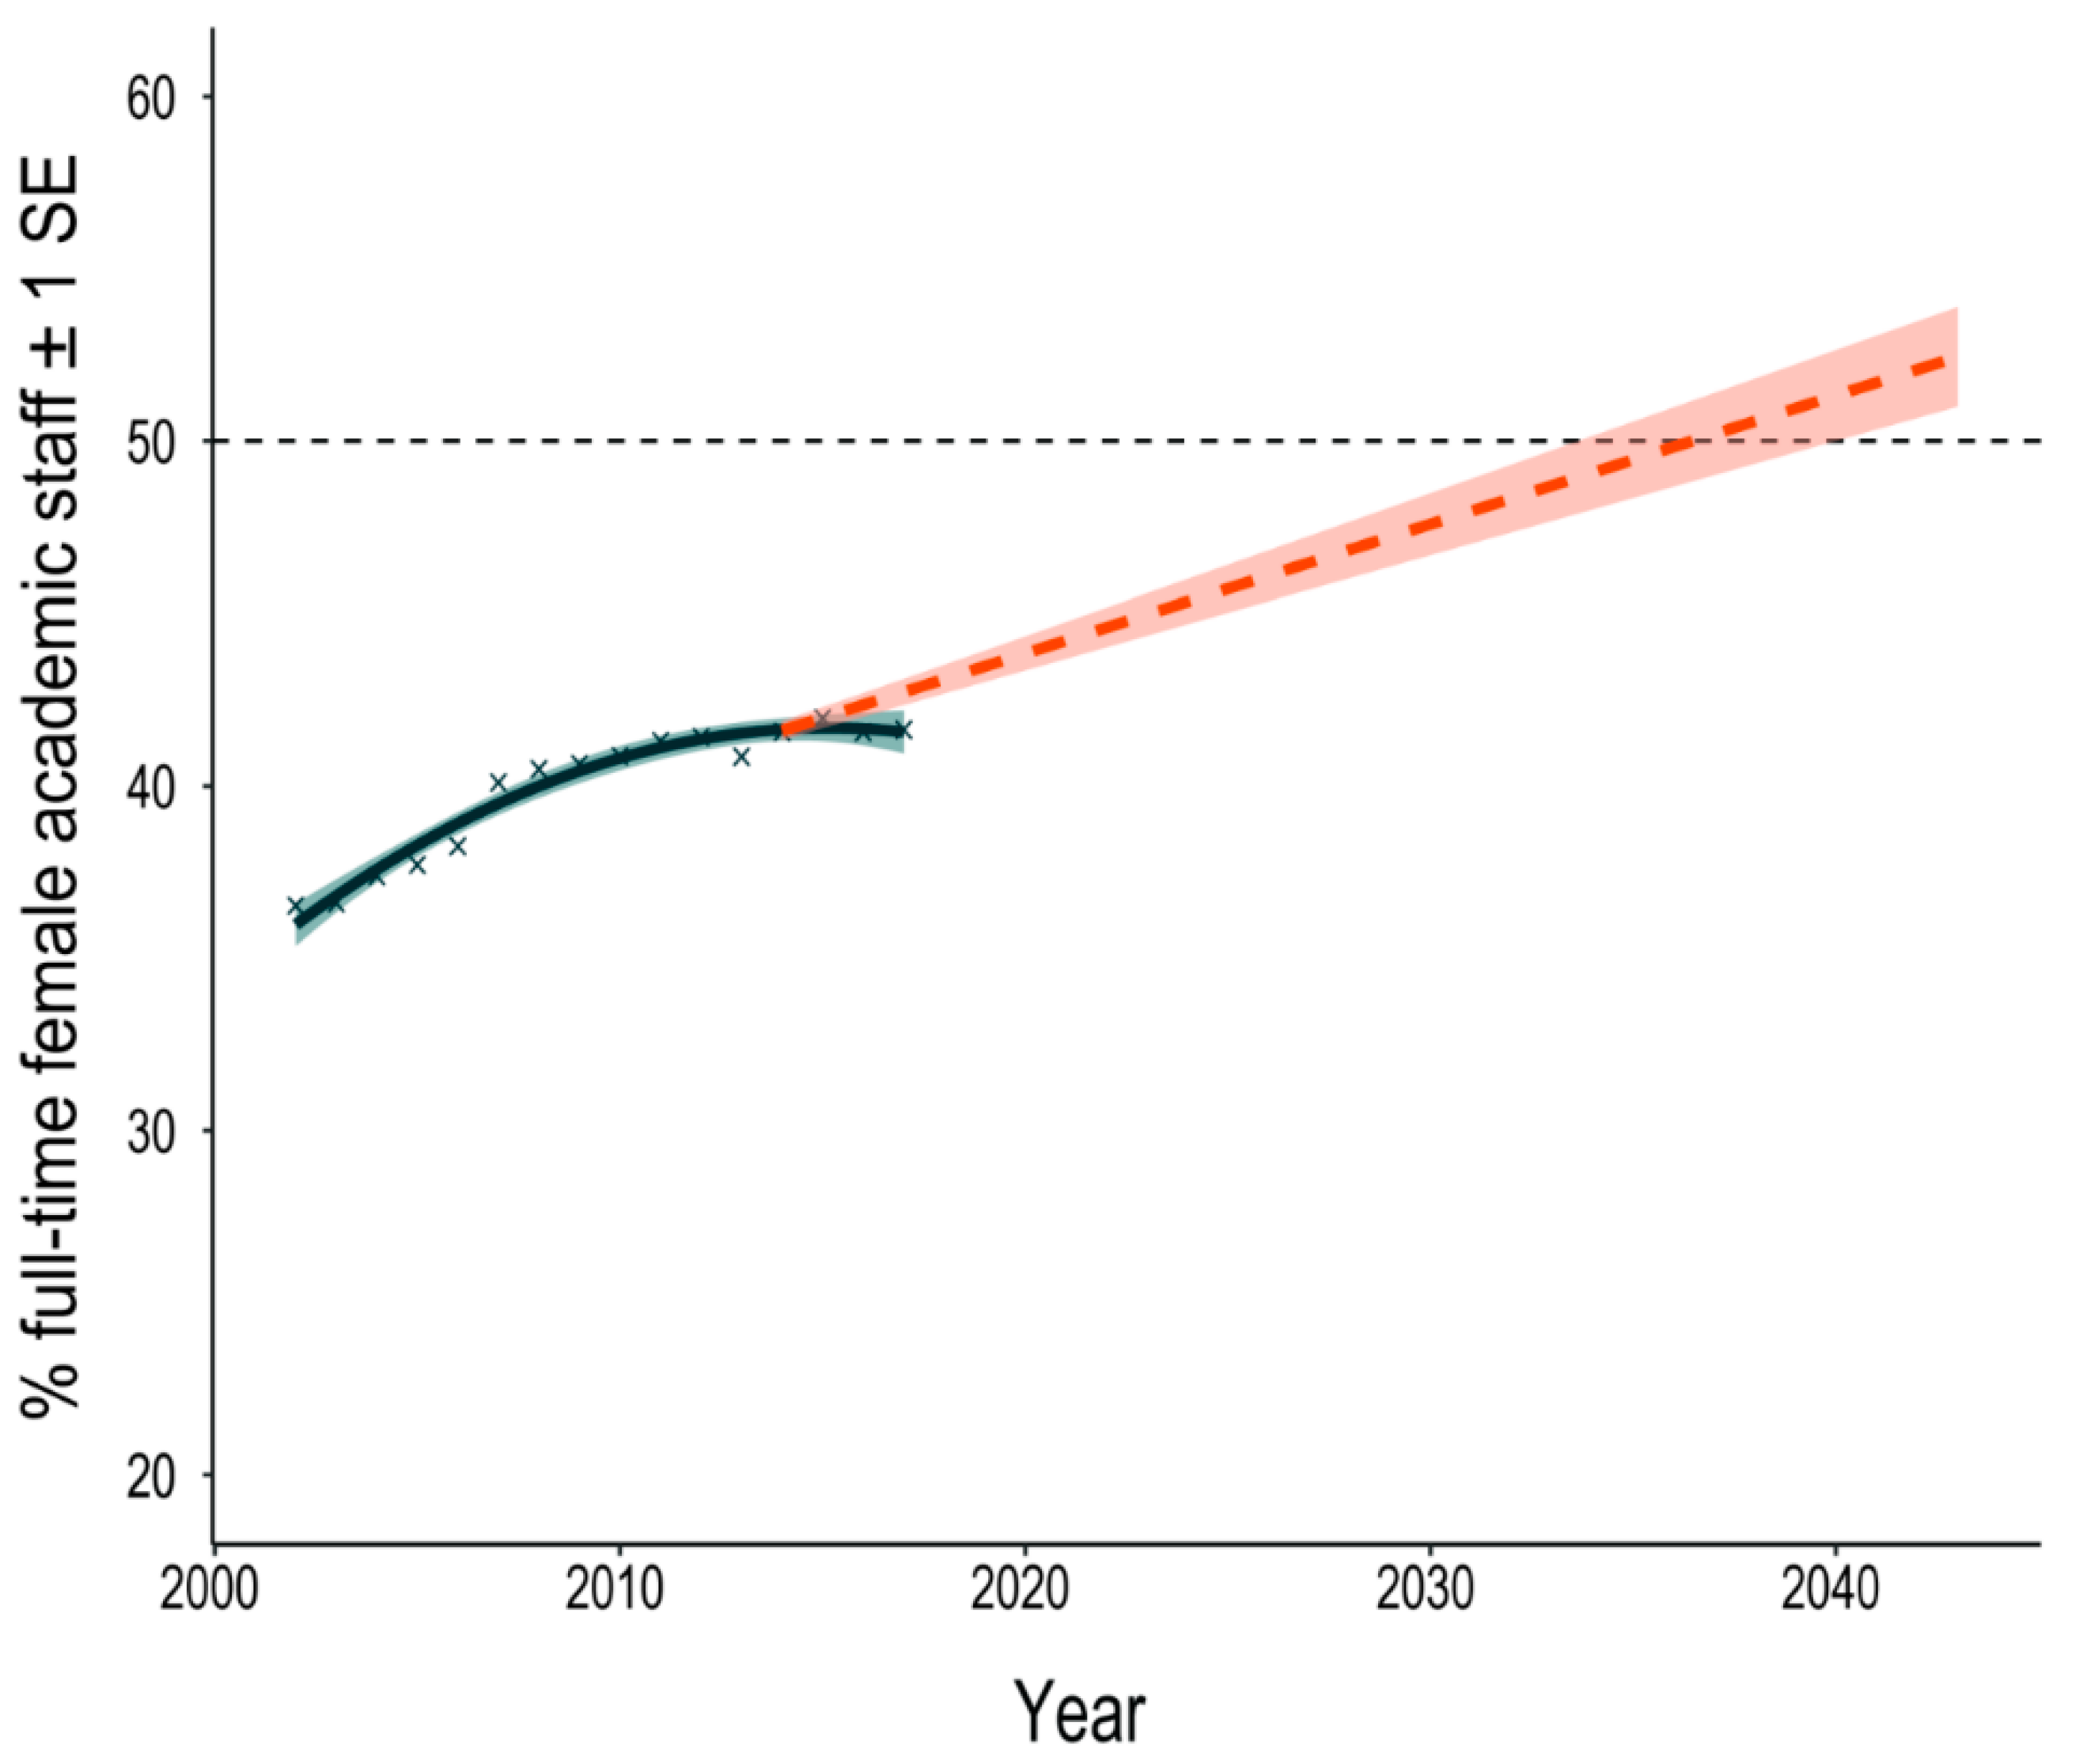
3.1.3. When Would We Predict Parity in Employment?

Our regression of the proportion of women in academia between the years 2002 and 2017 showed evidence of curvature, namely that the rate of increase in the proportion of academic women across all universities has slowed in recent years (Figure 3). If we optimistically assume linear growth in the proportion of women at Aotearoa New Zealand universities, then we would expect women to comprise 50% of academic staff by approximately 2036.

3.2. Women’s Career Progression

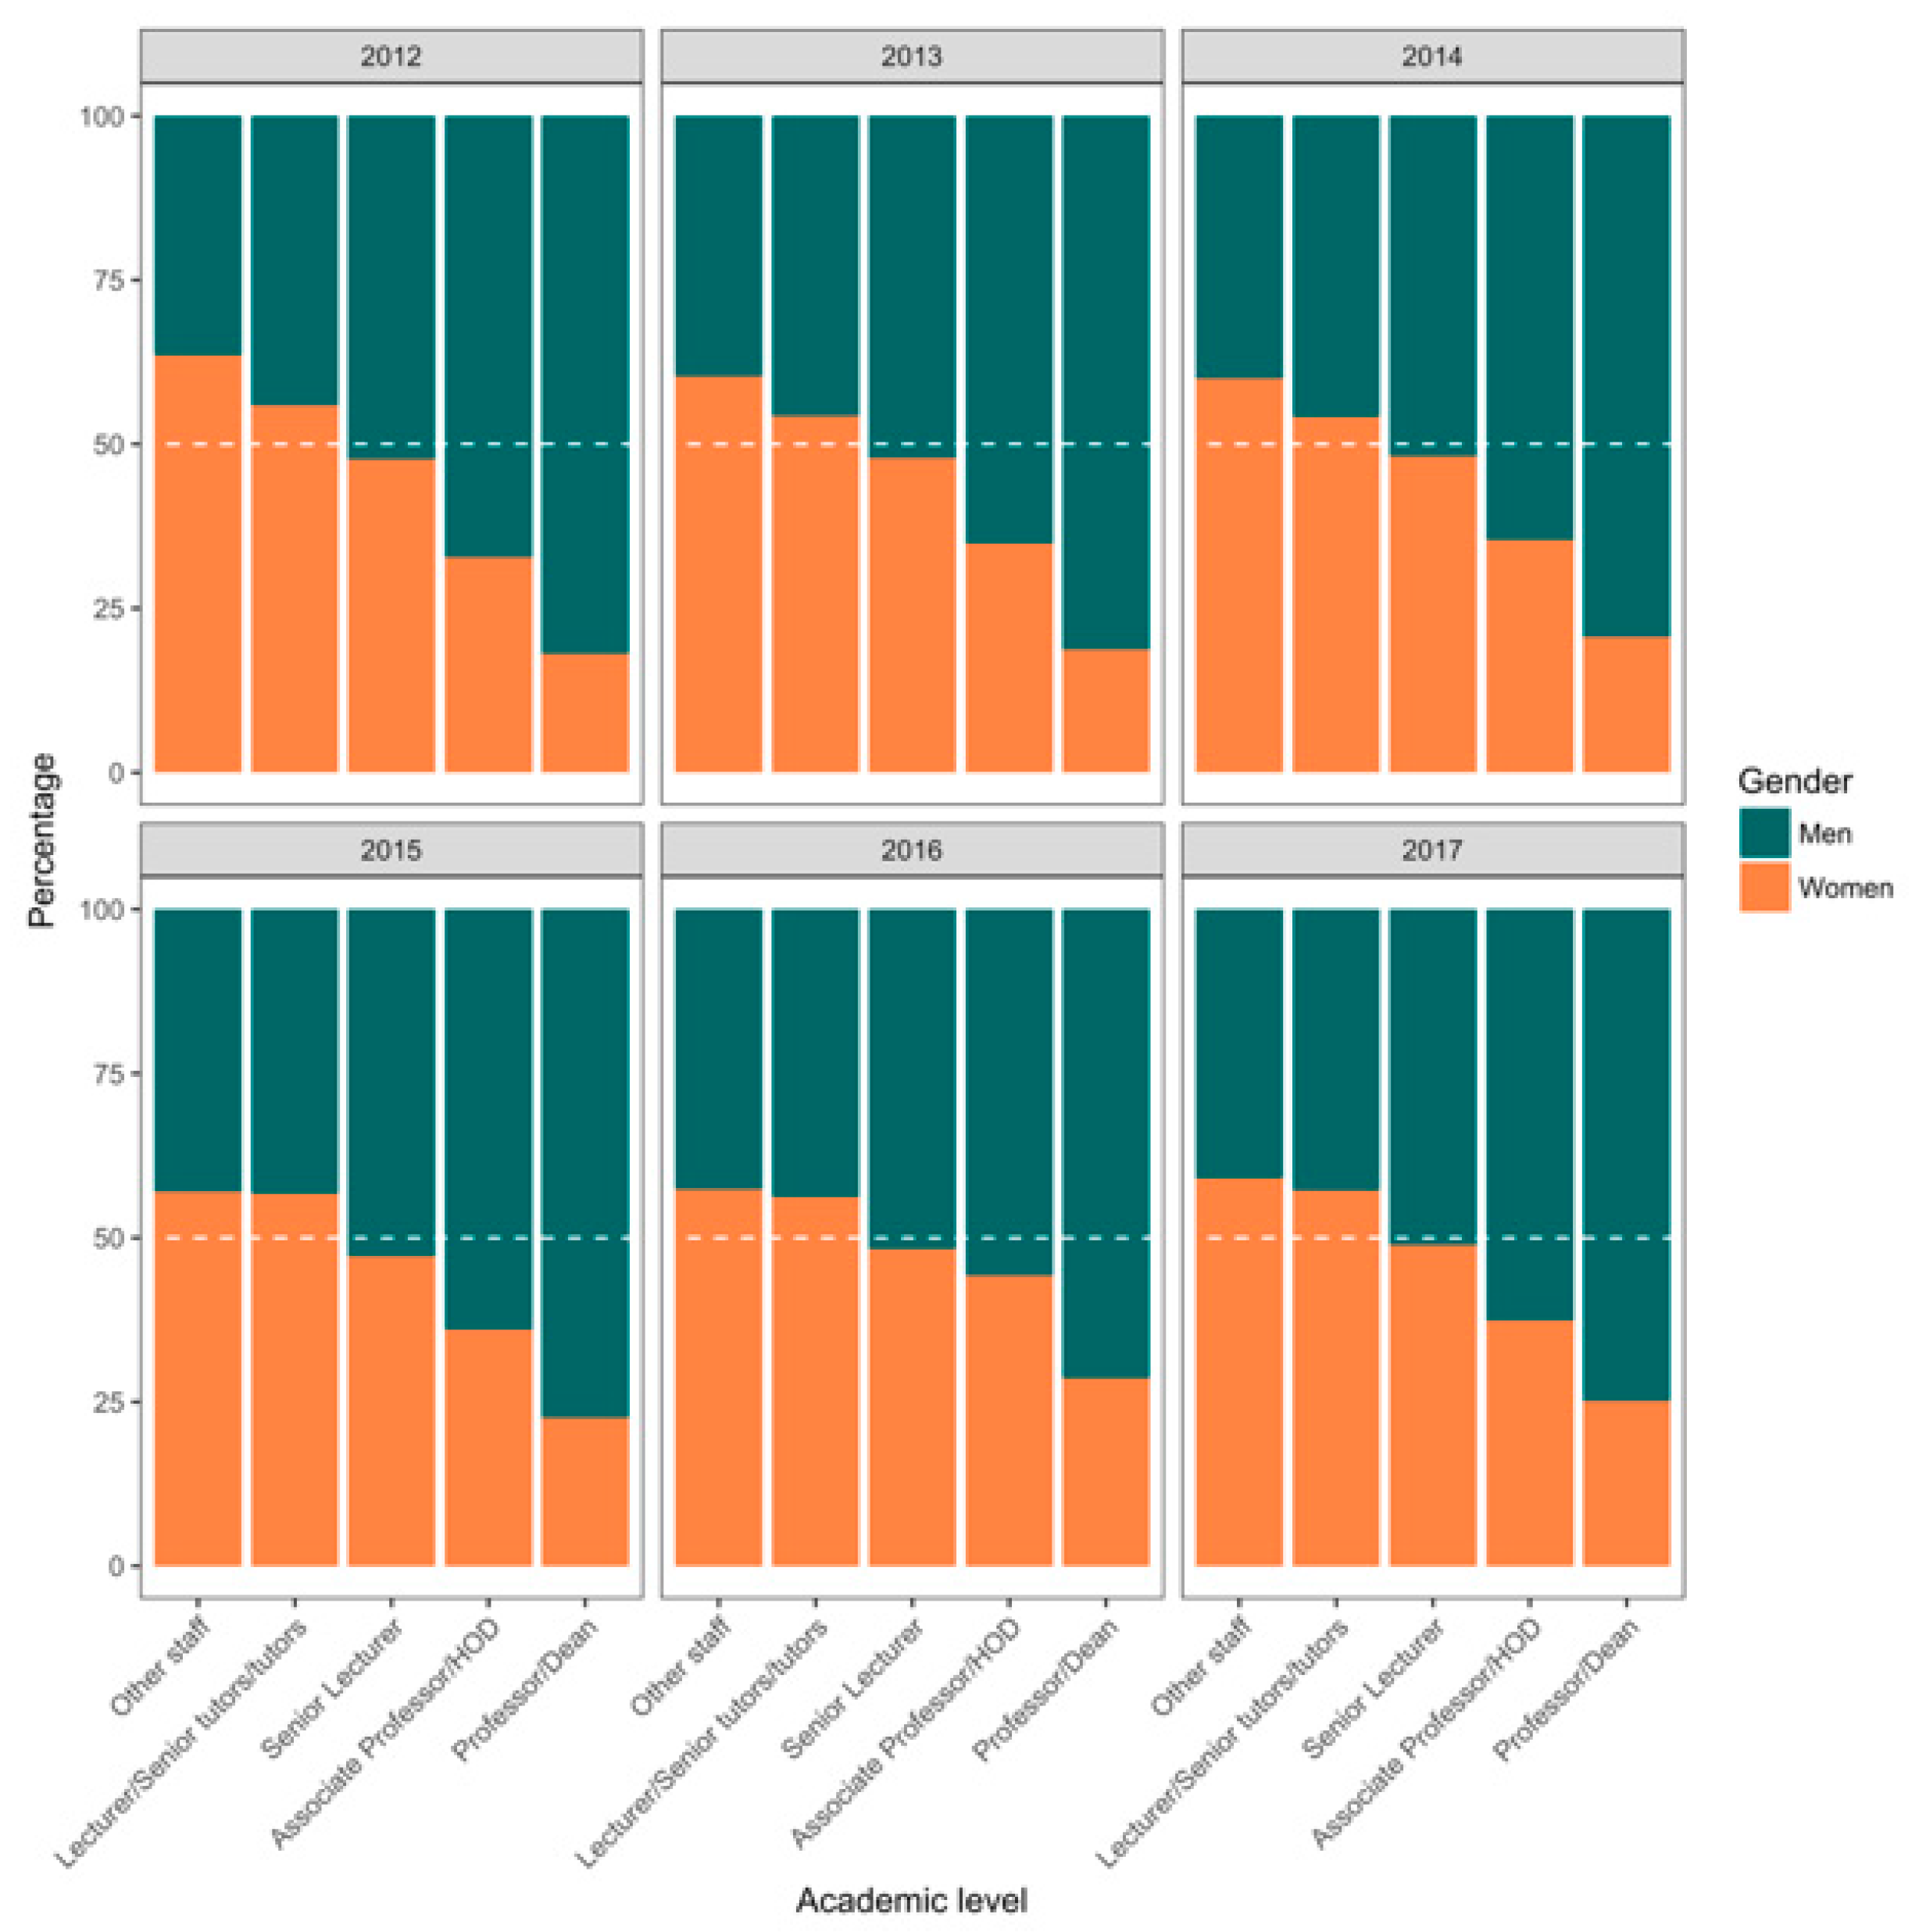
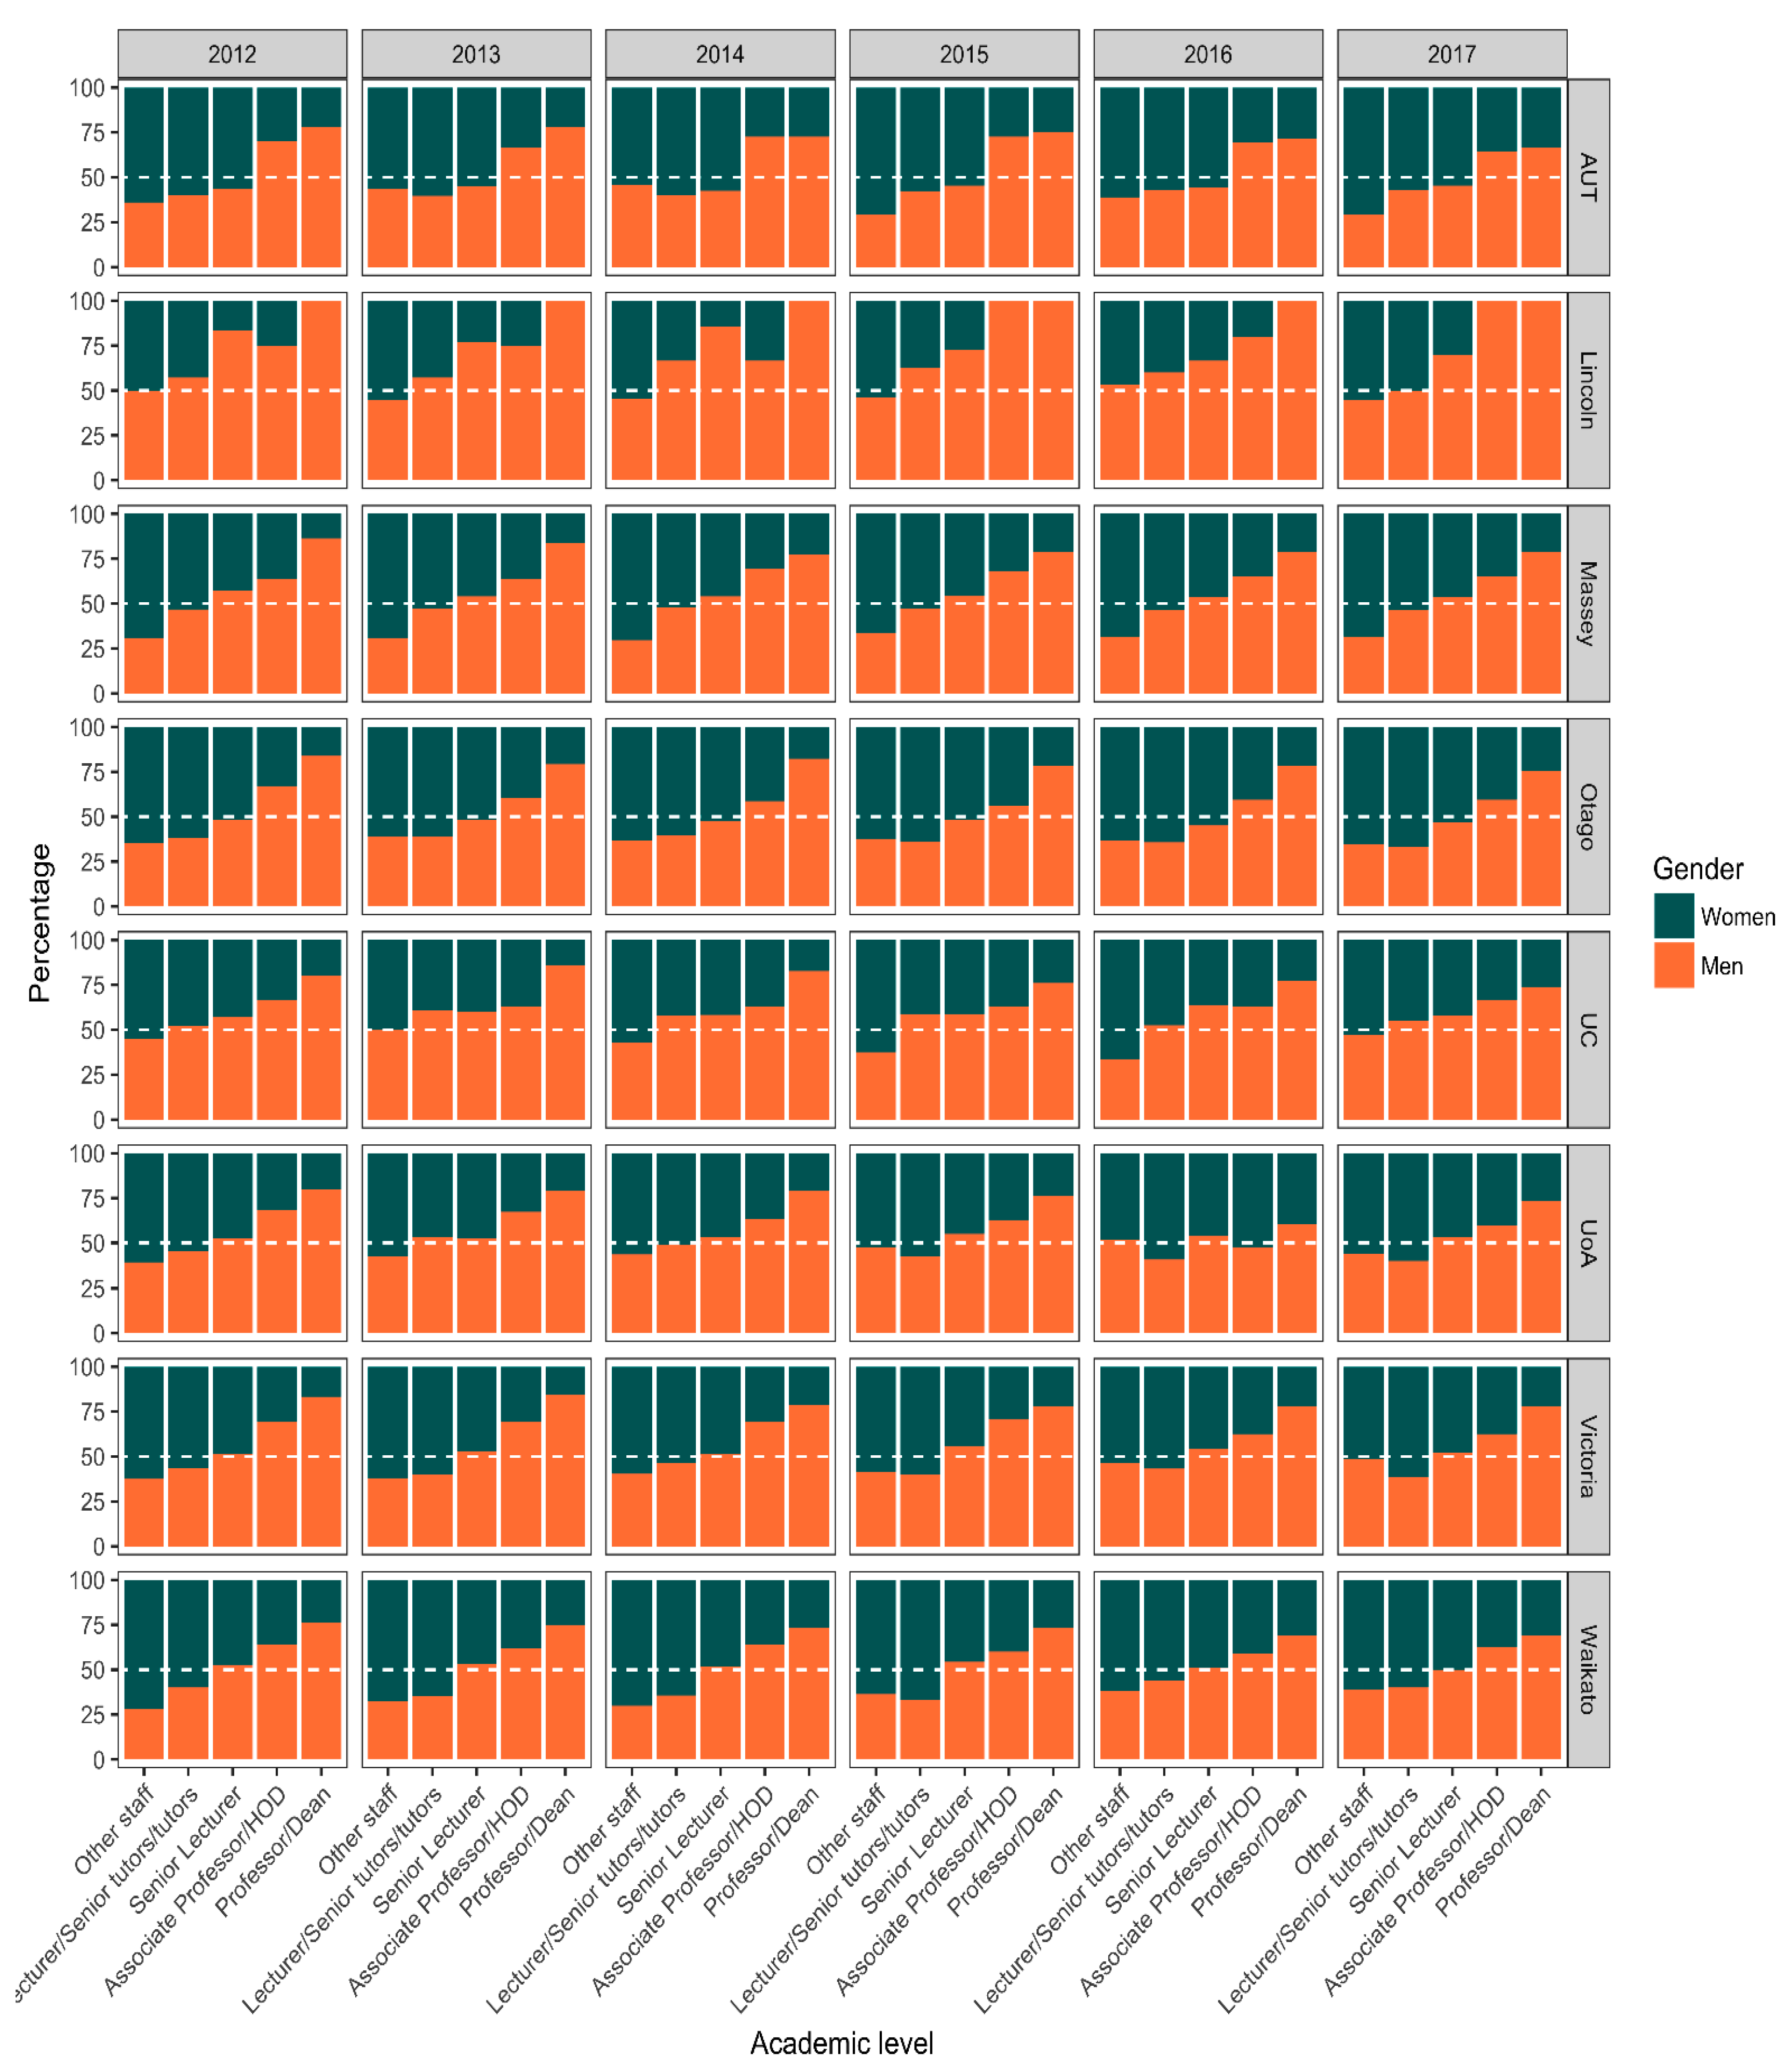
3.2.1. Are Men and Women Equally Represented at All Levels of Academic Staff within NZ Universities?

Women dominate at the lower levels of the academic scale, while men dominate more senior levels. This pattern has persisted over six years (Figure 4; complete plots for 2012–2017 available in Appendix B). Women comprised over 50% of other academic staff and lecturers/senior tutors/tutors (Figure 4). However, men made up 64%–69% of associate professors/HODs over the 6-year period and 74%–81% of professors/deans (Figure 4).
These patterns are consistent across all institutions (Figure 5). At higher levels of seniority, the percentage of men increases, and the percentage of women decreases (Figure 4 and Figure 5). Notably, according to these data, all professors/deans at Lincoln University were men and in two of the six years this university did not report any women in associate professor/HOD roles (Figure 5).

3.2.2. Do Women Advance at the Same Rate as Men?

Our model estimates that 8.2% (standard error = 1.6) of academic men are promoted each year, compared with 6.8% of academic women. As shown in Figure 6, at each academic level, actual and predicted staff numbers are not dramatically different, suggesting the model does a reasonable job of capturing the dynamics of staff numbers. In the course of developing this model, we found that only a small proportion of the gap in the number of men and women at different academic levels could be attributed to differences in age (Appendix C).
At the lecturer level, counterfactual female staff numbers are, by definition, equal to predicted female staff numbers, because there is no lower level from which staff may be promoted (Figure 6a). The senior lecturer panel shows that lower female rates of promotion from lecturer to senior lecturer are a major factor in the lower number of female senior lecturers; if female lecturers had been promoted at the estimated male promotion rate since 2012, by 2017 the gender gap at the senior lecturer level would have largely closed (Figure 6b).
The difference in the rate of promotion for men and women from senior lecturer to associate professor is a somewhat smaller but still important factor in the lower number of female associate professors; the 2017 gender gap would have been about a third smaller under the counterfactual scenario (Figure 6c). However, the lower rate of promotion for women from associate professor to professor has a limited impact on the number of female professors in 2017 because there are few female associate professors available to be promoted (Figure 6d).
Note, however, that these calculations should be treated with caution and considered indicative only because they are generated from aggregate data; the actual promotion of individuals cannot be observed.

4. Discussion

While there has been and continues to be an increase in the proportion of female academic staff at Aotearoa New Zealand’s eight universities, the degree of improvement varies significantly between institutions. Lincoln University and the University of Canterbury had the lowest proportions of total academic women in 2017 with 28.6% and 34.8%, respectively. However, while other universities had more equitable academic work forces in 2017, the proportion of women decreases at higher academic levels across all institutions, with women making up between a quarter and a third of the senior academic staff. Furthermore, the underrepresentation of women at higher academic levels is not driven by female academics being younger and thus earlier in their careers; the difference in age distributions of male and female academics explains only a small proportion of their differences in seniority. This result complements Brower and James’ [15] findings that academic women move up academic ranks more slowly even when controlling for research performance.
On our current trajectory, we may expect gender parity in the overall academic workforce in the 2030s. This estimate is greater than that produced for the University of Auckland (estimated 2026; 95% confidence interval: 2024, 2028) [62] but much more optimistic than other projections [15]. We suspect that our estimate is optimistic, especially given that the rate of improvement seems to be slowing. It may be that institutions have reduced motivation to sustain initiatives as equity is perceived to improve. Alternatively, higher early rates of improvement may have been driven by fields in which such improvements were easier to achieve; perhaps these fields were already more heavily populated by women or the fields themselves were more amenable to change.
While our primary concern is with the national picture, we believe that it is still productive to consider institution-level differences and how they may contribute to the variation we observe in the number employed at different universities. We found that the universities with greatest overall parity were also the youngest institutions, excluding Lincoln University. Massey University, Auckland University of Technology and the University of Waikato were all established as independent universities in the twentieth century, while the others originated in the nineteenth century. Older universities are saddled with a pre-existing, male-skewed academy (also known as “demographic inertia” [63]). By contrast, male and female workforces at younger institutions grow from the same position. This difference will be especially marked if this initial growth period is characterized by institutions taking on staff earlier in their careers, who are likely to give more years to that university. In this way, they would be sampling from a less male-dominated pool. However, these younger universities perform no better than their older counterparts when it comes to the number of senior academic women.
Indeed, the apparent improvement in the overall proportion of academic women on full-time contracts masks significant differences in the promotional pathways of men and women. Across all institutions, early-stage academics were consistently skewed towards women while professors were largely male, with senior lecturer being the tipping point for most universities. In this way, while Aotearoa New Zealand institutions are approaching parity numerically, these statistics mask significant differences in the structural power that academic men and women collectively hold.
The predominance of women on the lower rungs of the academic ladder is unsurprising given that women seem to progress more slowly through their academic careers than men. While we are not able to identify the specific mechanisms generating this pattern, the suite of potential factors is well documented: scepticism of women’s abilities [64], preference of selection panels for individuals that are similar to them [65]; sexual harassment [66]; and challenges that result from having greater domestic responsibilities, amongst others. Women are also more likely to be involved in teaching, pastoral care and other departmental activities [30,40,67,68]. In Aotearoa New Zealand, contributions are accounted for in the PBRF system as “peer esteem” and “contribution to the research environment”. However, these factors carry significantly less weight (0.15 each compared to 0.7 for “research output”). Cumulatively, women and other under-represented groups are doubly punished for taking on additional responsibilities that are unlikely to generate prestige within the field or directly contribute to research [30]. Yet even for those women who improve their PBRF scores, research performance has not translated into a greater representation at the top of the academic ladder [15].
We were surprised to find that the growth in the academic workforce between 2002 and 2017 can almost entirely be attributed to an increase in the number of staff employed on part-time contracts. In general, women make up a slight majority of the part-time academic workforce although this varies between universities. Unfortunately, we did not have access to data on the age and level distributions of part-time staff; the distribution of men and women across these cohorts may be quite different. Temporary transitions to part-time can be beneficial for women needing to balance work and life commitments, but there is evidence that it can impact career advancement, and the scale of these impacts can depend on whether women begin in part-time or full-time employment [27,69,70].
We similarly do not have data on the duration of employment in either full-time or part-time work and consequently cannot investigate the conditions in which academics retire. However, we know that, in 2017, academics above the age of 65 constituted 9.56% of the full-time academic workforce. While Aotearoa New Zealand does not have an official retirement age, most superannuation schemes begin to pay out at 65 and hence retirement becomes more viable. Understanding the role and experiences of older academics who make up a substantial portion of the academic workforce will be critical particularly given the cumulative impacts of the gender pay gap [15].
Indeed, the increase in the number of part-time contracts indicates that it may be time to critically analyse the broader ecosystem of academic employment and to better trace the transitions individuals make between modes of work throughout their academic careers and accounting for academics on part-time and fixed-term contracts [42]. Casualisation of the academic workforce has been a decades-long process and is only likely to worsen with further privatisation and commodification of higher education [71], with younger researchers being particularly vulnerable to exploitation. As previously mentioned, our data do not include post-doctoral researchers who are counted as “research staff” rather than “academic staff”. Post-doctoral positions are temporary by nature and scarce in Aotearoa New Zealand [72], and career interruptions make this period particularly fraught for some.
Given these common interruptions, Diezmann and Grieshaber [73] characterize five career profiles for academic women. This is in contrast to the “ideal” full-time and uninterrupted career trajectory that Thornton [74] refers to as “Benchmark man”. This character illustrates the widely shared, traditionally masculine, view of what a “good academic” is, chiefly that a good academic is productive and singularly minded above all else [75]. Metrics, such as the PBRF, which prioritise traditional, research-focused measures of success over other contributions, are complicit in entrenching this perspective, perpetuating pre-existing inequities [46]. For example, between the 2003 and 2012 PBRF rounds, the age of New Zealand’s academic workforce increased significantly with universities hiring fewer young academics without a clear track record of publications, just one change evidencing a clear pivot by universities towards a focus on short-term, individual researcher productivity [59]. This conception of academic merit situates the able-bodied, cisgendered, straight, white man’s experience as the norm and therefore positions the experience of women, and indeed of all minorities within the academy, as a deviation from expectations. Therefore, helping women to succeed according to these metrics is to render women’s perspective as invisible [33] and to recreate the same power structure with an all-must-fit-one-size approach.
Throughout this work, we wish to reiterate that gender is but one source of inequality within the academy. Indigenous and non-white academics face a suite of barriers to career advancement that intersect with issues of gender to create their own inequities [76]. In Aotearoa New Zealand, Māori and Pasifika scholars make up approximately 5% and 1.7% of the academic workforce, respectively, and are virtually absent from senior positions [6,7]. Indeed, while equity initiatives have historically increased the number of European women at Aotearoa New Zealand’s universities, they have not done the same for “coloured women” [47]. We challenge universities to consider diversity more holistically at an institutional level and to recognize the importance of accessibility and the experiences of a range of identities including those related to race and sexual orientations, as well as gender diversity, especially for people who exist at the intersections of multiple identities.
While the Universities NZ Women in Leadership program has a track record of creating support networks and improving the confidence of female academics [36,38], we argue that additional initiatives are required to properly address the lack of senior academic women in Aotearoa New Zealand’s universities. It will also be vital to demonstrate the full impact of these initiatives beyond individual evaluations. While it is difficult to measure the impact of these programs in absolute numbers, they may be detectable through step changes in the rate of growth prior to and following the program beginning. It may also be productive to audit faculty management systems and culture to determine the extent to which they support university-level equity policies. Without an alignment between intention and system function, diversity strategies cannot be effectively actioned [77].
While mentoring programs are vital to creating a critical mass of academic women, they both place the task of supporting minorities at the feet of that same group and ask senior women to coach junior women in succeeding under the very conditions that created the inequities. Yet perhaps because they do not directly challenge pre-existing power structures, mentoring programs are widely used and are beneficial for their participants [39,42]. In this way, programs like NZUWiL may provide the critical scaffold for women to introduce other interventions and directly critique the academic system [78,79,80,81].
One such critique may include a review of the metrics used to audit academics, beginning with the PBRF methodology, which places very little value on non-research contributions by academic staff [37] and has arguably contributed to universities taking on fewer young academics, raising serious questions about the sustainability of some research portfolios [82]. The fact that the current merit system favours white men is well-established [83]. We must find ways to value contributions that are under-valued in the current system, such as pastoral care or community support, and establish processes to improve application of the concept of merit relative to opportunity. Academic men often accumulate more indicators of prestige, such as invitations to speak at conferences, earlier in their careers, both because they get more invitations [28] and because they may be in a better position to accept invitations with fewer domestic demands and better funding. Finding ways to circumvent a biased system will help women and other minorities progress faster in their careers.
Interventions to address gender inequity overseas have produced mixed results [84,85,86,87], but we must advocate for active strategies to enhance career progression for women in order to address the clear and persistent imbalances at the top of the academic ladder. Inequalities are complicated in any workplace [88] and real change requires both cultural and structural change. As the number of women in seniority approaches a critical mass, it may be time to actively engender such a cultural change [80] beyond mentoring towards re-evaluating conceptions of merit and the worth of traditionally feminized roles (such as pastoral care and teaching), and making space for a range of career trajectories will allow women to progress at a rate closer to that of their male peers. Targets for departments, schools, institutes, faculties and universities will help focus efforts where they are needed within each institution, although these must be combined with a clear understanding of how management systems may support these aspirations [35,77]. While childbearing has a disproportionate impact on the careers of women and women in their childbearing years need additional support, these impacts are not the only barrier to women’s career progression [89]. Coupling cultural and structural change with existing mentoring and leadership programs and incorporating research-informed policies and processes around childbearing, caregiver responsibilities and merit relative to opportunity, for example, in universities, provides real opportunity for Aotearoa New Zealand. With a small population, Aotearoa New Zealand is ideally placed to address the gender imbalance in its eight universities in the next two decades.

Author Contributions

Conceptualization, L.W., I.S., C.M.-N., K.H. and T.M.; methodology, L.W., I.S., C.M.-N., K.H. and T.M.; data curation, T.M.; formal analysis, L.W., I.S. and T.M.; writing—original draft preparation, L.W., I.S., C.M.-N., K.H. and T.M.; writing—review and editing, L.W., I.S., C.M.-N., K.H. and T.M.; visualization, L.W., I.S. and T.M.; supervision, L.W. and T.M.; project administration, L.W. All authors have read and agreed to the published version of the manuscript.

Funding

C.M.-N., T.M., I.S. and K.H. are funded by Te Pūnaha Matatini and C.M.-N. also receives funding from a Rutherford Discovery Fellowship (RDF-UOA1504).

Acknowledgments

We wish to acknowledge the Ministry of Education for providing the data included in this study and Te Pūnaha Matatini for supporting this work. We are grateful to our reviewers for their recommendations which have improved the manuscript.

Conflicts of Interest

The authors declare no conflict of interest.

Appendix A

In this analysis we used aggregated data to estimate rates of promotion for men and women in academia and construct a counterfactual of how the number of female academics at different levels would have evolved between 2012 and 2017 if they had been subject to the same rate of promotion as male academics. We omitted the academic level “Other academic staff/Tutorial assistants” because such staff may be on a different career trajectory.
To estimate rates of promotion, we ran an ordinary least squares regression of the number of academics of the gender, age group, and academic level in the year on. We used the coefficients from these regressions to estimate rates of promotion for men and women.
The actual number of people of the gender and age group, one level lower and one year earlier (lower_lag);
The actual number of women of the gender and age group, one level lower and one year earlier (lower_lag_female);
The predicted number of staff in the category based on the previous year’s number minus those expected to age out of the age category but plus those predicted to age into the age category, interacted with academic level;
  • A female dummy interacted with academic level;
  • A dummy for 2016, when data definitions changed, interacted with level; and
  • Fixed effects for level.
  • The model makes two simplifying assumptions. Firstly, we assumed that the rate of promotion does not vary within gender at each level. Secondly, we did not explicitly model being promoted out of a level, although this is allowed for.
We interpreted the coefficient on lower_lag as the rate of promotion faced by men; the estimated rate of promotion of women is the sum of the coefficients on lower_lag and on lower_lag_female. We constructed “predicted” staff levels by gender at each academic level by taking actual staff numbers in 2012 and applying the growth given by the model each year up to 2017. A comparison of these predicted values with actual values is a test of how well the functional form of the model fits the data. We then constructed “counterfactual” female staff levels at each academic level similarly, but using the male promotion rate given by the model rather than the female promotion rate. These counterfactual female data are an estimate of how the number of female academic staff at different levels would have changed between 2012 and 2017 if women had faced the same promotion rate as men.
For robustness, we repeated this analysis using the breakdown of staff by gender, ethnicity, university, and academic level (results not presented). The additional dimension of breakdown gave us higher statistical power in this version, but because staff are able to report multiple ethnicities, we consider the population totals generated in the preferred analysis to be more reliable. Estimated promotion rates using the alternative population breakdown were very similar.

Appendix B

Figure A1. The percentage of women and men at each academic level between 2012–2017 at each of Aotearoa New Zealand’s universities. “Other Staff” includes other academic staff and tutorial assistants, “Senior Lecturers” includes Principal Lecturers and “HOD” stands for Heads of Department.
Education 10 00152 g0a1

Appendix C

Do Gender Differences in the Age Distribution of Academic Staff Explain Why There Are Few Women at Senior Levels?

We found that age differences between men and women played only a minor role in the observed differences in academic level in 2012, and that the impact of age distribution was only over the following years. For example, in 2012, 19.0% of male academics were professors or deans compared with 5.3% of female academics. In the counterfactual scenario, we would expect 16.8% of female academics to be at this level. That is, differences in men and women’s age distributions explain only 2.2% (percentage actual men-percentage counterfactual women, i.e., 19.0%–16.8%) of the total observed difference (13.7%). By 2017, differences in age explained only 1.3% out of a total difference of 11.0% at the professorial level. At the associate professor level, the role of age differences had fallen to essentially zero by 2017.
Table A1. Results of analysis after applying a counterfactual based on male distributions across academic levels in the age groups of under 30, 30 to 49, 50 to 59, 60 to 64 and 65 and over, to data of female staff within the same age groups in 2012.
2012
Academic LevelActual % of MenActual % of WomenCounterfactual % of Women
Professors/Deans19.0%5.3%16.8%
Assoc. Professors/Heads of Department15.3%8.1%14.7%
Senior Lecturers/Principal Lecturers32.4%32.2%32.9%
Lecturers/Senior tutors/Tutors13.8%18.5%14.8%
Other academic staff/Tutorial assistants19.5%35.8%20.8%
Table A2. Results of analysis after applying a counterfactual based on male distributions across academic levels in the age groups of under 30, 30 to 49, 50 to 59, 60 to 64 and 65 and over, to data of female staff within the same age groups in 2017.
2017
Academic LevelActual % of MenActual % of WomenCounterfactual % of Women
Professors/Deans19.0%5.3%16.8%
Assoc. Professors/Heads of Department15.3%8.1%14.7%
Senior Lecturers/Principal Lecturers32.4%32.2%32.9%
Lecturers/Senior tutors/Tutors13.8%18.5%14.8%
Other academic staff/Tutorial assistants19.5%35.8%20.8%

References and Note

  1. Bridgman, T. Assassins in Academia? New Zealand Academics as “Critic and Conscience of Society” N. Z. Sociol. 2007, 22, 126–144. [Google Scholar]
  2. Education Act 1989 (New Zealand) 162 4(a)(v)
  3. Sugimoto, C.R. Global gender disparities in science. Nature 2013, 504, 211–213. [Google Scholar]
  4. Xu, Y.J. Gender Disparity in STEM Disciplines: A Study of Faculty Attrition and Turnover Intentions. Res. High. Educ. 2008, 49, 607–624. [Google Scholar] [CrossRef]
  5. Umbach, P.D. Gender equity in the academic labor market: An analysis of academic disciplines. Res. High. Educ. 2006, 48, 169–192. [Google Scholar] [CrossRef]
  6. Naepi, S. Why isn’t my professor Pasifika? A snapshot of the academic workforce in New Zealand universities. MAI J. N. Z. J. Indig. Scholarsh. 2019, 8, 219–234. [Google Scholar]
  7. McAllister, T.; Kidman, J.; Rowley, O.; Theodore, R. Why isn’t my professor Māori? A snapshot of the academic workforce in New Zealand universities. MAI J. N. Z. J. Indig. Scholarsh. 2019, 8, 236–249. [Google Scholar]
  8. Carr, P.L.; Raj, A.; Kaplan, S.E.; Terrin, N.; Breeze, J.L.; Freund, K.M. Gender Differences in Academic Medicine: Retention, Rank, and Leadership Comparisons From the National Faculty Survey. Acad. Med. 2018, 93, 1694–1699. [Google Scholar] [CrossRef]
  9. Ceci, S.J.; Ginther, D.K.; Kahn, S.; Williams, W.M. Women in Academic Science: A Changing Landscape. Psychol. Sci. Public Interest 2014, 15, 75–141. [Google Scholar] [CrossRef] [Green Version]
  10. Ginther, D.K.; Kahn, S. Women in Economics: Moving Up or Falling Off the Academic Career Ladder? J. Econ. Perspect. 2004, 18, 193–214. [Google Scholar] [CrossRef] [Green Version]
  11. Hill, B.; Secker, J.; Davidson, F. Achievement relative to opportunity: Career hijacks in the academy. Adv. Gend. Res. 2014, 19, 85–107. [Google Scholar]
  12. Association of Pacific Rim Universities. ‘2019 APRU Gender Gap Report’. University of Sydney. 2019. Available online: https://apru.org/wp-content/uploads/2019/07/2019-APRU-Gender-Gap-Report.pdf (accessed on 15 August 2019).
  13. Benschop, Y.; Brouns, M. Crumbling Ivory Towers: Academic Organizing and its Gender Effects. Gend. Work Organ. 2003, 10, 194–212. [Google Scholar] [CrossRef]
  14. Dwyer, K.M.; Clark, C.J.; MacDonald, K.; Paraskeva, M.A.; Rogers, N.; Ryan, J.; Webster, A.C.; Wong, G. Gender Equity in Transplantation: A Report from the Women in Transplantation Workshop of The Transplantation Society of Australia and New Zealand. Transplantation 2017, 101, 2266–2270. [Google Scholar] [CrossRef] [PubMed]
  15. Brower, A.; James, A. Research performance and age explain less than half of the gender pay gap in New Zealand universities. PLoS ONE 2020, 15, e0226392. [Google Scholar] [CrossRef] [PubMed]
  16. Amery, F.; Bates, S.; Jenkins, L.; Savigny, H. Metaphors on Women in Academia: A Review of the Literature, 2004–2013. In Advances in Gender Research; Demos, V., Texler Segal, M., Eds.; Emerald Group Publishing Limited: Bingley, UK, 2015; Volume 20, pp. 245–267. ISBN 978-1-78560-079-1. [Google Scholar]
  17. Bismark, M.; Morris, J.; Thomas, L.; Loh, E.; Phelps, G.; Dickinson, H. Reasons and remedies for under-representation of women in medical leadership roles: A qualitative study from Australia. BMJ Open 2015, 5, e009384. [Google Scholar] [CrossRef] [Green Version]
  18. Nonnemaker, L. Women Physicians in Academic Medicine—New Insights from Cohort Studies. N. Engl. J. Med. 2000, 342, 399–405. [Google Scholar] [CrossRef] [PubMed]
  19. Gumpertz, M.; Durodoye, R.; Griffith, E.; Wilson, A. Retention and promotion of women and underrepresented minority faculty in science and engineering at four large land grant institutions. PLoS ONE 2017, 12, e0187285. [Google Scholar] [CrossRef]
  20. Sege, R.; Nykiel-Bub, L.; Selk, S. Sex Differences in Institutional Support for Junior Biomedical Researchers. JAMA 2015, 314, 1175. [Google Scholar] [CrossRef] [Green Version]
  21. Lundberg, S.; Stearns, J. Women in Economics: Stalled Progress. J. Econ. Perspect. 2019, 33, 3–22. [Google Scholar] [CrossRef] [Green Version]
  22. Mairesse, J.; Pezzoni, M. Does gender affect scientific productivity? A critical review of the empirical evidence and a panel data econometric analysis for French physicists. Rev. Econ. 2015, 66, 65–113. [Google Scholar]
  23. Ferriman, K.; Lubinski, D.; Benbow, C.P. Work preferences, life values, and personal views of top math/science graduate students and the profoundly gifted: Developmental changes and gender differences during emerging adulthood and parenthood. J. Pers. Soc. Psychol. 2009, 97, 517–532. [Google Scholar] [CrossRef] [Green Version]
  24. Sieverding, M.; Eib, C.; Neubauer, A.B.; Stahl, T. Can lifestyle preferences help explain the persistent gender gap in academia? The “mothers work less” hypothesis supported for German but not for U.S. early career researchers. PLoS ONE 2018, 13, e0202728. [Google Scholar] [CrossRef] [PubMed]
  25. Adamo, S.A. Attrition of Women in the Biological Sciences: Workload, Motherhood, and Other Explanations Revisited. BioScience 2013, 63, 43–48. [Google Scholar]
  26. Wolfinger, N.H.; Mason, M.A.; Goulden, M. Problems in the Pipeline: Gender, Marriage, and Fertility in the Ivory Tower. J. High. Educ. 2008, 79, 388–405. [Google Scholar] [CrossRef]
  27. Knights, D.; Richards, W. Sex Discrimination in UK Academia. Gend. Work Organ. 2003, 10, 213–238. [Google Scholar] [CrossRef]
  28. Sardelis, S.; Drew, J.A. Not “Pulling up the Ladder”: Women Who Organize Conference Symposia Provide Greater Opportunities for Women to Speak at Conservation Conferences. PLoS ONE 2016, 11, e0160015. [Google Scholar] [CrossRef] [Green Version]
  29. Buckley, H.L.; Sciligo, A.R.; Adair, K.L.; Case, B.S.; Monks, J.M. Is there gender bias in reviewer selection and publication success rates for the. N. Z. J. Ecol. 2014, 38, 5. [Google Scholar]
  30. Jimenez, M.F.; Laverty, T.M.; Bombaci, S.P.; Wilkins, K.; Bennett, D.E.; Pejchar, L. Underrepresented faculty play a disproportionate role in advancing diversity and inclusion. Nat. Ecol. Evol. 2019, 3, 1030–1033. [Google Scholar] [CrossRef]
  31. Ehrenberg, R.G.; Jakubson, G.H.; Martin, M.L.; Main, J.B.; Eisenberg, T. Diversifying the faculty across gender lines: Do trustees and administrators matter? Econ. Educ. Rev. 2012, 31, 9–18. [Google Scholar] [CrossRef]
  32. Williams, W.M.; Mahajan, A.; Thoemmes, F.; Barnett, S.M.; Vermeylen, F.; Cash, B.M.; Ceci, S.J. Does Gender of Administrator Matter? National Study Explores U.S. University Administrators’ Attitudes About Retaining Women Professors in STEM. Front. Psychol. 2017, 8, 700. [Google Scholar] [CrossRef] [Green Version]
  33. Lipton, B. Measures of success: Cruel optimism and the paradox of academic women’s participation in Australian higher education. High. Educ. Res. Dev. 2017, 36, 486–497. [Google Scholar] [CrossRef]
  34. Gibney, E. UK gender-equality scheme spreads across the world. Nat. News 2017, 549, 143. [Google Scholar] [CrossRef] [PubMed] [Green Version]
  35. Winchester, H.P.M.; Browning, L. Gender equality in academia: A critical reflection. J. High. Educ. Policy Manag. 2015, 37, 269–281. [Google Scholar] [CrossRef]
  36. Universities New Zealand. New Zealand Universities Women in Leadership Programme (NZUWiL). Available online: https://www.universitiesnz.ac.nz/about-universities-new-zealand/expert-and-working-groups/new-zealand-universities-women-leadership (accessed on 13 May 2019).
  37. Ministry of Education. A History and Overview of the PBRF; Ministry of Education: Wellington, New Zealand, 2012.
  38. Cockburn, R.; Atkinson, L. Summary Interim Report; New Zealand Women in Leadership Programme; Lumin: Wellington, New Zealand, 2010. [Google Scholar]
  39. Harris, C.A.; Leberman, S.I. Leadership Development for Women in New Zealand Universities: Learning From the New Zealand Women in Leadership Program. Adv. Dev. Hum. Resour. 2012, 14, 28–44. [Google Scholar] [CrossRef]
  40. Hurst, J.; Leberman, S. New Zealand women in leadership: Opportunities and challenges. In Women and Leadership around the World; Madsen, S.R., Ngunjiri, F.W., Longman, K.A., Cherrey, C., Eds.; Information Age Publishing, Inc.: Charlotte, CA, USA, 2015; pp. 207–226. [Google Scholar]
  41. Buckles, K. Fixing the Leaky Pipeline: Strategies for Making Economics Work for Women at Every Stage. J. Econ. Perspect. 2019, 33, 43–60. [Google Scholar] [CrossRef] [Green Version]
  42. Rosser, S.V.; Barnard, S.; Carnes, M.; Munir, F. Athena SWAN and ADVANCE: Effectiveness and lessons learned. Lancet 2019, 393, 604–608. [Google Scholar] [CrossRef] [Green Version]
  43. Human Rights Commission. New Zealand Census of Women’s Participation 2012; Human Rights Commission: Auckland, New Zealand, 2012; ISBN 978-0-478-35637-3.
  44. Equal Opportunities Office. Equal Opportunities Office Statistics and Activities Report 2007; The University of Auckland: Auckland, New Zealand, 2007.
  45. Naepi, S.; McAllister, T.G.; Thomsen, P.; Leenen-Young, M.; Walker, L.A.; McAllister, A.L.; Theodore, R.; Kidman, J.; Suaaliia, T. The Pakaru ‘Pipeline’: Māori and Pasifika Pathways within the Academy. Nzaroe 2020, 24, 142. [Google Scholar] [CrossRef]
  46. Roa, T.; Beggs, J.R.; Williams, J.; Moller, H. New Zealand’s Performance Based Research Funding (PBRF) model undermines Maori research. J. R. Soc. N. Z. 2009, 39, 233–238. [Google Scholar] [CrossRef] [Green Version]
  47. Jones, D. Possibilities of Transformation: Discourses of Difference in Organisational Communication. Ph.D. Thesis, University of Waikato, Hamilton, New Zealand, 1998. [Google Scholar]
  48. The University of Auckland Key Statistics. Available online: https://www.auckland.ac.nz/en/about-us/about-the-university/our-ranking-and-reputation/key-statistics.html (accessed on 9 March 2020).
  49. Auckland University of Technology Annual Report 2018. Available online: https://www.aut.ac.nz/__data/assets/pdf_file/0006/264624/Annual-Report-2018-AUT.pdf (accessed on 9 March 2020).
  50. The University of Waikato Annual Report 2017. Available online: https://www.waikato.ac.nz/annualreport/2017/University-of-Waikato-Annual-Report-2017.pdf (accessed on 9 March 2020).
  51. Massey University Annual Report 2017. Available online: https://www.massey.ac.nz/massey/fms/About%20Massey/University-Management/documents/annual-report/massey-university-annual-report-2017.pdf?ED32BC3335191A5A35230F1A1D93401B (accessed on 1 June 2020).
  52. Wellington Victoria University of Wellington Annual Report 2018. Available online: https://www.victoria.ac.nz/__data/assets/pdf_file/0005/1739678/2018-annual-report.pdf (accessed on 9 March 2020).
  53. Canterbury University 2018 at a Glance. Available online: https://www.canterbury.ac.nz/media/documents/annual-reports/2-Annual-Report-2018-At-A-Glance.pdf (accessed on 9 March 2020).
  54. Lincoln University. Lincoln University Annual Report 2018; Lincoln University: Christchurch, New Zealand, 2018. [Google Scholar]
  55. University of Otago Annual Report. Available online: https://www.otago.ac.nz/about/official-documents/otago710847.pdf (accessed on 9 March 2020).
  56. Stringer, R.; Smith, D.; Spronken-Smith, R.; Wilson, C. New Zealand Sociology—“My entire career has been fixed term”: Gender and precarious academic employment at a New Zealand university (Humanities & Social Sciences Collection)—Informit. N. Z. Sociol. 2018, 33, 169. [Google Scholar]
  57. Ministry of Education. Tertiary Education Strategy 2014–2019; Ministry of Education: Wellington, New Zealand; Ministry of Business, Innovation and Employment: Wellington, New Zealand, 2014; ISBN 978-0-478-42255-9.
  58. Ministry of Education Counts. Available online: https://www.educationcounts.govt.nz/home (accessed on 9 March 2020).
  59. Education Services Workforce Questionnaires. Available online: http://services.education.govt.nz/steo/staffing-return-and-rs20/workforce-questionnaires/ (accessed on 9 March 2020).
  60. Mazerolle, M.J. AICcmodavg: Model Selection and Multimodel Inference Based on (Q)AIC(c), R Package Version 2.2-2; 2019. Available online: https://cran.r-project.org/package=AICcmodavg (accessed on 1 June 2020).
  61. History of the University of Auckland. Available online: https://www.calendar.auckland.ac.nz/en/info/history.html (accessed on 21 April 2020).
  62. Statistical Consulting Centre. University of Auckland Equity Profile 2014; Equity Office—Te Ara Tautika: Auckland, New Zealand, 2014. [Google Scholar]
  63. Baker, M. Career confidence and gendered expectations of academic promotion. J. Sociol. 2010. [Google Scholar] [CrossRef]
  64. Roberts, C. Advancing Women Leaders in Academe: Creating a Culture of Inclusion. Handb. Res. Adm. PolicyLeadersh. High. Educ. 2017, 256–273. [Google Scholar] [CrossRef]
  65. Alex, J.; Rose, C.; Plank Michael, J. Gender and societies: A grassroots approach to women in science. R. Soc. Open Sci. 2019, 6, 190633. [Google Scholar] [CrossRef] [Green Version]
  66. Schroen, A.T.; Brownstein, M.R.; Sheldon, G.F. Women in Academic General Surgery. Acad. Med. 2004, 79, 310–318. [Google Scholar] [CrossRef] [PubMed]
  67. Misra, J.; Smith-Doerr, L.; Dasgupta, N.; Weaver, G.; Normanly, J. Collaboration and Gender Equity among Academic Scientists. Soc. Sci. Basel 2017, 6, 25. [Google Scholar] [CrossRef] [Green Version]
  68. Xie, Y.; Shauman, K.A. Women in Science: Career Processes and Outcomes; Harvard Univ. Press: Cambridge, MA, USA, 2009; ISBN 978-0-674-01034-5. [Google Scholar]
  69. Bailey, J.; Troup, C.; Strachan, G. Part-time work and advancement: A study of female professional staff in Australian universities. J. High. Educ. Policy Manag. 2017, 39, 282–295. [Google Scholar] [CrossRef]
  70. Mason, M.A.; Wolfinger, N.H.; Goulden, M. Introduction. In Do Babies Matter? Gender and Family in the Ivory Tower; Rutgers University Press: New Brunswick, NJ, USA, 2013; pp. 1–7. ISBN 978-0-8135-6081-6. [Google Scholar]
  71. Roberts, P. The Future of the University: Reflections from New Zealand. Int. Rev. Educ. 1999, 45, 65–86. [Google Scholar] [CrossRef]
  72. Nicholls, L. Where Have All the Postdocs Gone? The Blockage in Our Science “Talent Pipe”. Available online: https://www.noted.co.nz/currently/currently-science/where-have-all-the-postdocs-gone-the-blockage-in-our-science-talent-pipe (accessed on 9 September 2019).
  73. Diezmann, C.; Grieshaber, S. Critical Events and Academic Women’s Career Profiles. In Women Professors: Who Makes It and How? Diezmann, C., Grieshaber, S., Eds.; Springer: Singapore, 2019; pp. 169–210. ISBN 9789811336850. [Google Scholar]
  74. Thornton, M. The Liberal Promise: Anti-Discrimination Legislation in Australia; Oxford Univ. Press: Melbourne, Australia, 1990; ISBN 978-0-19-553204-3. [Google Scholar]
  75. Berg, L.D. Gender equity as ‘boundary object’: …or the same old sex and power in geography all over again? Can. Geogr. 2002, 46, 248–254. [Google Scholar] [CrossRef]
  76. Wanelik, K.M.; Griffin, J.S.; Head, M.; Ingleby, F.C.; Lewis, Z. Breaking barriers: The effect of protected characteristics and their intersectionality on career transition in academics. BioRxiv 2019, 593905. [Google Scholar] [CrossRef] [Green Version]
  77. Dansky, K.H.; Weech-Maldonado, R.; De Souza, G.; Dreachslin, J.L. Organizational Strategy and Diversity Management: Diversity-Sensitive Orientation as a Moderating Influence. Health Care Manag. Rev. 2003, 28, 243–253. [Google Scholar] [CrossRef]
  78. Chesler, N.C.; Chesler, M.A. Gender-Informed Mentoring Strategies for Women Engineering Scholars: On Establishing a Caring Community. J. Eng. Educ. 2002, 91, 49–55. [Google Scholar] [CrossRef] [Green Version]
  79. Neale, J. Making a Difference: National and Local Initiatives for Gender Equity in New Zealand. In Gendered Success in Higher Education: Global Perspectives; White, K., O’Connor, P., Eds.; Palgrave Macmillan UK: London, UK, 2017; pp. 175–193. ISBN 978-1-137-56659-1. [Google Scholar]
  80. Kanter, R.M. Men and Women of the Corporation; Basic Books: New York, NY, USA, 1977; ISBN 978-0-465-04452-8. [Google Scholar]
  81. Chesterman, C.; Ross-Smith, A.; Peters, M. The Gendered Impact on Organisations of a Critical Mass of Women in Senior Management. Policy Soc. 2005, 24, 69–91. [Google Scholar] [CrossRef] [Green Version]
  82. Tertiary Education Union. Improving Research Quality: The Interim Results of the PBRF 2018 Quality Evaluation; Tertiary Education Union: Melbourne, Australia, 2019. [Google Scholar]
  83. Bagilhole, B.; Goode, J. The Contradiction of the Myth of Individual Merit, and the Reality of a Patriarchal Support System in Academic Careers: A Feminist Investigation. Eur. J. Women’s Stud. 2001, 8, 161–180. [Google Scholar] [CrossRef]
  84. Barnard, S. The Athena SWAN Charter: Promoting Commitment to Gender Equality in Higher Education Institutions in the UK. In Gendered Success in Higher Education: Global Perspectives; White, K., O’Connor, P., Eds.; Palgrave Macmillan UK: London, UK, 2017; pp. 155–174. ISBN 978-1-137-56659-1. [Google Scholar]
  85. Gregory-Smith, I. Positive Action towards Gender Equality: Evidence from the Athena SWAN Charter in UK Medical Schools. Br. J. Ind. Relat. 2018, 56, 463–483. [Google Scholar] [CrossRef]
  86. Caffrey, L.; Wyatt, D.; Fudge, N.; Mattingley, H.; Williamson, C.; McKevitt, C. Gender equity programmes in academic medicine: A realist evaluation approach to Athena SWAN processes. BMJ Open 2016, 6, e012090. [Google Scholar] [CrossRef] [PubMed] [Green Version]
  87. Ovseiko, P.V.; Chapple, A.; Edmunds, L.D.; Ziebland, S. Advancing gender equality through the Athena SWAN Charter for Women in Science: An exploratory study of women’s and men’s perceptions. Health Res. Policy Syst. 2017, 15, 12. [Google Scholar] [CrossRef] [Green Version]
  88. Stamarski, C.S.; Son Hing, L.S. Gender inequalities in the workplace: The effects of organizational structures, processes, practices, and decision makers’ sexism. Front. Psychol. 2015, 6. [Google Scholar] [CrossRef] [Green Version]
  89. Klocker, N.; Drozdzewski, D. Commentary: Career progress relative to opportunity: How many papers is a baby “worth”? Fac. Sci. Pap. (Arch.) 2012, 1271–1277. [Google Scholar] [CrossRef] [Green Version]
Figure 1. The overall percentage of women and men among part-time and full-time academic staff at Aotearoa New Zealand’s universities from 2002 to 2017. Dashed white line indicates parity (50%).
Education 10 00152 g001
Figure 2. The percentage of women and men among part-time and full-time academic staff at each of Aotearoa New Zealand’s universities from 2002–2017. Dashed white line indicates parity (50%). University names are abbreviated as per Table 1.
Education 10 00152 g002
Figure 3. Changes in the percentage of full-time female academic staff from 2002 to 2017 and the predicted trajectory (orange line) based on a simple linear regression of y = 0.373β1–710 (adjusted-R2 = 0.835) with ±1SE.
Education 10 00152 g003
Figure 4. The percentage of women and men at each academic level from 2012–2017 across all of Aotearoa New Zealand’s universities. “Other staff” includes other academic staff and tutorial assistants, “Senior Lecturers” includes Principal Lecturers and HOD stands for Heads of Department. Dashed white line indicates parity (50%).
Education 10 00152 g004
Figure 5. The percentage of women and men at each academic level in 2012 and 2017 at each of Aotearoa New Zealand’s universities. “Other staff” includes other academic staff and tutorial assistants, “Senior Lecturers” includes Principal Lecturers and HOD stands for Heads of Department. Full plots for 2012–2017 presented in Appendix B.
Education 10 00152 g005
Figure 6. Plots showing the actual (solid line), predicted (long dash), and counterfactual (brown, short dash) numbers of male (green) and female (orange) academic staff at the levels of (a) lecturer, (b) senior lecturer, (c) associate professor and (d) professor.
Education 10 00152 g006
Table 1. Characteristics of Aotearoa New Zealand’s eight universities. Data collected from university calendars.
YearNameEstablishedCity # Full-time Students# Full-time Academic Staff
2018 [48]University of Auckland (UOA) 1883Auckland21,1081596
2018 [49]Auckland University of Technology (AUT)2000 1Auckland20,0131177
2017 [50]University of Waikato (UW)1964Hamilton12,229599
2017 [51]Massey University (Massey)1927Palmerston North, Auckland, Wellington98921413
2018 [52]Victoria University of Wellington (VUW)1897Wellington17,7631090
2018 [53]University of Canterbury (UC)1873Christchurch14,070777
2017 [54]Lincoln University (LU)1990 2 Christchurch2695294.1
2018 [55]University of Otago (UO)1869Dunedin21,1081596
1 AUT was first established as a technical college in 1895. It formally received university status in 2000. 2 Lincoln University has been associated with several other institutions over time, including the University of Canterbury. It formally separated in 1990.
Table 2. Percentage of men and women among full-time and part-time academic staff at each of Aotearoa New Zealand’s universities in 2017.
Part-timeFull-time
UniversityWomenMenWomenMen
Auckland University of Technology64.4%35.6%45.4%54.6%
Lincoln University53.3%46.7%28.6%75.0%
Massey University63.1%36.9%44.0%56.0%
University of Auckland50.8%49.2%43.4%56.2%
University of Canterbury50.0%50.0%34.8%65.2%
University of Otago59.7%40.3%45.4%54.6%
University of Waikato54.3%45.7%28.6%75.0%
Victoria University of Wellington52.9%47.7%44.0%56.0%

