1. Introduction
The abundance of scientific literature reveals the necessity for a reliable, precise and relevant bankruptcy prediction model. According to
Aruldoss et al. (
2015),
Cultrera and Bredart (
2016),
Salehi and Davoudi Pour (
2016), the information rendered by bankruptcy forecasting models is bounded to separate industries.
Alaka et al. (
2018),
Schonfeld et al. (
2018),
Svabova and Kliestik (
2018), and
Slefendorfas (
2016) believe that the traditional bankruptcy prediction models are not suited to analyzing modern enterprises because the dynamic macroeconomic environment and business are interdependent. As a result, different economic environments possess diverse characteristics that restrict a repeated application of models and sets of related factors under different conditions. The scientific literature and statistical trends show that the issue of minimizing the trends of an increasing number of bankruptcies in Lithuania is becoming especially relevant and, in this context, the necessity emerges of identifying ways to improve the reliability of bankruptcy prediction models, given changing economic circumstances. The objective of this research is to assess the efficiency of the application of bankruptcy prediction models to companies in the construction sector using macroeconomic indicators.
It is noteworthy to mention that the lack of research oriented towards bankruptcy prediction in a specific sector, including macroeconomic indicators that affect solely those companies, exists not only on the theoretical level, but also on the practical level. Even though, numerous research has been conducted in pursuance to find the most effective methods for forecasting financial bankruptcy. According to the analysis of scientific literature, research both of a theoretical and practical nature has been performed, focusing on early signs (
Amoa-Gyarteng 2014;
Karas and Reznakova 2013), factors and reasons for a bankruptcy (
Uhrig-Homburg 2005;
Carter and Auken 2006). New bankruptcy prediction models were being created (
Etemadi et al. 2009;
Li et al. 2011), their advantages and limitations of application were analyzed (
Chou et al. 2017;
Sung et al. 1999), and an integrated methodology for bankruptcy prediction was composed (
Shin and Lee 2002;
Kumar and Ravi 2007).
The construction sector of Lithuania has been chosen for the research not only due to the rapidly increasing number of bankruptcies of the companies in this sector, but also due to the specific financial aspects related to construction agreements and financial risk. In respect to the features that are typical to the construction industry, this sector’s financial characteristics differ from other industry branches. When assessing and analyzing companies’ financial data and meanings of the bankruptcy prediction indicators, it is essential to consider several specific aspects applicable to the accounting and data depiction in the financial statements of companies operating in the construction sector. The most significant aspects include advance payments, ongoing contracts, terms and conditions for customer indebtedness, and registration of debts to suppliers, which directly impact the company’s revenue and cost results. As indicated by International Accounting Standards, considering the stages of activity completion set in the contract, revenue and expenses must be attributed to the reporting period when the contract activity was being implemented. However, when performing activities under construction contracts, the advance is paid prior to the completion of the respective activity. As a result, they are being registered on the liability side of the balance sheet, as a commitment to implement certain tasks, whereas the costs of future periods are not recorded as expenses but instead recognized as assets in ongoing contracts. Such accounting specifics indicate that during the performance of contractual construction activities, substantial liabilities and costs are to be seen in the company’s financial statements, and only after the contractual liabilities are completed, shall the company show unusually profitable results. Such inconsistency is likely what provides the necessity to apply a bankruptcy prediction model which is suitable solely to companies in the construction sector. When researching the application of bankruptcy prediction models, it is important to note that companies can be divided in terms of activity funding risk: those that execute activities under their own risk and those that are funded by customers (customer risk). Usually a company’s activity is being carried out under contracts funded by customers; therefore, it could be assigned to a service rendering company or a mediator. When researching the most effective model for the construction sector, it is important to consider profitability and solvency indicators. Construction companies that carry the risk and invest their own or borrowed funds in the company’s activities are commonly found building for the manufacturing industry. Hence, for these types of companies, models that additionally analyze financial leverage indicators are more suitable.
Considering the research objective, the following hypotheses were set: H1: Bankruptcy prediction models based on macroeconomic variables are efficient in identifying the number of corporate bankruptcies in the country; H2: Models that are not specially adapted to companies in the construction sector are not suitable for forecasting the bankruptcy of these types of companies; H3: The application of a model created on the grounds of macroeconomic indicators together with the traditional bankruptcy prediction model improves the reliability of bankruptcy prediction.
In the first stage of the study, the impact of macroeconomic indicators on company bankruptcy was researched, i.e., the main macroeconomic indicators determining the number of companies’ bankruptcies are being identified. Later, a practice study was carried out on the basis of which linear regression equations were constructed with the aim to form a complex bankruptcy model. In the second stage of the research, the suitability and reliability of the application of the traditional bankruptcy prediction models was assessed. The most suitable model for diagnosing bankruptcy was established in this part of the research. During the third stage of the model research, the modified traditional-macroeconomic bankruptcy prediction model was tested. This last stage of research allowed for testing the third hypothesis and figuring out whether application of the model, created on the basis of macroeconomic indicators together with the traditional bankruptcy prediction model, improves the reliability of bankruptcy prediction.
The analysis revealed that the activities of construction sector companies and their successful development are mostly determined by the following external factors: the rate of unemployment, the price index of construction’s consumption elements, and changes in housing prices. Having performed the research on the reliability of macroeconomic indicators’ applications in identifying the number of company bankruptcies, the authors confirmed the hypothesis that bankruptcy prediction models based on macroeconomic variables are efficient when identifying the number of companies’ bankruptcies in a country. It should be noted that the newly created bankruptcy prediction model can be useful in obtaining preventive signals that could prompt the companies to review their financial information and activity, which in turn could reduce the risk of bankruptcy. The hypothesis stating that the application of a model created on the grounds of macroeconomic indicators together with the traditional bankruptcy prediction model can improve the reliability of bankruptcy prediction can be supported.
3. Materials and Methods
The performed analysis of scientific works by
Acosta-González et al. (
2019),
Ninh et al. (
2018),
Zelenkov et al. (
2017),
Zvarikova et al. (
2017),
Mitman (
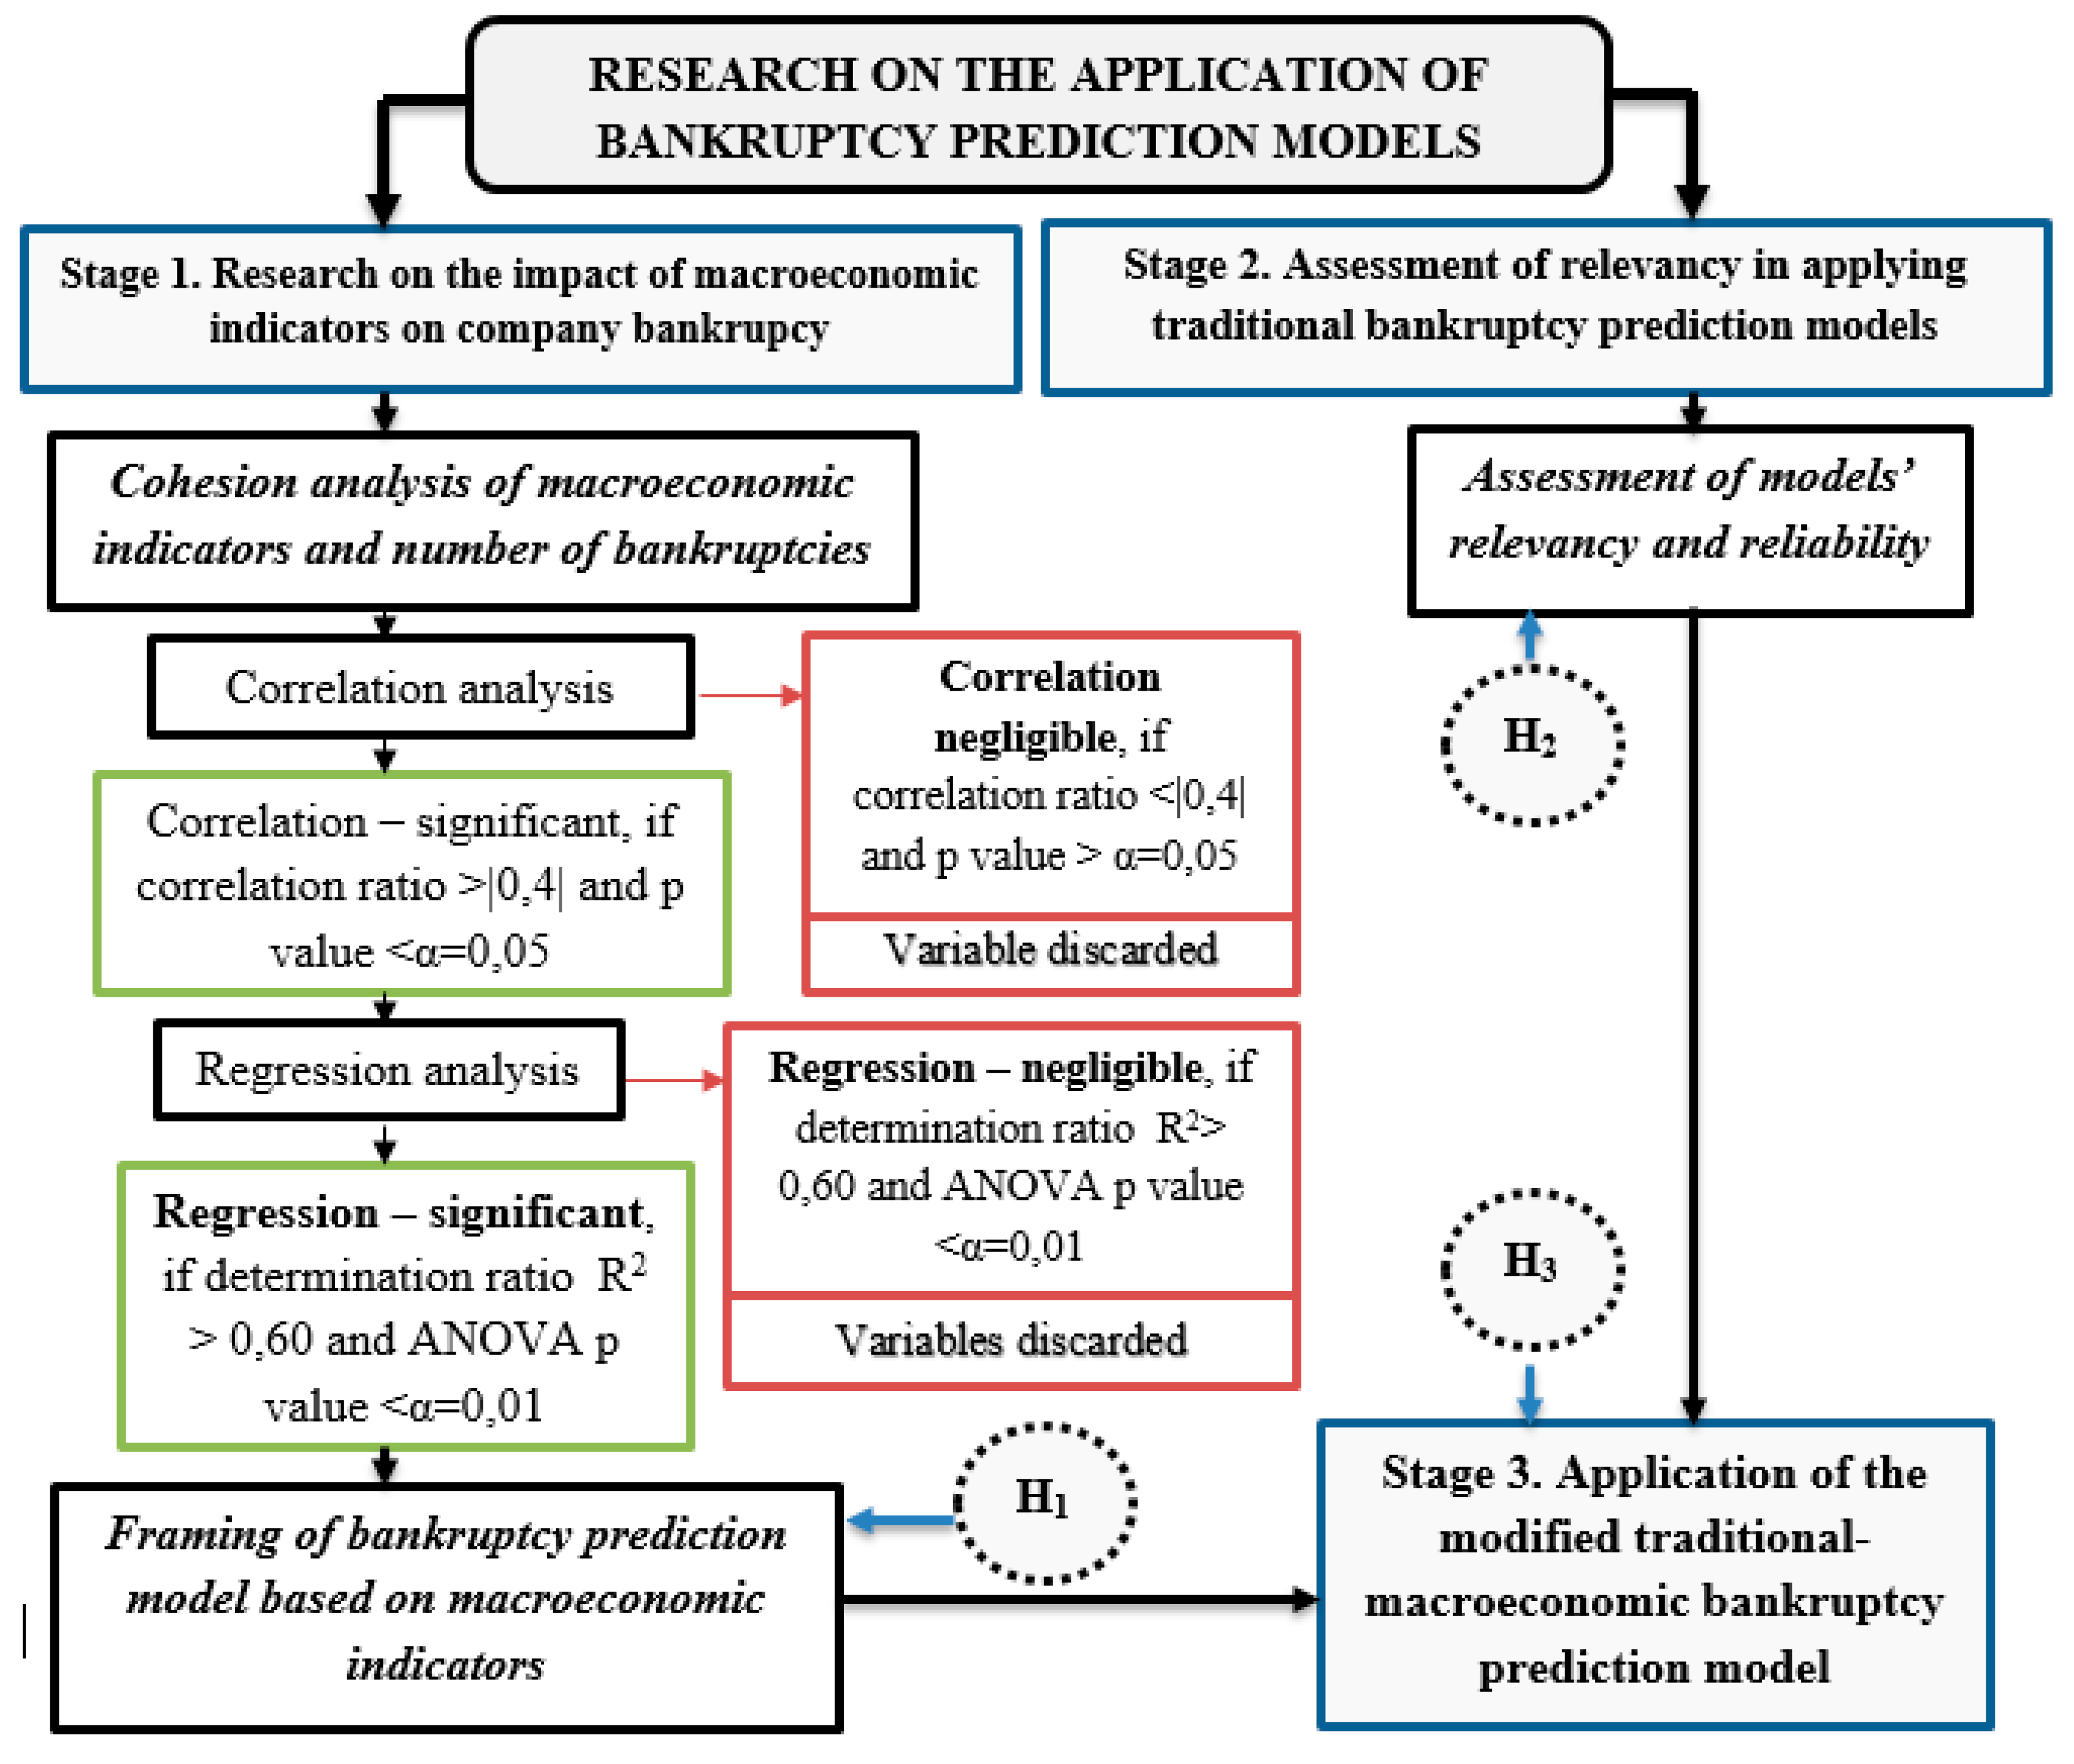
2016) reveals that company activities and probability of its bankruptcy are dependent not only on the internal but also on the external macroeconomic factors and reasons. Therefore, to frame a model grounded on macroeconomic variables and validate the efficiency of its application in comparison with traditional bankruptcy prediction models, quantitative research was conducted, during which statistical analysis and econometric modeling of macroeconomic and company’s activity indicators were performed. In pursuance to implement the raised research tasks, a research model was developed, which consisted of three main stages (see
Figure 1).
Hence, to test the first hypothesis, in the first stage of the model, the research on the impact of macroeconomic indicators on company’s bankruptcy was performed, i.e., the identification of the main macroeconomic indicators determining the number of companies’ bankruptcies. Therefore, a model was constructed in a way that, after performing the analysis, the outcomes of macro-environment factors that had the greatest negative value to business bankruptcies were already identified during the first stage. To confirm or refute hypothesis H1 that bankruptcy prediction models based on macroeconomic variables are efficient in identifying the number of corporate bankruptcies, the following actions were undertaken. First, when studying the macroeconomic environment, the most significant variables were obtained. Having assessed their significance to the number of bankruptcies, the final variables for the research were chosen and factors that had no impact, or the impact was insignificant to the number of business bankruptcies, were withdrawn.
With the aim to select the most meaningful macroeconomic variables for the framing of bankruptcy model, according to
Prusak (
2017), it is necessary to consider their relation to companies’ activity results. Hence, the following indicators defined by the analysis of macroeconomic environment, conducted by Jabeur (2017),
Gupta et al. (
2015),
Memon et al. (
2015),
Box et al. (
2018), were chosen for the research: gross domestic product, inflation, unemployment level, total number of companies, loans granted, average wage, interest rates, and export and import. Apart from all of the macroeconomic indicators that are being analyzed in the scientific literature, it is worth including indicators typical to the sector at hand, i.e., closely related to the business activity of a certain sector. Since the construction sector was chosen for this research, it is reasonable to additionally include the following macroeconomic indicators: changes in housing prices, construction consumption price index, and the volume of performed construction work in the country.
During the first stage of the composed model, a cohesion analysis of macroeconomic indicators and number of bankruptcies was performed. In practical studies, which attempt to identify causal relations, it is important to highlight their impact to each other (
Lewis-Beck and Lewis-Beck 2015). In order to explore the relation, a correlation analysis is widely used, the aim of which is to identify the existence of stochastic relation among the analyzed factors, in this case, between macroeconomic indicators and number of bankruptcies. If the value of correlation ratio is significant, then the assumption is made regarding the existence of stochastic relation (
Stephens 2017). As a result, the correlation analysis shall indicate whether the number of bankruptcies depend on the macro-environmental factors, what the intensity of the relation is and whether the correlation is statistically significant and uncoincidental. The criterion used to select the main macroeconomic variables is that the correlation coefficient is greater than |0.4|, i.e., the relation to the number of bankruptcies is medium, strong, or very strong. Not only correlation strength but also statistical significance is always considered in correlation analysis. To make sure that the result is not just a random coincidence, a p-value is calculated. It shows whether the correlation is statistically significant. In most cases, the p value calculated by the SPSS program is comparable to the standard statistical significance, α = 0.05. The assumption in the study is that the correlation is not random and significant when the p value is less than 0.05. In order to increase the reliability of macroeconomic variables for the framing of the model, according to
Aiemsomboon and Sintunavarat (
2016), linear equations with significant ratios are composed. In this way, the results would be more significant and more reliable. Hence, having selected the most important macroeconomic indicators, the potential of predicting bankruptcy probability based on macroeconomic indicators was assessed. Further, a regression method was used for the data analysis in the research creating the bankruptcy prediction model based on macroeconomic indicators. Namely such a combined application of correlation and then regression analyses towards the selected macroeconomic indicators enables the testing of whether the latter in fact has an impact on the application of bankruptcy prediction models and can be one of its components. At this stage, the significance level is determined and, based on that, macro-economic variables are selected for further study.
In the second stage of the model, the suitability and reliability of the application of the traditional bankruptcy prediction models is being assessed. When performing the study on the application of bankruptcy forecasting models, an important task is to test the efficiency, applicability and reliability of the available and widely used models to the chosen industry sector. The most suitable model for diagnosing bankruptcy was established in this part of the research.
The issue of forecasting bankruptcies in the construction sector is especially relevant, given the existent accounting specifics of the construction sector discussed above, which do not always allow a proper evaluation of the obtained bankruptcy prediction model results. Therefore, in order to perform the research and test the second hypothesis, joint stock companies were chosen. This legal form of business is obviously dominant in comparison to other forms, based on the number of bankruptcies.
A criterion for the companies to have their financial statement audited was also taken into consideration. The correctness of the financial statements and reliability of the data were also considered.
An additional criterion for the operating companies was applied—not to have experienced a restructuration during the period of analysis, since this would highly distort the findings. For the selection of bankrupted companies, a criterion was applied to have the bankruptcy procedure started (or ended) during 2014–2017 or immediately after the period of analysis.
The implemented activities of the bankrupted companies were also considered. According to the structure of Classification of Economic Activities, the bankrupted companies were executing the following activities: construction of residential and non-residential buildings; repair, restoration and reconstruction of buildings; plumbing, heat and air conditioning installation; floor and wall covering. As a result, the specifics of the performed activity as a criterion is applied for selecting the operating companies. In respect to the above-mentioned criteria, 6 bankrupted companies have been selected for the analysis, which were the total number of bankrupted construction sector companies conforming to all of the research criteria.
During the third stage of the model research, the modified traditional-macroeconomic bankruptcy prediction model was tested. According to
Tinoco and Wilson (
2013), while using macroeconomic variables together with financial indicators, a greater reliability of bankruptcy prediction models is being created. Therefore, in this stage, when seeking to achieve the established research objective, the possibilities and increase of efficiency in forecasting bankruptcies are being analyzed, applying financial (traditional) and macroeconomic models together. It should be noted that in pursuit for the research objectivity, this stage of research is performed by including not only the already analyzed six companies of the construction sector, but also other, currently operating, i.e., non-bankrupted construction companies that meet the same aforementioned selection criteria. 18 companies in Lithuania were found and selected for further research. Namely this last stage of research allows for testing the third hypothesis and figuring out whether application of the model created on the basis of macroeconomic indicators together with the traditional bankruptcy prediction model improves the reliability of bankruptcy prediction.
4. Results and Discussion
To confirm or refute the H
1 hypothesis that bankruptcy prediction models based on macroeconomic variables are efficient in identifying the number of corporate bankruptcies in the country, research on the impact of macroeconomic indicators on corporate bankruptcy was performed. First, the cohesion relation between macroeconomic indicators and number of bankruptcies was identified. Then, the model from the most significant variables was created, which enabled a reliable identification of the tendencies in the number of bankruptcies. When conducting the analysis, it is important to define how the fluctuation of macroeconomic indicators affect the number of corporate bankruptcies. Having adapted the correlation analysis, the impact of analyzed factors on companies in the Lithuanian construction sector was established. Performing cohesion analysis and striving to assess the intensity of the relation and correlation between the dependent variable—the number of corporate bankruptcies in construction sector, and independent variables—macroeconomic indicators, was calculated. Thus, research was further carried out in order to determine whether there is a significant relation between the number of corporate bankruptcies in the construction sector and macroeconomic factors (see
Figure 2).
The performed analysis reveals that the correlation is statistically significant between the number of corporate bankruptcies and level of unemployment, total number of companies, granted loans, average wage, changes in real estate prices and price ratio of construction costs’ elements. It was noted that correlation intensity results coincided with significance results. The lowest level of significance was observed when assessing the correlation between corporate bankruptcies and loan interest norms. It is important to note that the data used for the analysis was adjusted according to the business year in question before the bankruptcy. Therefore, the bankruptcy prediction methodology, which includes macroeconomic variables, will be developed at the final stage of the study to identify a bankruptcy even before it occurs. After conducting the correlation analysis, a conclusion emerged that macroeconomic factors had an uncoincidental and significant effect on the number of corporate bankruptcies in the construction sector.
In order to establish whether bankruptcy can be forecasted employing macroeconomic indicators, another way to define the relationship is applied—a regression analysis. The dependent variable—number of bankruptcies (B)—was expressed in independent macroeconomic variables, the relation of which was established to be significant according to the correlation analysis. As a result, so as to identify the reliability of corporate bankruptcy prediction, further analysis included valuation of the following macroeconomic indicators: unemployment level (X
1), total number of companies (X
2), average wage (X
3), price ratio of construction costs’ elements (X
4) and changes in real estate prices (X
5). The obtained regression equations between corporate bankruptcies in the construction sector and macroeconomic indicators are presented in
Table 2.
In the case under analysis, the price ratio of construction costs’ elements had the greatest significance in identifying the number of corporate bankruptcies. The lowest reliability of the expression was found when predicting the number of bankruptcies based on average wages. The adjusted ANOVA analysis of variance shows that the number of bankruptcies is related to the macroeconomic variables analyzed. Summarizing the results of the developed regression equations, it was noticed that the most appropriate linear model for determining the number of bankruptcies and dependencies of companies is the analysis of construction cost price indices. Meanwhile, average wages are the worst justification for predicting bankruptcies.
As the next step, indicators, which are statistically significant, were included into the regression analysis model. As a result, data of macroeconomic indicators and number of bankruptcies of 2007–2017 were analyzed. It was identified that the likelihood for corporate bankruptcies in construction sector can be efficiently forecasted when applying three macroeconomic indicators: price ratio of construction costs, unemployment level and change in real estate prices (see Formula (1)).
where:
X4—price ratio of construction costs’ elements;
X1—unemployment level;
X5—change in real estate prices.
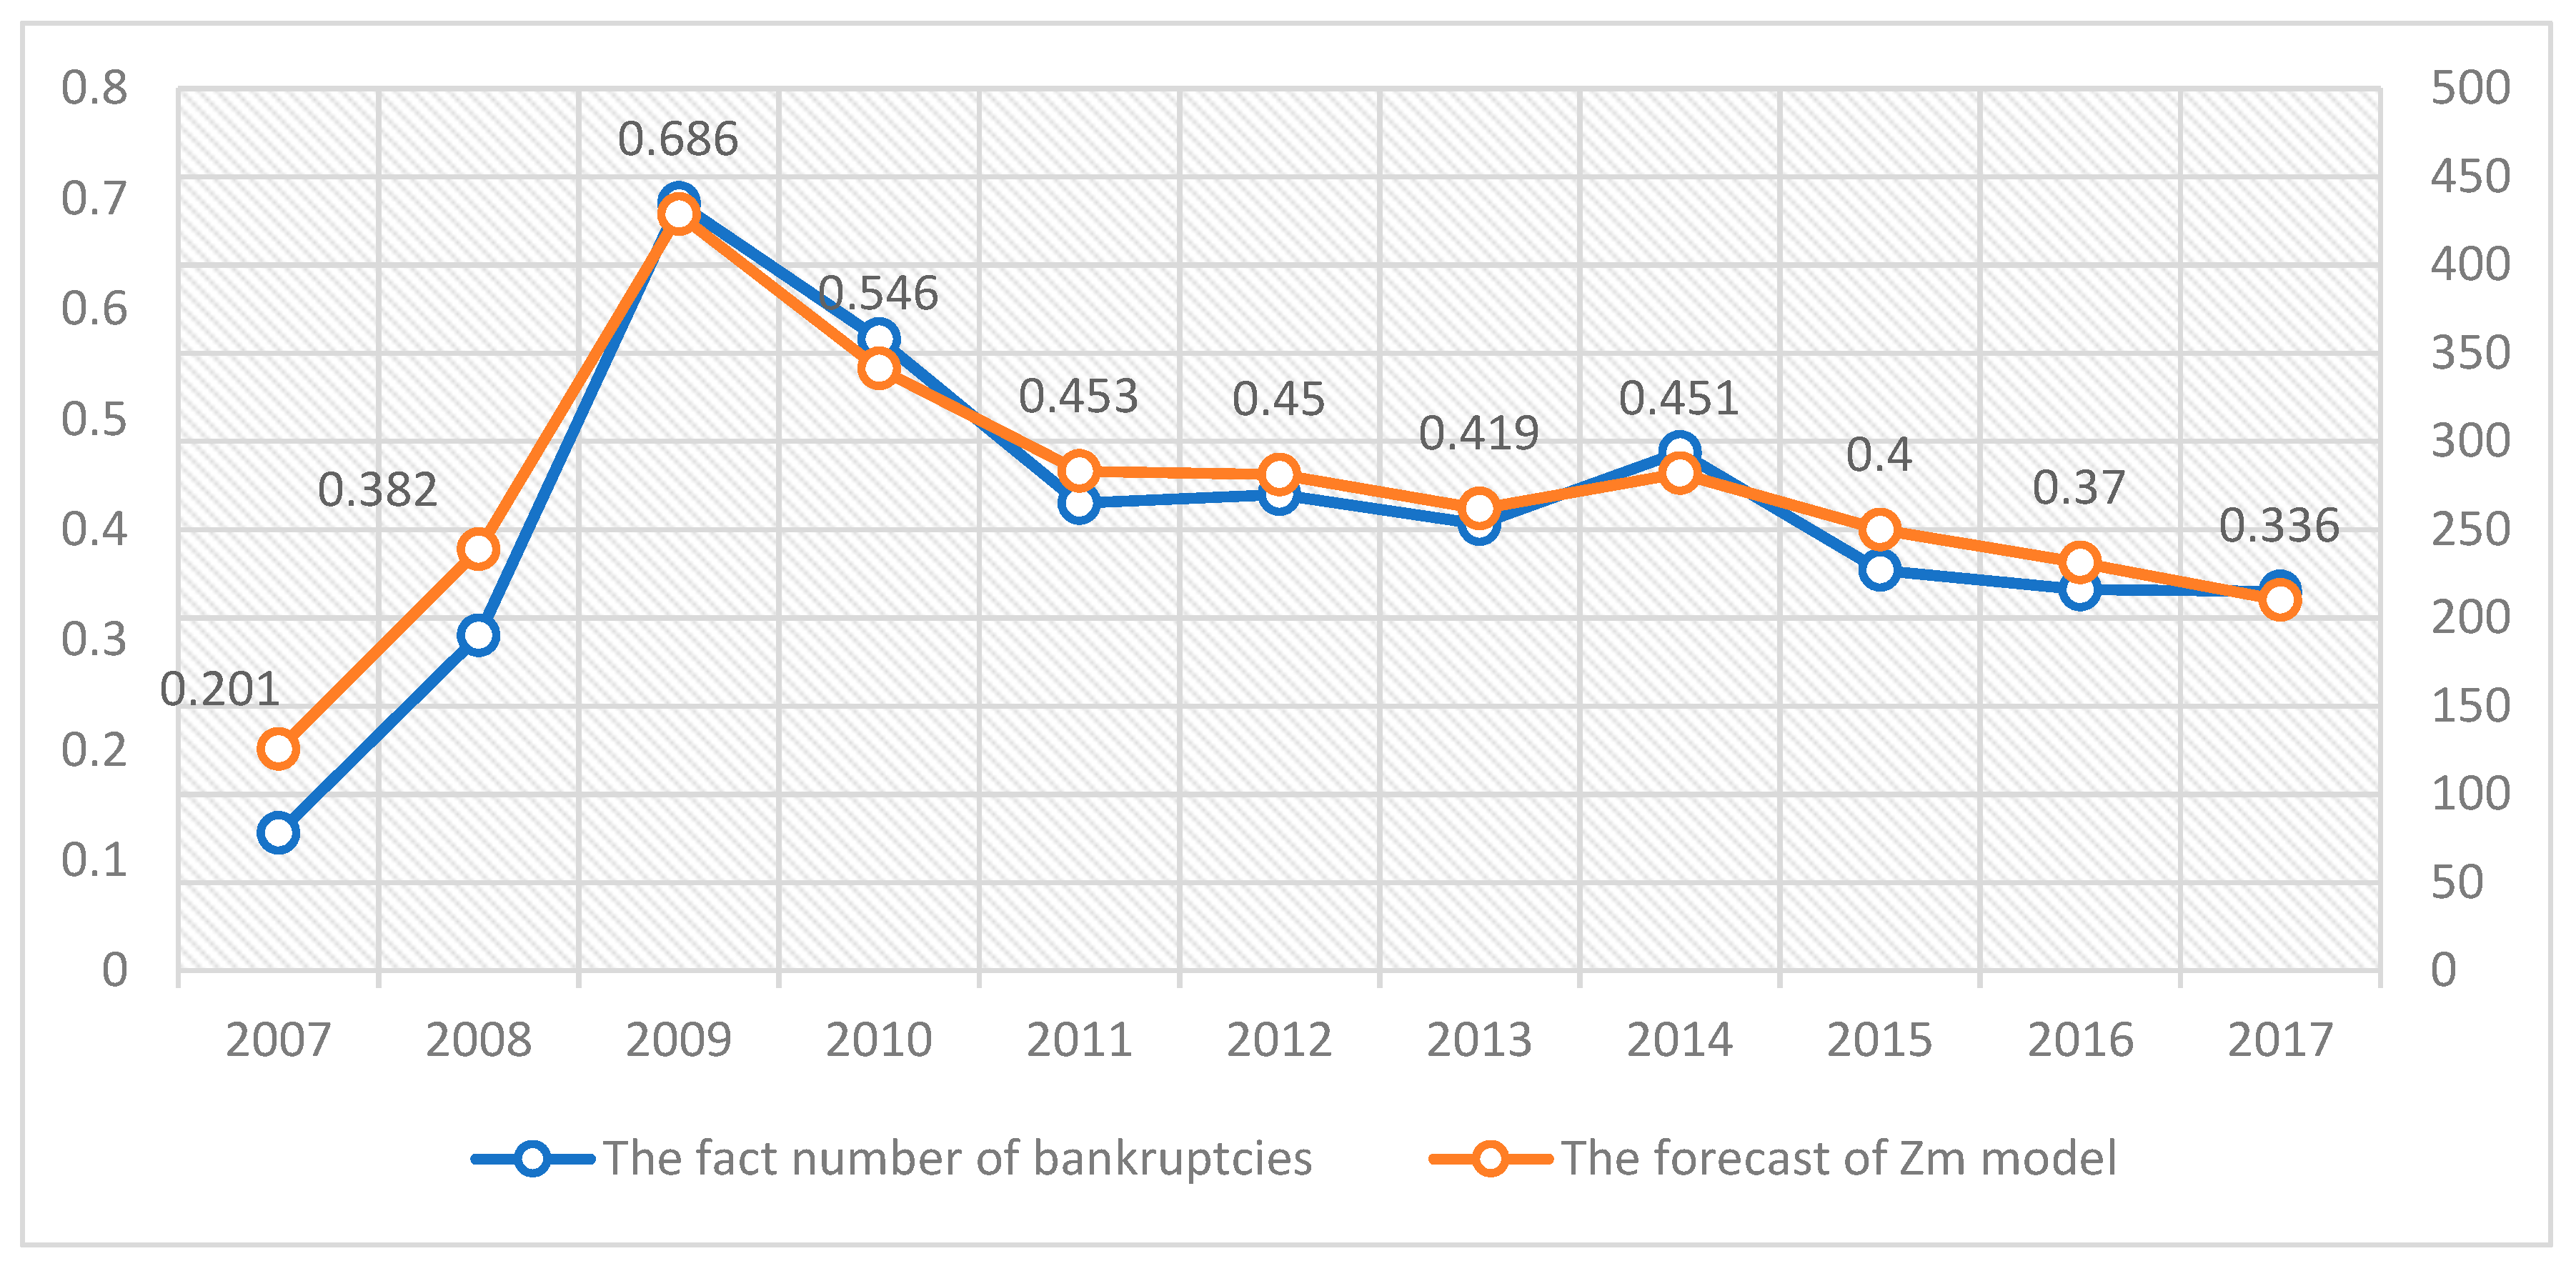
Having applied a regression model, a dependent dichotomous variable—number of bankruptcies—gained value from 0 to 1, i.e., the closer the value to 1, the greater the likelihood to go bankrupt, and vice versa, the closer the value to zero, the lower the likelihood for bankruptcy to occur. The calculations, having employed the composed equation, are presented in
Figure 3.
Therefore, summing up the results, when forecasting the number of corporate bankruptcies in the construction sector and assessing the annual unemployment level, price ratio of construction costs’ elements and the change in real estate prices, is a reliable method. The results of the reliability research on the application of macroeconomic indicators for identifying the number of corporate bankruptcies confirm the H1 hypothesis that bankruptcy prediction models based on macroeconomic variables are efficient in identifying corporate bankruptcies.
The performed practical study proved that the Bonity index is the most suitable model to be applied to operating entities, the reliability of which reaches 99 percent. In addition, models by Liss, Springate, Grigaravicius also achieved accurate prognoses. However, it is important to consider the arrangement of such results if models were applied to the bankrupted companies. The Bonity index, as well as Liss’s and Springate’s models generally are not reliable due to the significance of their ratios, because they do not ascertain bankruptcy either for the bankrupted companies, or for the operating entities.
In terms of the worst results—the models designed by Zavgren and Stoskus et al. are the most unreliable. Stoskus’s et al. model credibly estimates the situation of the bankrupted companies; however, due to an unsuitable ratio significance, this model is too sensitive in assessing companies that operate in the construction sector.
It is observed that models often forecast bankruptcy for companies even when they operate successfully. This is due to the specific peculiarities of accounting that is typical to undertakings in the construction sector, i.e., uncompleted contracts are being registered in the accounting based on the submission level. Due to the work that is not submitted, the size of inventory items increases and the company experiences a loss; in other words, this reduces the company’s revenue, which in turn directly leads to the worsening of profitability indicators. It can be assumed that models were applied during the time when companies were experiencing difficulties and, therefore, the results showed a likely bankruptcy. However, as the companies overcame difficultiesduring 2013–2017, their overall results were similar to those of successfully operating companies. Hence, after analyzing the bankrupted companies, models by Grigaravicius and Butkus et al. should be considered to be the most suitable and most reliable for the operating companies as well, despite the results of the Bonity index or Liss’s model. As a result, the most trustworthy models are not those that can identify more cases of the successful operation of non-bankrupted business entities, but those that evaluate companies’ financial fluctuations and when applied during the difficult years show that a company’s situation is likely heading towards a bankruptcy. Generalized results of bankrupted and operating companies as well as companies in general are presented below (see
Figure 4).
As part of the uniqueness of the research, a model that has been rarely applied to Lithuanian companies—the Bonity index—is included in the research. Thus, it is worth comparing it with other models. The general reliability of the model is the highest; however, results of the model’s application compared to the bankrupted companies should be considered. The findings show that the trustworthiness of this models is rather low because only 31 percent of the cases were properly classified. As a result, this model’s application to the construction sector is unreliable.
The Grigaravicius model (
Grigaravicius 2003) has the second accuracy in predicting bankruptcy for companies in the construction sector, i.e., it showed an average reliability of 86 percent throughout 2013–2017. Its credibility is determined by the significance of the model’s indicators, which are oriented towards the identified reasons for going bankrupt, in terms of the construction sector’s companies—a lack of working capital and solvency problems.
The Butkus et al. model (
Butkus et al. 2014) was created in 2014 and is intended namely for companies in the construction sector. It is one of the most important models, since all other analyzed models are framed considering the data of companies operating in distinct sectors. The analysis proves that this model is best fitted for bankrupted companies, and reaches 85 percent total credibility when applied to all of the analyzed companies. Its trustworthiness is lower than Bonity index by only 2 percentage points and differs from the Grigaravicius model’s precision results by only 1 percentage point.
The Liss and Springate models (
Edmister 1972;
Springate 1978). Liss model most properly identified the bankruptcy likelihood for operating companies. However, it is extremely low in reliability when it comes to predicting the bankruptcy for bankrupted companies. Therefore, it is unreasonable to adapt this model when analyzing companies in the construction sector, even though its general accuracy is 79 percent. The credibility of the Springate model is also assessed negatively, although its general result reaches 78 percent. This model did not identify the risk of bankruptcy for bankrupted companies in 13 out of 16,cases.
The Altman model (
Altman 1968) was most widely used in the previously performed research when identifying bankruptcy risks for companies operating in distinct activity fields. In summary of the results, the model quite credibly forecasted the bankruptcies for companies operating in the construction sector. According to the model, the most significant indicator that shows bankruptcy is a relative value of earnings before taxes and assets. The general reliability of the model is measured to be 77 percent.
Taffler and Tisshaw model (
Taffler and Tisshaw 1977). In comparison with other models, the accuracy of this model coincides with the results of the Altman, Sandin, and Porporato applied models. However, the forecasted bankruptcy results for the bankrupted companies should also be taken into consideration. This model classified only 5 out of 16 cases, i.e., only 31 percent of the analyzed cases. Therefore, application of this model is also inexpedient. 6 bankrupted companies and 18 operating companies were analyzed and the findings show that it best suits operating companies, but for bankrupted companies, it is extremely inaccurate.
Sandin and Porporato model (
Sandin and Porporato 2007). The credibility of the model is rather satisfactory, although its equation, in comparison with other models, has the smallest number of indicators, i.e., only two—equity/debt ratio and net sales profitability. However, these results ground the previously discussed analysis and shows that these indicators are the most important ones when analyzing companies in the construction sector. Thus, it only confirms their significance.
The Chesser model (
Chesser 1974) is quite accurate when applied in the analysis of construction sector companies. It rather precisely predicted the situation both for bankrupted and operating companies. Its general reliability reaches 70 percent.
Stoskus et al. model (
Stoskus et al. 2007). The analysis shows that the application results of this model are unreliable, because it predicted bankruptcy for successfully operating companies. The net profit ratio influenced such an outcome, i.e., if this ratio for a company was measured to be normal or bad, a bankruptcy was predicted. The occurred despite the financial and activity continuation risk in operating companies being low. The results of this model were distorted due to the ratio values used.
The analysis proved that the reliability of the Zavgren model is only 18 percent. Based on the analysis of bankruptcy prediction models’ application to the companies in construction sector, it is suggested to withdraw the application of the Zavgren model, because companies’ receivables constitute a greater share of companies’ assets than does inventory. The model often uses a large ratio of receivables and inventory and this distorts the general result. As a result, it can be stated that the findings of Zavgren model has not revealed any useful information about the companies’ positions and, therefore, this model is unreliable and unsuitable for predicting bankruptcy for the construction sector’s companies in Lithuania.
Summarizing the conducted analysis, it is observed that widely applied models by Altman, Taffler and Tisshaw, Chesser, Zavgren, Liss, and Springate were not completely accurate in identifying the financial state and bankruptcy probability of the companies, since they were composed based on different samples and sectors of company undertakings; moreover, specific features of each industry branch were not even considered. In addition, the composed models pay no attention to economic structural changes that are typical to each country according to the level of their economy development. It is worth mentioning that great attention was given to assessing the significance of bankruptcy models’ coefficients. This enabled the identification of the models that are most suitable for predicting the likelihood of bankruptcy for companies in construction sector. As a result, the specific features of distinct sectors should be taken into consideration when distinguishing the most credible models to-be-applied for bankruptcy identification. Additionally, it is important to consider the suitability of a model for bankrupted companies rather than operating ones, because if a model cannot identify bankruptcy given a poor company’s financial situation, it proves that the model is inefficient when diagnosing bankruptcy for companies in the construction sector. Thus, having implemented the research on the application of bankruptcy prediction models to companies in construction sector, we can claim that models by Butkus et al. and Grigaravicius most precisely predict both the continuity of a successful operation, and the bankruptcy itself. However, it is unreasonable and not recommended to apply models by Zavgren and Stoskus et al. for predicting bankruptcy in construction sector companies due to the possibility of significant errors. In fact, the analysis of bankruptcy prediction models’ application for companies in Lithuania’s construction sector shows that when applying the models, there are several especially important factors that distort the results, i.e., inadequate arrangement of coefficient values to relational ratios, model fluctuations when the relational index is impossible to calculate (due to impossible division by 0) given the result is equal to 0, and the irrelevance of relational ratios when analyzing construction companies. The research results are summarized in the table below, which depicts the suitability of the bankruptcy prediction models to companies in construction sector, with respect to the mentioned essential advantages and limitations (
Table 3).
When analyzing the application of bankruptcy prediction models for a certain sector, it is important to review the sector’s essential features. In the investigation of models’ application to the construction sector, it is important to note that companies can be distinguished into two aspects according to their activities’ funding risks: those that organize their activity under their own risk and those that are funded by a customer (customer risk). Often a company’s activity is framed by contracts and funded by customers; therefore, it could be attributed to the service sector (
Ibarrondo-Dávila et al. 2015). Thus, models by Altman, Sandin and Porporato, Chesser, Grigaravicius, and Butkus et al. are more suitable for such companies, as they assume net profit and working capital and assets to be more valuable relational ratios than other indexes. Meanwhile, construction companies that undertake the risk and invest their own or borrowed funds to the company’s activity are likely to be involved in construction for the manufacturing industry. For the companies of such a nature, models that include calculations of constant solvency, working capital and the asset relational ratio, i.e., Altman, Grigaravicius, Butkus et al., are more suitable. Considering the scientific literature and the analysis conducted, it can be stated that the credibility of various models is very different. Often research is performed when assessing the bankruptcy results in general for all companies. However, in order to conduct a more precise and efficient bankruptcy forecasting analysis, it is justifiable to apply models for a certain chosen activity sector. In this way, its specifics are revealed, as well as the most valuable relational ratios and even the factors that caused the bankruptcy can be obtained. On the other hand, the research shows that other models (Grigaravicius, Altman, Chesser, Sandin and Porporato) are also suitable for the analysis; therefore, we cannot categorically claim that only models by Butkus et al. are suitable for the bankruptcy analysis of the construction sector companies. Hypothesis H
2 that models that are not specially adapted for companies in the construction sector are not suitable for forecasting the bankruptcy of such companies was rejected.
The bankruptcy of companies in construction sector most often is related to major accumulated obligations and the lack of working capital. This is influenced by specific features: construction contracts are often long-term (lasting more than a year) and the payment for workings is made only after the implementation of the contract. This in turn causes the increase of borrowed capital and the lack of working funds. As a result, these two indicators—ratios of the equity and obligations and the working capital and assets—need to be assessed closely. The analysis of the decline in these indicators enables a credible identification of the outcomes for the company’s activity that may lead it to the bankruptcy. Both of these indicators are present in the models by Altman, Liss, Grigaravicius, and Butkus et al. A tendency is observed that the model by Butkus et al., which imparts the greatest value for the mentioned indicators when forecasting bankruptcy, are the most reliable in predicting bankruptcy for the companies in the construction sector—94 percent precision for the bankrupted companies, although the total credibility level reaches 85 percent. A conclusion emerges that the model by Butkus et al. which is specifically designed for the prediction of bankruptcy in construction sector’s companies, is the most reliable. With reference to these results, the modification of this model, by combining the scientists’ model and the composed macroeconomic model, is made and discussed in another section of this research work, with the aim to identify whether the reliability of bankruptcy prediction increases after assessing not only the financial indicators of the company but also the economic environment.
In the final stage of the research, when pursuing the set research objective, the possibilities for improving the efficiency of bankruptcy prediction by applying financial (traditional)
Butkus et al. (
2014) model together with macroeconomic model, are being analyzed. This model is chosen for study because it is the only model (from the ones analyzed) which is intended for investigating construction sector companies’ activity and its most important financial ratios cover the peculiarities typical of the construction sector. The greatest attention is given to the constant solvency coefficient, which shows the ratio between equity and obligations to the ratio of working capital and assets, and refers to the company’s ability to flexibly react to short-term environmental challenges.
In order to conduct the research, the H3 hypothesis is raised, stating the application of a model created on the grounds of macroeconomic indicators together with the traditional bankruptcy prediction model improves the reliability of bankruptcy prediction. The modified bankruptcy prognostication model is compared to the Butkus et al. model, which is adapted to the construction sector.
The created model of macroeconomic variables for forecasting bankruptcy is modified by changing its Z expression, in respect to the Butkus et al. model, to the meaning that the closer Z value to 0, the greater the bankruptcy likelihood. The Butkus et al. model is modified by including the application of macroeconomic variables; the equation is presented in Formula (2).
where:
Zb—bankruptcy prediction model by Butkus et al., designed for companies in construction sector;
Zm—model based on macroeconomic variables;
Xb1—net working capital/assets;
Xb2—sales revenues /assets;
Xb3—short-term assets/short-term liabilities;
Xb4—equity /obligations;
Xb5—sales revenues /net working capital;
X4—price ratio of construction costs’ elements;
X1—unemployment level;
X5—change in real estate prices.
The calculated reliability of 2013–2017 and total reliability numbers are presented in
Table 4.
As can be seen from
Table 4, when applying the combined bankruptcy prediction model to 24 companies (6 of them bankrupted and 18—operating), the classification level increases by 5 percent almost each year of the analysis, and 93.3 percent of cases are correctly classified when referring to total figures from 2013–2017. The obtained results show that having combined the model based on macroeconomic indicators with the Butkus et al. model of 2014, designed for companies in construction sector, the prediction reliability increases by 7.8 percent.
According to the results of the regression analysis, significance value is 0.00021 and multiple R is equal to 0.686. Thus, this lets us state that the modified model can be used in a very precise way and possibilities can be identified without any errors. It should be mentioned that the analysis of significance value is also supported by the fact that such scientists as
Valaskova et al. (
2018a) also applied regression analysis to estimate the significance value. For a comparison, the significance value that we have obtained is higher than
Valaskova et al. (
2018b) identified, but a little bit lower than established by
Calabrese and Osmetti (
2013). Furthermore, the model results as a direct influence and can be applicable to various further studies that deal with bankruptcy.
Generalizing the results, the raised hypothesis H3 that the application of a model created on the grounds of macroeconomic indicators together with traditional bankruptcy prediction model improves the reliability of bankruptcy prediction, can be confirmed. Having performed the comparative analysis between the combined model and the Butkus et al. model, a conclusion can be drawn that it is reasonable to form new or modify reliable and widely applied models for diagnosing bankruptcies, because in this way a more precise identification of bankruptcy likelihood in Lithuania’s companies can be assured. The application of the composed modified model to the companies of Lithuania can aid in predicting critical situations beforehand and in turn can help with escaping bankruptcy.
As a result, the activity of companies in the construction sector and their successful development is mostly determined by the following factors: the level of unemployment, price ratio of construction costs’ elements, and changes in real estate prices. All of the economic factors prompt or limit the development of activity by increasing the competition in the country and in this way regulating the number of companies in the country. Having analyzed the macroeconomic environment, significance and relations of macroeconomic factors, impacts of fluctuation tendencies made on the number of corporate bankruptcies, as well as having adapted the most efficient bankruptcy prediction models that are the most precise in assessing companies’ financial state, possibilities to take preventive measures arise, in order to prepare the most effective solutions for coping with the upcoming difficulties. A properly made economic and financial analysis enables the head of the company, investors, and creditors to develop solutions regarding the further activities, investment or lending possibilities. Results of the analysis allow confirming research hypotheses that bankruptcy prediction models based on macroeconomic variables are effective in identifying the number of corporate bankruptcies in the country (H1) and that the application of the model created on the grounds of macroeconomic indicators together with the traditional bankruptcy prediction model improves the reliability of bankruptcy prediction (H3). However, hypothesis H2 is declined, which stated that models that are not specially adapted to companies in the construction sector are not suitable for forecasting their bankruptcies.


