Lack of Global Convergence and the Formation of Multiple Welfare Clubs across Countries: An Unsupervised Machine Learning Approach
Abstract
1. Introduction
2. Data and Methods
2.1. Beyond GDP Data
2.2. Sigma and Beta Convergence
2.3. Distributional Convergence and Convergence Clubs
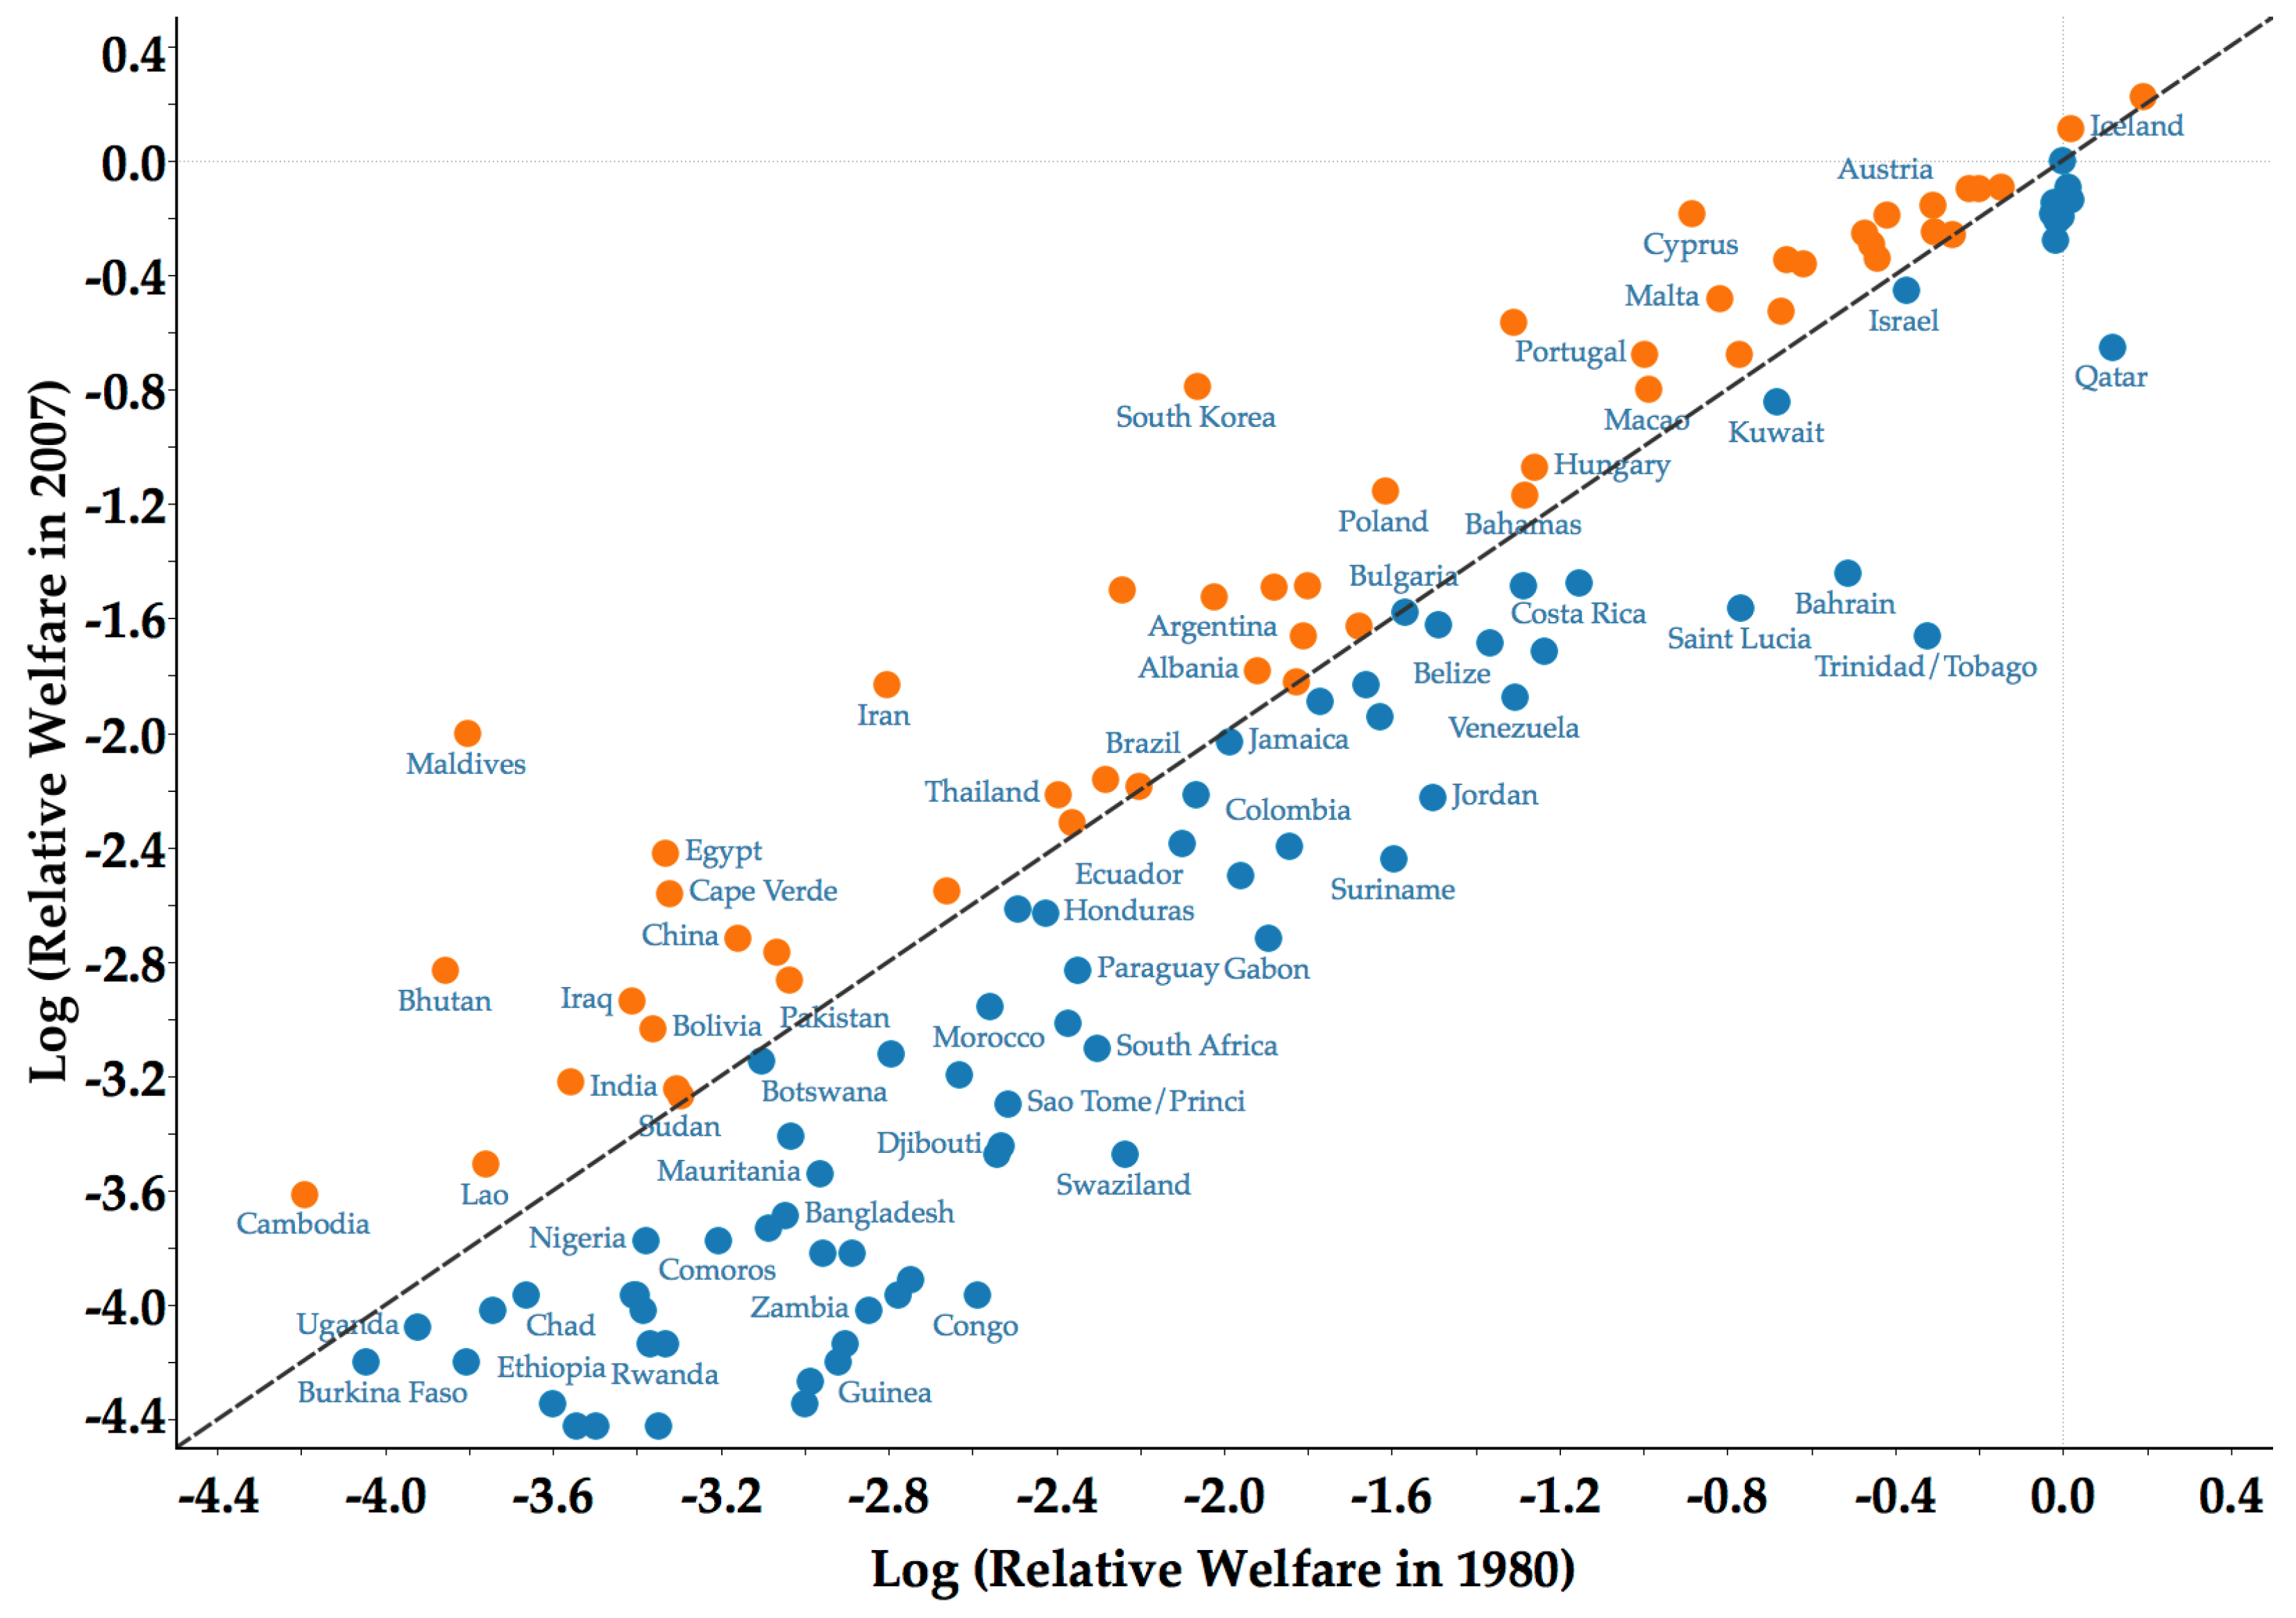
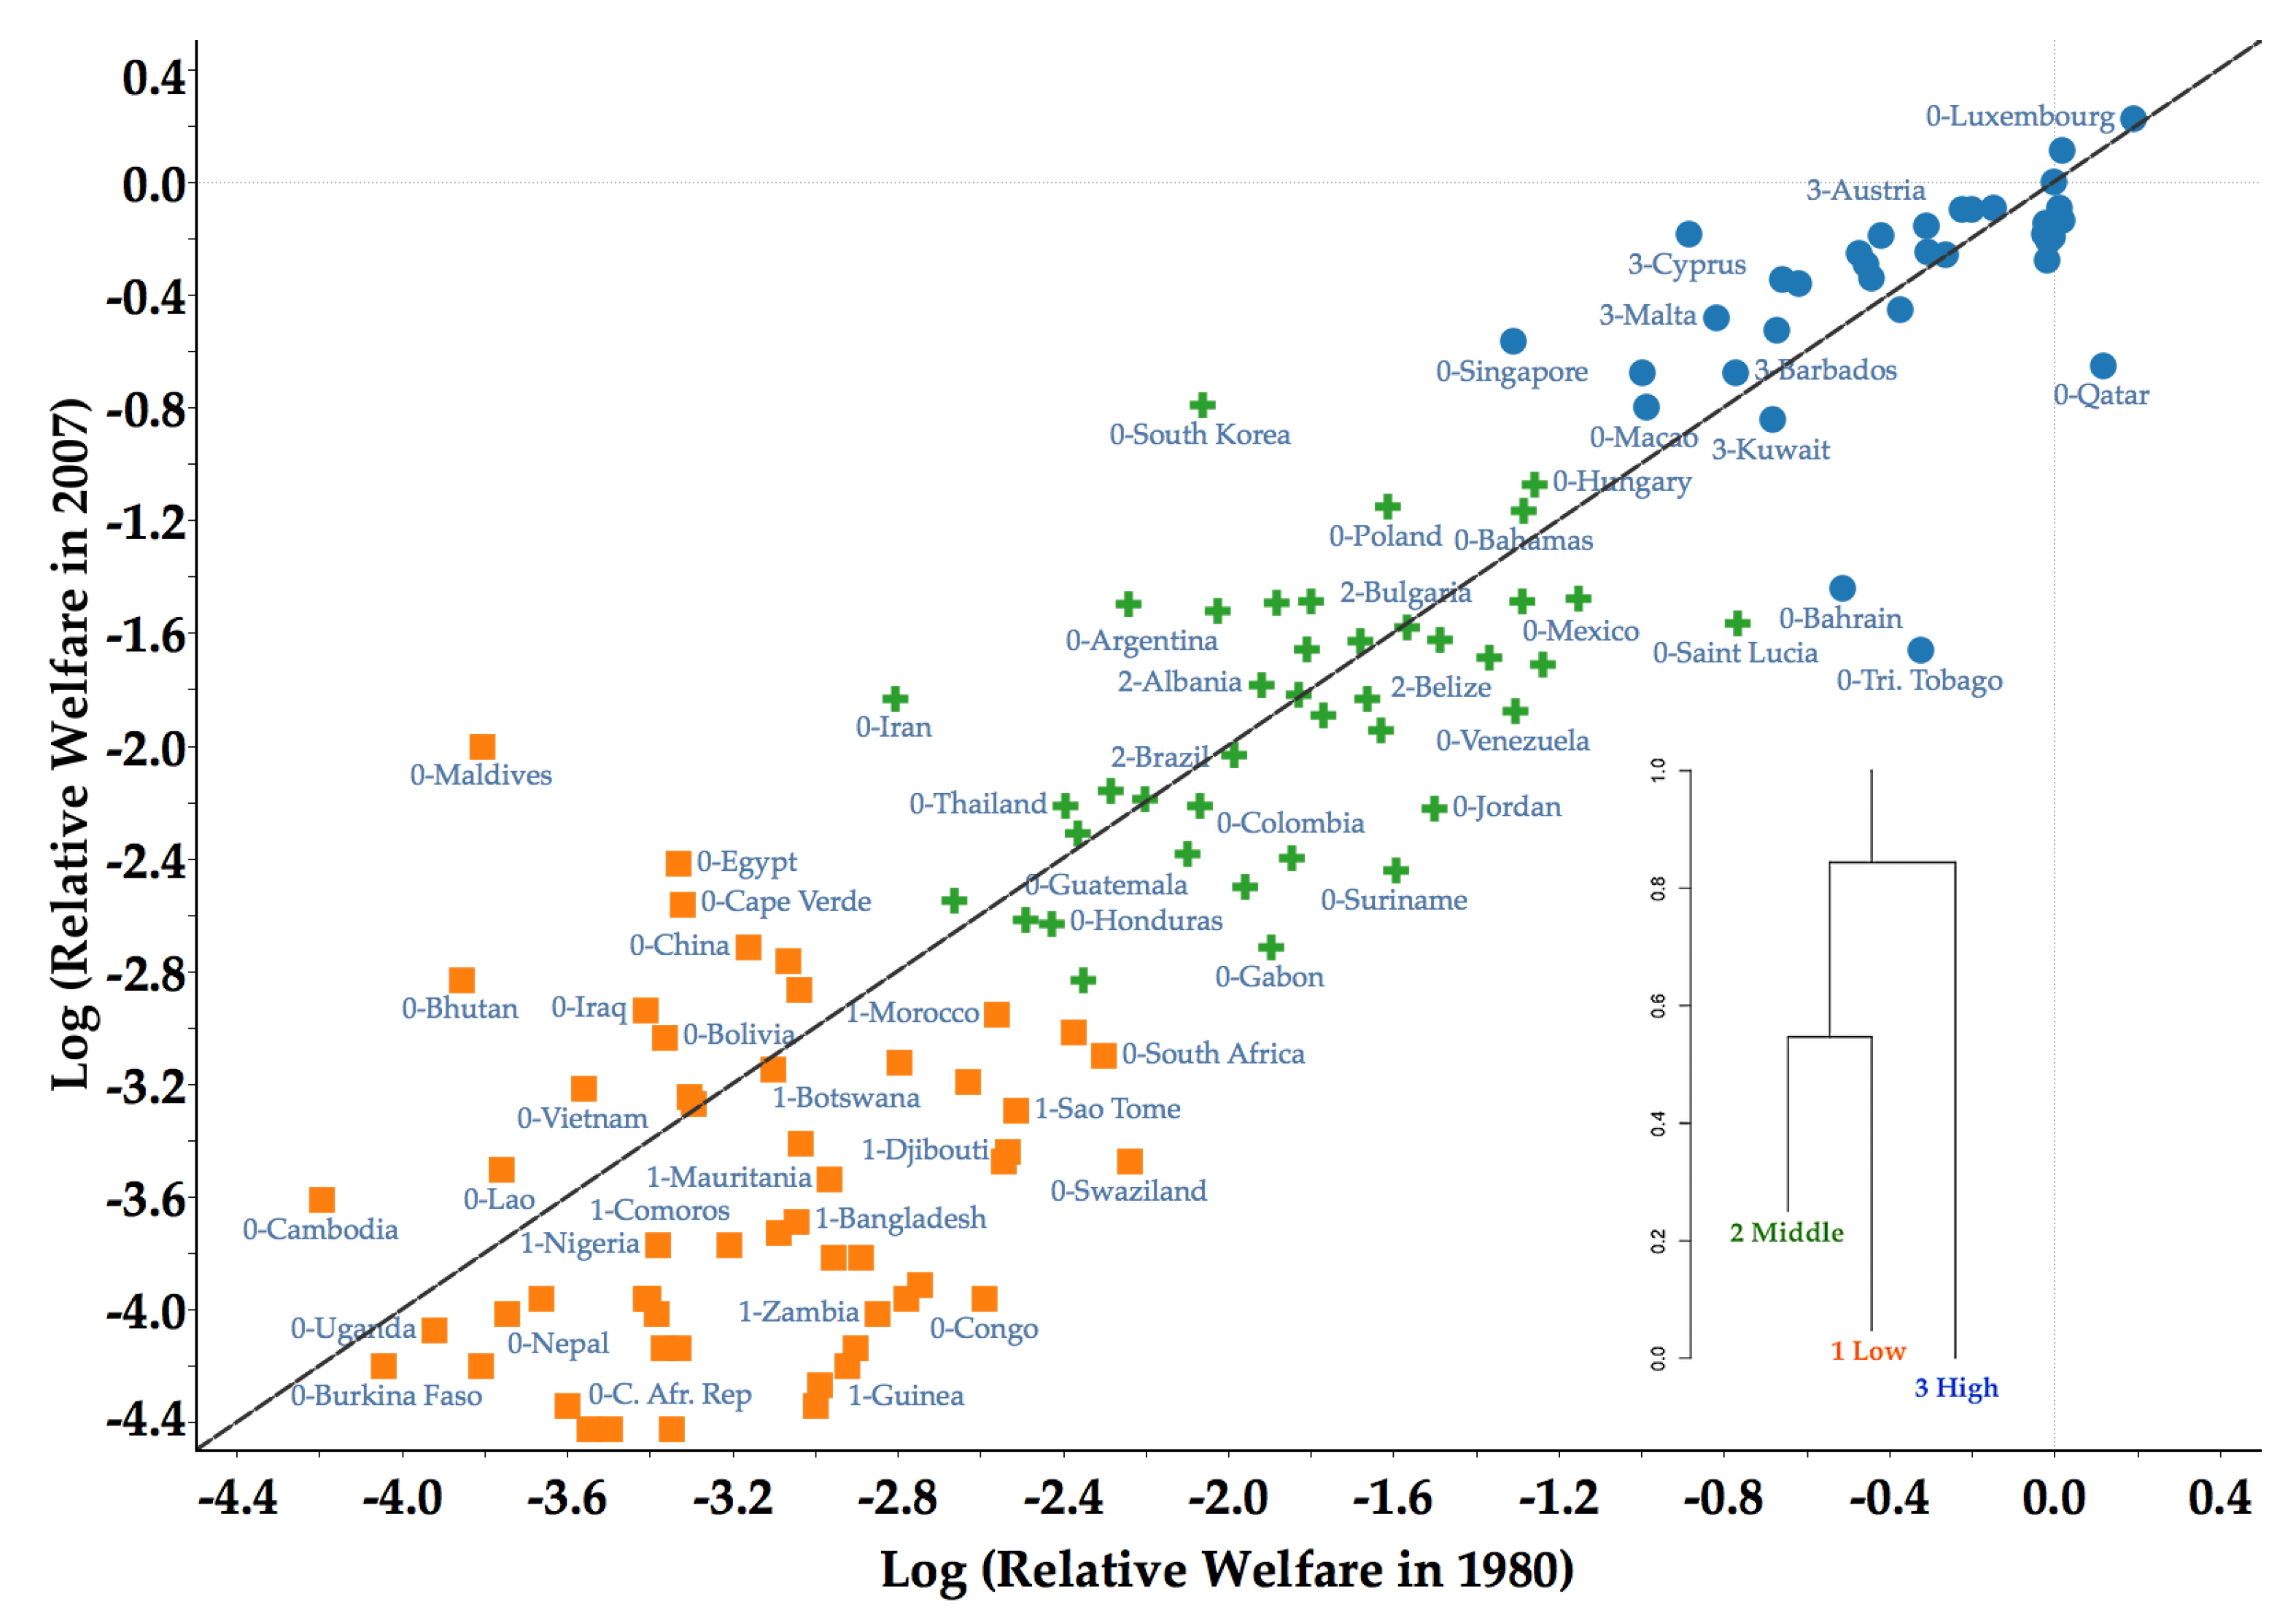
- The variable under study (that is, national welfare) is expressed relative to a benchmark economy, which in the literature is usually the United States. The purpose of this normalization is to abstract from systematic forces that might simultaneously affect all countries.
- To facilitate comparison and visualization, the natural logarithm of the relative variable is applied. The log of a relative variable can be interpreted as the proportional difference between a country and the benchmark country (i.e., the convergence frontier).
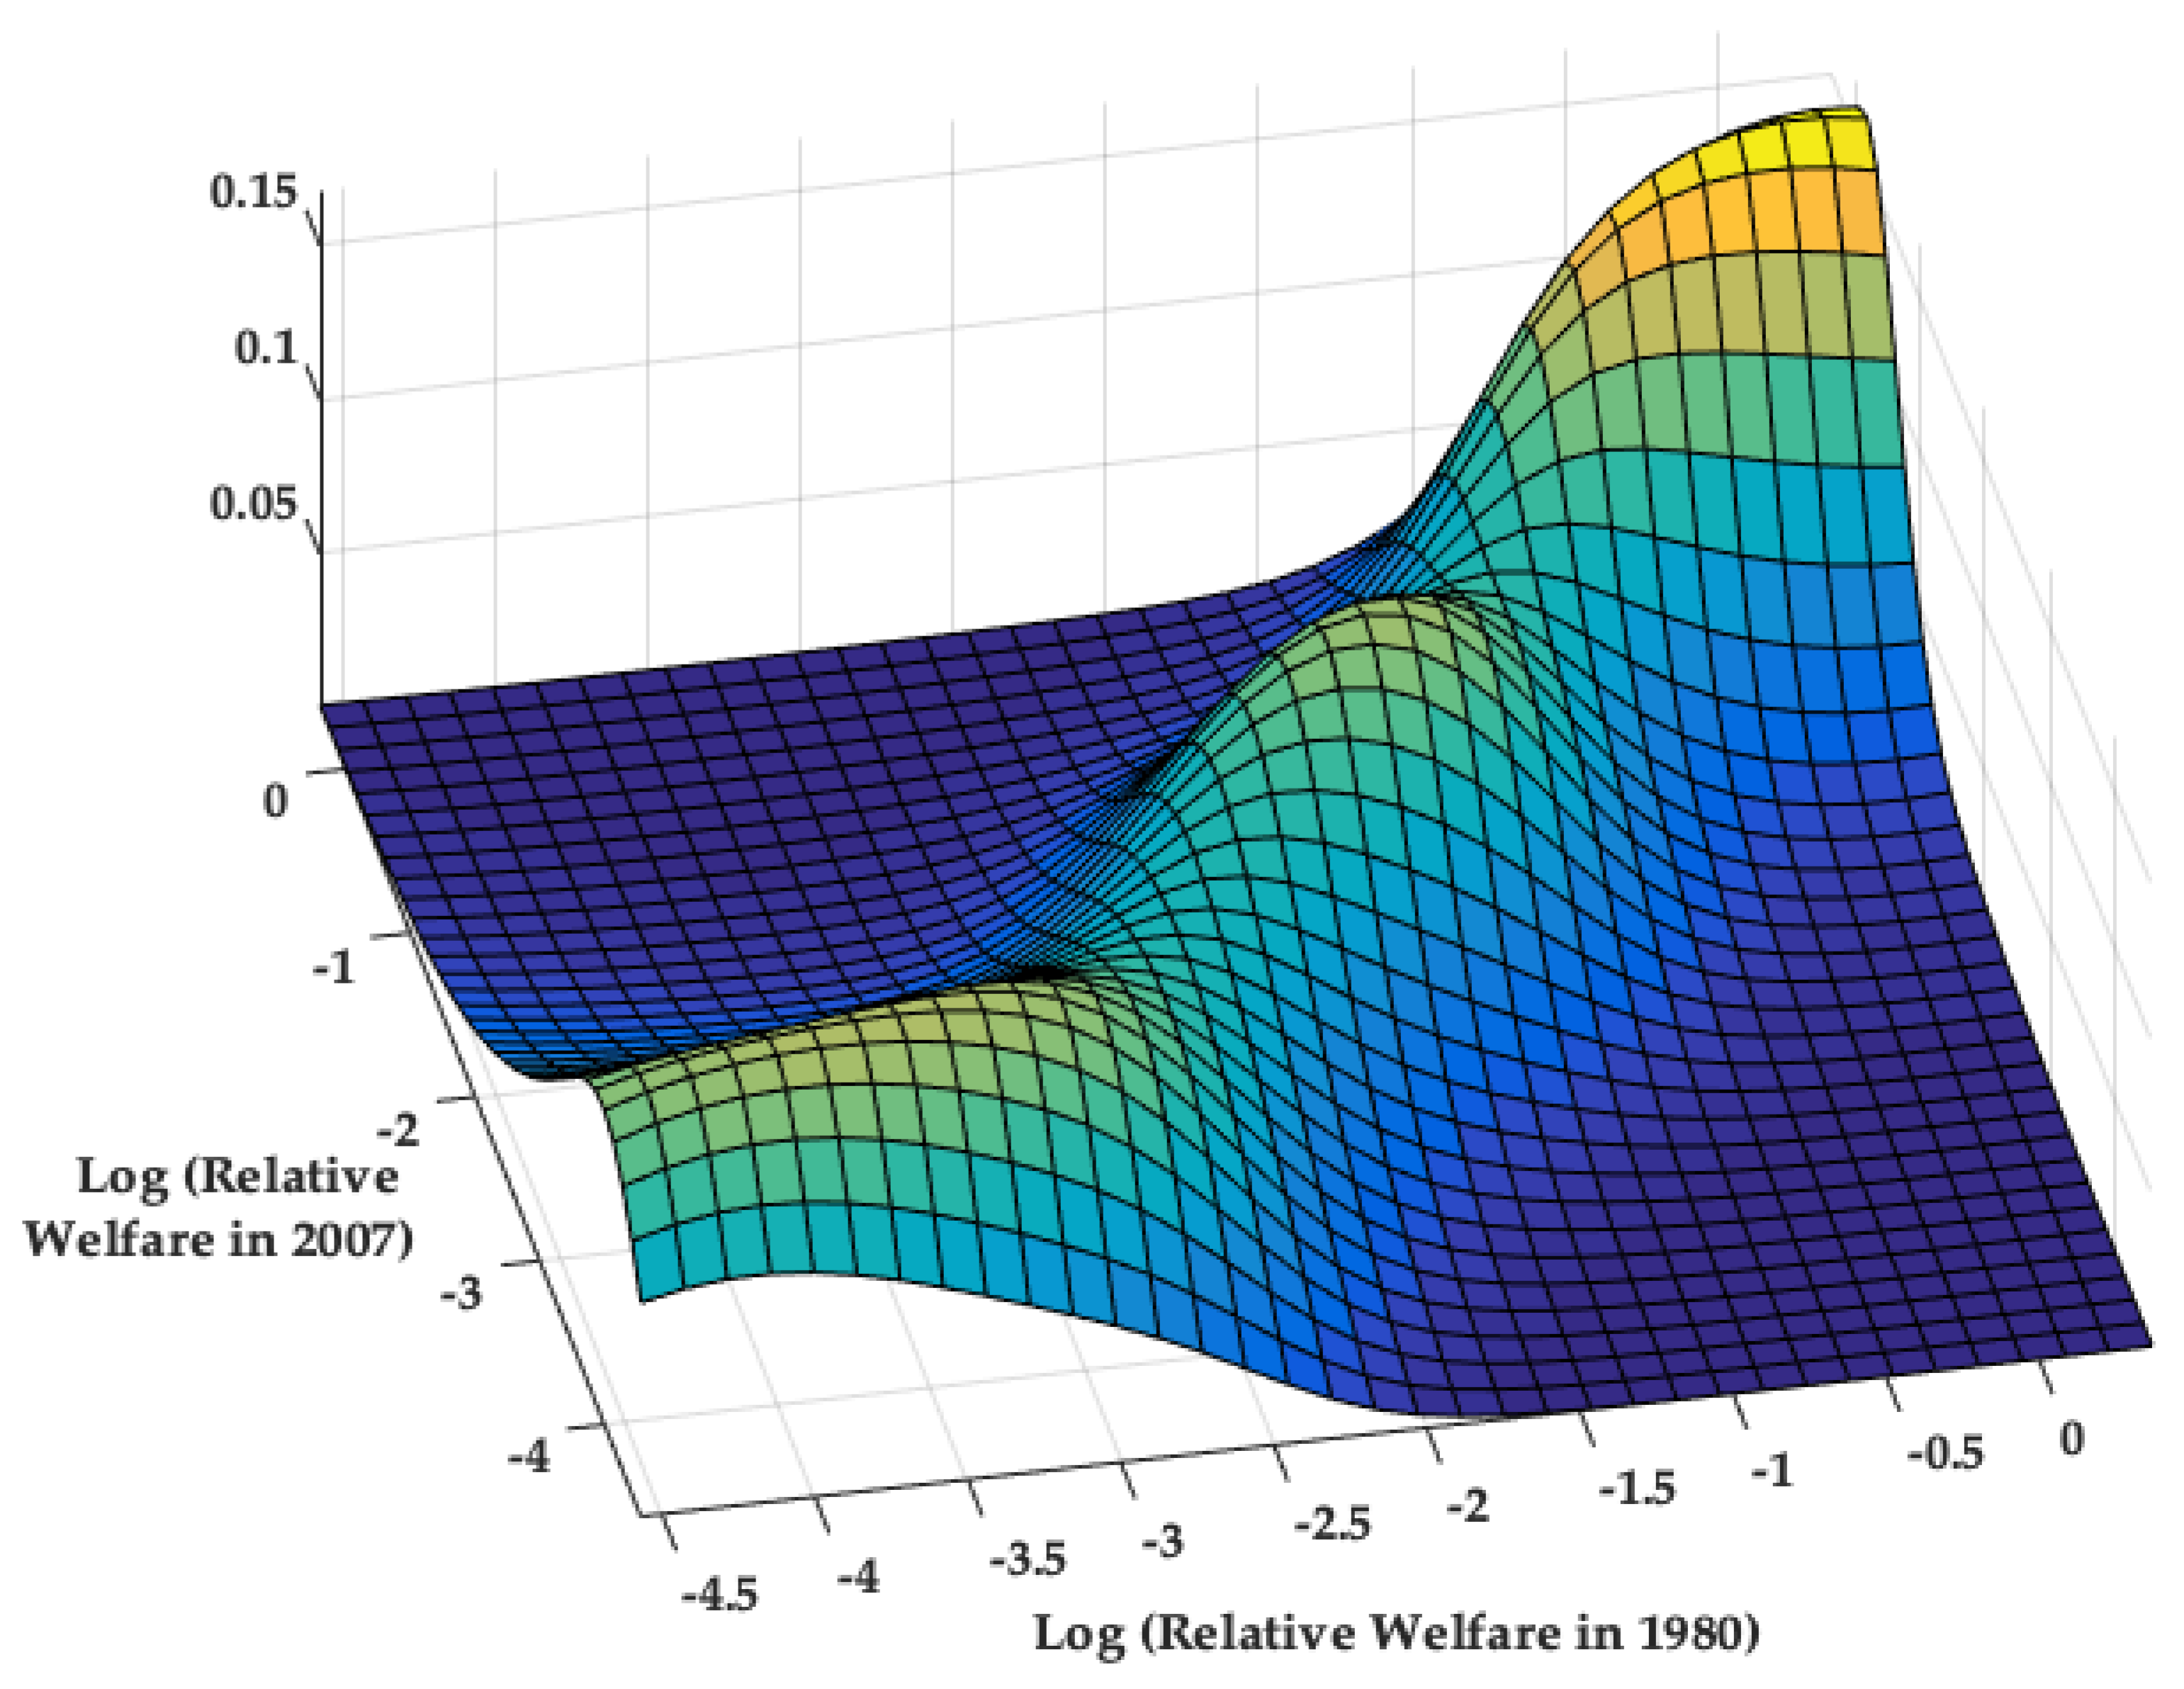
- The stochastic kernel is a conditional distribution that is calculated as follows:where is the univariate kernel distribution of relative welfare in the initial year, t, and is the (inter-temporal) bivariate kernel distribution between the years.
- The bivariate kernel distribution is estimated as follows:where and denote the relative welfare of each country at time and t, respectively, and denote kernel functions, and and denote the smoothing parameters of and , respectively. Following the convention of the literature, the kernel functions adopt a Gaussian form, and the smoothing parameters are selected based on the minimization of the Asymptotic Mean Integrated Square Error (Magrini 2009).
3. Some Stylized Facts
3.1. Lack of Sigma and Beta Convergence
3.2. Limited Forward and Backward Mobility
4. Results
4.1. Transitional Dynamics via the Stochastic Kernel Distribution
4.2. Core Clusters and Classification of Countries
4.3. Sigma and Beta Convergence within Clubs
5. Discussion
6. Concluding Remarks
Funding
Acknowledgments
Conflicts of Interest
Appendix A
| ID | Name | ISO Code | Clubs | Core Club | Relative Welfare in 1980 | Relative Welfare in 2007 |
|---|---|---|---|---|---|---|
| 1 | Luxembourg | LUX | High | NA | 52.98 | 125 |
| 2 | Iceland | ISL | High | High | 44.59 | 111.7 |
| 3 | United States | USA | High | High | 43.74 | 100 |
| 4 | Sweden | SWE | High | High | 44.3 | 91.2 |
| 5 | France | FRA | High | High | 37.72 | 91.1 |
| 6 | Australia | AUS | High | High | 35.83 | 90.7 |
| 7 | United Kingdom | GBR | High | High | 34.97 | 90.4 |
| 8 | Switzerland | CHE | High | High | 44.6 | 87.1 |
| 9 | The Netherlands | NLD | High | High | 42.88 | 86.2 |
| 10 | Austria | AUT | High | High | 32.06 | 85.5 |
| 11 | Belgium | BEL | High | High | 42.61 | 83 |
| 12 | Cyprus | CYP | High | High | 18.07 | 83 |
| 13 | Japan | JPN | High | High | 28.8 | 82.6 |
| 14 | Canada | CPV | High | High | 43.5 | 82.3 |
| 15 | Norway | NOR | High | High | 43.15 | 81 |
| 16 | Italy | ITA | High | High | 32.21 | 78 |
| 17 | Spain | ESP | High | High | 27.26 | 77.6 |
| 18 | Germany | DEU | High | High | 33.63 | 77.3 |
| 19 | Denmark | DNK | High | High | 42.91 | 75.8 |
| 20 | Finland | FIN | High | High | 27.75 | 74.4 |
| 21 | New Zealand | NZL | High | High | 28.05 | 71 |
| 22 | Greece | GRC | High | High | 22.62 | 70.5 |
| 23 | Ireland | IRL | High | High | 23.58 | 69.6 |
| 24 | Israel | ISR | High | High | 30.08 | 63.4 |
| 25 | Malta | MLT | High | High | 19.27 | 61.8 |
| 26 | Hong Kong | HKG | High | High | 22.35 | 59 |
| 27 | Singapore | SGP | High | NA | 11.82 | 56.7 |
| 28 | Qatar | QAT | High | NA | 49.23 | 52.1 |
| 29 | Barbados | BRB | High | High | 20.24 | 50.7 |
| 30 | Portugal | PRT | High | High | 16.14 | 50.7 |
| 31 | South Korea | KOR | Middle | NA | 5.56 | 45.3 |
| 32 | Macao | MCO | High | NA | 16.28 | 44.9 |
| 33 | Kuwait | KWT | High | High | 22.13 | 43 |
| 34 | Hungary | HUN | Middle | NA | 12.43 | 34.2 |
| 35 | Poland | POL | Middle | NA | 8.7 | 31.5 |
| 36 | Bahamas | BHS | Middle | NA | 12.13 | 31.1 |
| 37 | Bahrain | BHR | High | NA | 26.16 | 23.6 |
| 38 | Costa Rica | CRI | Middle | NA | 13.83 | 22.8 |
| 39 | Mexico | MEX | Middle | NA | 12.07 | 22.6 |
| 40 | Oman | OMN | Middle | Middle | 7.23 | 22.6 |
| 41 | St. Vincent | VCT | Middle | Middle | 6.66 | 22.5 |
| 42 | Turkey | TUR | Middle | NA | 4.65 | 22.3 |
| 43 | Argentina | ARG | Middle | NA | 5.78 | 21.8 |
| 44 | Saint Lucia | LCA | Middle | NA | 20.29 | 20.9 |
| 45 | Bulgaria | BGR | Middle | Middle | 9.13 | 20.6 |
| 46 | Chile | CHL | Middle | Middle | 9.88 | 19.7 |
| 47 | Saudi Arabia | SAU | Middle | Middle | 8.16 | 19.6 |
| 48 | Trinidad/Tobago | TTO | High | NA | 31.63 | 19 |
| 49 | Lebanon | LBN | Middle | Middle | 7.16 | 19 |
| 50 | Belize | BLZ | Middle | Middle | 11.16 | 18.5 |
| 51 | Uruguay | URY | Middle | NA | 12.7 | 18 |
| 52 | Albania | ALB | Middle | Middle | 6.42 | 16.8 |
| 53 | Dominican Rep. | DOM | Middle | Middle | 7.03 | 16.2 |
| 54 | Mauritius | MUS | Middle | Middle | 8.3 | 16 |
| 55 | Iran | IRN | Middle | NA | 2.65 | 16 |
| 56 | Venezuela | VEN | Middle | NA | 11.85 | 15.3 |
| 57 | Malaysia | MYS | Middle | Middle | 7.45 | 15.1 |
| 58 | Panama | PAN | Middle | Middle | 8.58 | 14.3 |
| 59 | Maldives | MDV | Low | NA | 0.98 | 13.5 |
| 60 | Jamaica | JAM | Middle | Middle | 6.01 | 13.1 |
| 61 | Brazil | BRA | Middle | Middle | 4.46 | 11.5 |
| 62 | Tunisia | TUN | Middle | Middle | 4.84 | 11.2 |
| 63 | Fiji | FJI | Middle | Middle | 5.54 | 10.9 |
| 64 | Thailand | THA | Middle | NA | 3.99 | 10.9 |
| 65 | Jordan | JOR | Middle | NA | 9.75 | 10.8 |
| 66 | Peru | PER | Middle | NA | 4.12 | 9.9 |
| 67 | Ecuador | ECU | Middle | Middle | 5.36 | 9.2 |
| 68 | Colombia | COL | Middle | NA | 6.92 | 9.1 |
| 69 | Egypt | EGY | Low | NA | 1.56 | 8.9 |
| 70 | Suriname | SUR | Middle | NA | 8.89 | 8.7 |
| 71 | Syria | SYR | Middle | NA | 6.17 | 8.2 |
| 72 | Sri Lanka | LKA | Middle | NA | 3.06 | 7.8 |
| 73 | Cape Verde | CAF | Low | NA | 1.58 | 7.7 |
| 74 | Guatemala | GTM | Middle | NA | 3.62 | 7.3 |
| 75 | Honduras | HND | Middle | NA | 3.87 | 7.2 |
| 76 | Gabon | GAB | Middle | NA | 6.58 | 6.6 |
| 77 | China | CHN | Low | NA | 1.86 | 6.6 |
| 78 | Mongolia | MNG | Low | NA | 2.04 | 6.3 |
| 79 | Paraguay | PRY | Middle | NA | 4.17 | 5.9 |
| 80 | Bhutan | BTN | Low | NA | 0.93 | 5.9 |
| 81 | Indonesia | IDN | Low | NA | 2.1 | 5.7 |
| 82 | Iraq | IRQ | Low | NA | 1.45 | 5.3 |
| 83 | Morocco | MAR | Low | Low | 3.39 | 5.2 |
| 84 | Philippines | PHL | Low | NA | 4.08 | 4.9 |
| 85 | Bolivia | BOL | Low | NA | 1.52 | 4.8 |
| 86 | South Africa | ZAF | Low | NA | 4.38 | 4.5 |
| 87 | Pakistan | PAK | Low | Low | 2.68 | 4.4 |
| 88 | Botswana | BWA | Low | Low | 1.97 | 4.3 |
| 89 | Namibia | NAM | Low | Low | 3.15 | 4.1 |
| 90 | Vietnam | VNM | Low | NA | 1.25 | 4 |
| 91 | India | IND | Low | Low | 1.61 | 3.9 |
| 92 | Sudan | SDN | Low | Low | 1.62 | 3.8 |
| 93 | Sao Tome/Princi | STP | Low | Low | 3.54 | 3.7 |
| 94 | Ghana | GHA | Low | Low | 2.1 | 3.3 |
| 95 | Djibouti | DJI | Low | Low | 3.48 | 3.2 |
| 96 | Swaziland | SWZ | Low | NA | 4.67 | 3.1 |
| 97 | Zimbabwe | ZWE | Low | Low | 3.44 | 3.1 |
| 98 | Lao | LAO | Low | NA | 1.02 | 3 |
| 99 | Mauritania | MRT | Low | Low | 2.26 | 2.9 |
| 100 | Cambodia | CMR | Low | NA | 0.66 | 2.7 |
| 101 | Bangladesh | BGD | Low | Low | 2.08 | 2.5 |
| 102 | Senegal | SEN | Low | Low | 2 | 2.4 |
| 103 | Comoros | COM | Low | Low | 1.77 | 2.3 |
| 104 | Nigeria | NGA | Low | Low | 1.49 | 2.3 |
| 105 | Cameroon | CAN | Low | Low | 2.44 | 2.2 |
| 106 | Lesotho | LSO | Low | Low | 2.28 | 2.2 |
| 107 | Cote d’Ivoire | CIV | Low | Low | 2.81 | 2 |
| 108 | Congo | COD | Low | NA | 3.29 | 1.9 |
| 109 | Kenya | KEN | Low | Low | 2.72 | 1.9 |
| 110 | Benin | BEN | Low | Low | 1.46 | 1.9 |
| 111 | Angola | AGO | Low | Low | 1.45 | 1.9 |
| 112 | Chad | TCD | Low | Low | 1.12 | 1.9 |
| 113 | Zambia | ZMB | Low | Low | 2.53 | 1.8 |
| 114 | Togo | TGO | Low | Low | 1.48 | 1.8 |
| 115 | Nepal | NPL | Low | NA | 1.04 | 1.8 |
| 116 | Uganda | UGA | Low | NA | 0.87 | 1.7 |
| 117 | Tanzania | TZA | Low | Low | 2.4 | 1.6 |
| 118 | Rwanda | RWA | Low | Low | 1.57 | 1.6 |
| 119 | Madagascar | MDG | Low | Low | 1.51 | 1.6 |
| 120 | Guinea | GIN | Low | Low | 2.36 | 1.5 |
| 121 | Burkina Faso | BFA | Low | NA | 0.97 | 1.5 |
| 122 | Mali | MLI | Low | NA | 0.77 | 1.5 |
| 123 | Sierra Leone | SLE | Low | Low | 2.21 | 1.4 |
| 124 | Liberia | LBR | Low | Low | 2.18 | 1.3 |
| 125 | Ethiopia | ETH | Low | NA | 1.2 | 1.3 |
| 126 | C. Afr. Republic | KHM | Low | NA | 1.54 | 1.2 |
| 127 | Niger | NER | Low | NA | 1.33 | 1.2 |
| 128 | Malawi | MWI | Low | NA | 1.26 | 1.2 |
References
- Athey, Susan. 2018. The impact of machine learning on economics. In The Economics of Artificial Intelligence: An Agenda. Chicago: University of Chicago Press. [Google Scholar]
- Athey, Susan, and Guido W. Imbens. 2019. Machine learning methods that economists should know about. Annual Review of Economics 11: 685–725. [Google Scholar] [CrossRef]
- Azzalini, Adelchi, and Giovanna Menardi. 2014a. An advancement in clustering via nonparametric density estimation. Statistics and Computing 24: 753–67. [Google Scholar]
- Azzalini, Adelchi, and Giovanna Menardi. 2014b. Clustering via nonparametric density estimation: The r package pdfcluster. Journal of Statistical Software 57: 1–26. [Google Scholar] [CrossRef]
- Azzalini, Adelchi, and Nicola Torelli. 2007. Clustering via nonparametric density estimation. Statistics and Computing 17: 71–80. [Google Scholar] [CrossRef]
- Barro, Robert J., and Xavier Sala-i Martin. 1992. Convergence. Journal of Political Economy 100: 223–51. [Google Scholar] [CrossRef]
- Battisti, Michele, and Christopher F. Parmeter. 2012. Gdp clustering: A reappraisal. Economics Letters 117: 837–40. [Google Scholar] [CrossRef]
- Battisti, Michele, and Christopher F. Parmeter. 2013. Clustering and polarization in the distribution of output: A multivariate perspective. Journal of Macroeconomics 35: 144–62. [Google Scholar] [CrossRef]
- Baumol, William J. 1986. Productivity growth, convergence, and welfare: What the long-run data show. The American Economic Review 76: 1072–85. [Google Scholar] [CrossRef]
- Becker, Gary S., Tomas J. Philipson, and Rodrigo R. Soares. 2005. The quantity and quality of life and the evolution of world inequality. American Economic Review 95: 277–91. [Google Scholar] [CrossRef]
- Berlage, Lodewijk, and Dirk Terweduwe. 1988. The classification of countries by cluster and by factor analysis. World Development 16: 1527–45. [Google Scholar] [CrossRef]
- Cordoba, Juan Carlos, and Genevieve Verdier. 2008. Inequality and growth: Some welfare calculations. Journal of Economic Dynamics and Control 32: 1812–29. [Google Scholar] [CrossRef]
- Dal Bianco, Silvia. 2016. Going clubbing in the eighties: Convergence in manufacturing sectors at a glance. Empirical Economics 50: 623–59. [Google Scholar] [CrossRef]
- Dowrick, Steve, and Duc-Tho. T. Nguyen. 1989. Oecd comparative economic growth 1950–1985: Catch-up and convergence. American Economic Review 79: 1010–30. [Google Scholar]
- Durlauf, Steven N., Paul A. Johnson, and Jonathan R. W. Temple. 2005. Growth econometrics. In Handbook of Economic Growth. Amsterdam: North Holland. [Google Scholar]
- Epstein, Philip, Peter Howlett, and Max-Stephan Schulze. 2003. Distribution dynamics: Stratification, polarization, and convergence among oecd economies, 1870–1992. Explorations in Economic History 40: 78–97. [Google Scholar] [CrossRef]
- Fleurbaey, Marc. 2009. Beyond gdp: The quest for a measure of social welfare. Journal of Economic Literature 47: 1029–75. [Google Scholar] [CrossRef]
- Fleurbaey, Marc, and Didier Blanchet. 2013. Beyond GDP: Measuring Welfare and Assessing Sustainability. Oxford: Oxford University Press. [Google Scholar]
- Fleurbaey, Marc, and Guillaume Gaulier. 2009. International comparisons of living standards by equivalent incomes. Scandinavian Journal of Economics 111: 597–624. [Google Scholar] [CrossRef]
- Galor, Oded. 1996. Convergence? Inferences from theoretical models. Economic Journal 106: 1056–69. [Google Scholar] [CrossRef]
- Hartigan, John A. 1975. Clustering Algorithms. New York: John Wiley and Sons. [Google Scholar]
- Johnson, Paul, and Chris Papageorgiou. 2018. What Remains of Cross-Country Convergence? MPRA Working Paper 89355. Munich: University Library of Munich. [Google Scholar]
- Jones, Charles I., and Peter J. Klenow. 2016. Beyond gdp? Welfare across countries and time. American Economic Review 106: 2426–57. [Google Scholar] [CrossRef]
- Kaufman, Leonard, and Peter J. Rousseeuw. 2010. Finding Groups in Data: An Introduction to Cluster Analysis. lNew York: John Wiley and Sons. [Google Scholar]
- Magrini, Stefano. 2009. Why should we analyse convergence using the distribution dynamics approach? Scienze Regionali 8: 5–34. [Google Scholar]
- Mendez, Carlos. 2017. Convergence Clubs Beyond GDP: A Non-Parametric Density Approach. MPRA Working Paper 82048. Munich: University Library of Munich. [Google Scholar]
- Mendez, Carlos. 2018. On the distribution dynamics of human development: Evidence from the metropolitan regions of bolivia. Economics Bulletin 38: 2467–75. [Google Scholar]
- Pittau, Maria Grazia, Roberto Zelli, and Riccardo Massari. 2016. Evidence of convergence clubs using mixture models. Econometric Reviews 35: 1317–42. [Google Scholar] [CrossRef]
- Quah, Danny. 1993. Galton’s fallacy and tests of the convergence hypothesis. The Scandinavian Journal of Economics 95: 427–43. [Google Scholar] [CrossRef]
- Quah, Danny T. 1996a. Empirics for economic growth and convergence. European Economic Review 40: 1353–75. [Google Scholar] [CrossRef]
- Quah, Danny T. 1996b. Twin peaks: Growth and convergence in models of distribution dynamics. Economic Journal 106: 1045–55. [Google Scholar] [CrossRef]
- Quah, Danny T. 1997. Empirics for growth and distribution: Stratification, polarization, and convergence clubs. Journal of Economic Growth 2: 27–59. [Google Scholar] [CrossRef]
- Sala-i Martin, Xavier. 1996. The classical approach to convergence analysis. Economic Journal 106: 1019–36. [Google Scholar] [CrossRef]
- Stiglitz, Joseph E., Jean-Paul Fitoussi, and Martine Durand. 2019. Measuring What Counts: A New Dashboard for Well-Being. New York: The New Press. [Google Scholar]
- Stiglitz, Joseph E., Amartya Sen, and Jean-Paul Fitoussi. 2010. Mismeasuring Our Lives: Why GDP Doesn’t Add Up. New York: The New Press. [Google Scholar]
| 1 | GDP per capita is a useful variable in the sense that it correlates with other human development variables such as educational attainment, life expectancy, and even subjective happiness. |
| 2 | For further details on the measurement and calculations of the variables, see the Appendix of Jones and Klenow (2016). |
| 3 | The database can be accessed at https://web.stanford.edu/~chadj/BeyondGDP500.xls. |
| 4 | Although one could use the latest versions of the Penn World Table, UNI-WIDER, and the World Bank databases to extend the analysis beyond 2007, the purpose of this paper is to be directly comparable with the paper of Jones and Klenow (2016). Thus, the reference period for comparison is still the 1980–2007 period. Further research, beyond the scope of this paper, could extend the period of analysis and evaluate the persistence of the convergence clusters. |
| 5 | See Sala-i Martin (1996) for further details. |
| 6 | For a more comprehensive and recent presentation of the distributional convergence approach, see Dal Bianco (2016), Durlauf et al. (2005), Epstein et al. (2003), or Mendez (2018) |
| 7 | See Appendix A for a list of countries their respective clubs. |
| 8 | Although the frameworks are similar, they are not identical. The work in Battisti and Parmeter (2012) used a semi-parametric density-based clustering framework, while this paper uses a non-parametric density-based clustering framework. |

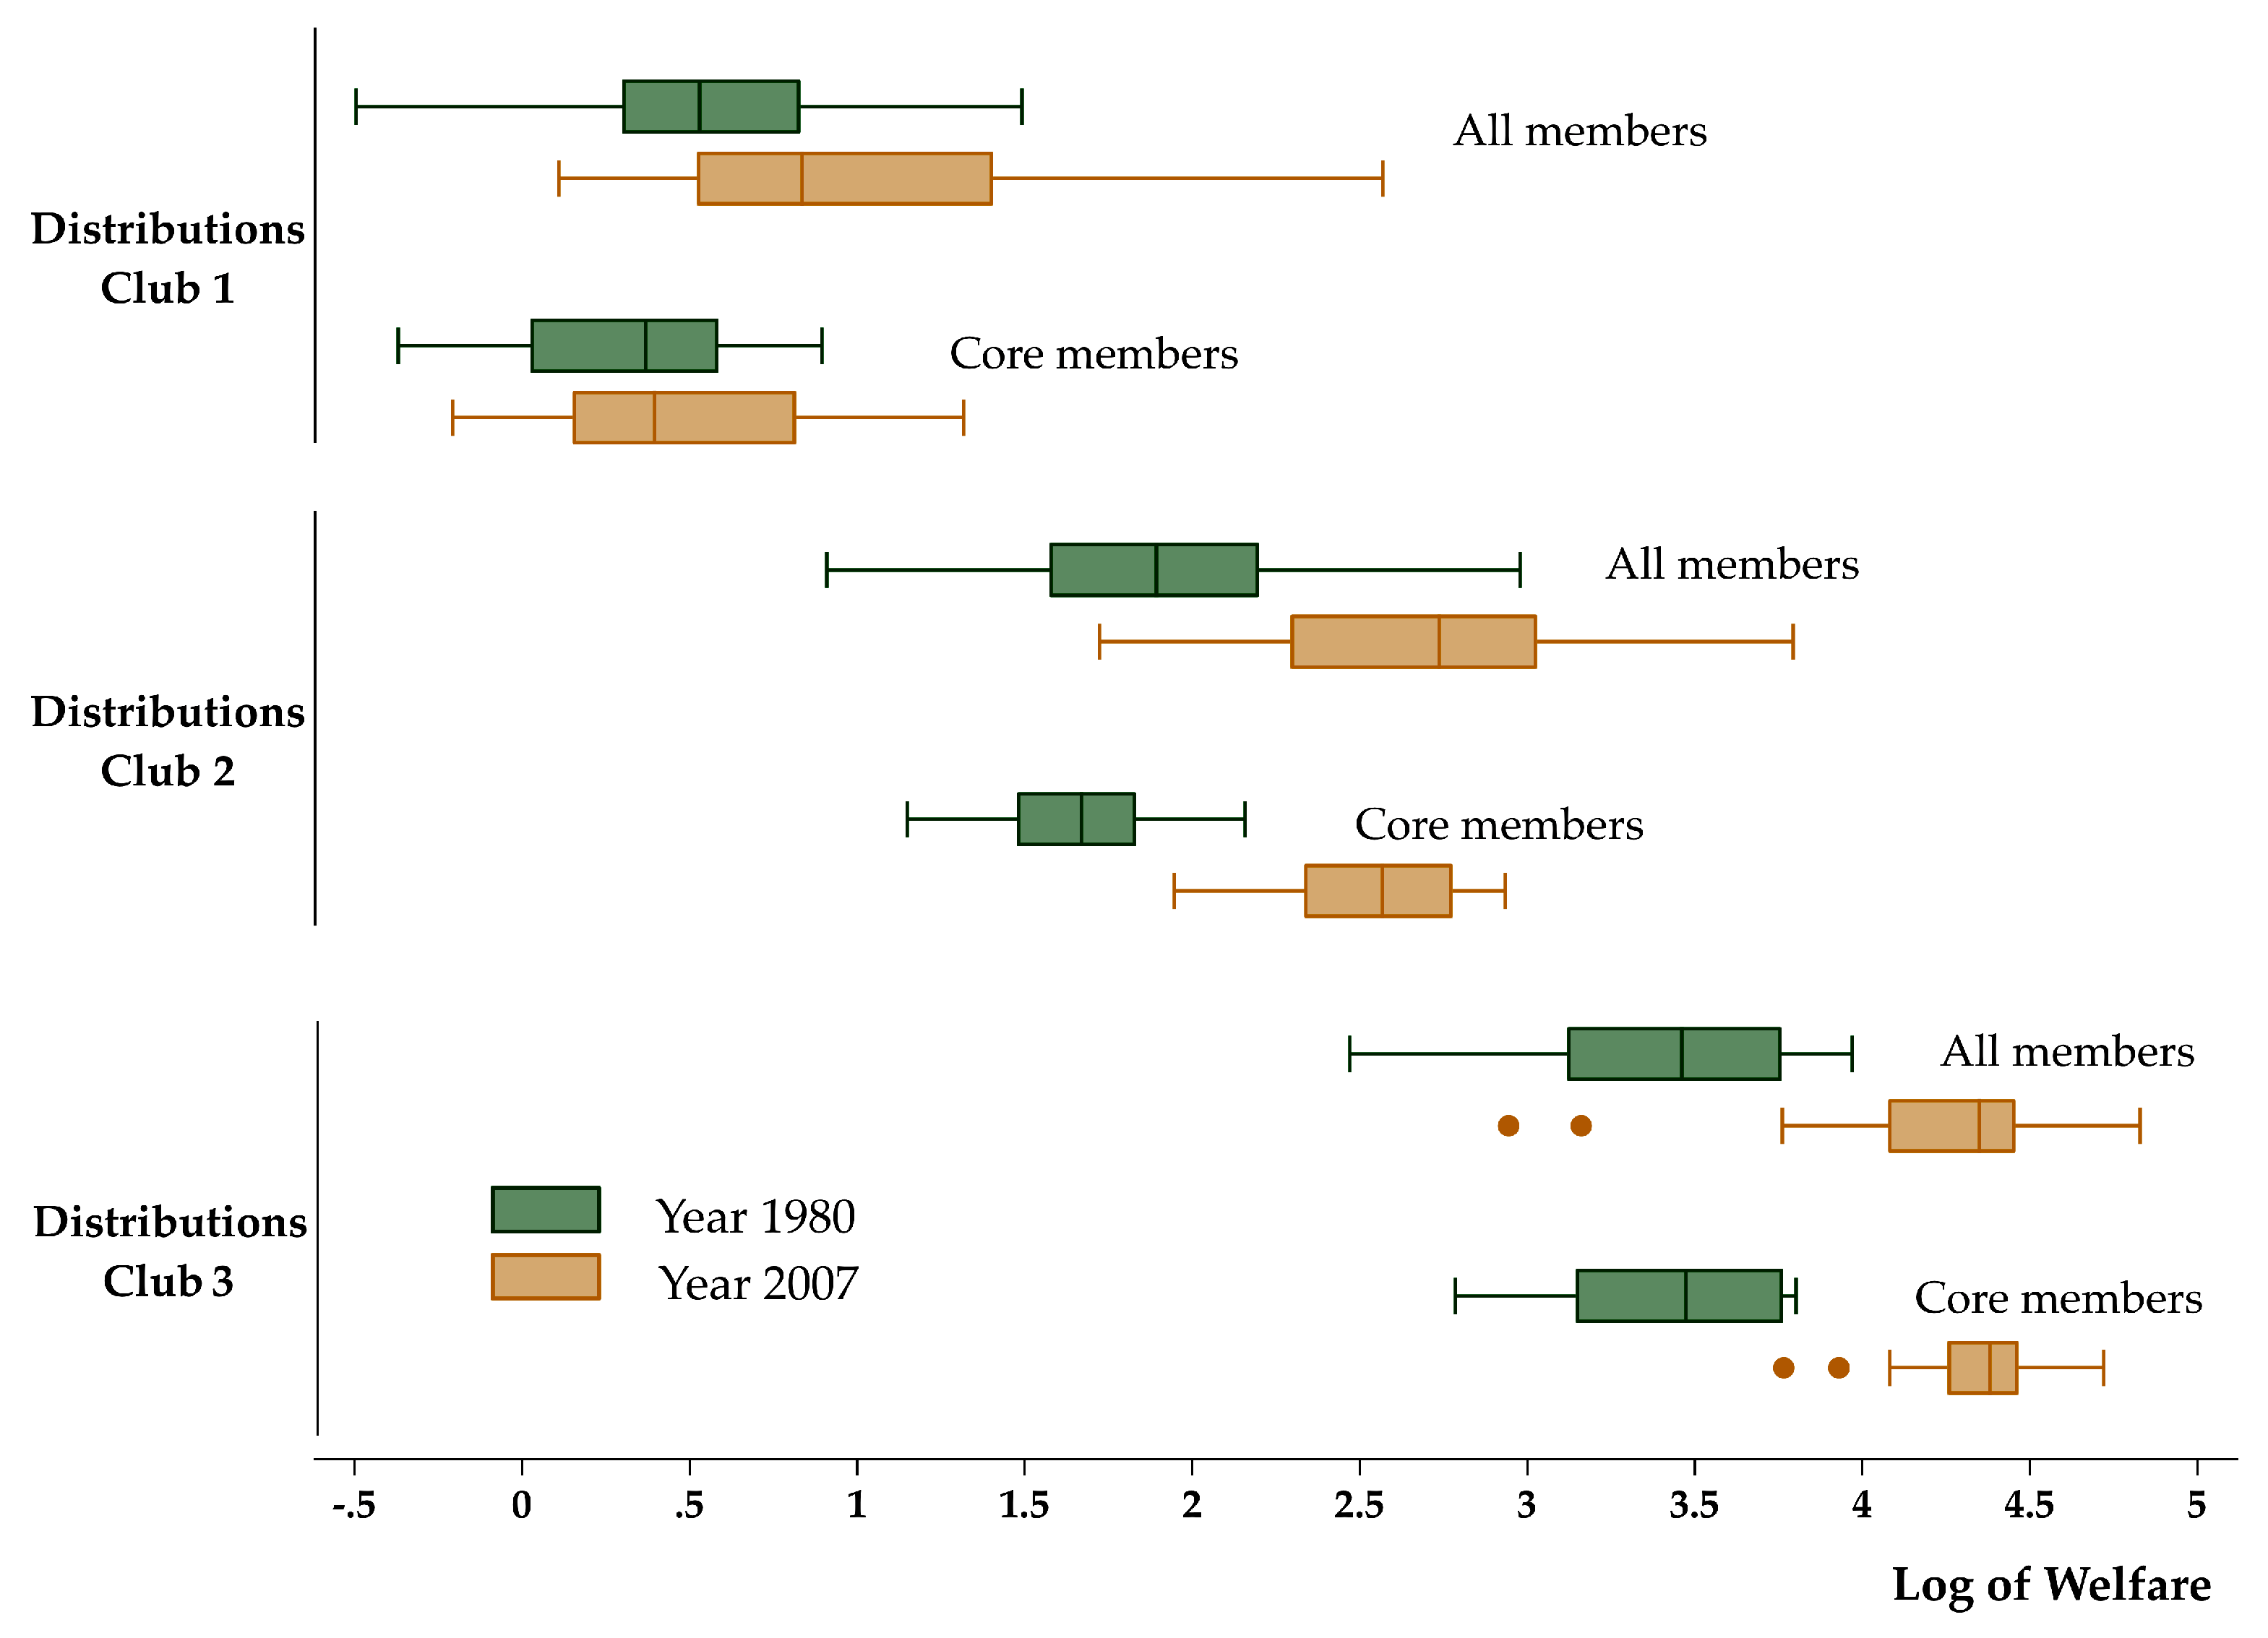

| Standard Deviation | Standard Deviation | Dispersion Ratio | ANOVA Test | |
|---|---|---|---|---|
| Log of Relative Welfare 1980 | Log of Relative Welfare 2007 | 1980/2007 | p-Value | |
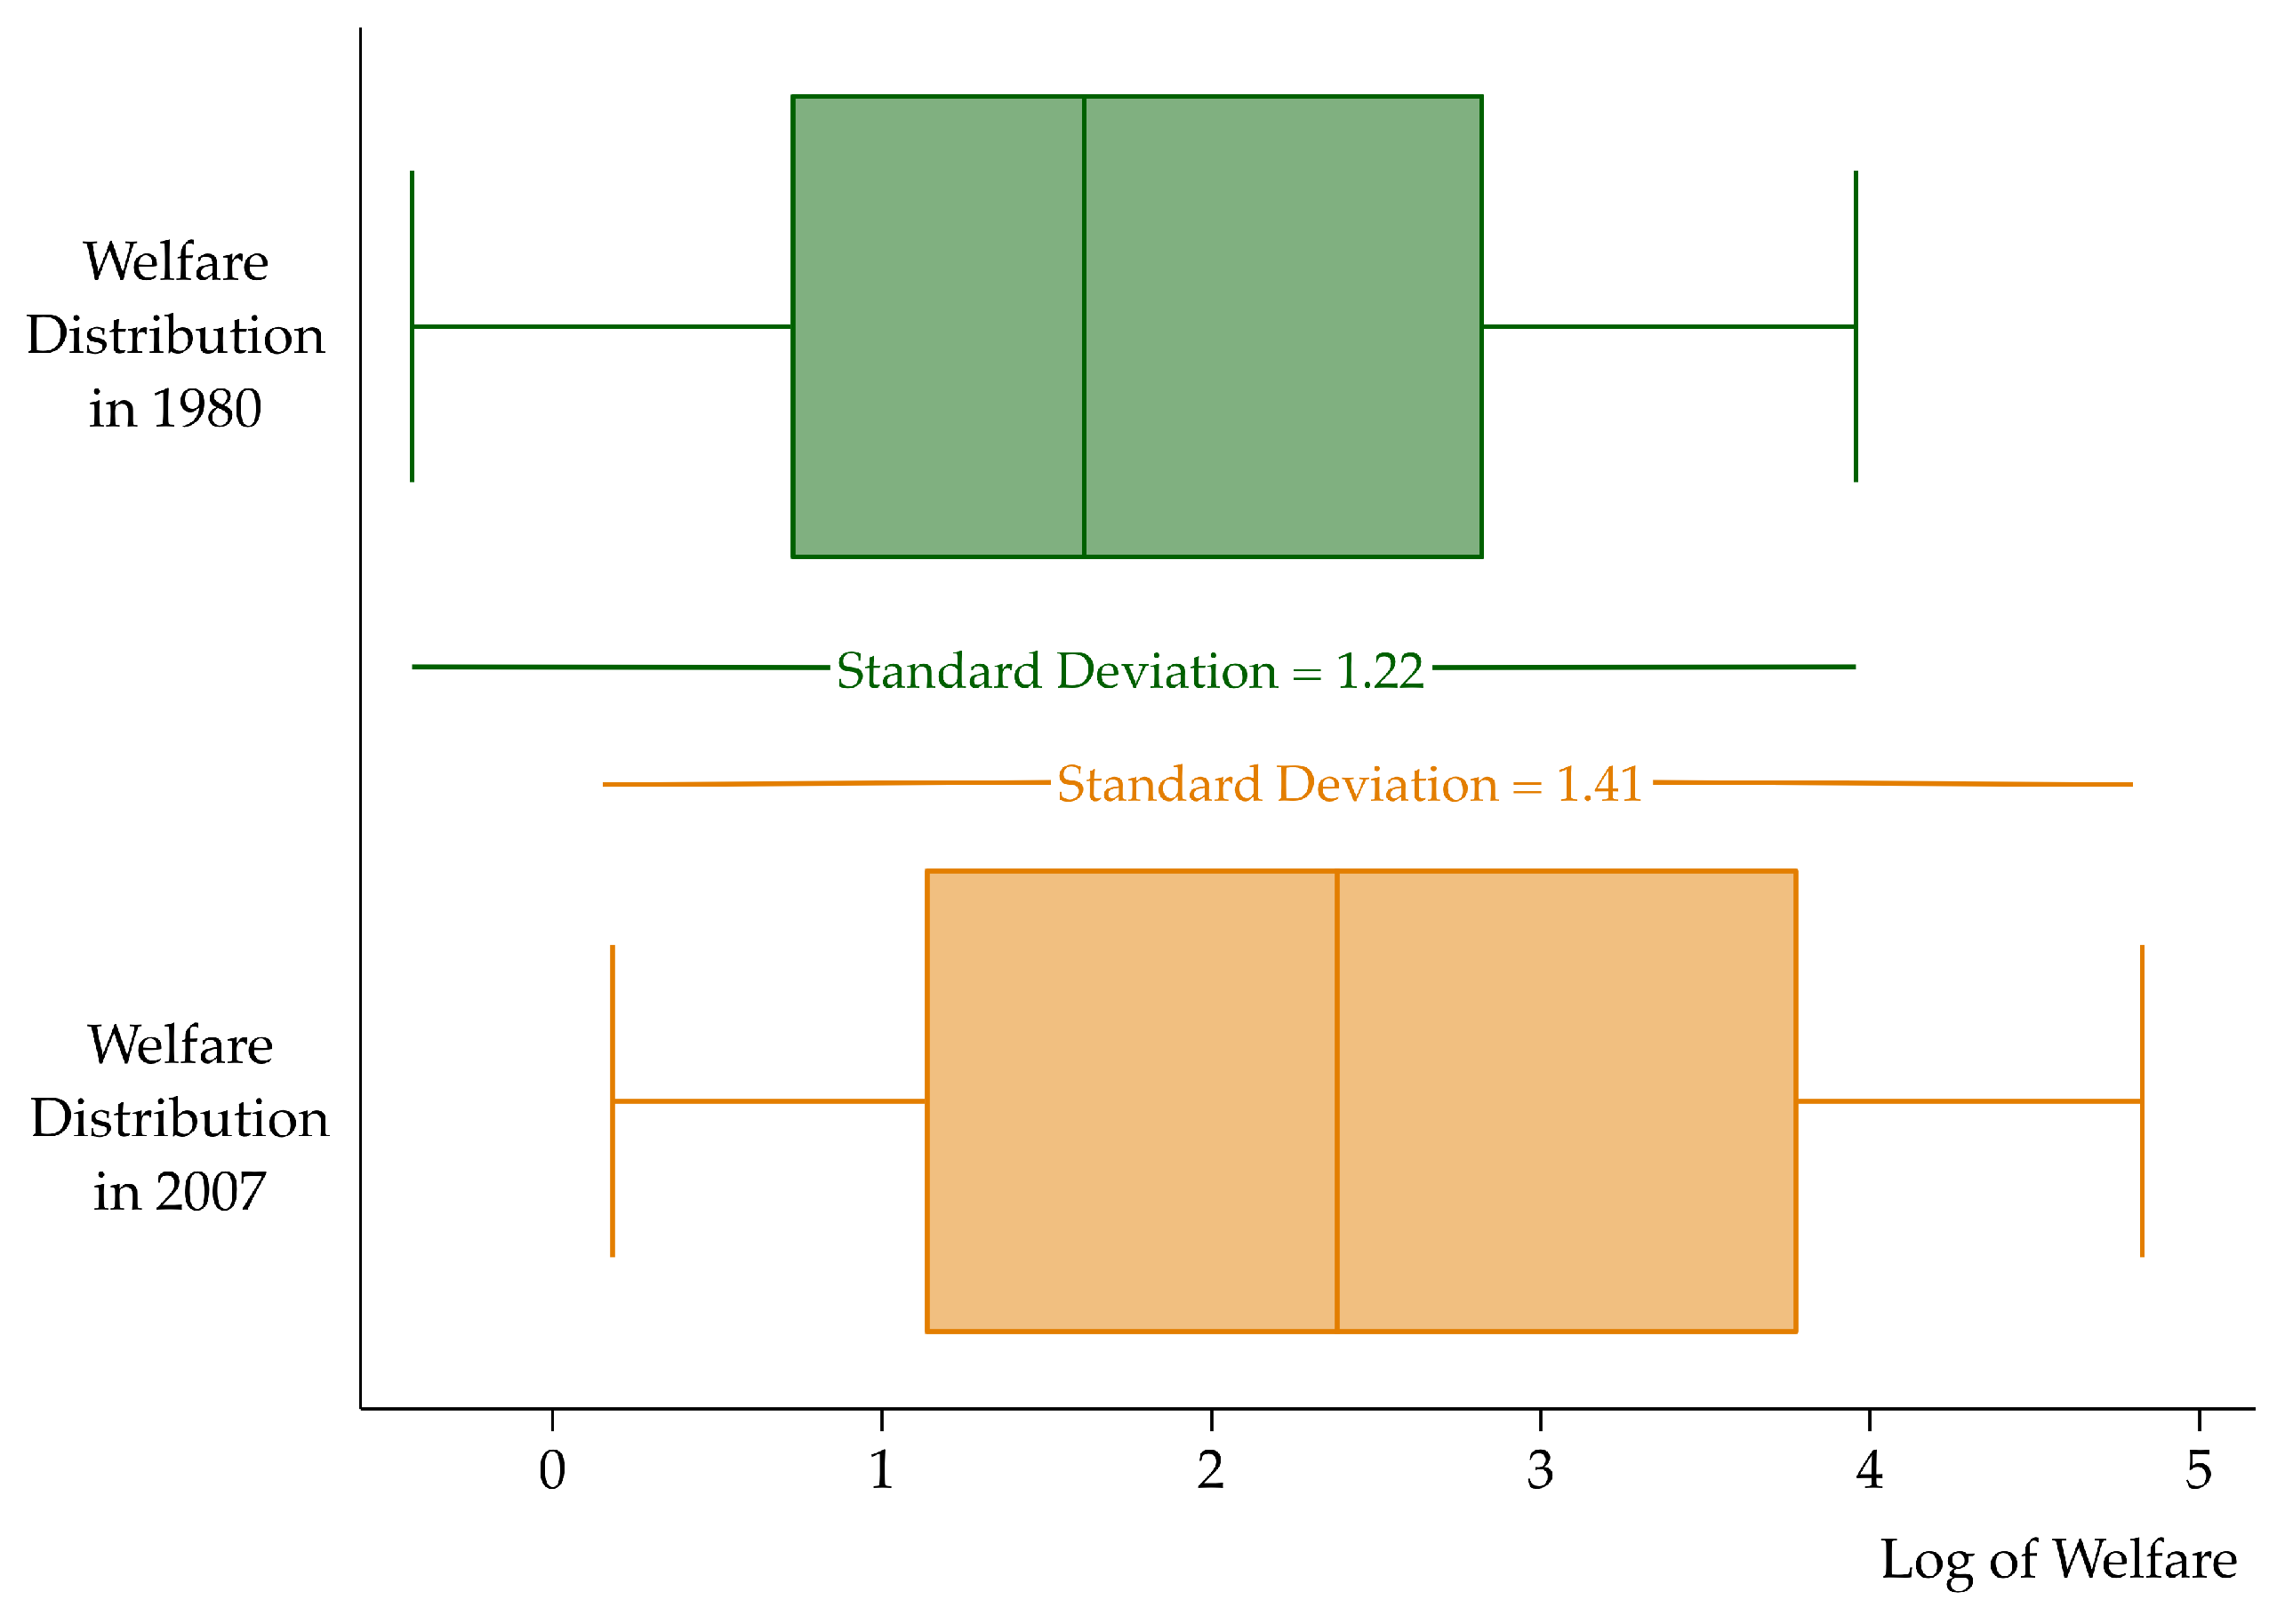
| Total (128 members) | 1.22 | 1.41 | 0.86 | 0.10 |
| Club 1 (All 54 members) | 0.46 | 0.58 | 0.79 | 0.09 |
| Club 2 (All 40 members) | 0.45 | 0.49 | 0.92 | 0.62 |
| Club 3 (All 34 members) | 0.37 | 0.39 | 0.96 | 0.80 |
| Club 1 (Core 30 members) | 0.31 | 0.39 | 0.80 | 0.23 |
| Club 2 (Core 17 members) | 0.25 | 0.27 | 0.92 | 0.75 |
| Club 3 (Core 28 members) | 0.32 | 0.21 | 1.47 | 0.05 |
| Club 1 | |||
|---|---|---|---|
| Variable | Coefficient | t-Statistic | p-Value |
| constant | 0.0337 | 6.9442 | 0.0000 |
| log(y0)/T | −0.8252 | −4.76 | 0.0000 |
| R2 | 0.3 | ||
| Speed of convergence () | 6.46% | ||
| Half-life (periods) | 11 | ||
| Club 2 | |||
| Variable | Coefficient | t-Statistic | p-Value |
| constant | 0.0599 | 5.4013 | 0.0000 |
| log(y0)/T | −0.4388 | −2.9187 | 0.0059 |
| R2 | 0.18 | ||
| Speed of convergence () | 2.14% | ||
| Half-life (periods) | 32 | ||
| Club 3 | |||
| Variable | Coefficient | t-Statistic | p-Value |
| constant | 0.0966 | 4.6296 | 0.0001 |
| log(y0)/T | −0.5231 | −3.1832 | 0.0032 |
| R2 | 0.24 | ||
| Speed of convergence () | 2.74% | ||
| Half-life (periods) | 25 |
© 2019 by the author. Licensee MDPI, Basel, Switzerland. This article is an open access article distributed under the terms and conditions of the Creative Commons Attribution (CC BY) license (http://creativecommons.org/licenses/by/4.0/).
Share and Cite
Mendez, C. Lack of Global Convergence and the Formation of Multiple Welfare Clubs across Countries: An Unsupervised Machine Learning Approach. Economies 2019, 7, 74. https://doi.org/10.3390/economies7030074
Mendez C. Lack of Global Convergence and the Formation of Multiple Welfare Clubs across Countries: An Unsupervised Machine Learning Approach. Economies. 2019; 7(3):74. https://doi.org/10.3390/economies7030074
Chicago/Turabian StyleMendez, Carlos. 2019. "Lack of Global Convergence and the Formation of Multiple Welfare Clubs across Countries: An Unsupervised Machine Learning Approach" Economies 7, no. 3: 74. https://doi.org/10.3390/economies7030074
APA StyleMendez, C. (2019). Lack of Global Convergence and the Formation of Multiple Welfare Clubs across Countries: An Unsupervised Machine Learning Approach. Economies, 7(3), 74. https://doi.org/10.3390/economies7030074


