Article

Unemployment and Growth in the Tourism Sector in Mexico: Revisiting the Growth-Rate Version of Okun’s Law

by
Fernando Sánchez López
Facultad de Ciencias, Universidad Nacional Autónoma de México, 04510 Ciudad de México, Mexico
Economies 2019, 7(3), 83; https://doi.org/10.3390/economies7030083
Submission received: 30 June 2019 / Revised: 26 July 2019 / Accepted: 14 August 2019 / Published: 20 August 2019

Abstract

:
In this paper, we analyze, by means of the difference version of Okun’s law, the relationship between tourism sector growth and unemployment in Mexico during the period 2000Q2–2018Q4. The results show that tourism growth is a palliative for unemployment, whereas unemployment reduces the growth of the tourism sector. The results also show that the relationship between the mentioned variables becomes stronger during an economic crisis and weaker during expansion periods.
JEL Classification:
C32; E24; O47; Z32

1. Introduction

In recent years, tourism has grown faster than the global economy; in fact, during 2018, tourism grew by 3.9%, generating 319 million jobs. These results have reinforced tourism’s image as an economic growth driver and job creator (World Travel and Tourism Council 2019). Moreover, tourism has become the world’s fourth largest exportation industry, just after fuel, food, and chemicals (Ohlan 2017). Consequently, tourism is considered a key sector for economic recovery (Jucan and Jucan 2013), and many nations rely on its expansion as a source of income and as one of their main economic development catalysts (Álvarez-Díaz et al. 2014).
Tourism impacts household income and governmental revenue via multiplier effects and improvements in the balance of payments (Chou 2013). Effectively, according to Dogru et al. (2019), tourism, besides contributing to economic growth, is capable of correcting a nation’s deficit in the balance of payments. Equally, tourism is recognized as being interrelated with most of the productive branches as tourist expenditure produces economic spillover into the different sectors linked to the tourism sector of a destination (Acerenza 2012). As noted by Dahdá (2003), there is no tourism without transportation, restaurant services, or hostelry; the same occurs without the appropriate infrastructure, structure, and superstructure.
Another variable closely related to tourism demand growth is the exchange rate, as depreciation in the national currency results in less expensive tourist products, which attracts international tourists, although outbound tourism could be reduced (Dogru et al. 2019), for outbound tourism behaves as a form of import (Seetaram 2010). Concordantly, in the Mexican case, Sánchez and Cruz (2016) have found, using the nominal exchange rate peso-American dollar, that international visitors positively respond to depreciation.
Tourism is considered to have great potential for job creation; in fact, it is expected that by 2022, tourism will generate, globally, one of every ten jobs (Chou 2013). In this sense, tourism is considered to alleviate gender inequality, as women represent a large proportion of the formal tourism workforce; moreover, tourism has twice as many female employers when compared to other sectors, although women earn between 10% and 15% less than their male counterparts (Lemma 2014). In addition, tourism activities comprise a significant proportion of unpaid jobs, due to the number of unremunerated family members working in small hotels or restaurants (Ferguson 2010).
For its part, Mexico is considered, according to the data provided by Datatur (2019b), one of the ten most visited countries in the world, and is the country with the highest influx of tourists in Latin America; it is also among the principal receptors of foreign currencies via tourism. Its tourism sector has been very dynamic, as it grows at similar rates to those of the national economy, and in many occasions, above them (Datatur 2019a). Mexico’s tourism success has been gained in spite of the violence that the country has recently undergone, above all because the country has gained a reputation for being a hospitable nation, and a vast share of its cultural and natural patrimony has been inscribed by the United Nations Educational, Scientific and Cultural Organization (UNESCO) (Girault 2013).
Traditionally, the impact of tourism on an economy has been studied from the perspective of either tourist expenditure or arrivals; examples of such approaches, among others, are Balaguer and Cantavella-Jordá (2002); Brida et al. (2008); Işik et al. (2017); Lau et al. (2008); Phiri (2016), and Sánchez (2019). In this document, different from the classical approaches, a modified growth-rate version of Okun’s law is proposed in order to study the relationship between variations in the unemployment rate and the growth of the tourism sector.
The above-mentioned modification consists of using the growth rate of the tourism volume index instead of the growth rate of the real GDP, as this index is an indicator of the evolution and behavior of tourism GDP (National Institute of Statistic and Geography (INEGI) 2018); thus, in Mexico, such an index has been used to compare tourism sector dynamics to that of national GDP (Datatur 2019a). The analysis is carried out by means of a structural vector autoregressive model (SVAR), because the VAR methodology permits us to estimate both the direct and reverse equations concerning the growth-rate version of Okun’s law, besides making it possible to perform impulse response analysis, variance decomposition, historical decomposition, and the Granger causality test.
This adjustment arises from the fact that, as found by Işik et al. (2018), tourism development is correlated with economic growth in some of the principal tourist destinations, and therefore, as noted by the same authors, the tourism industry plays a crucial role in creating new jobs. As job creation and economic growth are both well-being macroeconomic targets that nations seek, an approach via Okun’s law permits us to measure the effectiveness of tourism growth as a palliative for unemployment, whereas the reverse specification of Okun’s law allows measuring the shrinking effect that the loss of well-being generated by unemployment has on tourism development.
As mentioned above, the contribution of this work is to show that a modified Okun’s law using the tourism volume index provides an empirical tool to measure the effectiveness of tourism sector growth in reducing unemployment. On the other hand, the reverse equation of this sectorial Okun’s law allows the quantifying of the loss of tourism output caused by the increase in idle resources measured in terms of unemployment, thus providing a simple empirical growth model for the tourism sector.
This document is divided, without taking into account this introduction, into five sections. The first part presents Okun’s law; the second section discusses the relationship between tourism and employment; the third section presents the sources and data; the fourth section introduces the empirical design of the SVAR model; and the fifth section presents and discusses the empirical findings. Finally, conclusions and limitations are presented.

2. Okun’s First Differences Model and Okun’s Law

According to Okun (1962), the unemployment rate can be used as a proxy variable for all idle resources affecting the output level, as it can be assumed that factors like labor force participation or productivity will have an impact on the unemployment rate. Under these assumptions, Okun (1962) presented three regression models, namely, first differences, trial gaps, and fitted trend and elasticity. These relations, according to Knotek (2007), arise from the observation that, commonly, to generate more employment, more production is required. This section focuses on the first differences model, as it is the Okun’s specification used in this work to study the relationship between the growth of the tourism sector and unemployment in Mexico.
Okun’s first differences model shows that quarterly changes in the unemployment rate ( u ) were related to quarterly percentage changes in the GNP ( y ˙ ) during the period 1947Q2–1960Q4. The results obtained by Okun (1962) are summarized in Equation (1), which is commonly known as the difference version of Okun’s law (Knotek 2007) or, simply, as the growth-rate version (Daly and Hobijn 2010):
u = 0.3 0.3 y ˙ .  
According to Knotek (2007), the coefficient associated with y ˙ in Equation (1) has been named “Okun’s coefficient”.
The results for Equation (1) show that, if the GNP is unchanged, then unemployment rises by 0.3 points; conversely, if the GNP grows by one point, then unemployment decreases by 0.3 points. From Equation (1), Okun (1962) deduced that one extra point in unemployment would diminish GNP by 3.3 points.
Nonetheless, according to Barreto and Howland (1993), using the direct regression to predict the GNP is incorrect, as it is not sufficient to consider the reciprocal of the GNP coefficient as this implies that the structure of the economy is unchanged; therefore, prediction of the GNP given a level of unemployment should be based on the reverse regression, which consists of considering the GNP as a function of the unemployment rate.
In general terms, Okun’s law predicts that growth slowdowns usually coincide with rising unemployment (Knotek 2007). A common modification to Okun’s relations is to replace the GNP with the real GDP; in fact, Lancaster and Tulip (2015) point out that Okun’s law refers to the strong correlation found between the unemployment rate and real GDP.
Different studies have recently validated Okun’s law in different countries, for example, in Curaçao (Dare and Hek 2016), and the United Kingdom (Stober 2015). Okun’s law has also been corroborated in particular regions like the city of Posadas in Misiones, Argentina, by using static models (Fernández and Simes 2006) and dynamic specifications (Fernández and Simes 2007). In this sense, authors like Ball et al. (2012) consider Okun’s law to be a stable and strong relationship in most countries.
In the case of Mexico, different works have claimed the validity of Okun’s law; Loría and Ramos (2007) estimated, using structural models with annual data for the period 1970–2004, the three models proposed by Okun. For their part, Loría and De Jesús (2011) validated Okun’s law with quarterly time series data. Similar results were found by Rodríguez and Peredo (2007). Loría et al. (2012) estimated the growth-rate version of Okun’s law by using a disaggregated unemployment rate by gender, and their results show that, in Mexico, economic growth immediately has a negative impact on male unemployment, whereas for women the effect is slower but stronger. They also found that male unemployment has a stronger impact on economic growth.
Although employment and output commonly move together (Neely 2010), there have been many exceptions to Okun’s law, or, in other words, there have been periods when economic growth has slowed down without coinciding with a rise in the unemployment rate (Knotek 2007). In the same vein, Zerbo (2017) commented that Okun’s law cannot be considered a stable relation, as did Liquitaya and Lizarazu (2003), whose results, for the Mexican economy, show an asymmetric response in unemployment depending on the state of the economy, being augmented during recessions and shrinking during expansions. Moreover, Alarcón and Soto (2017), through a panel model considering Mexico’s 32 federative entities, have found an Okun’s coefficient of 2.99 with evidence of heterogeneities due to the different production levels and unemployment rates across states.
Okun’s relationships have been, however, widely extended by economists in order to consider omitted factors (Knotek 2007). In the case of tourism, Loría et al. (2017) presented an extension of the difference version of Okun’s law for the Mexican economy by considering the growth rate of the total number of international visitors; that is, the sum of international tourists and international excursionists. Their results, besides validating Okun’s law, showed that the arrival of international visitors helps to reduce the country’s unemployment rate and positively stimulates economic growth.
In this document, in contrast to the above-quoted document, a modification of the difference version of Okun’s law is proposed. Instead of using the GDP growth rate, as has been commonly done, the growth rate of the tourism volume index was used to study the impact of tourism sector growth on the unemployment rate and vice versa. The approximation was carried out by means of an SVAR model, because it allows us to compute both the direct and the reverse regressions. The SVAR model results indicated that there is a bidirectional relationship between both variables, such that unemployment reduces growth in the tourism sector and growth of the tourism sector is a palliative for unemployment.
It is very important to mention that, among the reviewed literature relating to tourism and unemployment, we have not found any document using a direct modification of Okun’s (1962) growth-rate version for tourism in the way that it is carried out in this document. In fact, in the Mexican case, Álvarez (1996) points out that the output of restaurants and hotels was used to measure the importance of tourism to the GDP, but with the disadvantage that most of the consumption in restaurants is not from tourists.

3. Tourism and Employment

Since the early 1990s, authors like Bote (1990) have noted that it has been proved that the tourism sector is capable of generating more employment per invested monetary unit than most industrial sectors, although such research has been solely done by considering hostelry; therefore, if restaurants and extra-hotel accommodation services were taken into account, the results would be more favorable for tourism. In the same vein, transportation activities generate a substantial share of total jobs, and, more importantly, a vast majority of these posts are filled from the local labor markets (UNWTO and ILO 2014). In this sense, it has been said that tourism is a labor-intensive sector; it is also argued that a high proportion of posts created by tourism are occupied by women and thus contribute to gender equality (Banskota 2012).
Effectively, tourism is able to create direct and indirect employment, and, moreover, tourism generates employment for both skilled and unskilled labor (Dayananda and Leelavathi 2016). In the case of Mexico, Loría et al. (2017) have found that an increase in the number of international visitors considerably reduces the unemployment rate. Tourism development is, as found by Işik (2015), correlated with foreign direct investment, which, according to Loría and Brito (2005), is considered a main factor for studying sectorial employment in Mexico, so this quality makes tourism a more viable path to reducing unemployment. Nonetheless, this positive characteristic of tourism can be interrupted by violent acts, for such events can take tourists away, causing many temporary jobs to be lost, and thus reducing local residents’ complementary income (Andrés-Rosales et al. 2018).
The tourism sector is characterized by strong seasonal fluctuations that give rise to high, medium, and low seasons (Ramírez 1994); however, the impact of such seasonal variation depends on the level of development in subsectors like business tourism and congress tourism, as such categories are not subject to seasonality (Cárdenas 1990; Ramírez 1994). Tourism’s seasonal fluctuations affect employment in the sector, as it varies depending on the season and among the regions of a country (UNWTO and ILO 2014).
Tourism employment is characterized by being mainly temporary. Most businesses in the sector face seasonality by hiring students looking for temporary or part-time jobs or people who want to complement their ordinary activities; nonetheless, such features make it difficult to find employment stability in tourism, and the wages in this sector are often below average (Caballero 2011).
Infrastructure is a fundamental determinant for tourism growth and development, as it incorporates different services to delight tourists; in fact, Jovanović and Ilić (2016) argue that intensive investment in tourism infrastructure is key for future tourism development. Despite being such an important variable for tourism’s future, Mandić et al. (2018) commented that sometimes tourism entrepreneurs are not willing to invest in infrastructure development, mostly due to financial limitations, so the level of infrastructure and facilities is determined by the current phase of tourism development in the region. It can be inferred that the greater the infrastructure, the more employment tourism will be able to create.
As, according to the above, tourism is labor-intensive, the growth of this sector is expected to reduce the unemployment rate; in other words, tourism growth must act as a palliative for unemployment, as foreseen by the growth-rate version of Okun’s law.
On the other hand, tourism is an activity highly dependent on income level (Stabler et al. 2010), as travel commonly takes place when basic needs have already been covered (Ascanio 2012; Kim et al. 2012; Panosso and Lohmann 2012). Moreover, tourism is considered to behave as a luxury good (Álvarez 1996; Smeral 2003); hence, by definition, its demand must increase more than proportionally when income grows (Varian 1992). In this sense, one of the principal reasons for travel not to take place at a certain moment is that there may be a period when potential travelers have to save money in order to cover both their needs and the costs of the trip; non-demand occurs when potential travelers lack economic resources (Panosso and Lohmann 2012), although potential travelers could get a credit (Ripoll 1986).
As unemployment prevents people from obtaining an income (Riascos 2009), the aforesaid would imply that potential travelers postpone or totally discard their plans to travel with tourist purposes when finding themselves in a jobless situation. Effectively, unemployment, according to Alegre et al. (2018), increases the probability of not going on holidays. An increase in unemployment thus leads to a reduction, firstly, in the number of tourist arrivals and, consequently, in the demand for goods and services designed for tourists. This causes the tourism GDP to shrink.
It is important to mention that a nation’s unemployment level could affect both outbound and domestic tourism demand, but the main negative effect on the tourism sector growth would be produced by the reduction in the number of domestic tourists; however, Dahdá (2003) mentions that outbound tourism could also have a positive impact on the economy, as this kind of tourists usually spend money on transportation, food, or passports, among other goods and services.
According to the above, there exists a bidirectional relationship between the growth of the tourism sector and unemployment; thus, an approach to these effects by means of Okun’s law and an SVAR model provides an empirical framework to test the validity of the assertions in this section.

4. Data and Sources

In order to study the relationship between growth in the tourism sector and the unemployment rate in Mexico, quarterly time series data from the second quarter of 2000 to the fourth quarter of 2018 ( N   =   75 ) were obtained from the following sources: unemployment rate from the INEGI (2019a, 2019b) and tourism volume index ( 2013 = 100 ) from the INEGI (2019c).
The unemployment rate was originally obtained as monthly data, whereas the tourism volume index was found in quarterly data, so the unemployment rate was averaged into quarterly observations in order to estimate the VAR model. It is very important to mention that from 2000Q2 to 2004Q4, the unemployment rate considered an age group of 14 years and older (INEGI 2019b), and during the period 2005Q1 to 2018Q4, the age group was 15 years and older (INEGI 2019a). Although using an unemployment rate series with data from different samples could be controversial, there would otherwise be insufficient data to apply the correct specification tests concerning the VAR model, because such tests are asymptotic.
Both series, the volume index and the unemployment rate, were seasonally adjusted with the Census X12 filter, as using a smoothing technique facilitates the identification of trends and critical patterns in the data (Pindyck and Rubinfeld 2001). After applying the Census X12 filter, the tourism volume index was transformed into natural logarithms.
In order to avoid finding spurious relations, the Breakpoint Unit Root Tests were performed, as the standard tests could be biased in the presence of structural breaks and could, therefore, lead to a false rejection of the unit root hypothesis (Glynn et al. 2007).
According to the results in Table 1, both series are stationary in first differences.

5. Empirical Design

A bivariate VAR model with k lags considering both the growth rate of the tourism volume index, y ˙ T , and the variation of the unemployment rate, u , as variables, according to Gujarati and Porter (2009), can be expressed as shown in Equation (2):
y ˙ t T = α 1 + i = 1 k β 1 y ˙ t i T + i = 1 k γ 1 u t i + e 1 t u t = α 2 + i = 1 k ϕ 1 y ˙ t i T + i = 1 k θ 1 u t i + e 2 t ,
where α 1 and α 2 are constants and e 1 t and e 2 t are the error terms. Each equation in a VAR model can be computed by using the ordinary least squares (OLS) methodology (Gujarati and Porter 2009). Both series were proved to be stationary (Table 1); therefore, according to Charemza and Deadman (1997), there is no need to test for cointegration.
The length of k was determined by using the following criteria: Sequential Modified LR Statistic (LR), Final Prediction Error (FPE), Akaike (AC), Schwarz (SC), and Hannan–Quinn (HQ). All criteria, with the exception of SC, showed that the VAR’s optimal estimation is reached when k = 1 (Table 2). Because the model was computed with quarterly time series data, the lag selection was performed by allowing a maximum of six lags.
After determining the length of k , an exogenous variable, δ t , was introduced into the model in order to correctly simulate those periods when there were abrupt changes in the series; δ t was defined as shown in Equation (3):
δ t = { 1 if     t = 2001 Q 1 ,   2003 Q 4 ,   2006 Q 2 ,   2008 Q 1 ,   2009 Q 3   1 if     t = 2005 Q 2 ,   2005 Q 4 ,   2009 Q 2 ,   2010 Q 4 ,   2017 Q 3   0 Any   other   case .
According to the results in Table 2, the model to be estimated is a VAR(1), which, including δ t as an exogenous variable, takes the form shown in Equation (4):
. y ˙ t = α 1 + β 1 y ˙ t 1 T + γ 1 u t 1 + φ 1 δ t + e 1 t u t = α 2 + ϕ 1 y ˙ t 1 T + θ 1 u t 1 + φ 2 δ t + e 2 t .
The structural errors were identified in a traditional lower triangular matrix fashion, which, according to Enders (2004), corresponds to Cholesky decomposition. The matrix in Equation (5) expresses the form used to identify the structural errors given by ε t = B e t :
  B = [ 1 0 b 21 1 ] .
As can be seen in Equation (5), a single restriction was placed on the model. According to Enders (2004), a necessary condition for a VAR to be exactly identified is that ( n 2 n ) / 2 restrictions must be introduced.
The VAR methodology has been extensively criticized by different researchers; most of these critics have focused on the statistical inference and the policy analysis done by means of SVAR models (Guzmán and García 2008). A first critique of the VAR methodology arises from the fact that the number of estimated parameters in these models is usually very elevated. This leads to non-parsimonious dynamic representations of a time series vector, which generates problems with the degrees of freedom, the same as problems of multicollinearity and overfitting (Jaramillo 2009), which, in a traditional VAR model, are a result of scarce and highly random information, together with the fact that the VAR methodology minimizes the distances among the data (Ballabriga et al. 1998).
In this work, as the computed model is a bivariate VAR(1), each equation contains just two estimated parameters plus an intercept and the intervention variable—a total of four computed coefficients per equation. Because, as mentioned above, each equation in a VAR is an OLS regression, to evaluate multicollinearity, the variance inflation factors (VIF) were estimated, as these statistics permit us to quantify inflation of the variance of a coefficient due to the presence of multicollinearity (Gujarati and Porter 2009).
On the other hand, inference and policy analysis with SVAR models has also been extensively criticized, as VAR identification cannot be solved by using only statistical methods; knowledge of economic theory is required, but sometimes restrictions are only imposed to get exact identification (Guzmán and García 2008). In this document, the restrictions come from both Okun’s law and tourism theory. In the case of Okun’s law, a bidirectional statistical relationship is supposed to exist between unemployment and output growth, whereas tourism is considered to be a labor-intensive sector.
More precisely, based on Equation (1), to restrict the model, we have assumed that the tourism growth has a contemporaneous effect on the unemployment rate. Conversely, assuming that b 12 = 0 in Equation (5), following Enders (2004), it is equivalent to suppose that unemployment rate does not have a contemporaneous effect on the growth of the tourism sector.

6. Empirical Results and Discussion

Once it was verified that both series are stationary (Table 1), the VAR model was computed according to the optimal number of lags selected by the criteria in Table 2. The results of estimating Equation (4) are summarized in Table 3. It was also verified that the model satisfies the correct specification tests (Table 4).
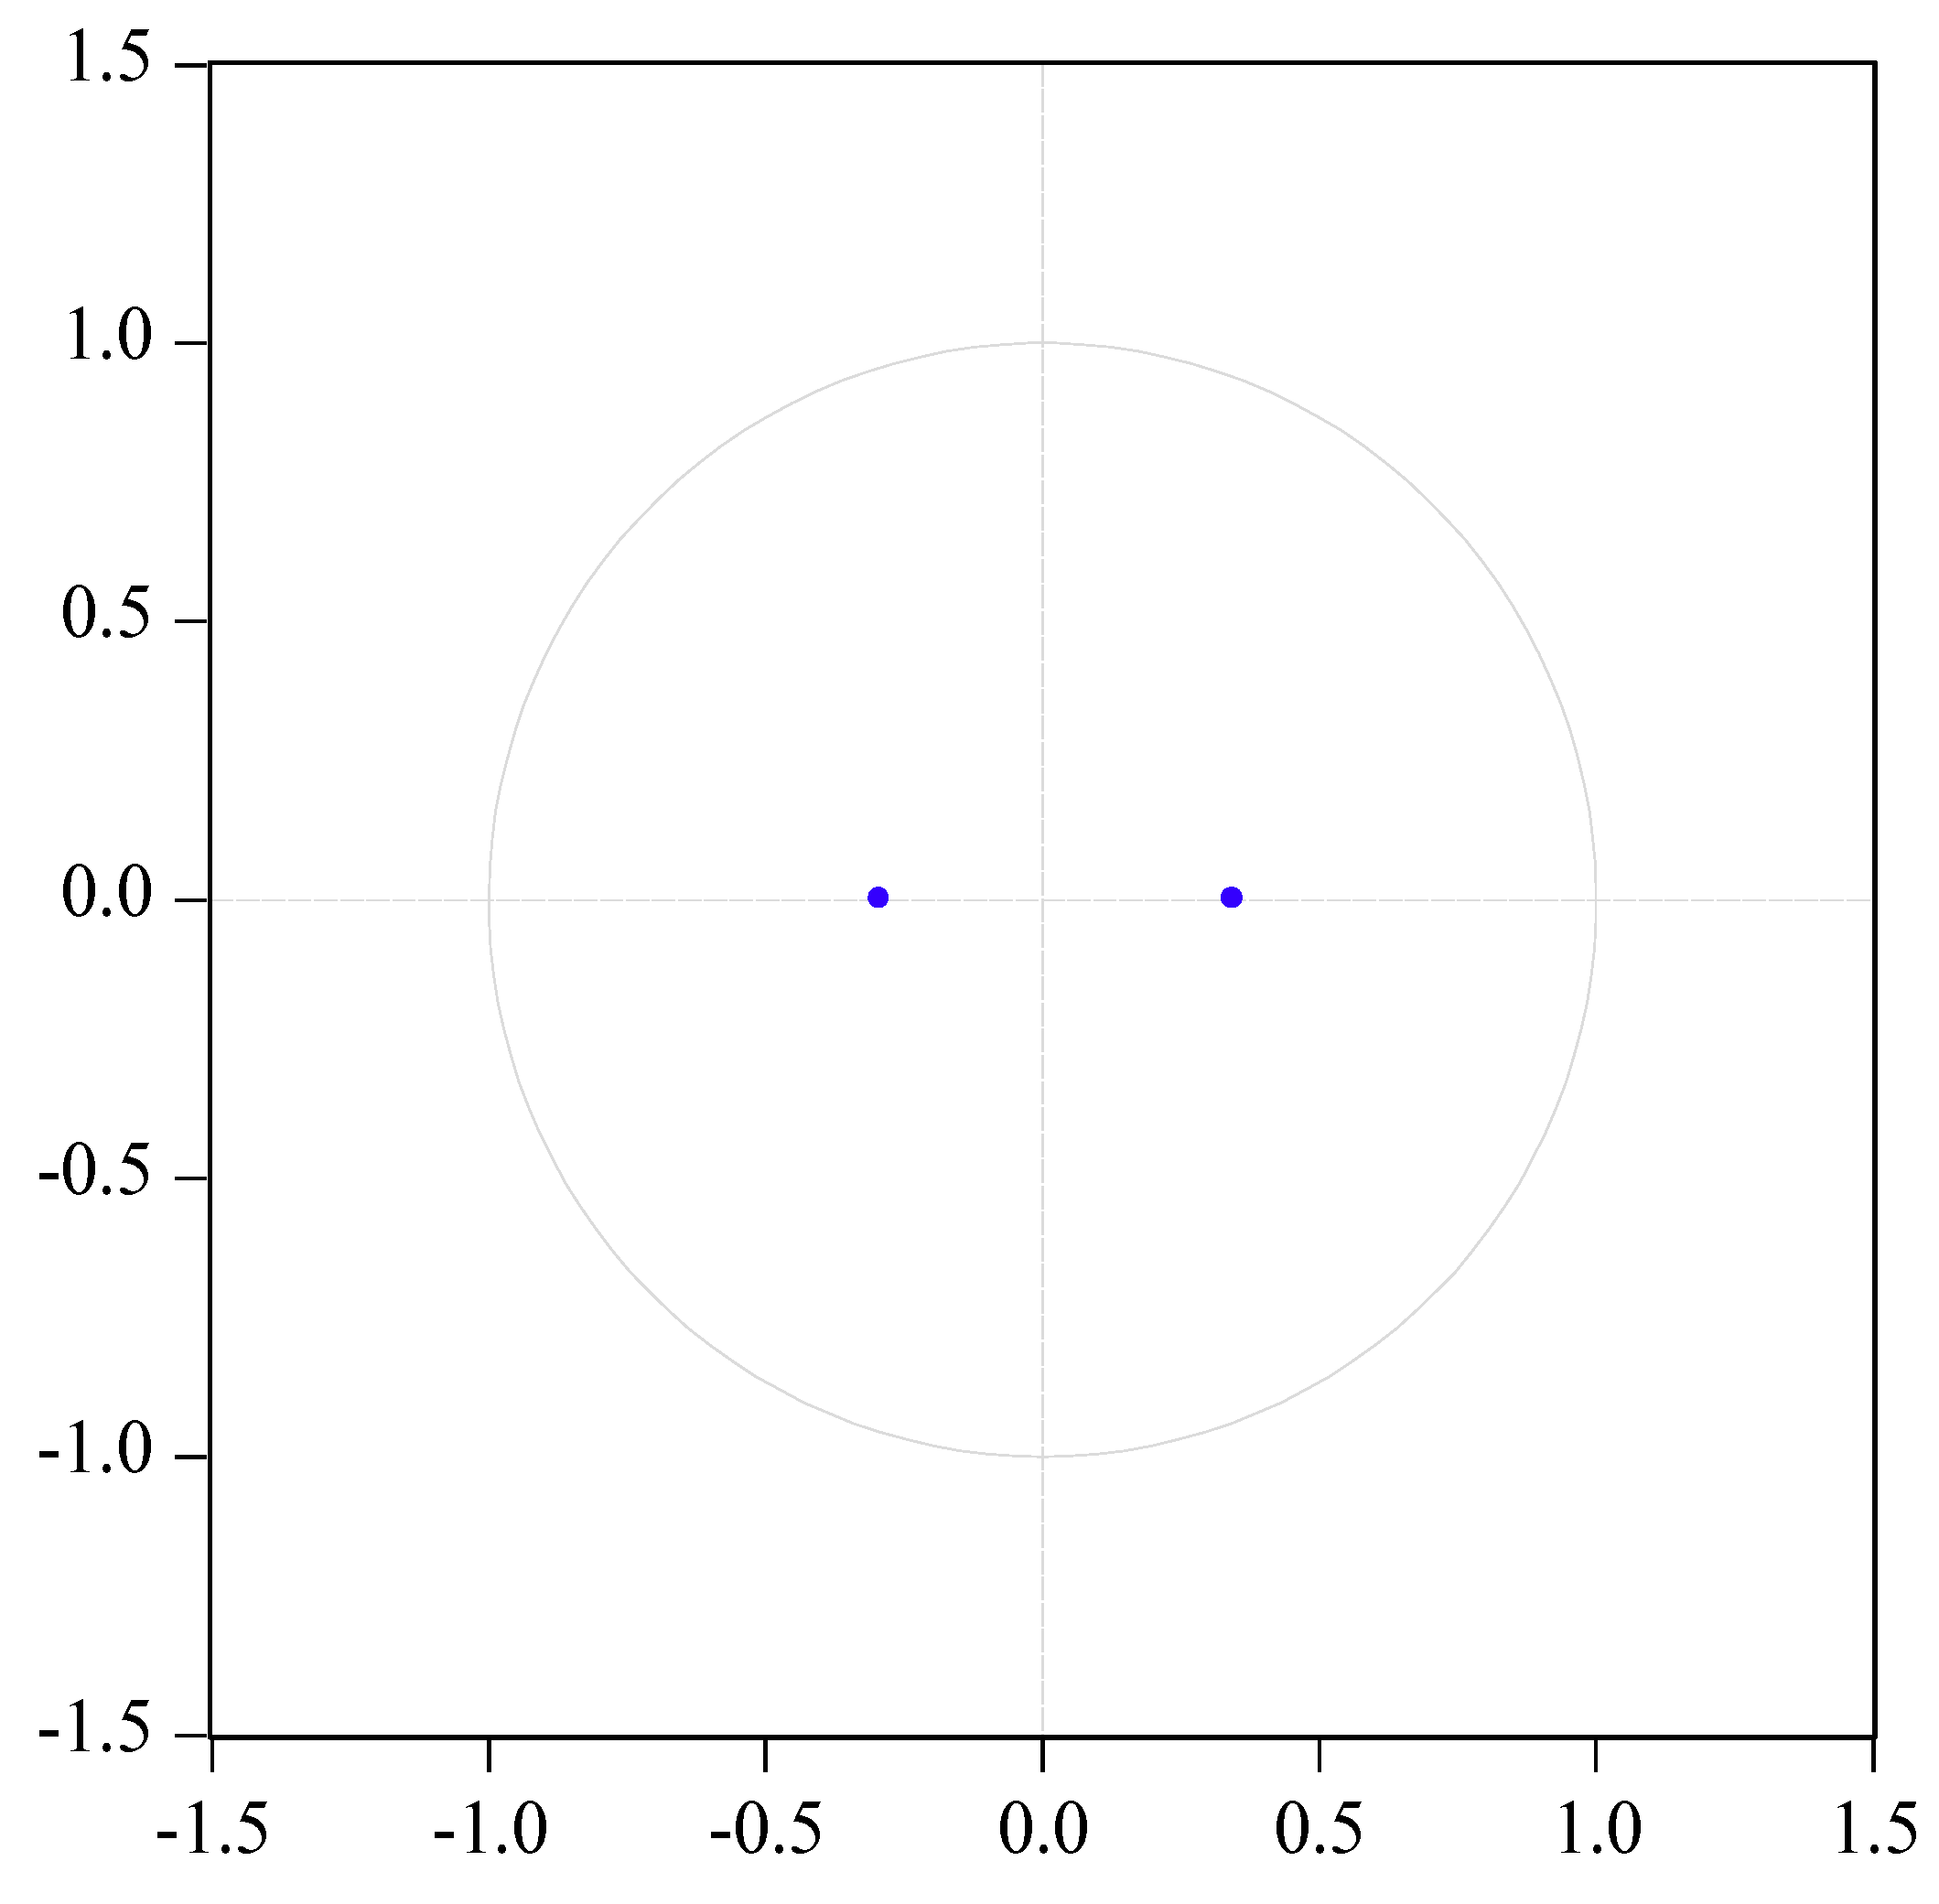
To complement the tests in Table 4, we verified that the VAR model satisfies the stability condition (Figure A1, Appendix A); we also applied the Quandt–Andrews unknown breakpoint tests to each VAR equation in order to test for structural changes (Table A1). The results indicate that in the presence of δ t , the model satisfies the condition of no structural change. On the contrary, if δ t is omitted, then the test suggests inconclusive results in the unemployment regression. It was also confirmed by means of the VIF that the predictors are not highly correlated (Table A2).
As a last test for the unrestricted VAR, we performed a historical simulation (Figure 1).
As can be seen in Figure 1, the VAR model acceptably simulates most of the principal changes in both series. An important observation is that the model adequately simulates the change in the unemployment rate caused by the international financial crisis.
After proving that the VAR model satisfies the correct specification tests, the structural restriction was introduced into the model in order to obtain the SVAR, and then the structural factorization normality test was successfully applied (Table 5).
The following short-run structural relations were found with the correct sign (Equation (6)):
ε y ˙ T = e y ˙ T ε u = 0.04311 e y ˙ T + e u .
According to Loría et al. (2011), structural relationships cannot be directly read because they represent contemporaneous structural innovations, so the sign only represents the direction of the interrelations.
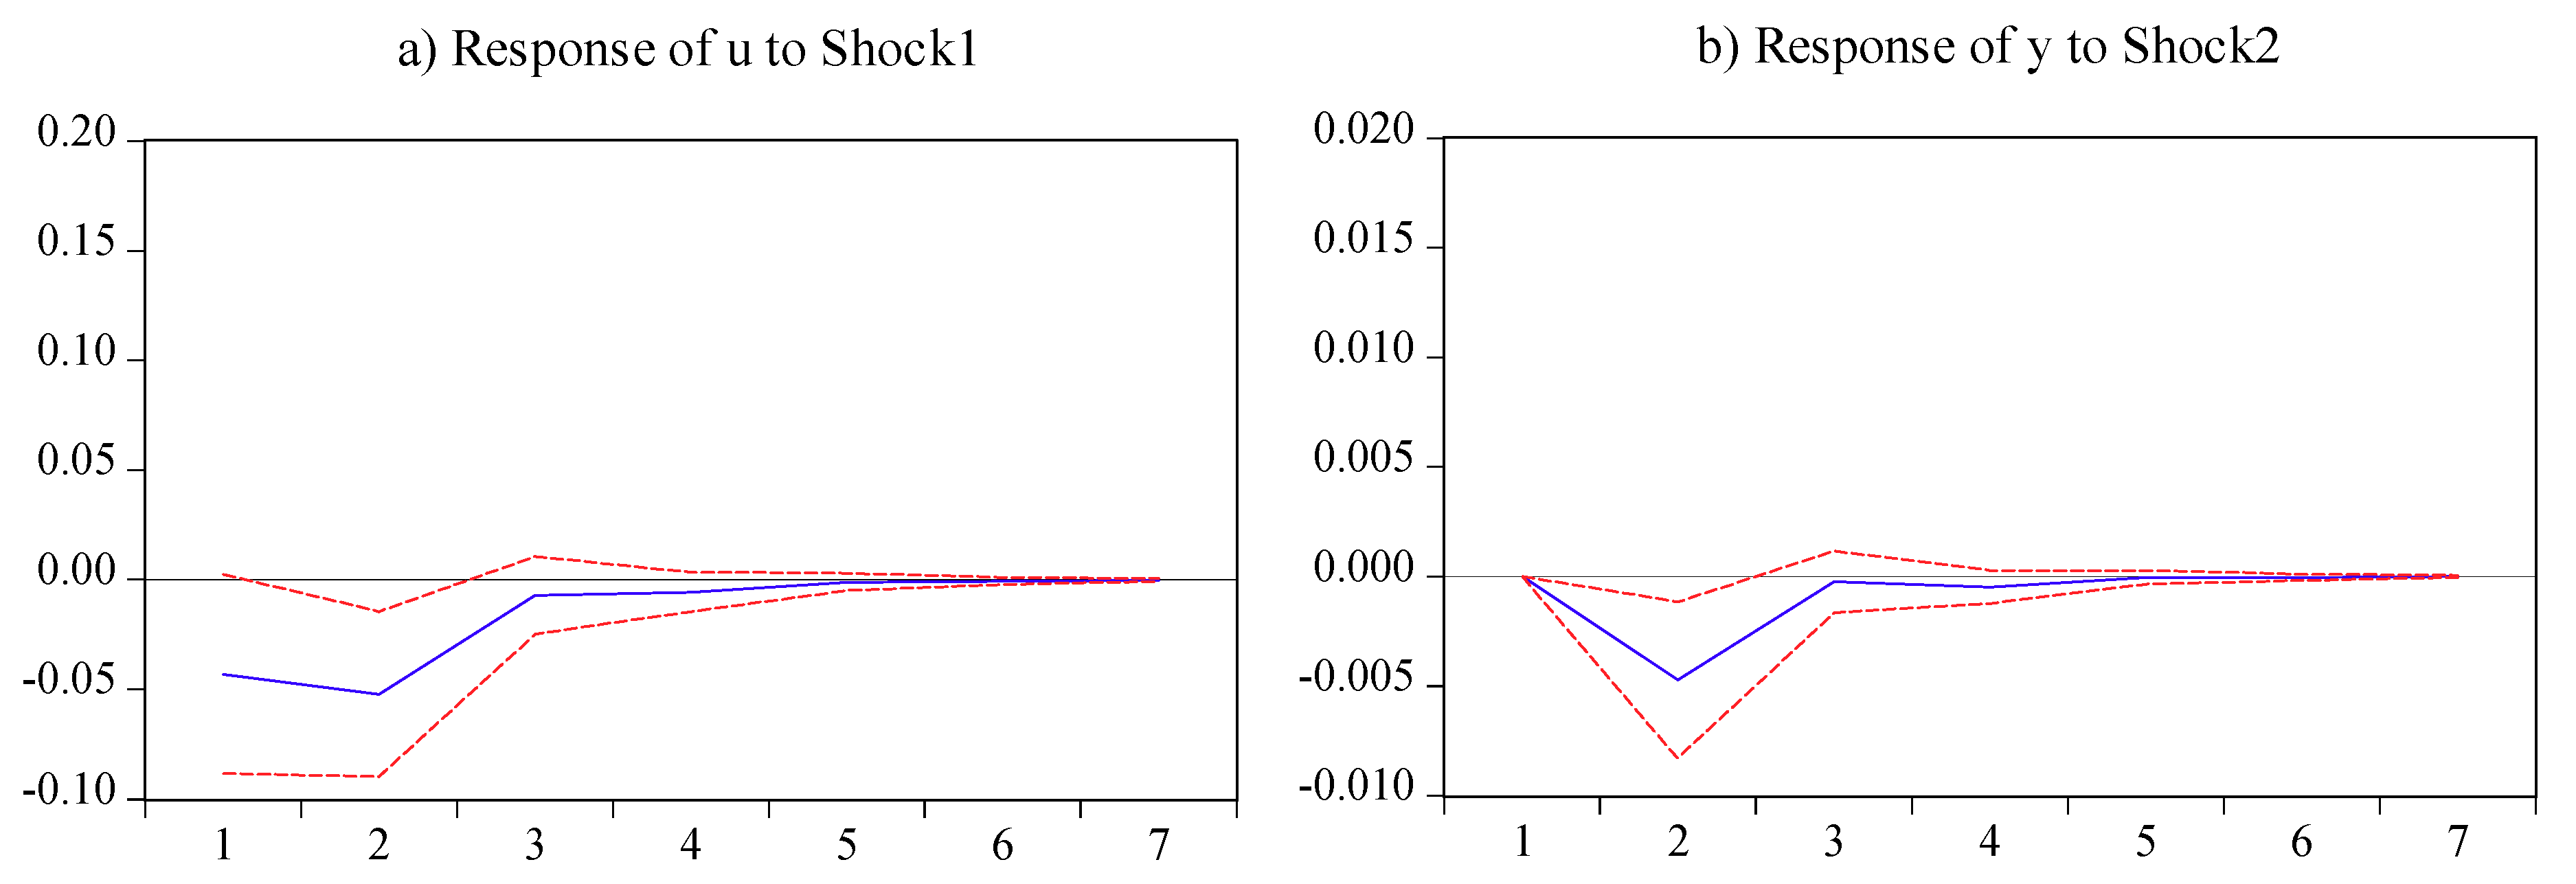
The structural impulse response analysis showed that unemployment negatively responded to the growth rate of the tourism sector; this negative effect was statistically significant during the second period and became statistically insignificant from the third one. A noteworthy observation is that, despite being insignificant, the growth of the tourism sector reduced unemployment from the first period (Figure 2a).
On the other hand, Figure 2b shows that unemployment reduced tourism growth; this negative effect was statistically significant during the second period and statistically insignificant from the third one.
In order to gain more evidence to validate the statistical significance of the impulse response analysis, the Granger causality test was performed. The results are summarized in Table 6.
The results in Table 6 confirm the existence of a bidirectional statistical relationship between the growth rate of the tourism sector and variation in the unemployment rate.
For its part, the structural variance decomposition (Table 7) shows that u explained 8.72% of the variation in the growth of the tourism sector during the last period, whereas the growth rate of the tourism sector initially explained 4.81% of the changes in u , increasing to 10.76% during the last considered period.
An important observation arising from the variance decomposition analysis is that both the unemployment rate and tourism growth are highly autoregressive: They explain, respectively, 89.23% and 91.27% of their own variation in the last considered period of the analysis. We also remark that, concordantly with the impulse response analysis, the structural variance decomposition begins to stabilize from the fifth period.
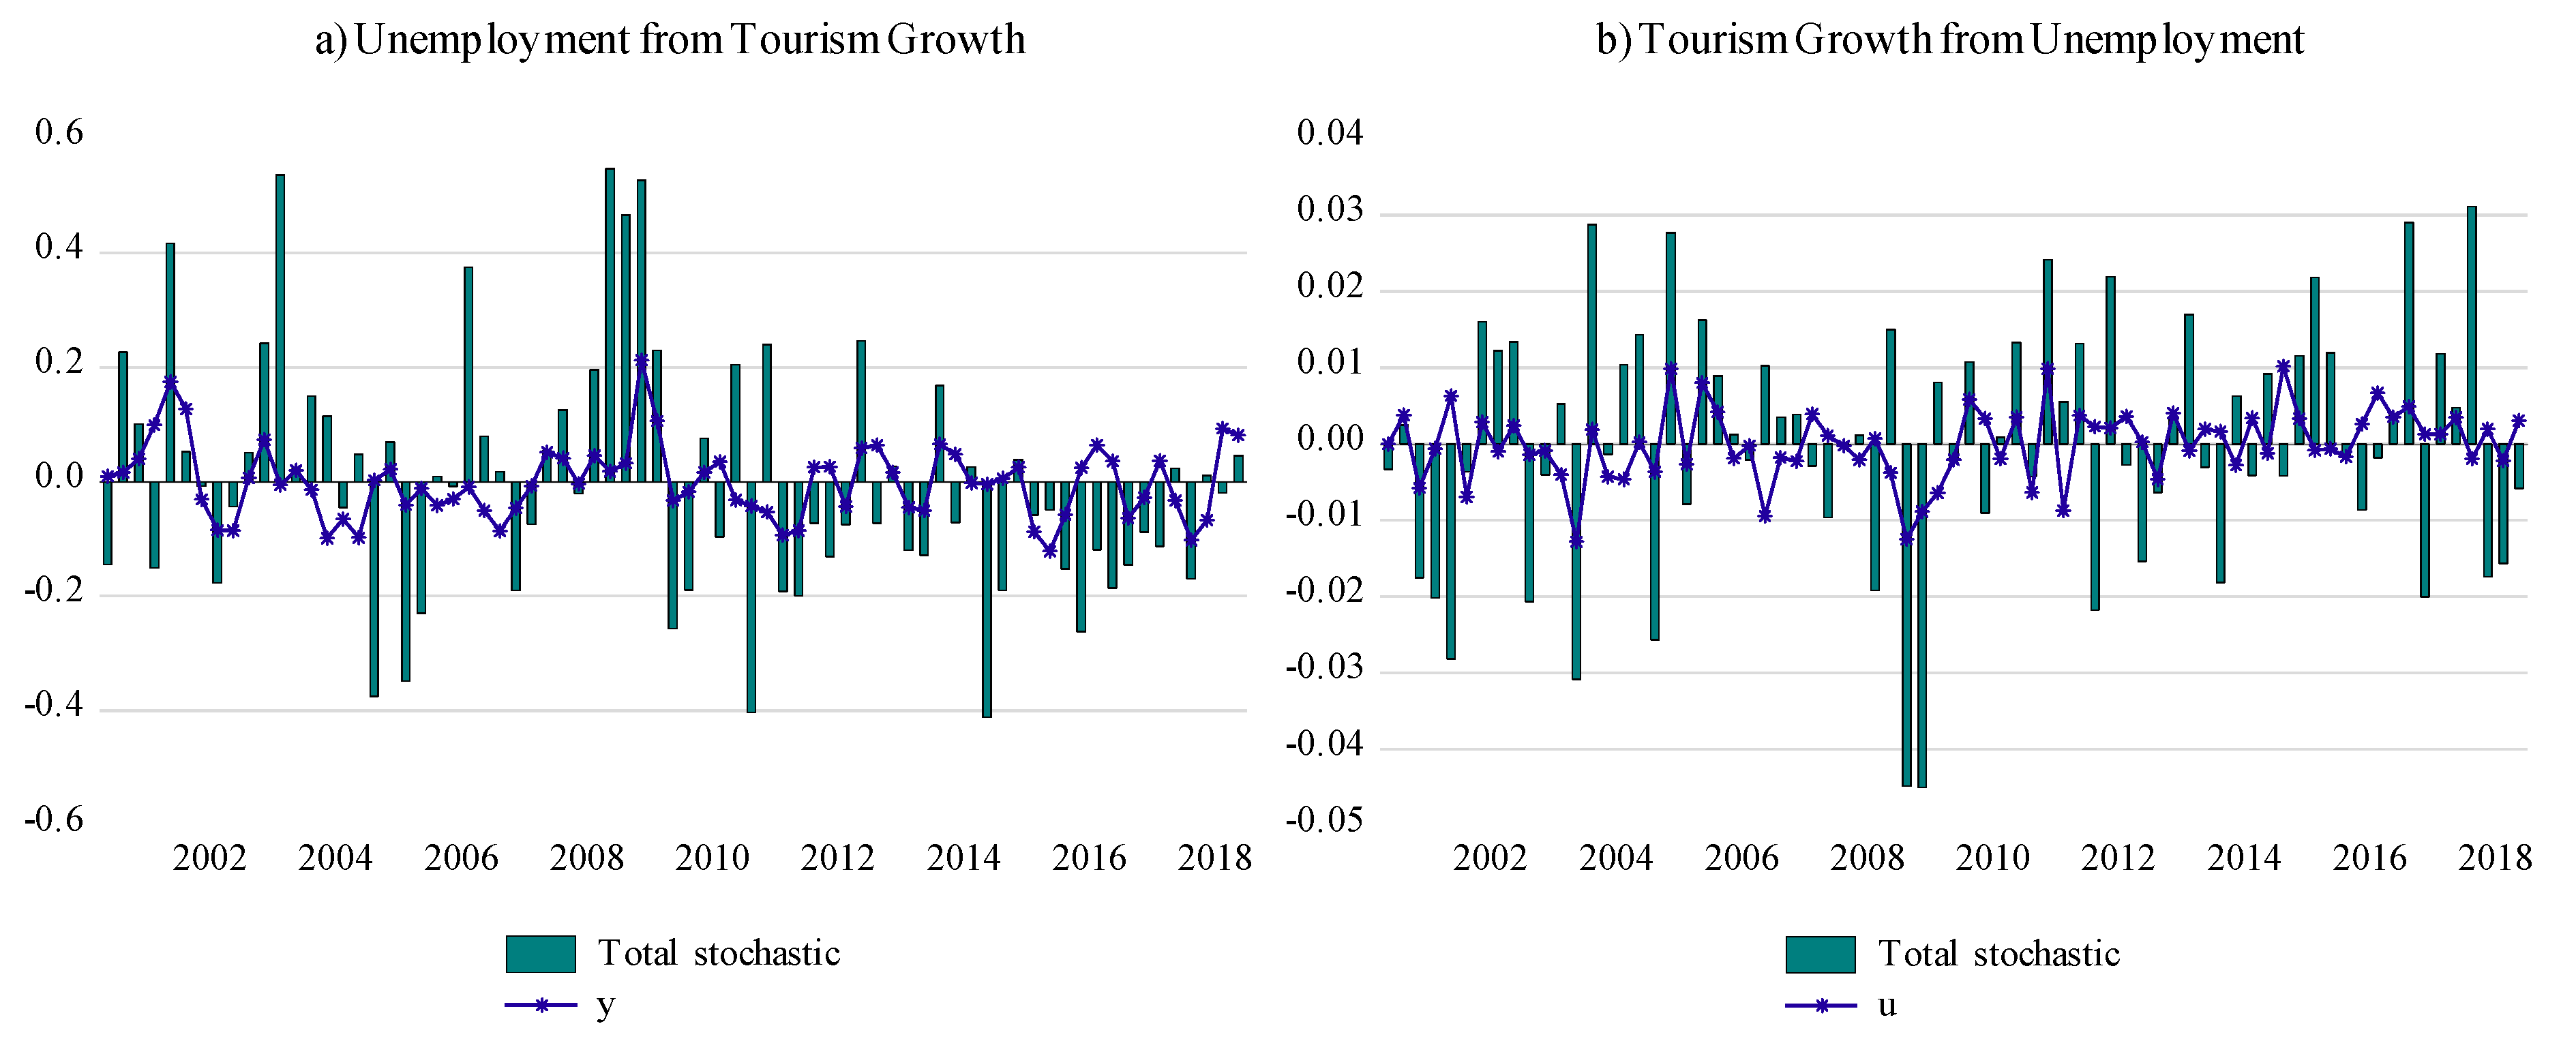
To complement the impulse response analysis and the structural variance decomposition, Figure 3 reports the historical decomposition.
Figure 3a shows that during the decade beginning with 2000 and during the international financial crisis of 2008, the tourism output was very relevant in determining variation in unemployment. For its part, Figure 3b shows that during the 2008 crisis, unemployment had an important impact on tourism output. In general terms, Figure 3 illustrates that the impact of one variable on the other was important but not determinant.
In fact, the historical decomposition (Figure 3) shows that tourism growth and unemployment do not explain each other all the time, as the relationship between these two variables was stronger during the international financial crisis of 2008 but became weaker for the next periods. This result is congruent with Liquitaya and Lizarazu’s (2003) findings, in the sense that Okun’s law does not seem to be a stable relationship in Mexico.
The percentage of unemployment explained by tourism growth could seem low, as tourism is regarded as a labor-intensive sector; nonetheless, as mentioned by Banskota (2012), tourism cannot generate employment for all the people in a destination, although its development can provide opportunities to improve livelihoods. Tourism growth explains more than 10% of Mexico’s unemployment rate variation, which should be regarded as an important contribution to palliating joblessness.
On the other hand, an approach by means of Okun’s law implies that the negative effect of the unemployment rate on tourism growth is caused by a reduction in the number of domestic tourists, because the analysis was done with national economic indicators. In this sense, the results highlight the importance of domestic tourism on the growth of the tourism sector. Nonetheless, Seetaram (2010) points out that some local business, like travel agencies, airlines, or airports, benefit from outbound tourism, so the reduction of this type of tourism could also have a negative effect on the tourism sector growth.
The above-mentioned implies that idle resources negatively affect the national tourist demand, because unemployment prevents potential tourists from becoming real ones. An option to offset the negative effect of national unemployment is to promote the arrival of tourists from abroad; although it is not addressed in this document, this would imply that idle resources from abroad could also affect tourism growth.
Finally, the results show that the tourism sector is, as mentioned by Álvarez (1996), very sensitive to economic crises, because global unemployment increases, which reduces income levels; consequently, international and domestic tourism demand is reduced.

7. Conclusions

In this work, we proposed a modified difference version of Okun’s law for the Mexican tourism sector, which consists of using the tourism volume index growth instead of the GDP growth, as is commonly done. This approach to Okun’s (1962) growth-rate version permits us to measure the impact of tourism development on unemployment, and therefore on one of the main economic indicators of well-being. Likewise, through the reverse equation, this approach allows us to measure the impact of the loss of well-being, measured in terms of unemployment, on the growth of the tourism sector.
This study was carried out by means of a SVAR(1) model, assuming, based on Equation (1), that unemployment has a contemporaneous effect on tourism growth. The SVAR’s results show, through the impulse-response analysis (Figure 2) and the Granger causality test (Table 6), that there is a bidirectional relationship between tourism growth and unemployment in Mexico. In both cases, according to Okun’s (1962) findings, the impulses are in the correct direction. This result implies that, in a statistical sense, Okun’s law holds for the Mexican tourism sector when using the tourism volume index as an indicator of the tourism GDP.
More precisely, the SVAR results give evidence that tourism growth is a palliative for unemployment; conversely, unemployment prevents the tourism sector from growing. Through variance decomposition analysis, we found that tourism growth explains 10.76% of the variations in the unemployment rate; conversely, changes in unemployment explain 8.72% of the variations in the growth of the tourism sector. We also found evidence of a highly autoregressive behavior in both unemployment and tourism output growth.
The results obtained in this work give evidence that more employment can be created by developing the tourism sector. According to Riascos (2009), unemployment is not only a central element in macroeconomic stability but also an economic indicator used to measure poverty; in this sense, these results, obtained through a modified Okun’s law, provide evidence of tourism development as a catalyst of macroeconomic stability and as a social welfare promotor. Thus, as noted by Fawaz et al. (2015), tourism can be considered a viable path to tackling poverty.
On the other hand, as unemployment reduces the growth rate of the tourism sector, promoting investment in other key sectors of the economy should benefit the tourism sector by creating new jobs, thus permitting potential tourists to become real ones. It is necessary, however, that those new tourists opt for spending their vacations in national destinations, which could be achieved, for example, by implementing advertising campaigns (Dahdá 1998). It is also important to note that the development of other productive branches will help the tourism sector by providing goods and services for tourists.
In accordance with some of the authors reviewed in this document, the historical decomposition showed that during an economic crisis, the relationship between unemployment and tourism output growth becomes stronger than in expansion periods; this fact provides evidence that Okun’s law is not a stable relationship, at least in the tourism sector.
It is necessary to stress that the unemployment rate used in this work only affects nationals and residents in Mexico, so it would affect domestic tourism demand; therefore, correct surveillance of the seasonal cycle of unemployment and adequate foresight of potential increases in the unemployment rate caused either by crises or economic policy decisions could lead to an effective strategic campaign allowing the country to attract more tourists from abroad, and thus lessening the effects of unemployment on the tourism industry. Thus, it is necessary, in order to maintain steady growth in the tourism sector, to substitute domestic tourism demand for external demand during periods of rising unemployment.
Finally, it is necessary to consider that, as mentioned by Banskota (2012), tourism is not a panacea to solve problems related to employment creation in a destination, but it can help to reduce the income gap by generating employment for the local people.

8. Limitations

Although this study presents a different way of approaching the effects of tourism growth on unemployment, and thus contributes to the empirical literature in the context of tourism as a palliative for unemployment, this approach still presents some limitations. Firstly, we have used the growth rate of the tourism volume index as an indicator of the tourism GDP growth. Secondly, an approach via Okun’s law does not exhibit the effects of idle resources from abroad on the tourism sector. Nonetheless, this presents an opportunity to carry out new research by extending the model to include the unemployment rate of other countries, thus measuring the effect of idle resources from abroad on the tourism sector growth, or new research could use a panel VAR model to verify the accomplishment of this sectorial Okun’s law in more nations. Finally, because we are using series in differences, our results are restricted to the short-term, so future research could also focus on estimating long-term coefficients between unemployment and tourism volume index, which could be done by using either VEC or ARDL models.

Funding

This research received no external funding.

Conflicts of Interest

The authors declare no conflict of interest.

Appendix A

Figure A1. Inverse roots of AR characteristic polynomial.
Economies 07 00083 g0a1
Table A1. Quandt–Andrews unknown breakpoint test.
Unemployment Equation
TestWithout δ t With δ t
StatisticProbabilityStatisticProbability
Maximum LR F-statistic (2009Q4)5.13180.02703.88290.0644
Maximum Wald F-statistic (2009Q4)15.39560.027015.5310.0644
Exp LR F-statistic0.94690.18380.70390.3524
Exp Wald F-statistic4.60320.03744.65880.0774
Ave LR F-statistic1.37900.19651.17110.2882
Ave Wald F-statistic4.13720.19654.68470.2882
Tourism Output Growth Equation
TestWithout δ t With δ t
StatisticProbabilityStatisticProbability
Maximum LR F-statistic (2009Q3)3.03320.28532.04340.5836
Maximum Wald F-statistic (2009Q3)9.09960.28538.17360.5836
Exp LR F-statistic0.27620.89310.49340.6224
Exp Wald F-statistic1.34880.64912.23770.5276
Ave LR F-statistic0.48850.86940.94650.4607
Ave Wald F-statistic1.46570.86943.78610.4607
Note: 15% trimmed data; 52 breaks compared; test sample: 2003Q3–2016Q2.
Table A2. Variance inflation factors (VIF).
VariableVIF
C NA
u t 1 1.087383
y ˙ t 1 T 1.020497
δ t 1.071513
Note: 1 < VIF < 5 indicates that predictors are moderately correlated (Minitab 17 Support 2017).

References

  1. Acerenza, Miguel Ángel. 2012. Efectos Económicos, Socioculturales y Ambientales del Turismo. Mexico: Trillas. [Google Scholar]
  2. Alarcón, Moisés Alejandro, and Irvin Mikhail Soto. 2017. Heterogeneidad estructural en la estimación de la Ley de Okun para el caso mexicano. Realidad, Datos y Especio. Revista Internacional de Estadística y Geografía 8: 73–92. [Google Scholar]
  3. Alegre, Joaquín, Llorenç Pou, and Maria Sard. 2018. High unemployment and tourism participation. Current Issues in Tourism, 1–12. [Google Scholar] [CrossRef]
  4. Álvarez, Pablo. 1996. La relación de los servicios y el turismo con el sector externo en México. Comercio Exterior 46: 148–57. [Google Scholar]
  5. Álvarez-Díaz, Marcos, Manuel González-Gómez, María Soledad Otero-Giráldez, and Ana Belén Trigo. 2014. Modelización Econométrica de la Demanda de Turistas Británicos a España. Working Paper, 14/04. Vigo: Universidad de Vigo. [Google Scholar]
  6. Andrés-Rosales, Roldán, Luis Alberto Sánchez-Mitre, and José Nabor Cruz. 2018. Insecurity and its impact on tourism in Guerrero: A spatial approach, 1999–2014. Revista de Relaciones Internacionales, Estrategia y Seguridad 13: 147–62. [Google Scholar] [CrossRef]
  7. Ascanio, Alfredo. 2012. Teoría del Turismo. Mexico: Trillas. [Google Scholar]
  8. Balaguer, Jacint, and Manuel Cantavella-Jordá. 2002. Tourism as a long-run economic factor: The case of Spain. Applied Economics 34: 877–84. [Google Scholar] [CrossRef]
  9. Ball, Laurence, Daniel Leigh, and Prakash Loungani. 2012. Okun’s Law: Fit at 50? Paper presented at 13th Jacques Polak Annual Research Conference. International Monetary Fund. Available online: https://www.imf.org/external/np/res/seminars/2012/arc/pdf/BLL.pdf (accessed on 5 September 2018).
  10. Ballabriga, Fernando C., Luis Julián Álvarez, and Javier Jareño. 1998. Un Modelo Macroeconómico BVAR para la Economía Española: Metodología y Resultados. Estudios Económicos No. 64. Madrid: Banco de España. [Google Scholar]
  11. Banskota, Kamal. 2012. Impact of tourism on local employment and incomes in three selected destinations: Case studies of Sauraha, Nagarkot and Bhaktapur. Nepal Tourism and Development Review 2: 1–31. [Google Scholar] [CrossRef]
  12. Barreto, Humberto, and Frank Howland. 1993. There Are Two Okun’s Law Relationships between Output and Unemployment. Available online: https://www.researchgate.net/publication/228421484_There_Are_Two_Okun%27s_Law_Relationships_between_Output_and_Unemployment (accessed on 8 April 2019).
  13. Bote, Venancio. 1990. Planificación Económica del Turismo: De una Estrategia Masiva a una Artesanal. Mexico: Trillas. [Google Scholar]
  14. Brida, Juan Gabriel, Edgar J. Sánchez, and W. Adrian Risso. 2008. Tourism’s impact on long-run Mexican economic growth. Economics Bulletin 3: 1–8. [Google Scholar]
  15. Caballero, Pilar. 2011. Estacionalidad turística y temporalidad del empleo ¿Reservas de Eficiencia? Cuba: Investigación Económica 17: 26–56. [Google Scholar]
  16. Cárdenas, Fabio. 1990. Comercialización del Turismo: Determinación y Análisis de Mercados. Mexico: Trillas. [Google Scholar]
  17. Charemza, Wojciech W., and Derek F. Deadman. 1997. New Directions in Econometric Practice: General to Specific Modelling, Cointegration and Vector Autoregresion. Cheltenham: Edward Elgar Publishing. [Google Scholar]
  18. Chou, Ming Che. 2013. Does tourism development promote economic growth in transition countries? A panel data analysis. Economic Modelling 33: 226–32. [Google Scholar] [CrossRef]
  19. Dahdá, Jorge. 1998. Publicidad Turística. Mexico: Trillas. [Google Scholar]
  20. Dahdá, Jorge. 2003. Elementos de Turismo: Economía, Comunicación, Alimentos y Bebidas, Líneas Áreas, Hotelería, Relaciones Públicas. Mexico: Trillas. [Google Scholar]
  21. Daly, Mary, and Bart Hobijn. 2010. Okun’s Law and the Unemployment Surprise of 2009. FRBSF Economic Letter 7: 1–5. Available online: https://www.frbsf.org/economic-research/files/el2010-07.pdf (accessed on 12 October 2018).
  22. Dare, Shekinah, and Ameer Hek. 2016. The validity of Okun’s Law in Curaçao. Working Paper. Willemstad: Centrale Bank van Curaçao en Sint Maarten. [Google Scholar]
  23. Datatur. 2019a. Indicadores Trimestrales de la Actividad Turística: ITAT-INEGI. Available online: http://www.datatur.sectur.gob.mx/SitePages/ResultadosITAT.aspx (accessed on 17 July 2019).
  24. Datatur. 2019b. Ranking Mundial del Turismo Internacional. Available online: http://www.datatur.sectur.gob.mx/SitePages/RankingOMT.aspx (accessed on 17 July 2019).
  25. Dayananda, K. C., and D. S. Leelavathi. 2016. Tourism development, economic and employment growth in India. IOSR Journal of Humanities and Social Science 21: 35–40. [Google Scholar]
  26. Dogru, Tarik, Cem Işik, and Ercan Sirakaya-Turk. 2019. The balance of trade and exchange rates: Theory and contemporary evidence from tourism. Tourism Management 74: 12–23. [Google Scholar] [CrossRef]
  27. Enders, Walter. 2004. Applied Econometric Time Series. New York: John Wiley & Sons. [Google Scholar]
  28. Fawaz, Fadi, Masha Rahnama, and Betty Stout. 2015. An empirical refinement of the relationship between tourism and economic growth. Anatolia: An International Journal of Tourism and Hospitality Research 25: 352–63. [Google Scholar] [CrossRef]
  29. Ferguson, Lucy. 2010. Tourism as a development strategy in Central America: Exploring the impact on women’s lives. In CAWN Briefing Paper: March 2010. London: Central America Women’s Network. [Google Scholar]
  30. Fernández, Rodrigo A., and Horacio Simes. 2006. Cumplimiento de la ley de Okun en la ciudad de Posadas utilizando modelos estáticos. Revista Científica “Visión de Futuro” 6: 1–26. [Google Scholar]
  31. Fernández, Rodrigo A., and Horacio Simes. 2007. Cumplimiento de la ley de Okun en la ciudad de Posadas utilizando modelos dinámicos. Revista Científica “Visión de Futuro” 7: 1–16. [Google Scholar]
  32. Girault, Christian. 2013. Mexique: les atouts d’un Grand du tourisme international. Rayonnement du CNRS 62: 26–35. [Google Scholar]
  33. Glynn, John, Nelson Perera, and Reetu Verma. 2007. Unit root tests and structural breaks: A survey with applications. Revista de Métodos Cuantitativos para la Economía y la Empresa 3: 63–79. [Google Scholar]
  34. Gujarati, Damodar N., and Dawn C. Porter. 2009. Econometría. Mexico: McGraw-Hill. [Google Scholar]
  35. Guzmán, María de la Paz, and Pascual García. 2008. El modelo VAR y sus principales problemas. Panorama Económico 3: 95–117. [Google Scholar] [CrossRef]
  36. INEGI. 2018. Indicadores Trimestrales de la Actividad Turística (ITAT). Available online: http://www.inegi.org.mx/est/contenidos/proyectos/cn/itat/pres_larga.aspx (accessed on 13 September 2018).
  37. INEGI. 2019a. Indicadores Económicos de Coyuntura: Tasas de Ocupación, Desocupación y Subocupación (Resultados Mensuales de la ENOE, 15 años y más). Available online: https://www.inegi.org.mx/sistemas/bie/ (accessed on 18 July 2019).
  38. INEGI. 2019b. Series que ya no se Actualizan. Indicadores Económicos de Coyuntura: Tasas de Ocupación, Desocupación y Subocupación (Resultados Mensuales de la ENOE, 14 años y más). Available online: https://www.inegi.org.mx/sistemas/bie/ (accessed on 18 July 2019).
  39. INEGI. 2019c. Indicadores Económicos de Coyuntura: Actividad turística, base 2013. Available online: https://www.inegi.org.mx/sistemas/bie/ (accessed on 18 July 2019).
  40. Işik, Cem. 2015. Foreign Direct Investment in Tourism: Panel Data Analysis of D7 Countries. Athens Journal of Tourism 2: 92–103. [Google Scholar] [CrossRef]
  41. Işik, Cem, Evangelia Kasımatı, and Serdar Ongand. 2017. Analyzing the causalities between economic growth, financial development, international trade, tourism expenditure and/on the CO2 emissions in Greece. Energy Sources, Part B: Economics, Planning, and Policy 12: 665–73. [Google Scholar] [CrossRef]
  42. Işik, Cem, Tarik Dogru, and Ercan Sirakaya Turk. 2018. A nexus of linear and non-linear relationships between tourism demand, renewable energy consumption, and economic growth: Theory and evidence. International Journal of Tourism Research 20: 38–49. [Google Scholar] [CrossRef]
  43. Jaramillo, Patricio. 2009. Estimación de VAR Bayesianos para la economía chilena. Revista de Análisis Económico 24: 101–26. [Google Scholar]
  44. Jovanović, Sonja, and Ivana Ilić. 2016. Infrastructure as important determinant of tourism development in the countries of Southeast Europe. Ecoforum 5: 288–94. [Google Scholar]
  45. Jucan, Cornel Nicolae, and Mihaela Sabina Jucan. 2013. Travel and tourism as a driver of economic recovery. Procedia Economics and Finance 6: 81–88. [Google Scholar] [CrossRef]
  46. Kim, Hong-bumm, Jung-Ho Park, Seul Ki Lee, and SooCheong (Shawn) Jang. 2012. Do expectations of future wealth increase outbound tourism? Evidence from Korea. Tourism Management 33: 1141–47. [Google Scholar] [CrossRef]
  47. Knotek, Edward S. 2007. How useful is Okun’s law? Economic Review—Federal Reserve Bank of Kansas City 92: 73–103. [Google Scholar]
  48. Lancaster, David, and Peter Tulip. 2015. Okun’s Law and Potential Output. In Research Discussion Paper 2015-14; Sydney: Reserve Bank of Australia. Available online: https://www.rba.gov.au/publications/rdp/2015/pdf/rdp2015-14.pdf (accessed on 6 October 2018).
  49. Lau, Evan, Swee-Ling Oh, and Sing-Sing Hu. 2008. Tourist Arrivals and Economic Growth in Sarawak. MPRA Paper No. 9888. Munich: Munich Personal RePEc Archive. [Google Scholar]
  50. Lemma, Alberto F. 2014. Tourism Impacts: Evidence of Impacts on Employment, Gender, Income. EPS PEAKS, Helpdesk Request. July. Available online: https://assets.publishing.service.gov.uk/media/57a089f2ed915d622c000495/Tourism_Impacts_employment_gender_income_A_Lemma.pdf (accessed on 17 October 2018).
  51. Liquitaya, José D., and Eddy Lizarazu. 2003. La ley de Okun en la economía mexicana. Denarius 8: 15–39. [Google Scholar]
  52. Loría, Eduardo, and Luis Brito. 2005. El impacto de la inversión extranjera directa en México en el empleo sectorial en México: Un análisis prospectivo. Análisis Económico 20: 5–34. [Google Scholar]
  53. Loría, Eduardo, and Leobardo de Jesús. 2011. The robustness of Okun’s law—Evidence from Mexico: A quarterly validation, 1985.1–2006.4. In Market Liberalism, Growth and Economic Development in Latin America. Edited by Gerardo Angeles-Castro, Ignacio Perrotini-Hernández and Humberto Ríos-Bolivar. New York: Routledge, pp. 264–76. [Google Scholar]
  54. Loría, Eduardo, and Manuel G. Ramos. 2007. La ley de Okun: Una relectura para México, 1970–2004. Estudios Económicos 22: 19–55. [Google Scholar]
  55. Loría, Eduardo, Leobardo de Jesús, and Jorge Ramírez. 2011. Recesión y desempleo en México: Un análisis estructural, 1985.1–2009.2. In Integración y Recesión Económica en el Binomio México—Estados Unidos. Edited by Pablo Mejía and María Esther Morales. Toluca: Universidad Autónoma del Estado de México. [Google Scholar]
  56. Loría, Eduardo, Catalina Libreros, and Emmanuel Salas. 2012. La ley de Okun en México: Una mirada de género, 2000.2–2011.1. Investigación Económica 71: 121–40. [Google Scholar] [CrossRef]
  57. Loría, Eduardo, Fernando Sánchez, and Emmanuel Salas. 2017. Efectos de la llegada de viajeros internacionales en el desempleo y el crecimiento económico en México, 2000.2–2015.2. El Periplo Sustentable 32: 1–24. [Google Scholar]
  58. Mandić, Ante, Željko Mrnjavac, and Lana Kordić. 2018. Tourism infrastructure, recreational facilities and tourism development. Tourism and Hospitality Management 24: 1–22. [Google Scholar] [CrossRef]
  59. Minitab 17 Support. 2017. What Is a Variance Inflation Factor (VIF)? Available online: http://support.minitab.com/en-us/minitab/17/topic-library/modeling-statistics/regression-and-correlation/model-assumptions/what-is-a-variance-inflation-factor-vif/ (accessed on 17 February 2019).
  60. Neely, Christopher J. 2010. Okun’s law: Output and unemployment. Economic Synopses 4: 1–2. [Google Scholar] [CrossRef]
  61. Ohlan, Ramphul. 2017. The relationship between tourism, financial development and economic growth in India. Future Business Journal 3: 9–22. [Google Scholar] [CrossRef]
  62. Okun, Arthur M. 1962. Potential GNP: Its Measurement and Significance. Cowles Foundation. Paper 190. Reprinted from 1962. Proceedings of the Business and Economic Statistics Section. American Statistical Association. Available online: https://milescorak.files.wordpress.com/2016/01/okun-potential-gnp-its-measurement-and-significance-p0190.pdf (accessed on 12 February 2019).
  63. Panosso, Alexandre, and Guilherme Lohmann. 2012. Teoría del Turismo: Conceptos, Modelos y Sistemas. Mexico: Trillas. [Google Scholar]
  64. Phiri, Andrew. 2016. Tourism and economic growth in South Africa: Evidence from linear and nonlinear cointegration frameworks. Managing Global Transitions 14: 31–53. [Google Scholar]
  65. Pindyck, Robert S., and Daniel L. Rubinfeld. 2001. Econometría: Modelos y Pronósticos. Mexico: McGraw-Hill. [Google Scholar]
  66. Ramírez, César. 1994. La modernización y Administración de Empresas Turísticas. Mexico: Trillas. [Google Scholar]
  67. Riascos, Julio C. 2009. El índice de malestar económico o índice de miseria de Okun: Breve análisis de casos 2001–2008. Tendencias 10: 92–124. [Google Scholar]
  68. Ripoll, Graciela. 1986. Turismo Popular: Inversiones Rentables. Mexico: Trillas. [Google Scholar]
  69. Rodríguez, Patricia, and Felipe de Jesús Peredo. 2007. Estimación de la ley de Okun para la economía mexicana. Análisis Económico 22: 59–79. [Google Scholar]
  70. Sánchez, Fernando. 2019. Turismo receptivo y crecimiento económico en México: Evidencia de largo plazo. Contaduría y Administración. in press. [Google Scholar]
  71. Sánchez, Fernando, and José Nabor Cruz. 2016. Determinantes económicos de los flujos de viajeros a México. Revista de Análisis Económico 31: 3–36. [Google Scholar] [CrossRef]
  72. Seetaram, Neelu. 2010. A Study on Outbound Tourism from Australia. Discussion Paper 47/10. Monash University. Available online: https://www.monash.edu/__data/assets/pdf_file/0005/925457/a_study_of_outbound_tourism_from_australia.pdf (accessed on 21 July 2019).
  73. Smeral, Egon. 2003. A structural view of tourism growth. Tourism Economics 9: 77–93. [Google Scholar] [CrossRef]
  74. Stabler, Mike J., Andreas Papatheodorou, and M. Thea Sinclair. 2010. The Economics of Tourism, 2nd ed. London: Routledge. [Google Scholar]
  75. Stober, Emmanuel Olusegun. 2015. The validity of Okun’s law: An assessment of United Kingdom’s unemployment-output relationship. International Journal of Economic Practices and Theories 5: 10–15. [Google Scholar]
  76. UNWTO, and ILO. 2014. Measuring Employment in the Tourism Industries: Guide with Best Practices. Madrid: UNWTO Publications. [Google Scholar]
  77. Varian, Hal R. 1992. Análisis Microeconómico. Barcelona: Antoni Bosch. [Google Scholar]
  78. World Travel and Tourism Council. 2019. Travel & Tourism Continues Strong Growth above Global GDP. Available online: https://www.wttc.org/about/media-centre/press-releases/press-releases/2019/travel-tourism-continues-strong-growth-above-global-gdp/ (accessed on 7 April 2019).
  79. Zerbo, Adama. 2017. Croissance Économique et Chômage: Les Fondements de la loi d’Okun et le Modèle IS-LM-LO. Document de Travail: DT/176/2017. Bordeaux: Université Montesquieu-Bordeaux IV. [Google Scholar]
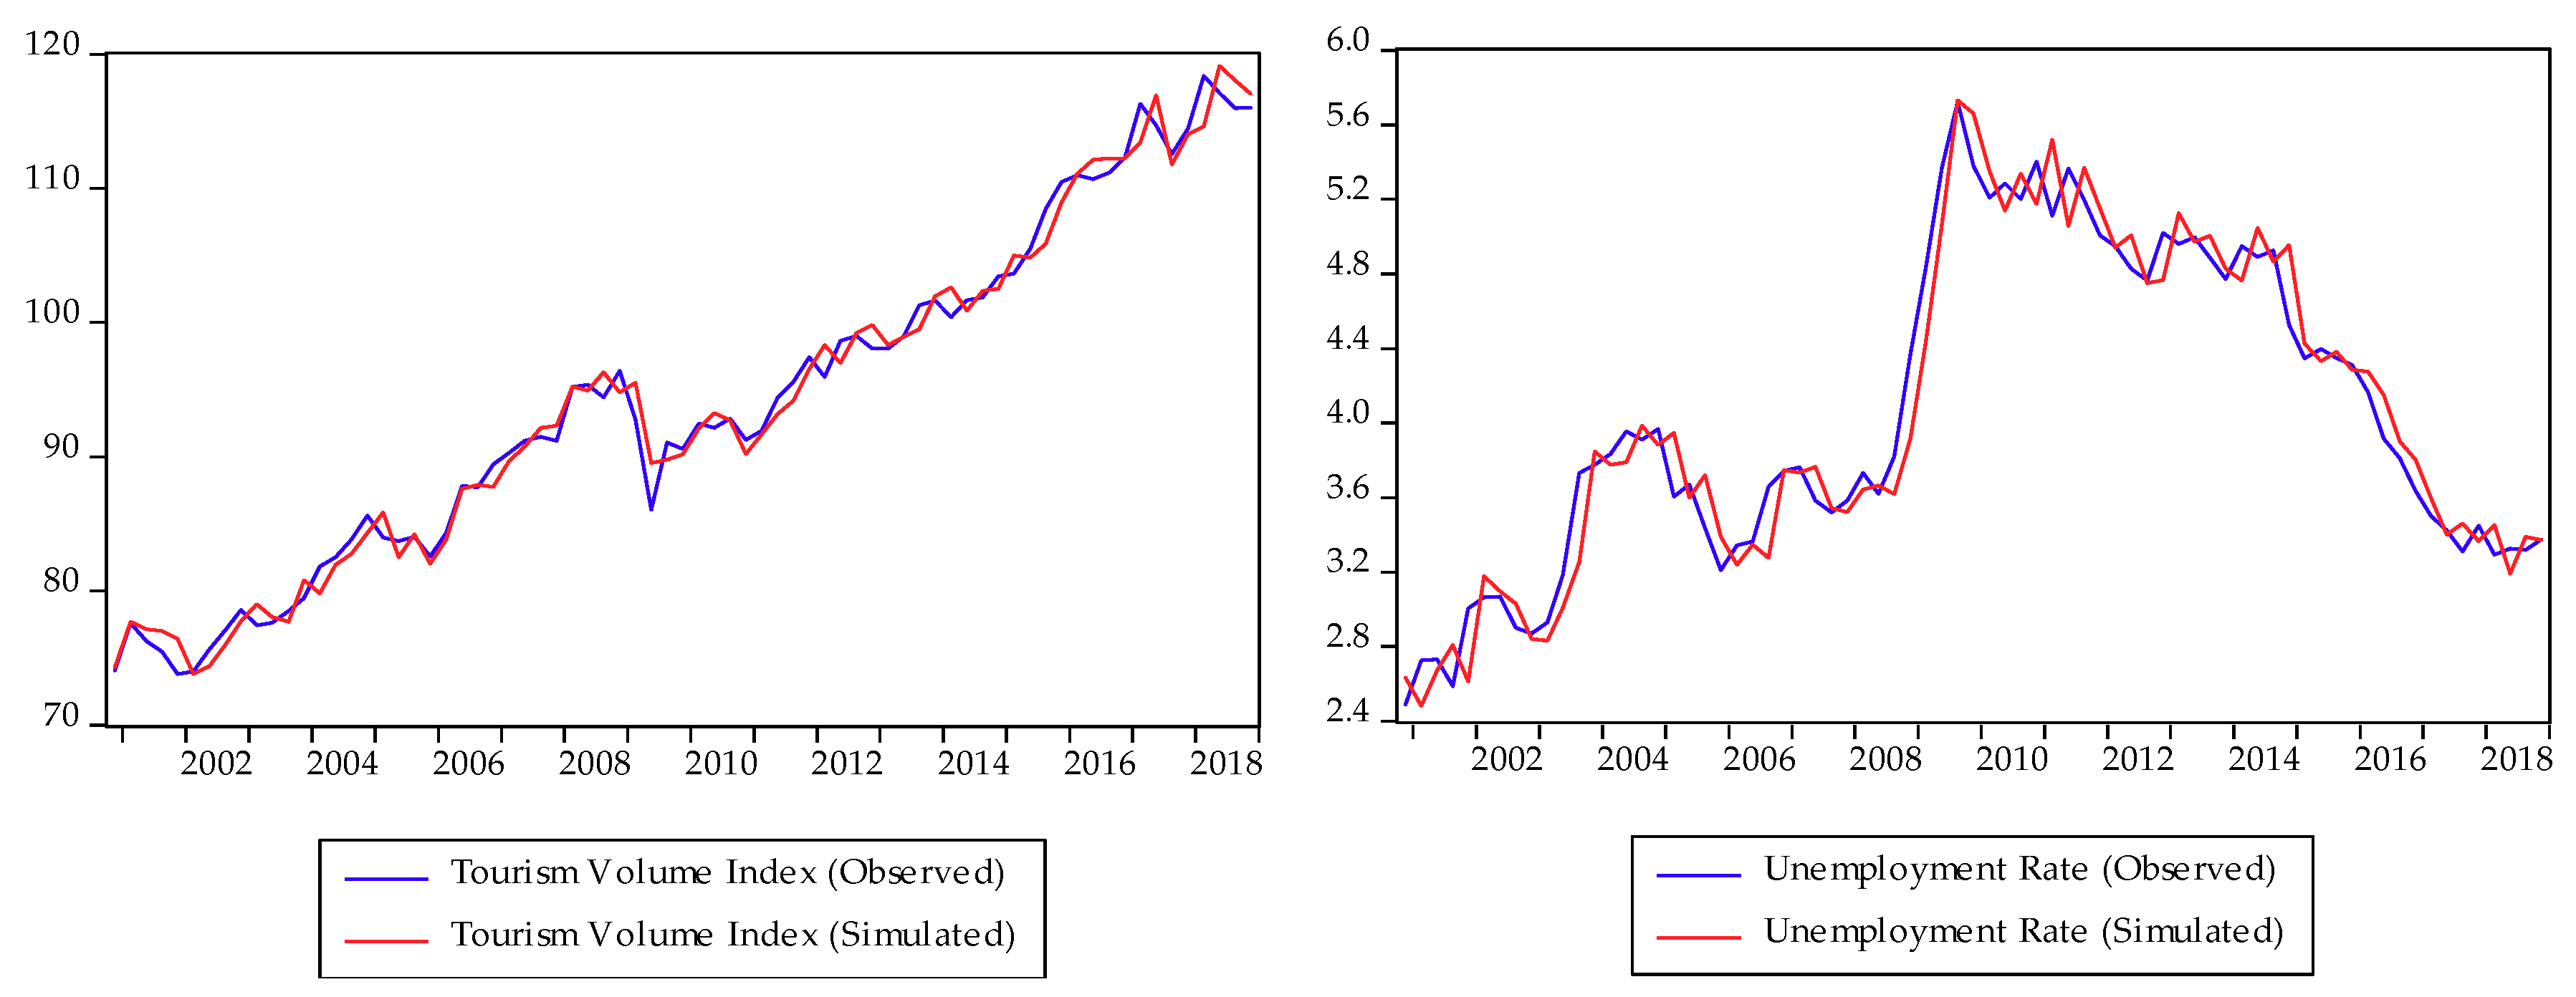
Figure 1. Unrestricted VAR historical simulation. Note: the simulation was carried out by using Broyden’s algorithm; static-deterministic simulation; iterations: 5000; convergence: 1 × 10⁻⁸; parsing analytic Jacobian: 0 derivatives kept, 0 derivatives discarded.
Economies 07 00083 g001
Figure 2. Response to structural VAR innovations ±2 SE.
Economies 07 00083 g002
Figure 3. Historical decomposition using structural VAR weights.
Economies 07 00083 g003
Table 1. Breakpoint unit root tests, 2000Q2–2018Q4.
SeriesInnovation OutlierAdditive Outlier
ABCDABCD
U −2.039−2.672−5.295 **−3.495−1.871−2.771−5.102 *−3.626
ln Y T −1.946−6.264 ***−6.267 ***−3.501−1.961−4.918 **−5.005 *−3.556
u −7.598 ***−7.489 ***−7.533 ***−6.936 ***−7.704 ***−7.685 ***−7.764 ***−7.077 ***
y ˙ T −11.73 ***−11.59 ***−11.51 ***−9.263 ***−11.85 ***−11.82 ***−11.70 ***−9.431 ***
Note: A, Intercept only; B, Trend and intercept (intercept); C, Trend and intercept (trend and intercept); D, Trend and intercept (trend); Lag length: Schwarz criterion; Breakpoint selection: Dickey–Fuller min-t; *, **, and *** denote rejection of the unit root hypothesis at the 10%, 5%, and 1% significance levels, respectively; y ˙ T = Δ ln Y T and u = Δ U .
Table 2. Vector autoregressive (VAR) lag order selection criteria.
LagLRFPEACSCHQ
0NA1.64 × 10−5–5.340715–5.275435 *–5.314849
112.59626 *1.52 × 10−5 *–5.416857 *–5.221018–5.339259 *
25.9513201.56 × 10−5–5.393675–5.067277–5.264346
37.4600311.55 × 10−5–5.398324–4.941366–5.217263
45.3433791.60 × 10−5–5.371242–4.783725–5.138450
56.8991341.60 × 10−5–5.374633–4.656557–5.090109
62.9139391.71 × 10−5–5.309966–4.461331–4.973711
Note: * indicates lag order selected by the criterion; exogenous variables: C.
Table 3. Vector autoregressive model.
Variables y ˙ t u t
y ˙ t 1 –0.150401
[–1.66711]
–2.847520
[–2.45436]
u t 1 –0.024674
[–2.72035]
0.203935
[1.74839]
C 0.007361
[3.90943]
0.026337
[1.08768]
δ t 0.036936
[7.38359]
0.011761
[0.18283]
R20.4498010.135126
Adjusted R20.4258790.097523
F-Statistic18.80306 ***3.593480 **
Note: [*] t-statistic; *** and ** indicate rejection of the null hypothesis at the 1% and 5% significance levels, respectively; Sample (adjusted): 2000Q4–2018Q4.
Table 4. Unrestricted VAR joint correct specification tests.
TestStatisticProbability
Doornik–Hansen Normality Test:
  Skewness2.75430.2523
  Kurtosis0.99960.6066
  Jarque–Bera3.75390.4403
Residual Correlation LM (12)1.48620.2099
White Heteroskedasticity Test (no cross terms)18.76580.4064
White Heteroskedasticity Test (cross terms)36.76520.0995
Table 5. Structural factorization normality test.
SkewnessKurtosisJarque–Bera
χ2χ2χ2
2.59570.81823.4139
(0.2731)(0.6642)(0.4911)
Table 6. Vector autoregressive Granger causality test.
Null Hypothesis χ 2 dfProbability
u does not Granger cause y ˙ T 7.400310.0065 ***
y ˙ T does not Granger cause u 6.023810.0141 **
Note: ** and *** indicate rejection of the null hypothesis at the 5% and 1% significance levels, respectively.
Table 7. Structural variance decomposition.
Period Decomposition   of   y ˙ T Decomposition   of   u
y ˙ T u y ˙ T u
1100.000.004.81195.188
591.2718.72810.76489.235
1091.2708.72910.76589.234
1591.2708.72910.76589.234
2091.2708.72910.76589.234
Note: Only the first three decimal positions are considered in the data.