Article

Lack of Global Convergence and the Formation of Multiple Welfare Clubs across Countries: An Unsupervised Machine Learning Approach

Graduate School of International Development, Nagoya University, Aichi 464-8601, Japan
Economies 2019, 7(3), 74; https://doi.org/10.3390/economies7030074
Submission received: 6 June 2019 / Revised: 5 July 2019 / Accepted: 8 July 2019 / Published: 17 July 2019
(This article belongs to the Special Issue Computational Macroeconomics)

Abstract

:
The cross-country convergence hypothesis is one of the central topics of long-run macroeconomics. This paper revisits this hypothesis in a context beyond GDP. It uses a novel welfare index that incorporates measures of consumption, leisure, life expectancy, and inequality. Based on a sample of 128 countries over the 1980–2007 period, the lack of global sigma and beta convergence is first documented. Next, the paper incorporates some recent developments from the unsupervised machine learning literature to evaluate the existence of local convergence. In particular, the application of a distribution-based clustering algorithm suggests the formation of three local convergence clubs. Under this classification, beta convergence is recovered for each club. However, only the core members of the richest club appear to be reducing their welfare differences in a way that is consistent with the strong notion of sigma convergence. Overall, these results re-emphasize the finding that beta convergence is necessary, but not sufficient for sigma convergence, even within convergence clubs and in a context beyond GDP.

1. Introduction

In the study of long-run macroeconomics, a central topic is the empirical testing of the convergence hypothesis across countries (Johnson and Papageorgiou 2018). Differences across countries are conceptually defined in terms of living standards or national welfare. However, from an empirical and operational standpoint, GDP per-capita has been used in most of the literature as the key proxy variable for measuring living standards. Although the use of GDP per-capita is sometimes useful and informative,1 economist are well aware that it is an incomplete measure of national welfare (Fleurbaey 2009; Fleurbaey and Blanchet 2013, Stiglitz et al. 2010, 2019). In this context, a series of different alternatives has been proposed by economists and non-economists alike (Becker et al. 2005; Cordoba and Verdier 2008; Fleurbaey and Gaulier 2009). One of the most recent attempts to go beyond GDP is the work of Jones and Klenow (2016). Using a rigorous expected utility framework, these authors combined measures of national consumption (private and public), leisure, life expectancy, and inequality to construct a theoretically-appealing new welfare index. Given the comprehensive coverage of this index, it can be used as an alternative proxy variable for the study of the convergence hypothesis.
Machine learning is a fast-growing field of research that focuses on the development of prediction, classification, and clustering algorithms (Athey 2018; Athey and Imbens 2019). It is commonly divided into two sub-fields: supervised and unsupervised machine learning. The latter focuses on finding clusters of observations using covariates, and it is the main approach used in the current paper. Traditional clustering frameworks such K-means and hierarchical clustering derive their results based on some criteria of distance. In contrast, distribution-based clustering frameworks derive their results by defining clusters as regions of high-probability density separated by low-probability regions (Hartigan 1975; Kaufman and Rousseeuw 2010).
This paper revisits the cross-country convergence hypothesis in the context beyond GDP suggested by Jones and Klenow (2016). From a methodological standpoint, this paper first applies the classical sigma and beta convergence tests of Barro and Sala-i Martin (1992). Then, its fundamental contribution relies on the implementation of the distributional convergence approach of Quah (1993, 1996b, 1997). Furthermore, by taking advantage of some recent developments in the unsupervised machine learning literature, it extends the distributional convergence framework by integrating the distribution-based clustering algorithm of Azzalini and Menardi (2014a). This extension allows for a more detailed identification and characterization of convergence clubs.
Based on a sample of 128 countries over the 1980–2007 period, this paper finds that welfare differences across countries are characterized by a lack of both sigma and beta convergence. Moreover, limited country mobility suggests the possible existence of convergence clubs. The distributional convergence approach builds on these findings and suggests that the cross-country welfare distribution appears to be characterized by three convergence clubs or clusters. Interestingly, under this classification, the beta convergence is recovered for each club. However, only the core members of the richest club appear to be converging in a way that is consistent with the strong notion of sigma convergence. Overall, these results re-emphasize a central finding in the long-run macroeconomics literature: beta convergence is necessary, but not sufficient for sigma convergence, even within convergence clubs and in a context beyond GDP.
The rest of the paper is organized as follows: Section 2 describes the data and the different convergence frameworks. Section 3 introduces some stylized convergence facts about welfare differences across countries. Section 4 presents the convergence clubs’ results. Section 5 discusses the results and outlines some suggestions for further research. Finally, Section 6 offers some concluding remarks.

2. Data and Methods

2.1. Beyond GDP Data

The work in Jones and Klenow (2016) proposed a new summary statistic that aims to quantify the level of welfare of people in a country. This statistic incorporates measures of consumption (private and public), leisure, life expectancy, and inequality. Internationally-comparable measures of consumption are taken from the Penn World Table 8.0. This database also provides the necessary inputs to compute a measure of leisure time from the available series of hours worked, employment, and population data. Life expectancy data are from the World Bank’s HNPStatsdatabase. Finally, inequality data are from the UNI-WIDERWorld Income Inequality database 3.0.2
To aggregate these measures, in a theoretically-consistent way, the work in Jones and Klenow (2016) calibrated an expected utility function and evaluated the consumption-equivalent level of the four variables. Using this statistic, they found that, on average, welfare is highly correlated with GDP per capita. However, they also reported that there are often large deviations from GDP, in particular in developing countries. For instance, in terms of the relative welfare differences across regions, Western Europe appears closer to the United States; fast-growing Asia has not caught up as much; and most countries in Latin America and Africa are lagging further behind. The work in Jones and Klenow (2016) constructed this welfare statistic for 152 countries in the year 2007. They also calculated the average growth rate for the 1980–2007 period using a sub-sample of 128 countries3. Given the welfare level data for the final year (2007) and the average growth rate (1980–2007 period), it is possible to recover cross-sectional data for the initial year (1980). Thus, based on the availability of the data, this paper uses a sample of 128 countries for two time periods: 1980 and 2007.4

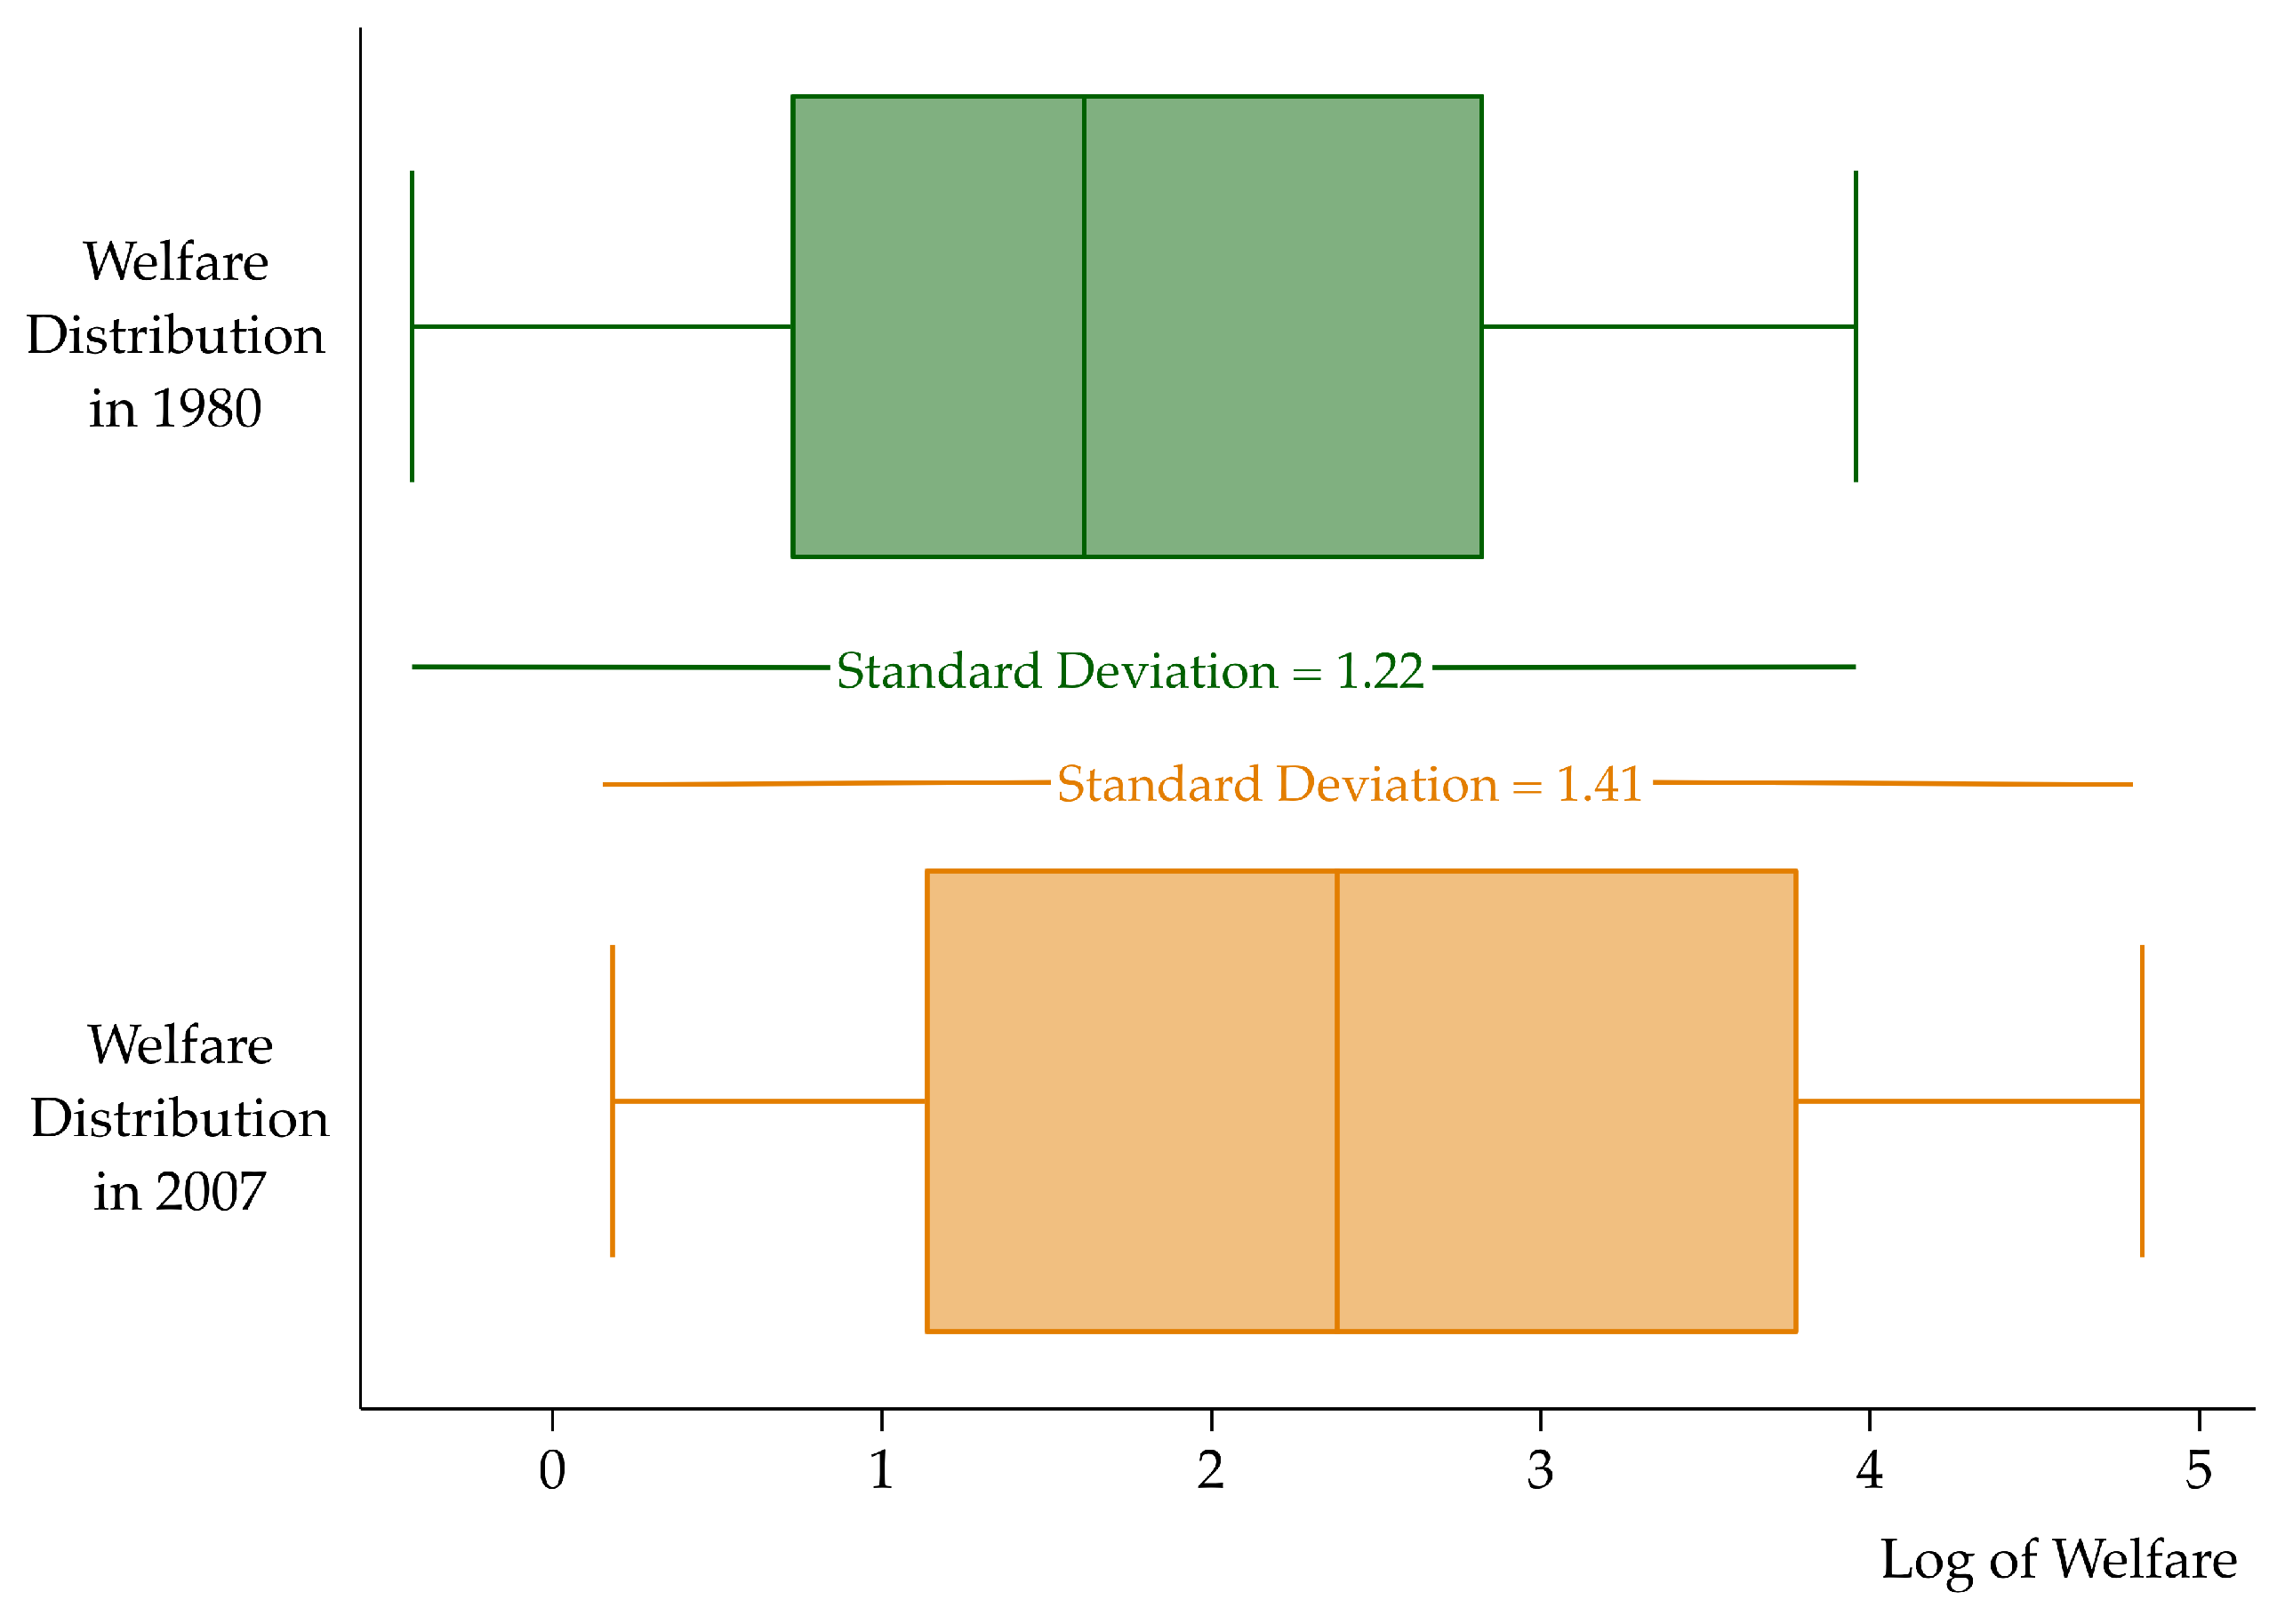
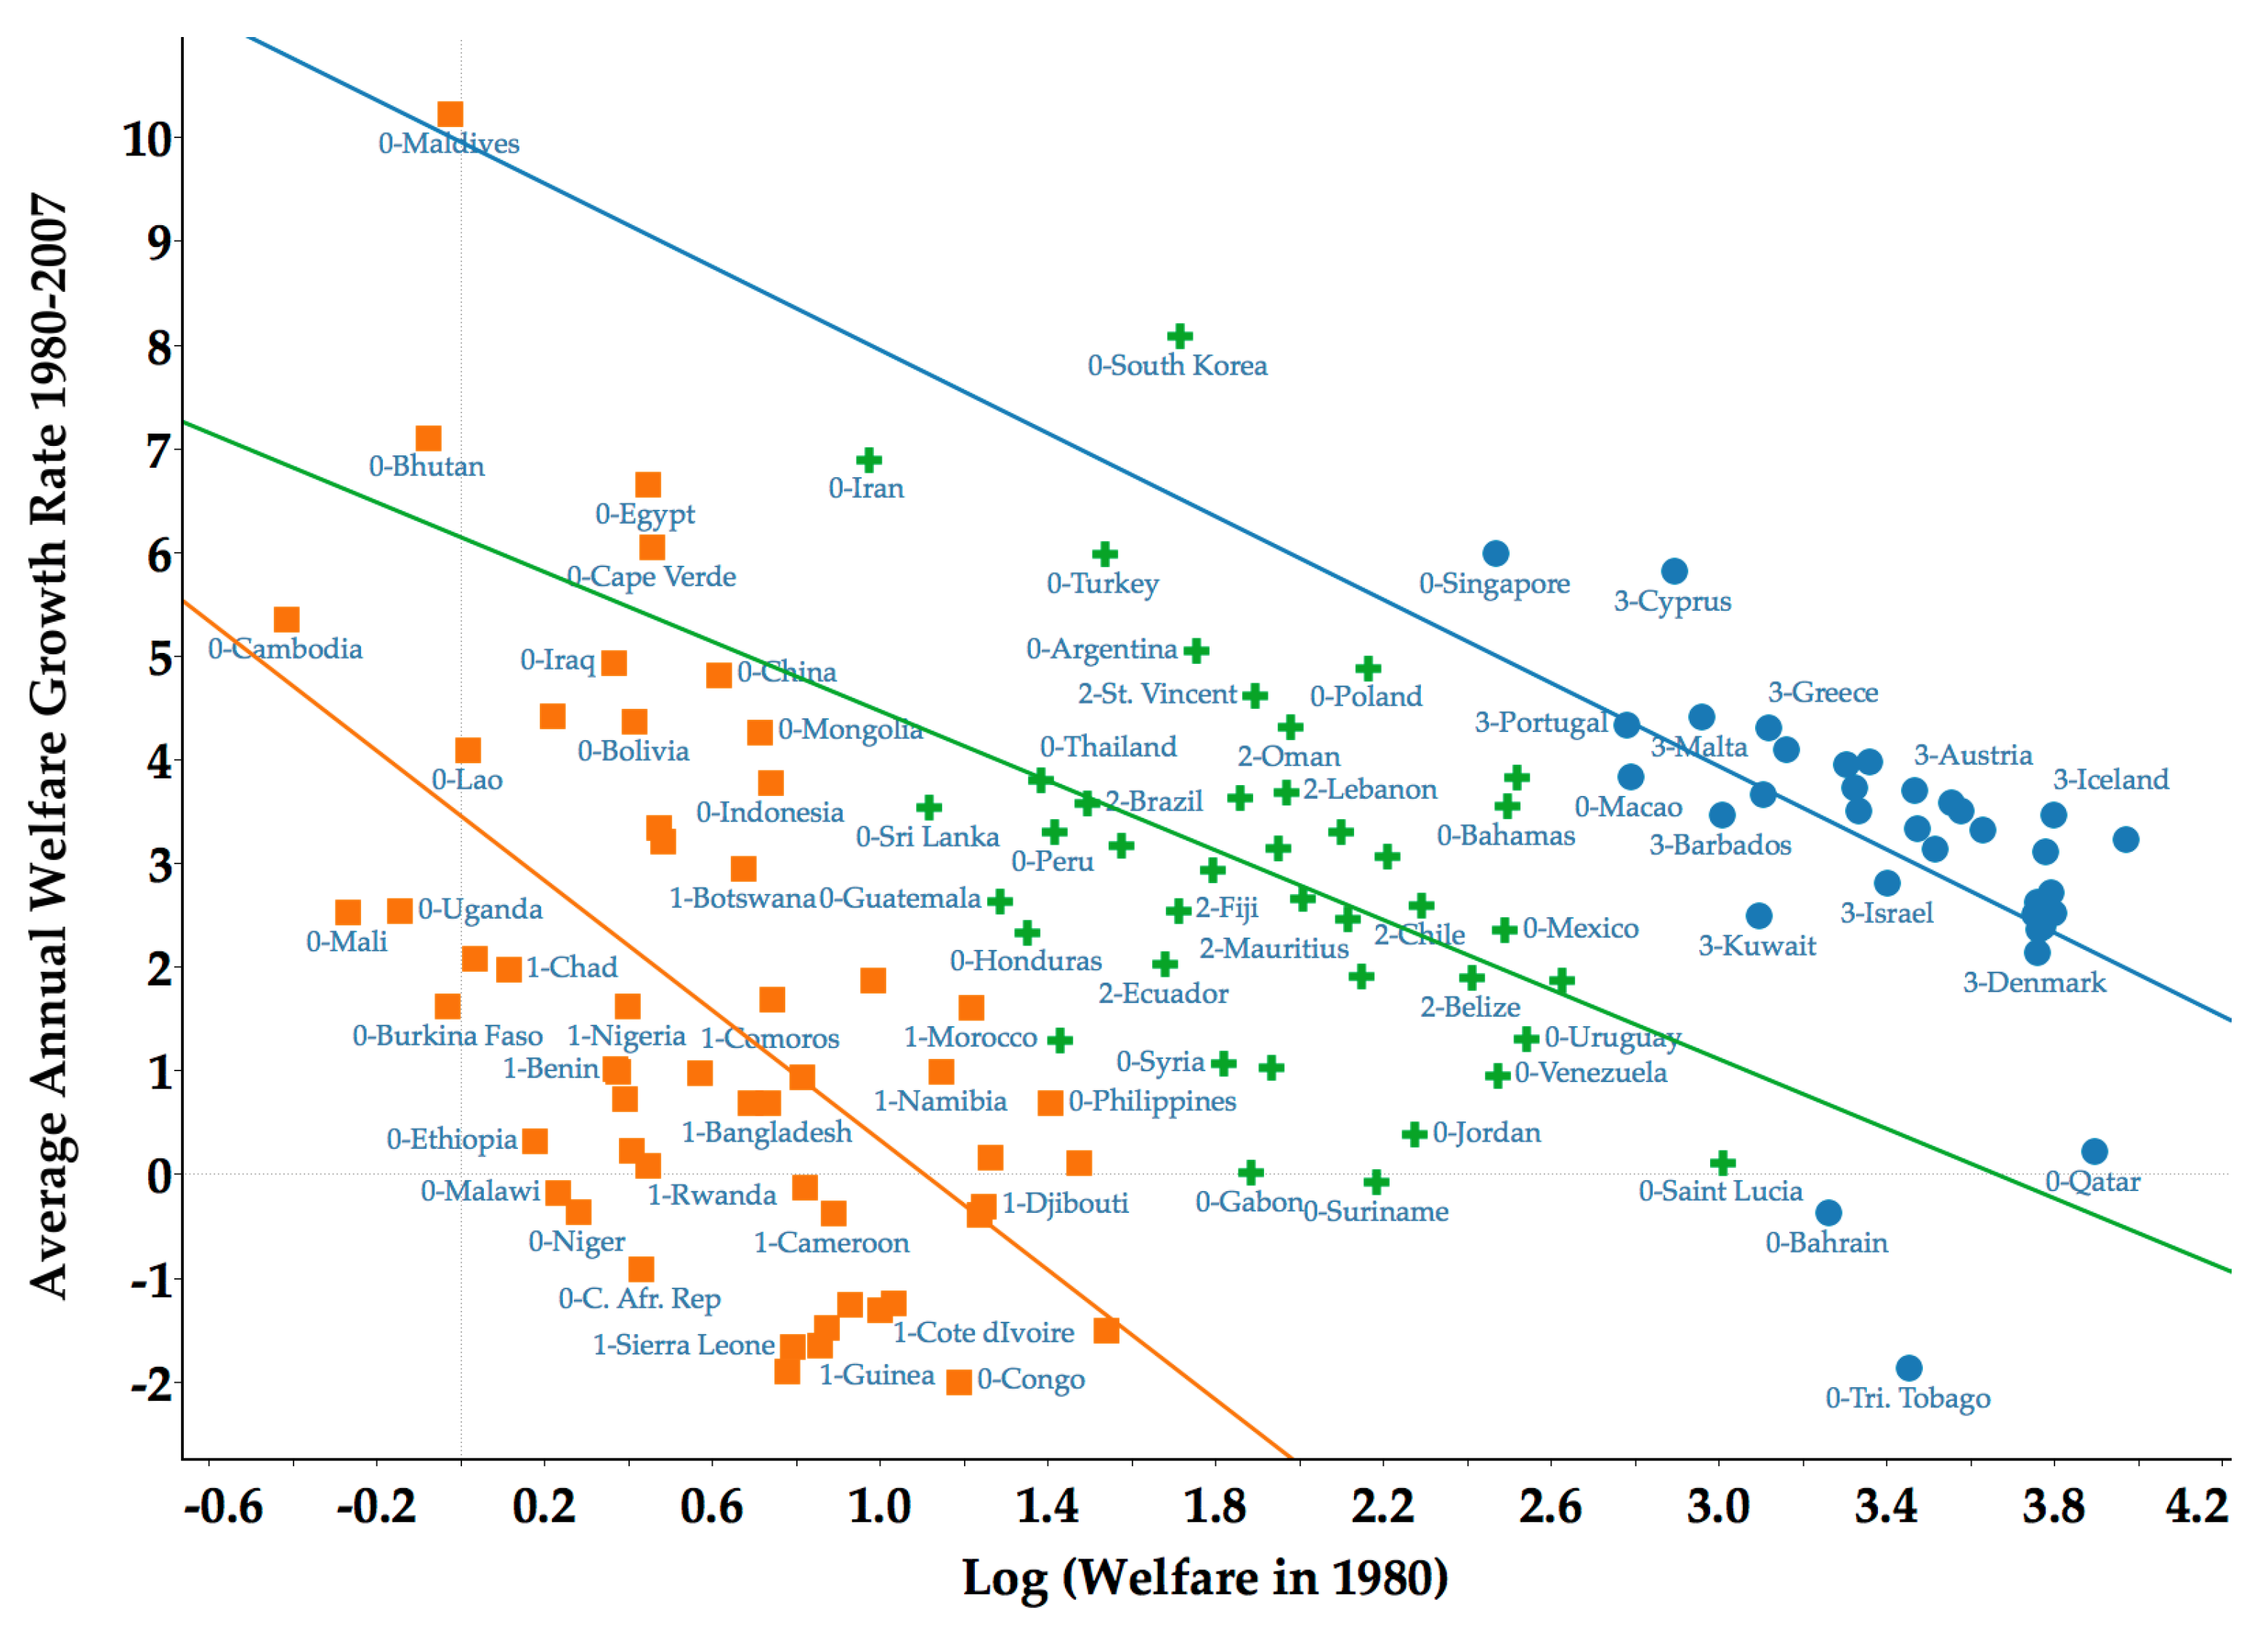
2.2. Sigma and Beta Convergence

In the empirical literature of economic growth, two concepts of convergence are typically discussed. On the one hand, the concept of sigma ( σ ) convergence describes the evolution of the cross-sectional dispersion of a variable. From this perspective, convergence occurs when the cross-sectional dispersion declines over time, so the level of the variable under study becomes increasingly more similar across countries (Barro and Sala-i Martin 1992; Baumol 1986; Dowrick and Nguyen 1989). Typically, sigma convergence is measured by the coefficient of variation or by the standard deviation of the logarithm of the variable under study. In the context of the current paper, the latter indicator is adopted, and the measurement of sigma convergence is implemented as follows:
σ t = 1 N 1 i = 1 N l o g ( y i ) l o g ( y ) ¯ 2 ,
where σ t is the cross-country dispersion in national welfare, N is the number of countries, l o g ( y i ) is the natural logarithm of the welfare level of country i, and l o g ( y ) ¯ is the sample average of the logarithm of welfare.
On the other hand, the concept of unconditional beta ( β ) convergence describes the inverse relationship between the initial level of a variable and its average growth rate. From this perspective, if such an inverse relationship exists, it means that, on average, poor countries tend to grow faster than the rich ones, so over time, poor countries tend to catch up with the level of the rich ones (Barro and Sala-i Martin 1992; Baumol 1986; Sala-i Martin 1996). Typically, beta convergence is measured by the estimation of an Ordinary Least Squares (OLS) regression, in which the growth rate of a variable inversely depends on its initial level. In the context of the current paper, the measurement of beta convergence is implemented as follows:
1 T l o g y t y 0 = c 1 e β t t l o g ( y 0 ) ,
where the left side represents the average rate of welfare growth, which shows an inverse relationship to its initial level in log terms, l o g ( y 0 ) , β represents the speed of convergence to the steady-state, and c represents unobserved parameters, such as steady-state values.
These two measures of convergence are related5. Keeping other variables constant, when poor countries tend to grow faster than rich ones (that is, beta convergence), then the cross-country dispersion declines over time (that is, sigma convergence). In other words, beta convergence is one determinant of sigma convergence. However, the effect of beta convergence can be offset by other variables and shocks that increase the dispersion at any point in time. As pointed out by Quah (1993) and Sala-i Martin (1996), beta convergence is necessary, but not sufficient to achieve sigma convergence.

2.3. Distributional Convergence and Convergence Clubs

The distributional convergence approach aims to capture the evolution of the entire cross-country distribution of a variable. From this perspective, convergence occurs when the shape of the cross-sectional distribution tends to one density peak (one mode) over time. In this framework, the emergence of multiple peaks or modes is usually associated with the existence of convergence clubs (Galor 1996; Magrini 2009; Quah 1996a, 1997). Typically, distributional convergence is measured by the shape and the number of modes of a stochastic kernel distribution and its corresponding ergodic distribution. In the current paper, only the former is adopted, and the measurement of distributional convergence6 is implemented as follows:
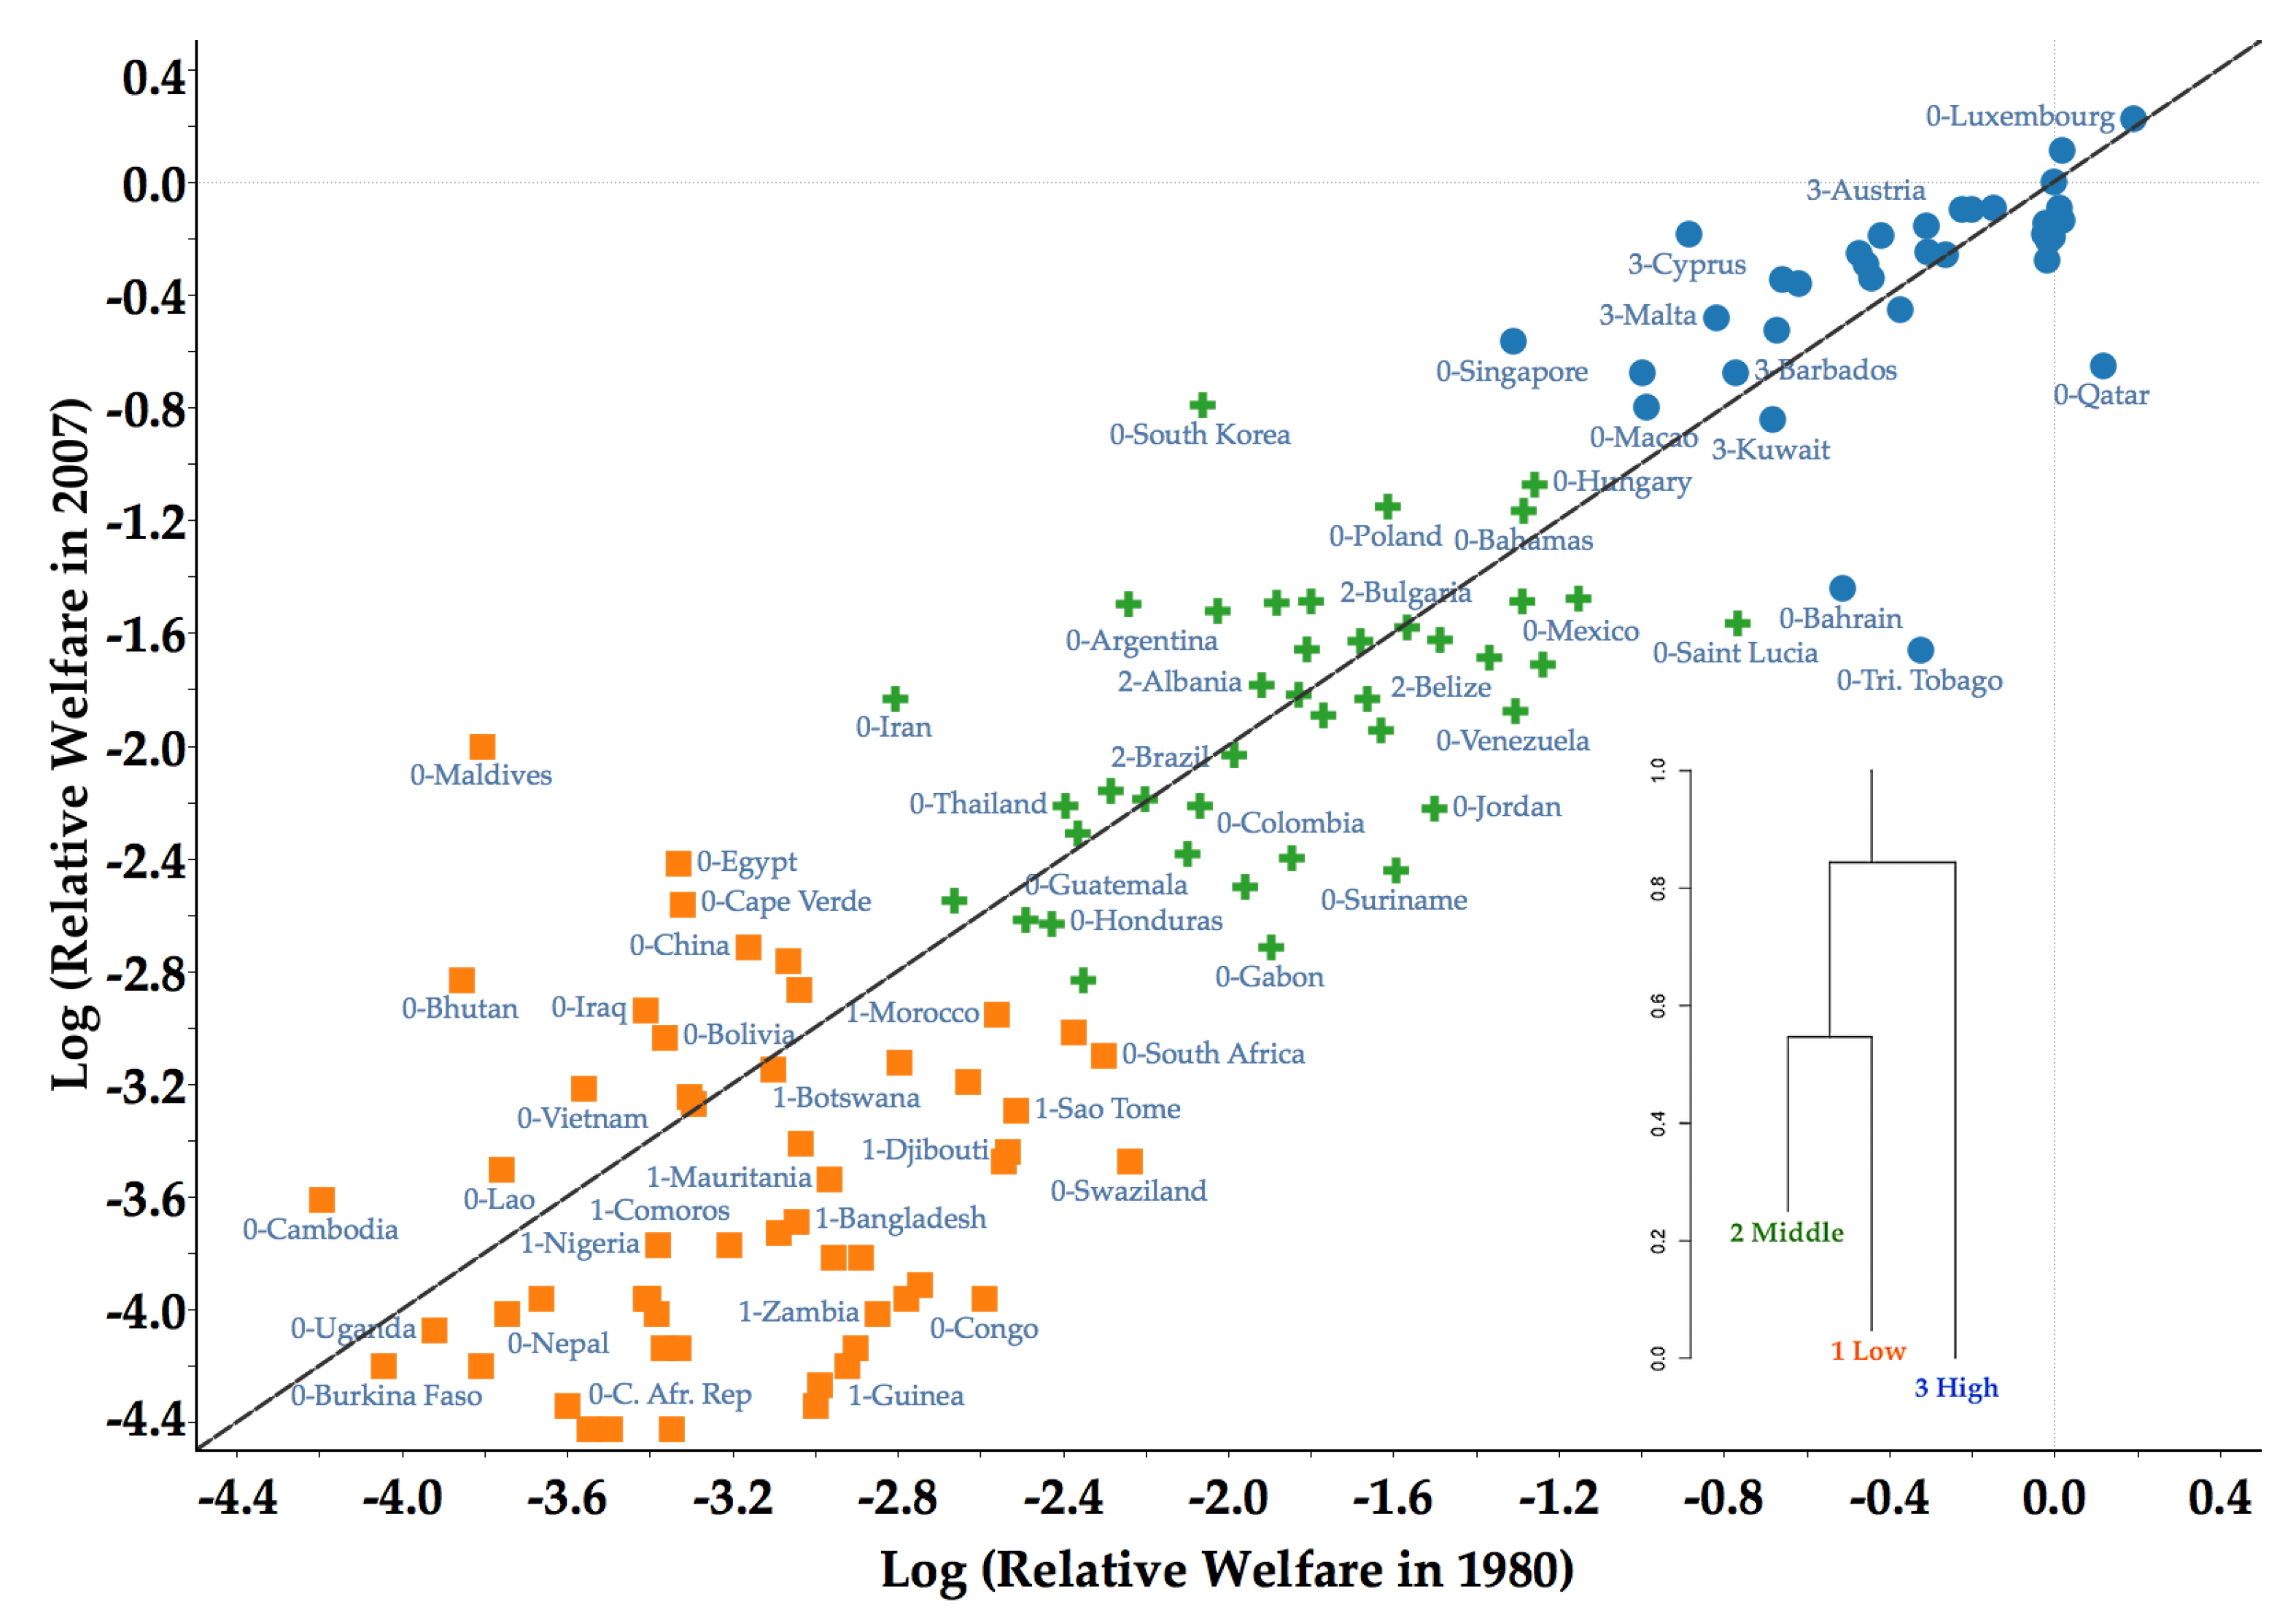
  • The variable under study (that is, national welfare) is expressed relative to a benchmark economy, which in the literature is usually the United States. The purpose of this normalization is to abstract from systematic forces that might simultaneously affect all countries.
  • To facilitate comparison and visualization, the natural logarithm of the relative variable is applied. The log of a relative variable can be interpreted as the proportional difference between a country and the benchmark country (i.e., the convergence frontier).
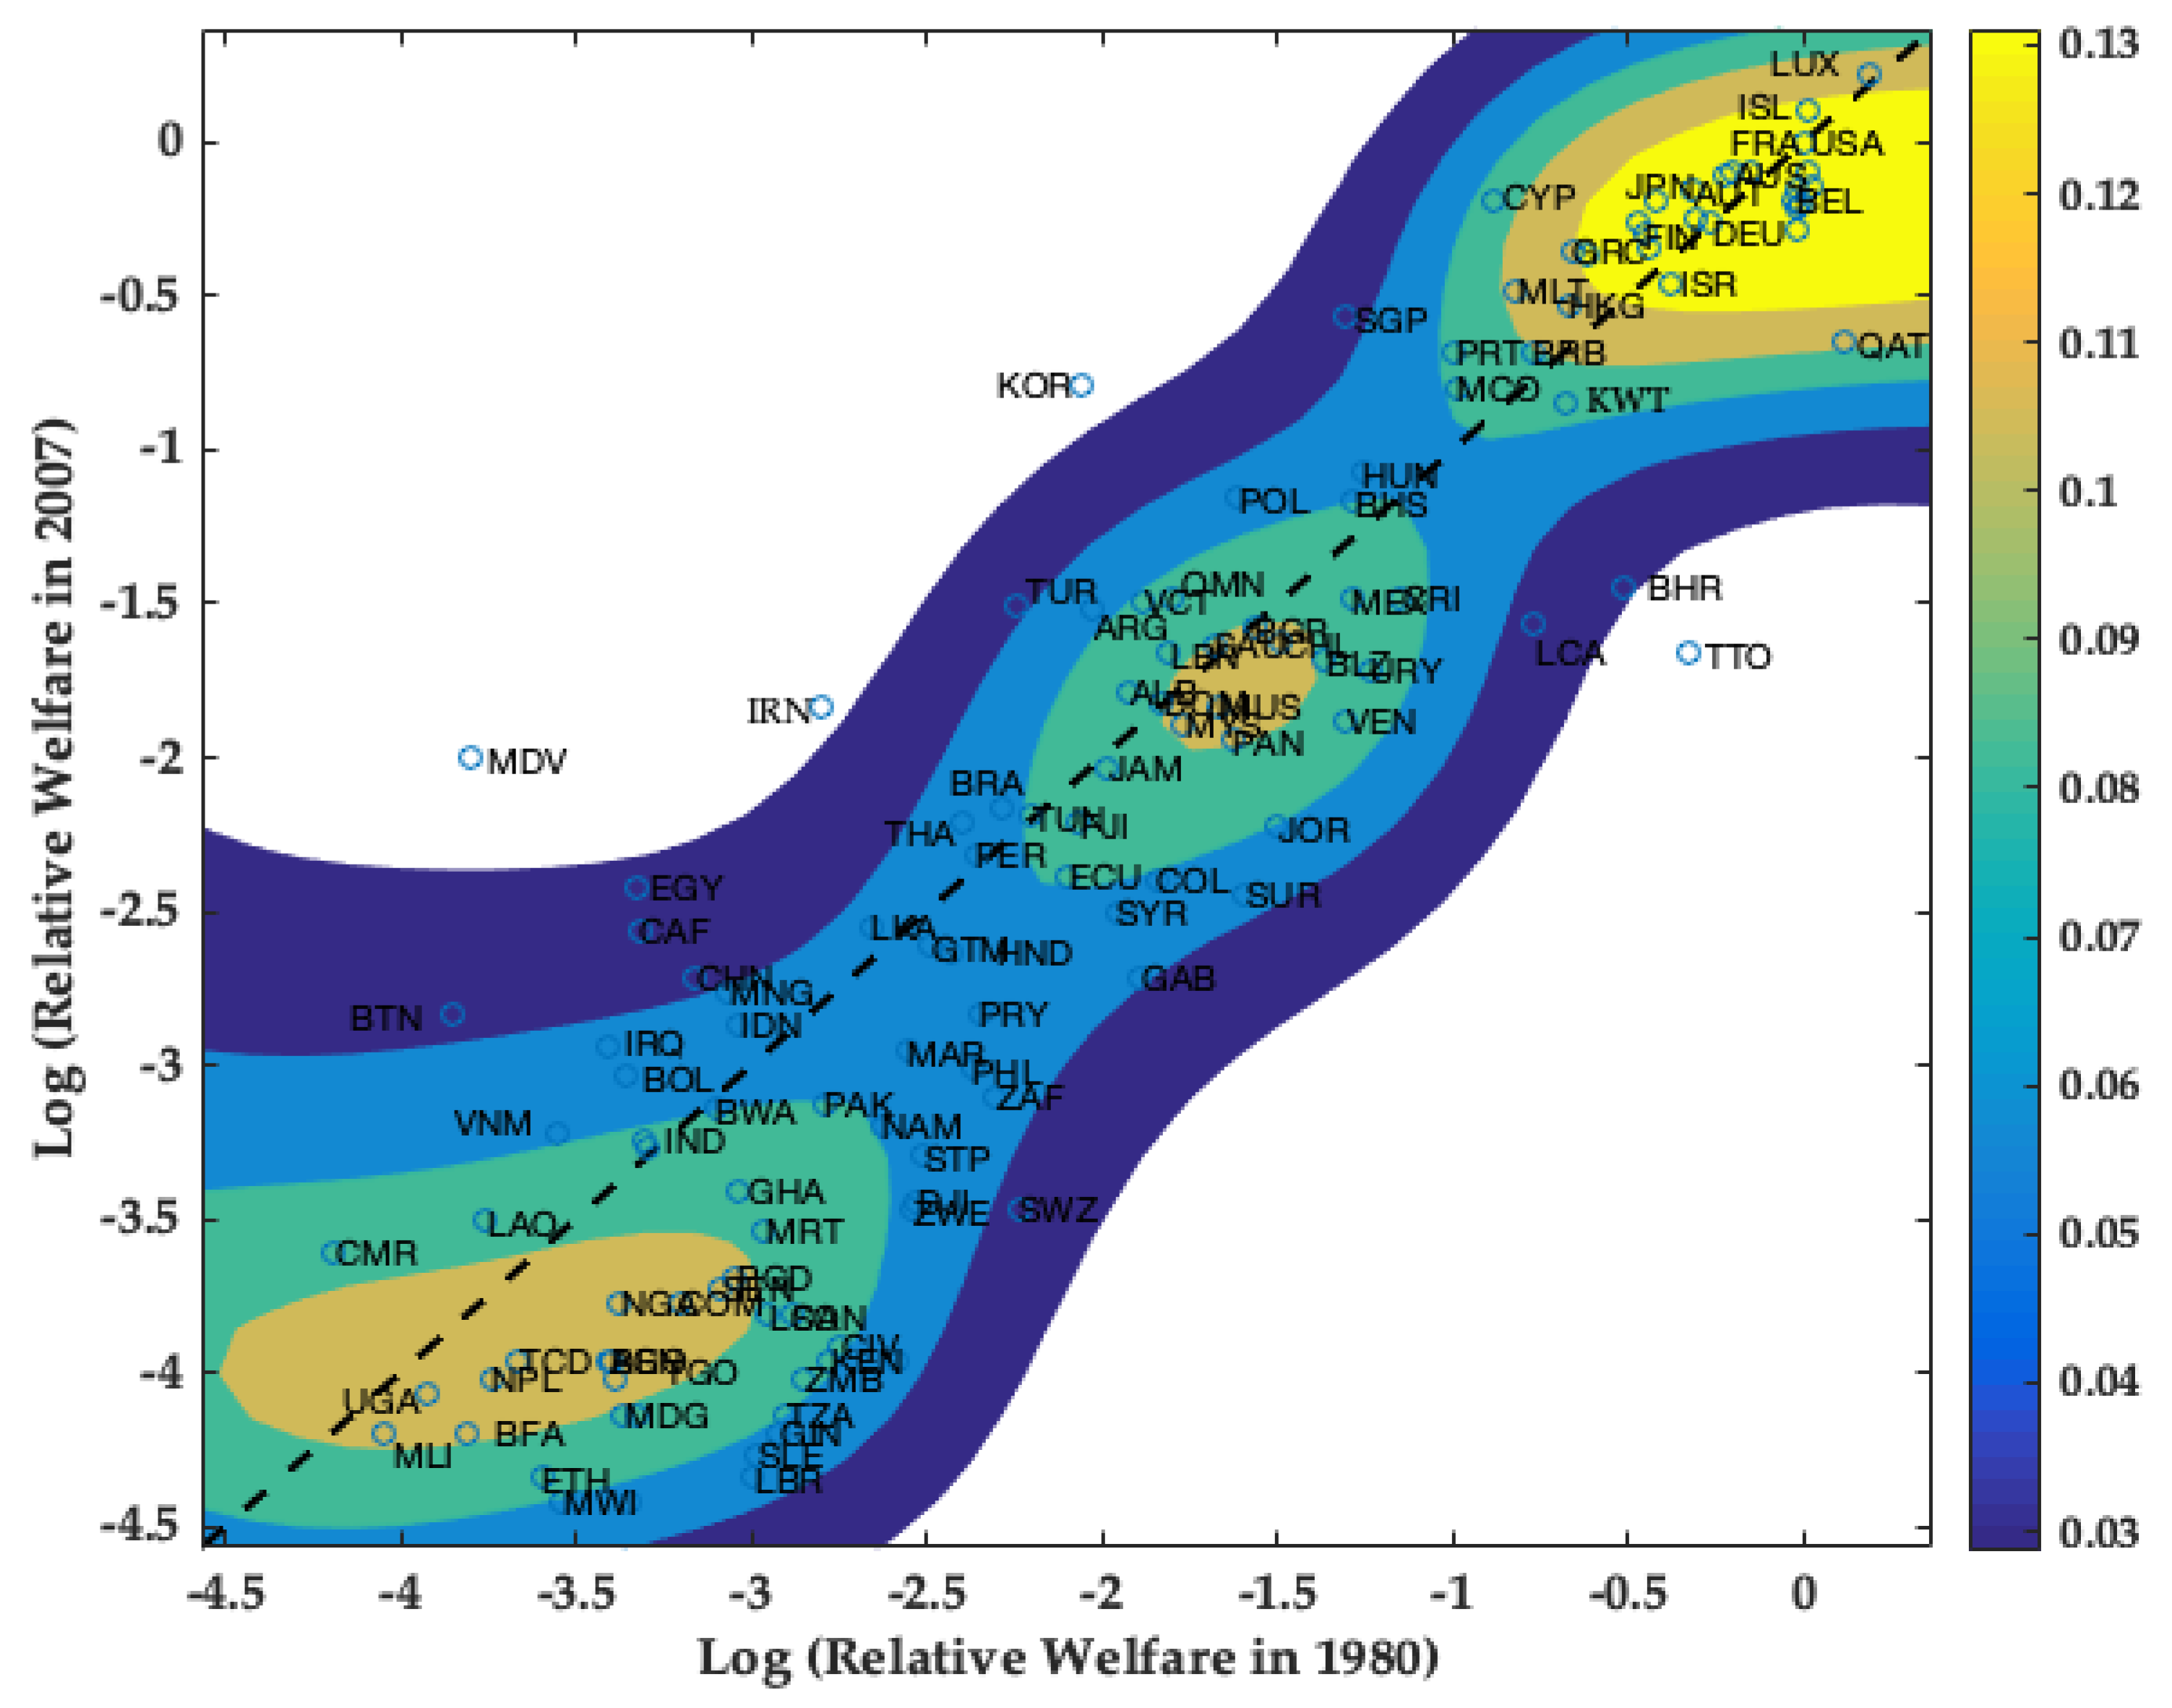
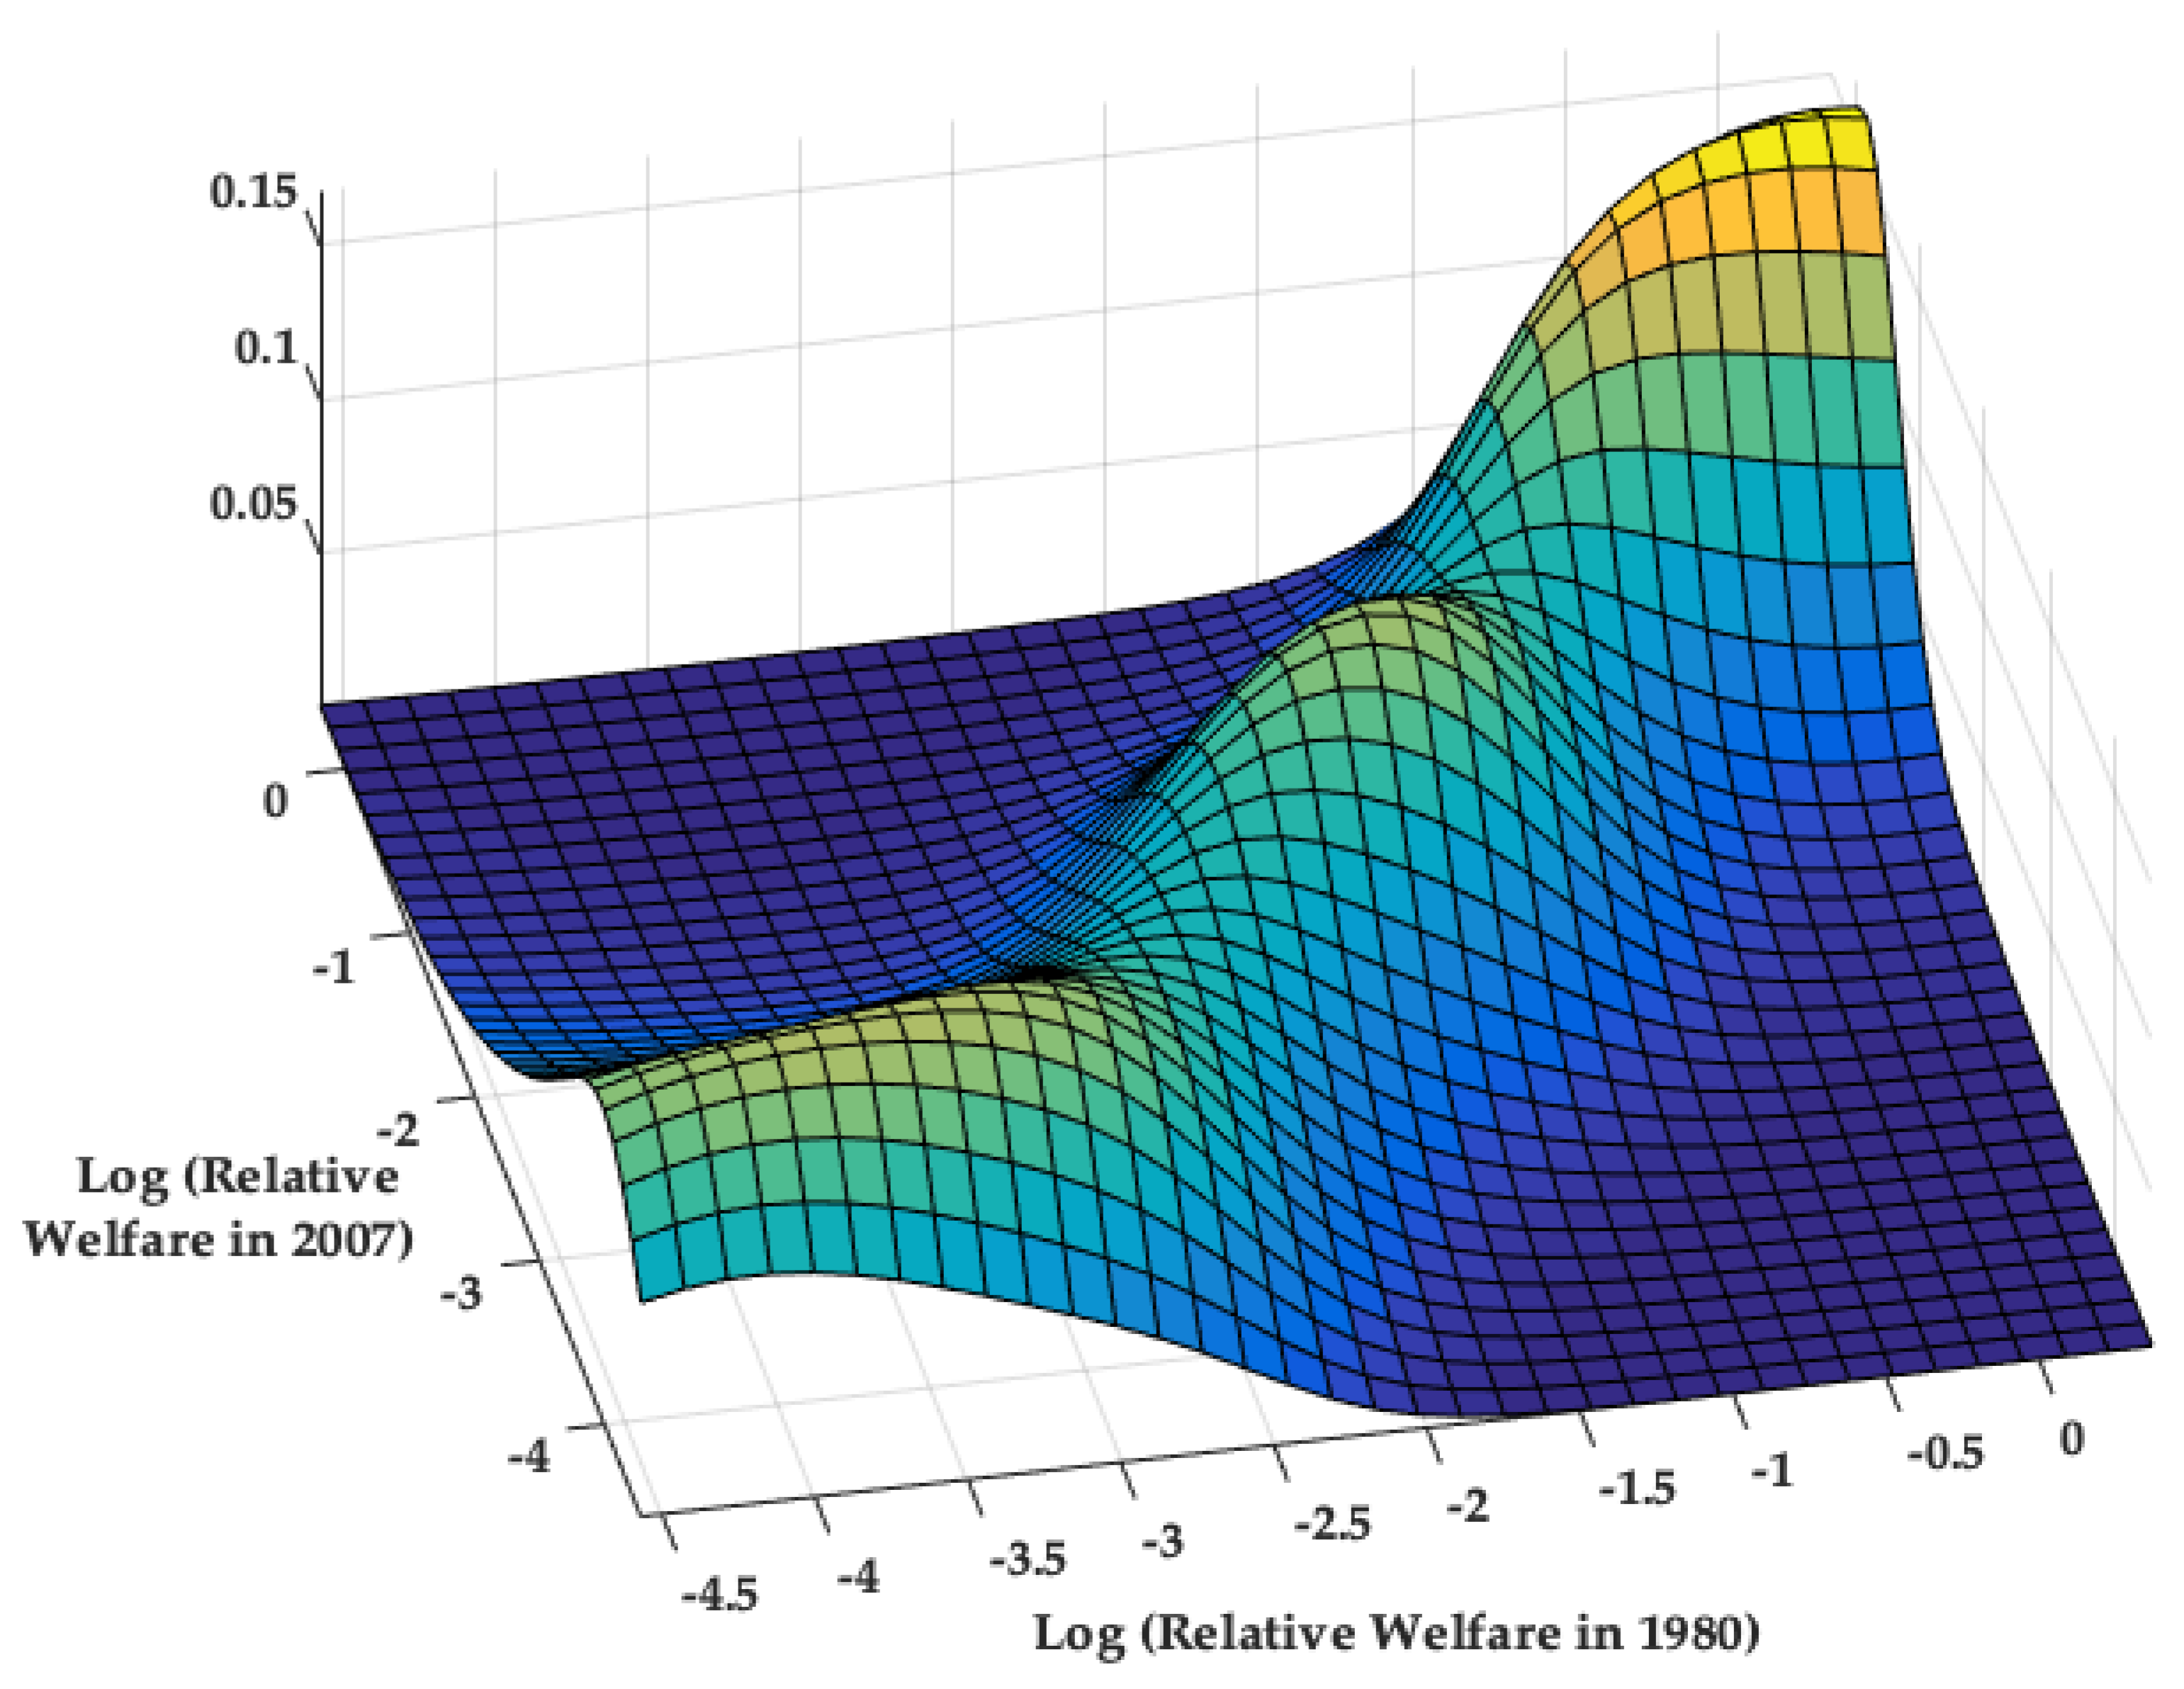
  • The stochastic kernel is a conditional distribution that is calculated as follows:
    G ( y t + s y t ) = f t + s , t ( y t + s , y t ) f t ( y t ) ,
    where f t ( · ) is the univariate kernel distribution of relative welfare in the initial year, t, and f t + s , t ( · ) is the (inter-temporal) bivariate kernel distribution between the years.
  • The bivariate kernel distribution is estimated as follows:
    f t + s , t ( y t + s , y t ) = 1 n h t + s h t i = 1 n K t + s y t + s y t + s , i h t + s K t y t y i h t ,
    where y t + s and y t denote the relative welfare of each country at time t + s and t, respectively, K t + s and K t denote kernel functions, and h t + s and h t denote the smoothing parameters of y t + s and y t , respectively. Following the convention of the literature, the kernel functions adopt a Gaussian form, and the smoothing parameters are selected based on the minimization of the Asymptotic Mean Integrated Square Error (Magrini 2009).
The stochastic kernel is a tree-dimensional object that is commonly represented by a surface plot or a contour plot. If most countries are concentrated around the main diagonal of these graphs, then there is evidence of distributional persistence over time. Global distributional convergence is found when most of the countries are located around zero in the the ( t + s ) -axis and parallel to the t-axis.
Finally, the distribution-based clustering algorithm developed by Azzalini and Menardi (2014a) is applied with the previously-described kernel functions and smoothing parameters. The implementation of this new clustering framework is useful for two purposes. First, it helps us identify the location of each country within the distribution. Second, it helps us allocate each country to its nearest convergence club.

3. Some Stylized Facts

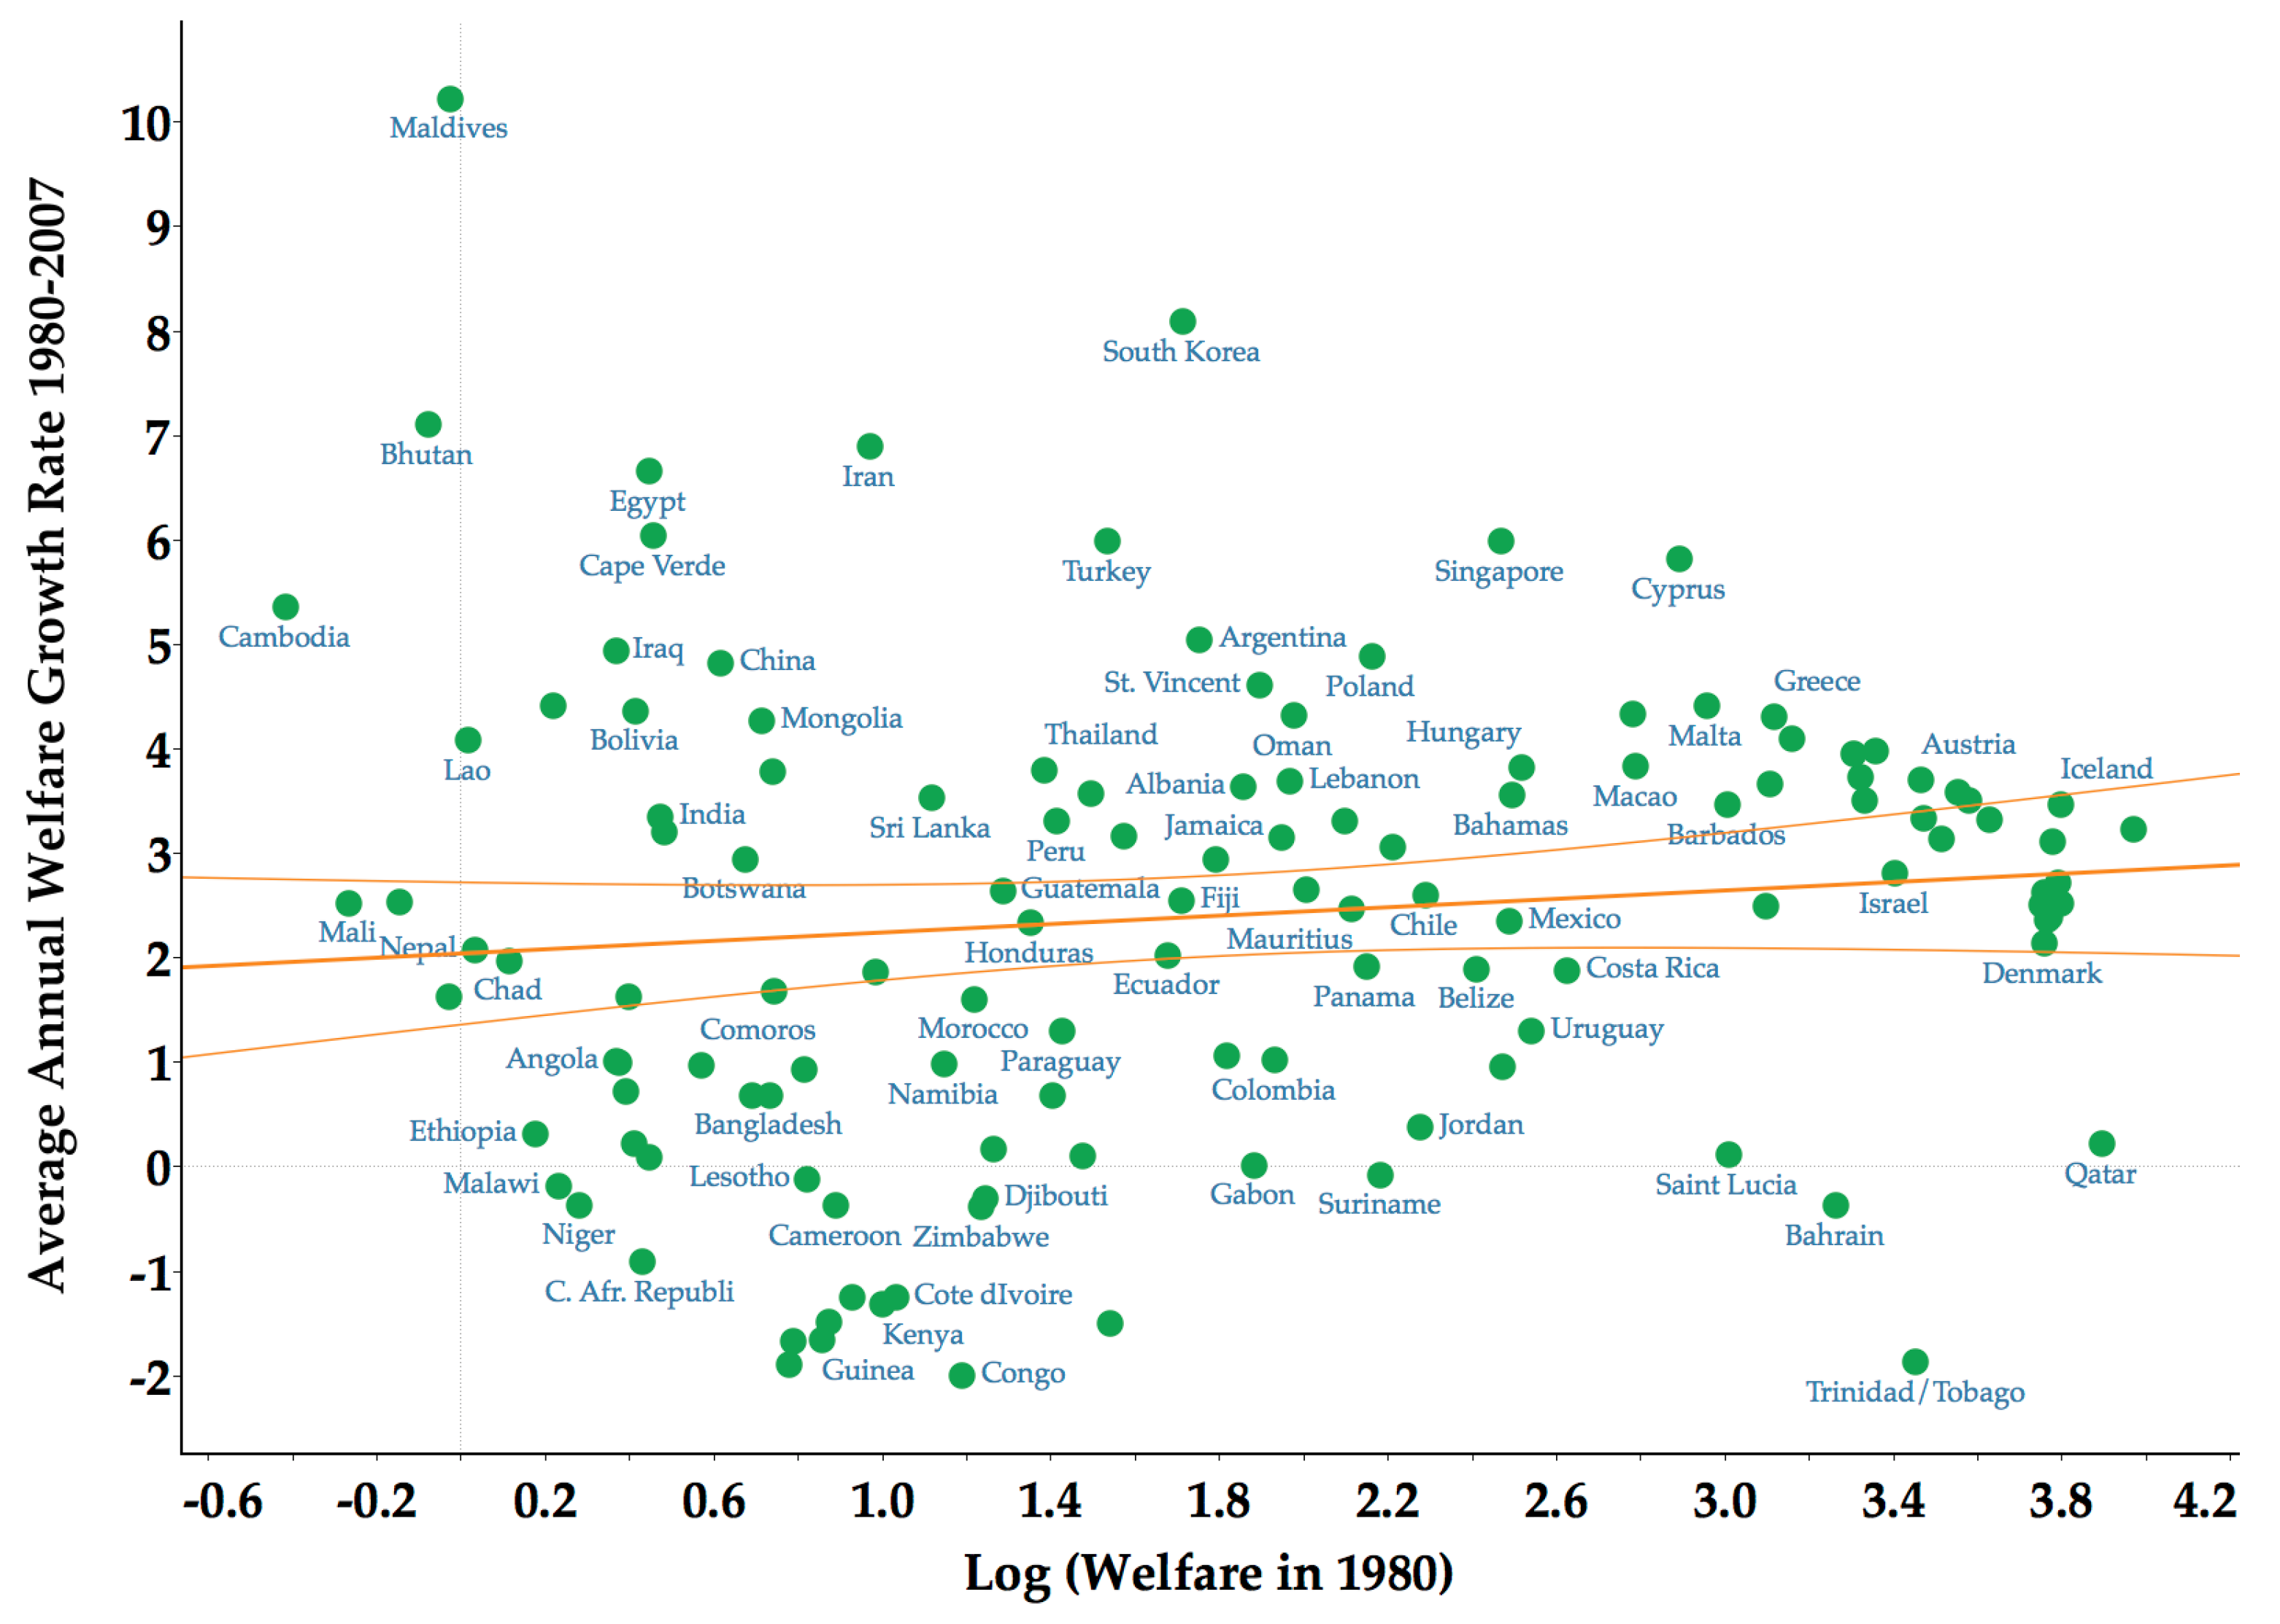
3.1. Lack of Sigma and Beta Convergence

The classical analysis of convergence shows that, similar to patterns of GDP per capita documented by Barro and Sala-i Martin (1992), welfare differences across countries are characterized by a lack of both sigma and beta convergence. Figure 1 and Figure 2 summarize this finding. Figure 1 shows that, although the distribution has shifted to the right, the cross-country dispersion of welfare has increased between 1980 and 2007. As such, this result highlights the lack of sigma convergence in the context of welfare differences across countries.
More specifically, the standard deviation of the cross-country welfare distribution in the year 1980 was 1.22. By the year 2007, this dispersion increased to 1.41. This higher degree of cross-country inequality in welfare is also observable in the increasing distance between the third quartile and the first quartile of the boxplot presented in Figure 1.
Figure 2 shows that, on average, welfare-poor countries are not growing faster than welfare-rich countries. As such, this result indicates a lack of beta convergence. Note also that, if anything, the positive (but not significant) slope of the regression line would suggest that welfare-rich countries are growing faster than welfare-poor countries, and thus contributing to the increasing dispersion reported in Figure 1. Finally, it also worth noting that the triangular shape of the scatter plot is highly similar to that reported in the studies that document a lack of beta convergence in income (Barro and Sala-i Martin 1992; Sala-i Martin 1996).

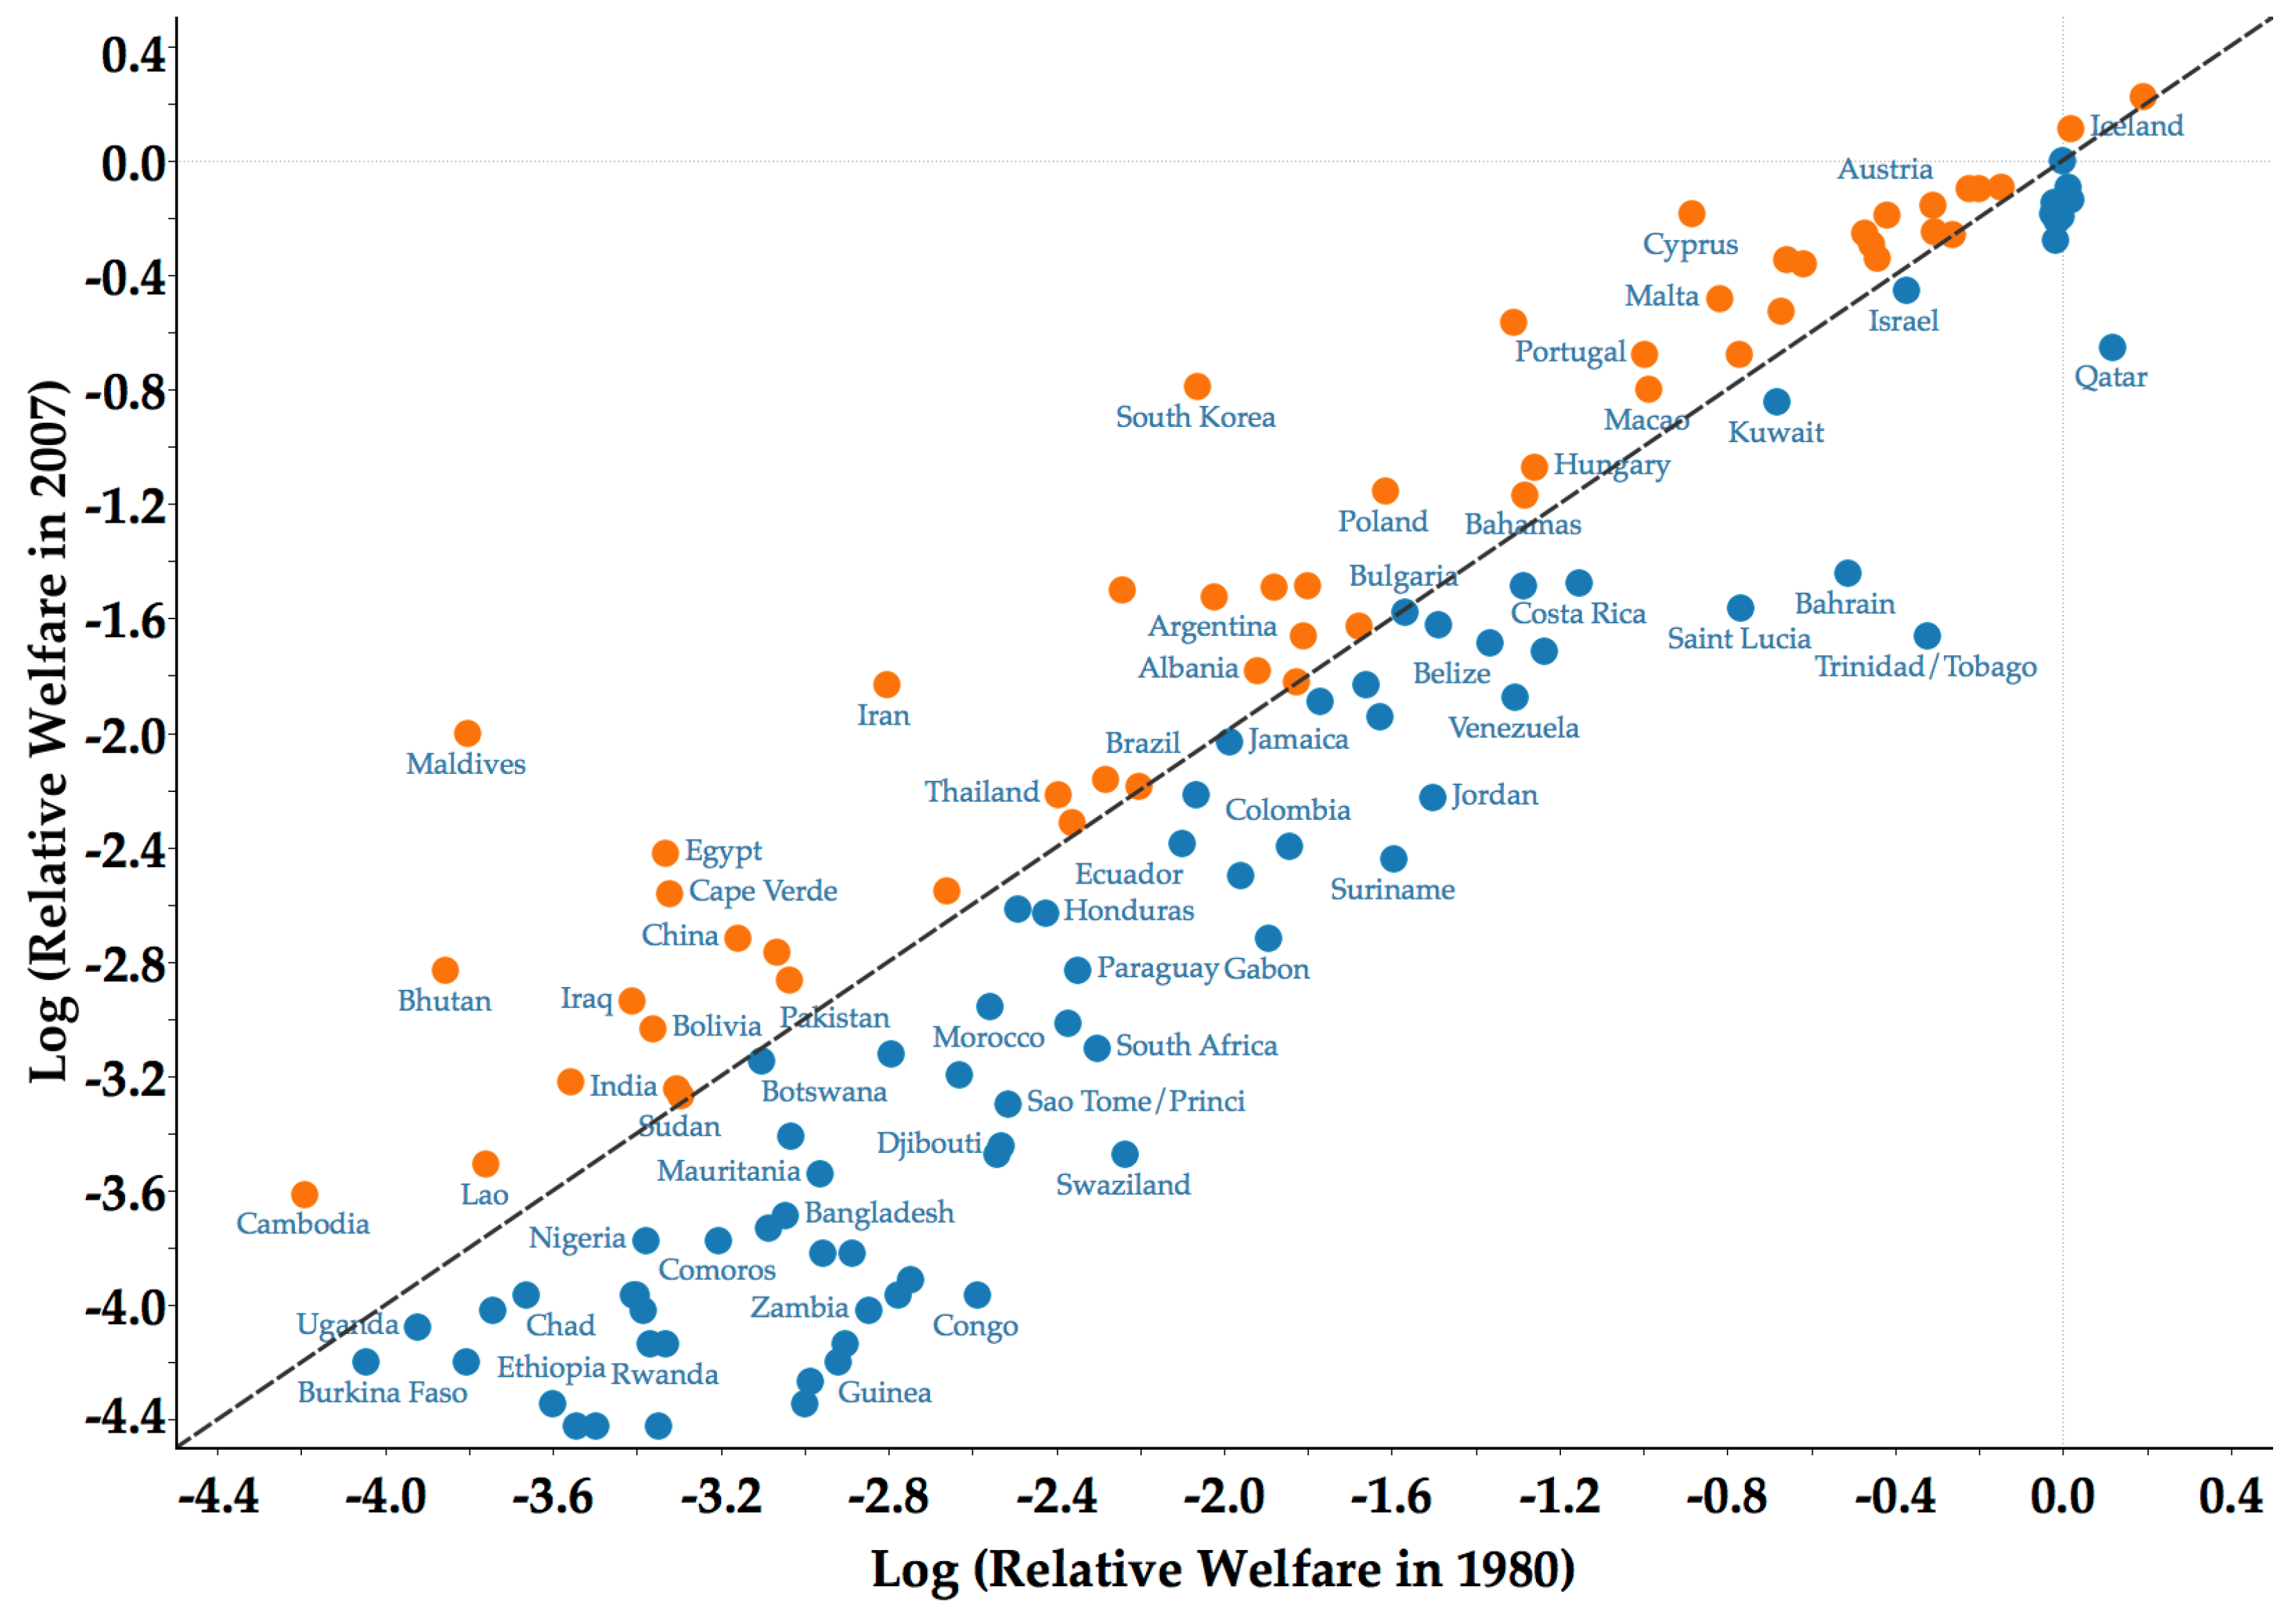
3.2. Limited Forward and Backward Mobility

Figure 3 highlights the fact that there is a limited degree of forward and backward mobility across countries. The measurement of country mobility here is relative to that experienced by the frontier, which in this case is the United States. Thus, the lack of relative mobility does not imply the lack of progress in absolute terms. In Figure 3, most countries are located around the 45-degree line. Indeed, the relation between the initial and the final level of welfare is summarized by a linear regression in which the coefficient of the slope is statistically equal to one. The 95% confidence interval for this slope coefficient is between 0.97 and 1.14. Moreover, the R-squared of this regression highlights that 83 percent of the cross-country welfare variation of the year 2007 is explained by the welfare variation of the year 1980.
Another interesting mobility fact is that 76 out the 128 countries in the sample (that is, almost 60 percent of the total sample) are moving backwards. In other words, relative to its initial position in 1980, 60 percent of the countries ended up with lower relative welfare in 2007. This backward mobility is more pronounced in the poorest countries in the sample. Finally, both the limited degree country mobility and the overall lack of cross-country convergence suggest the possible existence of local convergence clubs. The results associated with this hypothesis are presented in the next section.

4. Results

4.1. Transitional Dynamics via the Stochastic Kernel Distribution

Figure 4 shows the 3D surface of the stochastic kernel distribution. The transitional dynamics between 1980 and 2007 were characterized by three density modes along the main diagonal. In this convergence framework, the lack of country mobility and the emergence of multiple basins of attraction (that is, multiple density modes) in the main diagonal are typically interpreted as suggestive evidence of convergence clubs. In this case, given the existence of three modes, then three different convergence clubs are likely to be present. Interestingly, these tree convergence clubs in welfare are qualitatively similar to the three convergence clubs in income reported in Pittau et al. (2016). Although the number of clubs is the same, the methodology of Pittau et al. (2016) is based on a finite Gaussian mixture model, which is a semi-parametric distributional alternative to the non-parametric distribution framework implemented in the current paper.
Figure 5 shows the contour plot representation stochastic kernel overlapped with the scatter plot of the countries of Figure 3. It provides a rough overview of the country composition of each convergence club. From the figure, it is clear that some countries were located at the center-core of each club, while the position of other countries raises some doubts about their club membership. In particular, there seemed to be a considerable number of countries between the bottom club and the middle club. For this sub-sample, some countries were moving forward and transitioning towards a superior club. In contrast, other countries were moving backward and transitioning towards an inferior club. To help clarify the membership of these kind of countries, the novel distribution-based clustering algorithm of Azzalini and Menardi (2014a) is implemented in the next subsection.

4.2. Core Clusters and Classification of Countries

In a series of papers, Azzalini and Torelli (2007) and Azzalini and Menardi (2014a,2014b) used the modes of a non-parametric distribution as a criterion for identifying clusters. High-density observations group themselves in what Azzalini and Menardi call “cores clusters”. Low-density observations, on the other hand, could be allocated to a proximate cluster based on a Delaunay triangulation.
Figure 6 shows the results of this approach in the context of the mobility scatter plot of Figure 3. Consistent with the stochastic kernel of Figure 4 and Figure 5, three clusters or clubs were identified. The main advantage of this clustering framework is the endogenous identification of core club members (those with a “1”, “2”, or “3” prefix). In addition, low-density observations (i.e., those with a “0” prefix) were also identified and allocated to their more proximate core club.7 In this low-density context, countries such as the Maldives or South Korea are interesting cases to be studied. Although both countries experienced forward mobility (catching up behavior), their progress has not been classified as that of a “core” member of the immediately superior club. In these cases, the clustering classification was still informative in the sense that it was also clear that these kinds of countries did not belong to their immediately inferior “core” club either.
Finally, the bottom right of Figure 6 includes a cluster tree. It is meant to provide a measure of the robustness of the clubs to different density thresholds. Although for a considerably large set of density thresholds, three clubs were identifiable, it is also possible that the countries of Club 1 and Club 2 could be converging to a similar steady state. Even in this case, the cross-country distribution of welfare is likely to be characterized by more than one convergence club.

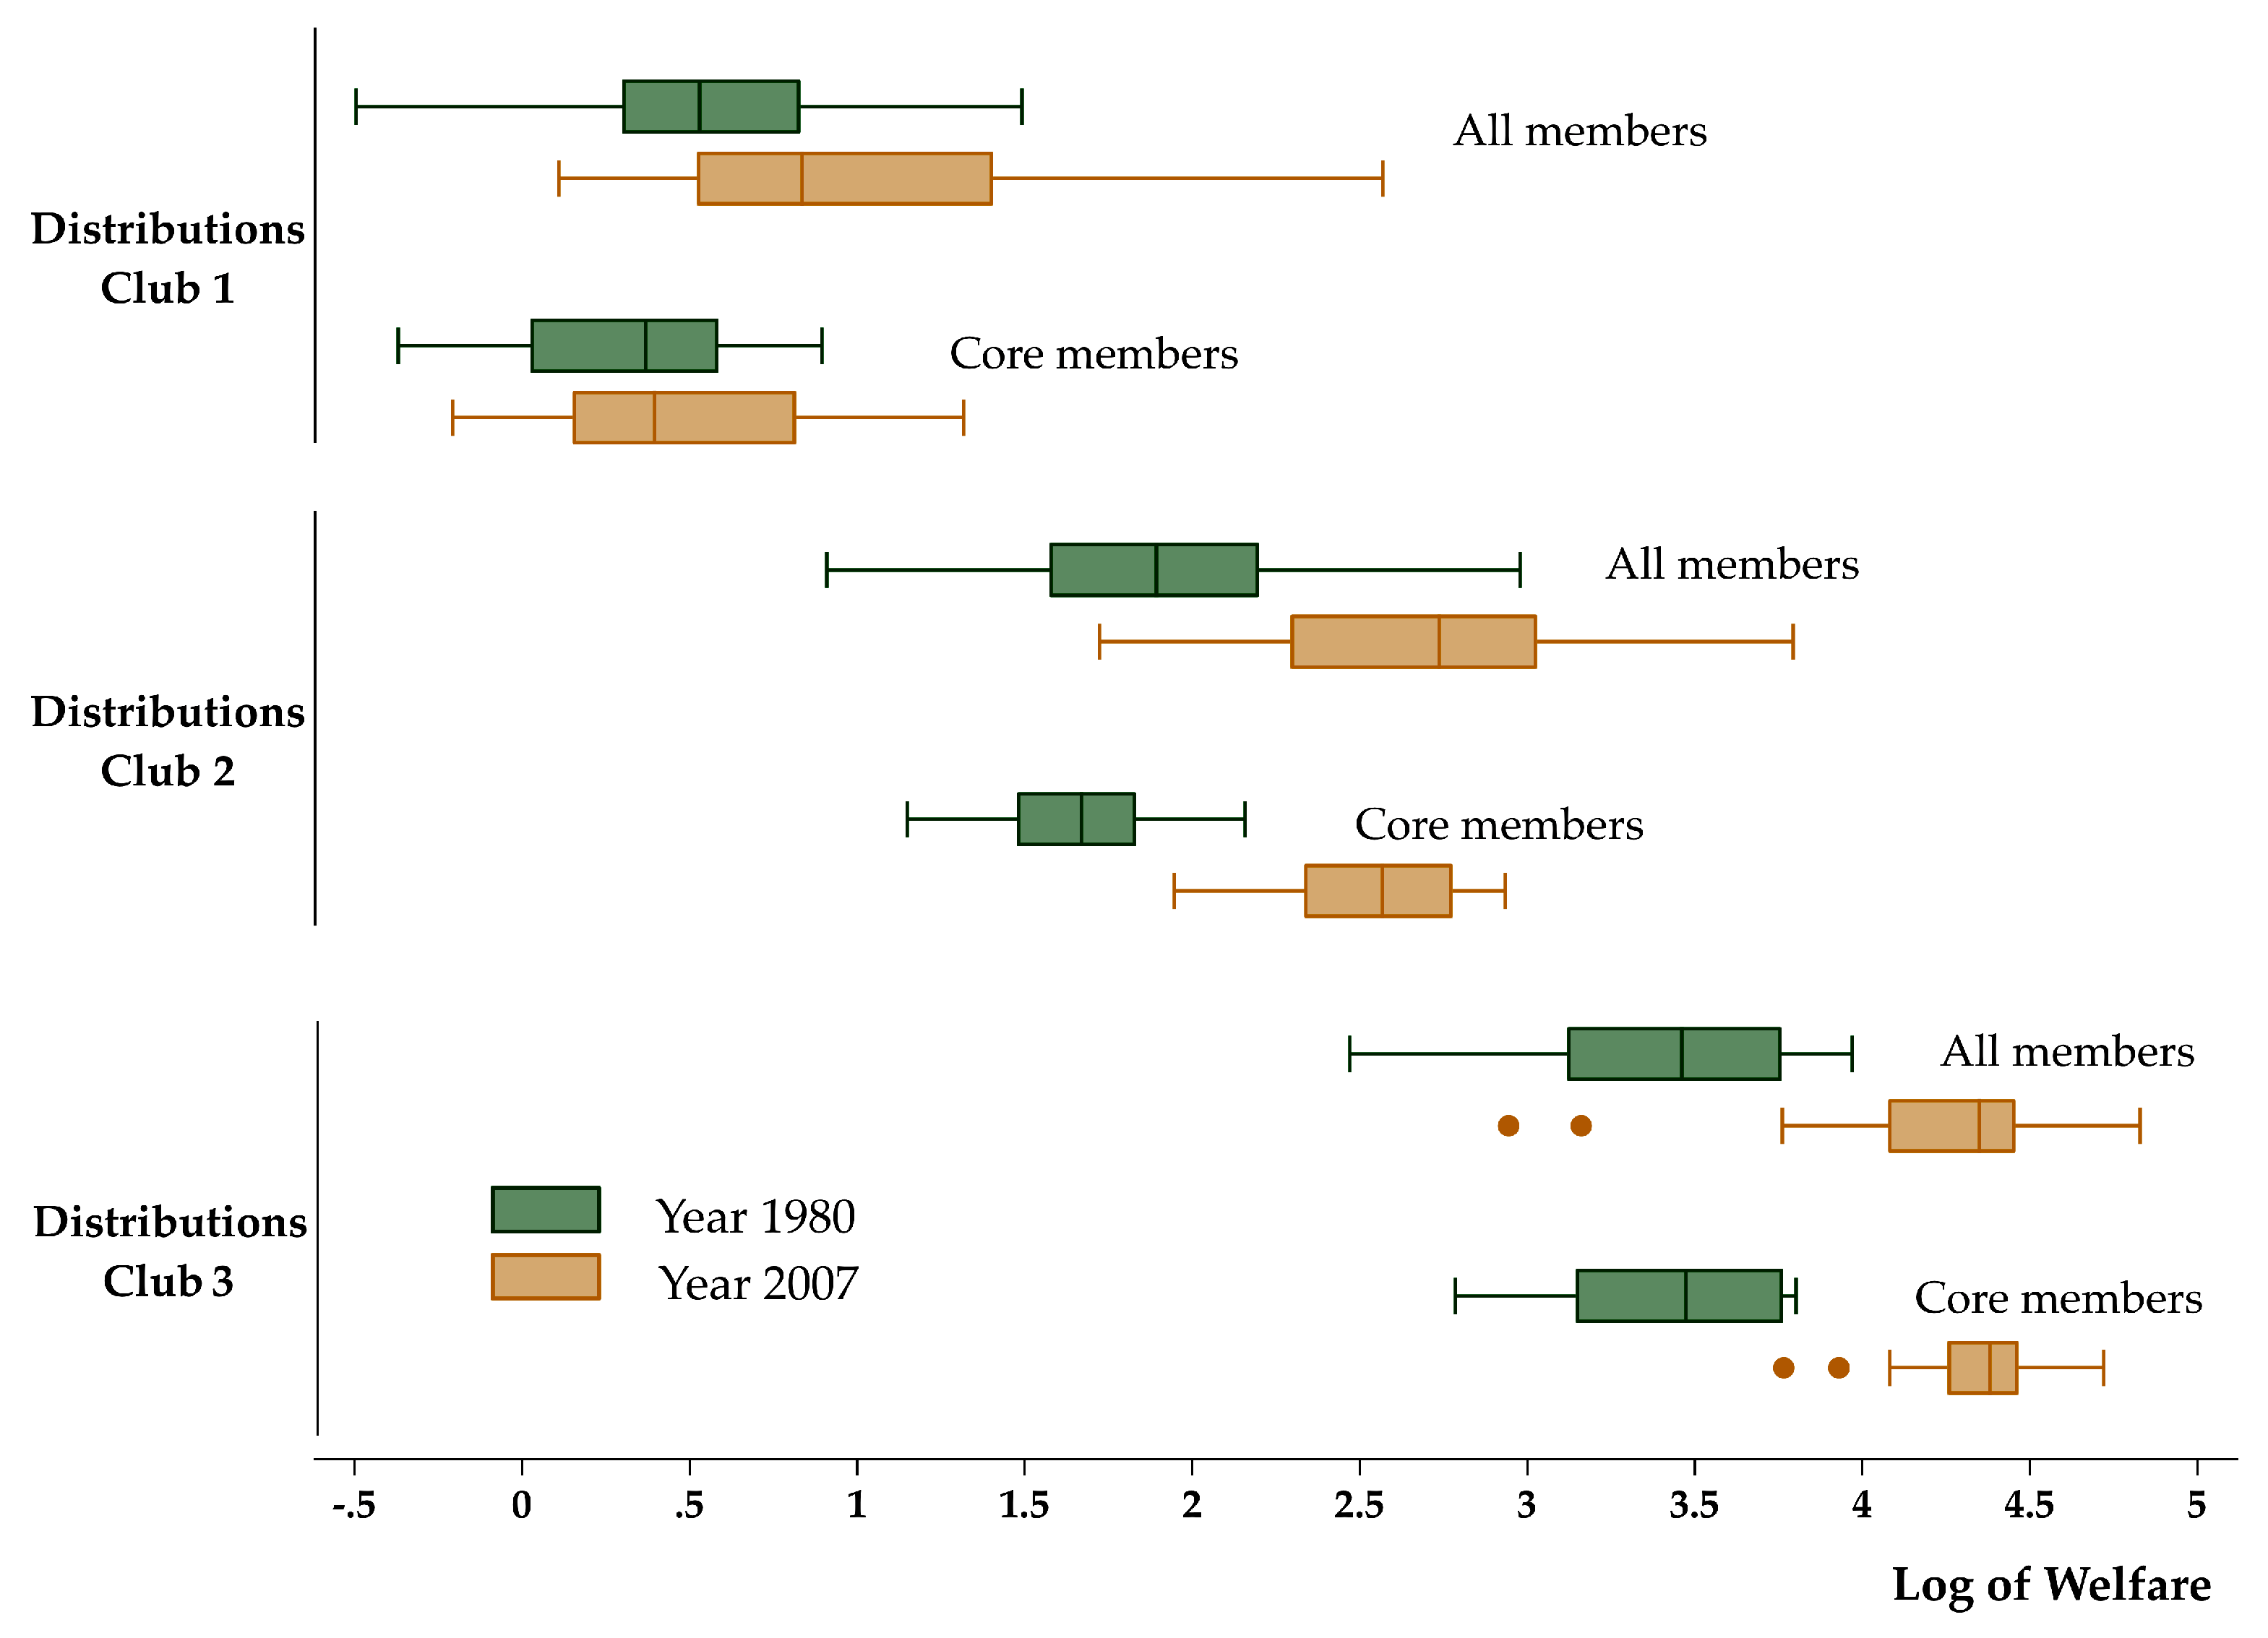
4.3. Sigma and Beta Convergence within Clubs

Figure 7 and Table 1 present a re-evaluation of the sigma convergence test for each of the previously-identified clubs. Sigma convergence was only present for the core members of the high-welfare club. In other words, only the core members of Club 3 were increasingly becoming more similar in terms of their level of national welfare. For these 28 country members, the standard deviation of the log of welfare was 0.35 in 1980, and by the year 2007, it reduced to 0.21. Moreover, as indicated by the p-value of the ANOVA test, this reduction in the cross-sectional dispersion was statistically significant. For the other country clubs, however, the cross-sectional dispersion increased in spite of the absolute improvements in the average and medium levels of welfare. It also worth noting that the countries in the poorest welfare club showed the largest increase in dispersion.
Figure 8 and Table 2 present a re-evaluation of the beta convergence analysis for each of the previously-identified clubs. In contrast to the sigma result, significant beta convergence was found for all clubs. This results means that, within each group, welfare-poor countries tended to grow faster than the welfare-rich countries. Thus, in the absence of random shocks, there was a tendency toward catching up within each convergence cluster.
However, as explained in Quah (1993) and Sala-i Martin (1996), beta convergence by itself is not a sufficient condition for reducing cross-country dispersion (that is, sigma convergence). This phenomenon is consistent with the results shown in Figure 7, where cross-country dispersion within Clubs 1 and 2 increased in spite of their beta convergence results. A final point worth noting is that countries in the poorest welfare club showed the fastest speed of beta convergence (6.46 percent; see Table 2 for details). In this case, however, it is important not to forget that the steady-state equilibrium to which these countries appear to be converging is lower than those of Clubs 2 and 3.

5. Discussion

To contextualize the results of the previous section with some recent findings in the convergence literature, it is important to discriminate between two types of cluster analyses. Some classical studies evaluate the formation of clusters in a static setting (see, for instance, the seminal work of Berlage and Terweduwe (1988)). More recent studies, however, have moved to a more dynamic (panel-data based) setting Battisti and Parmeter (2012, 2013). Static-setting studies tend to evaluate multiple variables at one point in time. For instance, the work of Berlage and Terweduwe (1988) evaluated 20 socioeconomic variables (including GDP) and found that the world can be partitioned into nine clusters. Dynamic-setting studies, however, tend to evaluate single or a few variables over time. For instance, most studies focused on the clustering of GDP per capita. In this context, the work of Battisti and Parmeter (2012) found that the world can be partitioned into three clusters.
The results of the current paper are based on a dynamic-setting clustering framework; and although Battisti and Parmeter (2012) focused on the clustering dynamics of GDP per capita, their clustering framework was relatively similar.8 Furthermore, to ensure an additional level of comparability, one must note that the correlation between the welfare index presented in the current paper and GDP per capita is 0.95. Thus, at least from this perspective, the number of clusters identified in the current paper was equal to that in Battisti and Parmeter (2012). There are some noticeable differences, however, in the composition of the clusters. Compared to the high-GDP cluster, there are more European countries in the high-welfare cluster. As noted by Jones and Klenow (2016), the reason for this difference could be that, when compared to the United States (the benchmark country), European countries have a longer life expectancy, additional leisure, and lower inequality. Furthermore, compared to the low-GDP cluster, there are more developing countries in the low-welfare cluster. Similarly, the work in Jones and Klenow (2016) argued that, relative to GPD (and to the benchmark country), a decrease in the welfare ranking of most developing countries is expected given their relatively higher mortality, lower consumption, and higher inequality.
The previous findings point to some promising directions for further research. First, convergence clubs could be identified not only through the lens of a stochastic kernel, but also through an ergodic distribution. In fact, these two approaches are complementary, and together, they provide a more complete characterization of a dynamic system. On the one hand, the stochastic kernel provides a description of transitional dynamics; on the other, the ergodic distribution provides a description of the long-run equilibrium of the system. It would be interesting to know whether the three identified transitional clubs are still observable in a long-run equilibrium. Second, to further test the robustness of the clubs, an alternative convergence-club framework could be used. A close alternative could be the estimation of a finite Gaussian mixture density. In this semi-parametric framework, each component of the mixture can be interpreted as a convergence club. Third, it would be interesting to evaluate the role of geographic neighbors in the formation of clusters. For instance, one could evaluate to what extent the three clusters persist across continents. Finally, an analysis of each component of the welfare index could be useful for identifying the sources of convergence. The identification of the factors driving the formation of welfare clusters is a necessary extension that could provide valuable insights in the design of welfare-enhancing policies.

6. Concluding Remarks

A central topic in long-run macroeconomics is the study of the cross-country convergence hypothesis. This paper tested this hypothesis in a context beyond GDP and through the lens of an unsupervised machine learning algorithm. The novel welfare index of Jones and Klenow (2016) was used as a proxy for the measurement of living standards across countries. From a conceptual standpoint, this welfare index aggregates, in a theoretically-consistent way, measures of consumption (private and public), leisure, life expectancy, and inequality for a sample of 128 countries over the 1980–2007 period. From a methodological standpoint, this paper started with the evaluation of classical summary measures of convergence, such as sigma and beta convergence (Barro and Sala-i Martin 1992). Next, it applied the non-parametric distributional convergence approach of (Quah 1997). Finally, it extended this distributional framework by integrating the recent distribution-based clustering algorithm of Azzalini and Menardi (2014a).
The classical analysis of convergence showed that welfare differences across countries are characterized by a lack of both global sigma and global beta convergence. The distributional convergence analysis showed that welfare differences appeared to be characterized by multiple local convergence clubs. In particular, the three modes of the estimated stochastic kernel distribution and the related cluster analysis suggested the existence of three convergence clubs. Under this classification, beta convergence was recovered for each club; moreover, convergence within the poorest club showed the fastest convergence rate. In terms of sigma convergence, however, only the core members of the richest club appeared to be reducing their welfare differences. Overall, these results highlighted a central finding of the long-run macroeconomics literature: beta convergence is necessary, but not sufficient for sigma convergence, even within convergence clubs and in a context beyond GDP.

Funding

This research project was supported by JSPS KAKENHI Grant Number 19K13669.

Acknowledgments

A previous version of this paper was circulated under the title “Convergence Clubs Beyond GDP: A Non-Parametric Distributional Approach”. For further reference, see Mendez (2017).

Conflicts of Interest

The authors declare no conflict of interest.

Appendix A

Table A1. List of countries and clubs.
IDNameISO CodeClubsCore ClubRelative Welfare in 1980Relative Welfare in 2007
1LuxembourgLUXHighNA52.98125
2IcelandISLHighHigh44.59111.7
3United StatesUSAHighHigh43.74100
4SwedenSWEHighHigh44.391.2
5FranceFRAHighHigh37.7291.1
6AustraliaAUSHighHigh35.8390.7
7United KingdomGBRHighHigh34.9790.4
8SwitzerlandCHEHighHigh44.687.1
9The NetherlandsNLDHighHigh42.8886.2
10AustriaAUTHighHigh32.0685.5
11BelgiumBELHighHigh42.6183
12CyprusCYPHighHigh18.0783
13JapanJPNHighHigh28.882.6
14CanadaCPVHighHigh43.582.3
15NorwayNORHighHigh43.1581
16ItalyITAHighHigh32.2178
17SpainESPHighHigh27.2677.6
18GermanyDEUHighHigh33.6377.3
19DenmarkDNKHighHigh42.9175.8
20FinlandFINHighHigh27.7574.4
21New ZealandNZLHighHigh28.0571
22GreeceGRCHighHigh22.6270.5
23IrelandIRLHighHigh23.5869.6
24IsraelISRHighHigh30.0863.4
25MaltaMLTHighHigh19.2761.8
26Hong KongHKGHighHigh22.3559
27SingaporeSGPHighNA11.8256.7
28QatarQATHighNA49.2352.1
29BarbadosBRBHighHigh20.2450.7
30PortugalPRTHighHigh16.1450.7
31South KoreaKORMiddleNA5.5645.3
32MacaoMCOHighNA16.2844.9
33KuwaitKWTHighHigh22.1343
34HungaryHUNMiddleNA12.4334.2
35PolandPOLMiddleNA8.731.5
36BahamasBHSMiddleNA12.1331.1
37BahrainBHRHighNA26.1623.6
38Costa RicaCRIMiddleNA13.8322.8
39MexicoMEXMiddleNA12.0722.6
40OmanOMNMiddleMiddle7.2322.6
41St. VincentVCTMiddleMiddle6.6622.5
42TurkeyTURMiddleNA4.6522.3
43ArgentinaARGMiddleNA5.7821.8
44Saint LuciaLCAMiddleNA20.2920.9
45BulgariaBGRMiddleMiddle9.1320.6
46ChileCHLMiddleMiddle9.8819.7
47Saudi ArabiaSAUMiddleMiddle8.1619.6
48Trinidad/TobagoTTOHighNA31.6319
49LebanonLBNMiddleMiddle7.1619
50BelizeBLZMiddleMiddle11.1618.5
51UruguayURYMiddleNA12.718
52AlbaniaALBMiddleMiddle6.4216.8
53Dominican Rep.DOMMiddleMiddle7.0316.2
54MauritiusMUSMiddleMiddle8.316
55IranIRNMiddleNA2.6516
56VenezuelaVENMiddleNA11.8515.3
57MalaysiaMYSMiddleMiddle7.4515.1
58PanamaPANMiddleMiddle8.5814.3
59MaldivesMDVLowNA0.9813.5
60JamaicaJAMMiddleMiddle6.0113.1
61BrazilBRAMiddleMiddle4.4611.5
62TunisiaTUNMiddleMiddle4.8411.2
63FijiFJIMiddleMiddle5.5410.9
64ThailandTHAMiddleNA3.9910.9
65JordanJORMiddleNA9.7510.8
66PeruPERMiddleNA4.129.9
67EcuadorECUMiddleMiddle5.369.2
68ColombiaCOLMiddleNA6.929.1
69EgyptEGYLowNA1.568.9
70SurinameSURMiddleNA8.898.7
71SyriaSYRMiddleNA6.178.2
72Sri LankaLKAMiddleNA3.067.8
73Cape VerdeCAFLowNA1.587.7
74GuatemalaGTMMiddleNA3.627.3
75HondurasHNDMiddleNA3.877.2
76GabonGABMiddleNA6.586.6
77ChinaCHNLowNA1.866.6
78MongoliaMNGLowNA2.046.3
79ParaguayPRYMiddleNA4.175.9
80BhutanBTNLowNA0.935.9
81IndonesiaIDNLowNA2.15.7
82IraqIRQLowNA1.455.3
83MoroccoMARLowLow3.395.2
84PhilippinesPHLLowNA4.084.9
85BoliviaBOLLowNA1.524.8
86South AfricaZAFLowNA4.384.5
87PakistanPAKLowLow2.684.4
88BotswanaBWALowLow1.974.3
89NamibiaNAMLowLow3.154.1
90VietnamVNMLowNA1.254
91IndiaINDLowLow1.613.9
92SudanSDNLowLow1.623.8
93Sao Tome/PrinciSTPLowLow3.543.7
94GhanaGHALowLow2.13.3
95DjiboutiDJILowLow3.483.2
96SwazilandSWZLowNA4.673.1
97ZimbabweZWELowLow3.443.1
98LaoLAOLowNA1.023
99MauritaniaMRTLowLow2.262.9
100CambodiaCMRLowNA0.662.7
101BangladeshBGDLowLow2.082.5
102SenegalSENLowLow22.4
103ComorosCOMLowLow1.772.3
104NigeriaNGALowLow1.492.3
105CameroonCANLowLow2.442.2
106LesothoLSOLowLow2.282.2
107Cote d’IvoireCIVLowLow2.812
108CongoCODLowNA3.291.9
109KenyaKENLowLow2.721.9
110BeninBENLowLow1.461.9
111AngolaAGOLowLow1.451.9
112ChadTCDLowLow1.121.9
113ZambiaZMBLowLow2.531.8
114TogoTGOLowLow1.481.8
115NepalNPLLowNA1.041.8
116UgandaUGALowNA0.871.7
117TanzaniaTZALowLow2.41.6
118RwandaRWALowLow1.571.6
119MadagascarMDGLowLow1.511.6
120GuineaGINLowLow2.361.5
121Burkina FasoBFALowNA0.971.5
122MaliMLILowNA0.771.5
123Sierra LeoneSLELowLow2.211.4
124LiberiaLBRLowLow2.181.3
125EthiopiaETHLowNA1.21.3
126C. Afr. RepublicKHMLowNA1.541.2
127NigerNERLowNA1.331.2
128MalawiMWILowNA1.261.2

References

  1. Athey, Susan. 2018. The impact of machine learning on economics. In The Economics of Artificial Intelligence: An Agenda. Chicago: University of Chicago Press. [Google Scholar]
  2. Athey, Susan, and Guido W. Imbens. 2019. Machine learning methods that economists should know about. Annual Review of Economics 11: 685–725. [Google Scholar] [CrossRef]
  3. Azzalini, Adelchi, and Giovanna Menardi. 2014a. An advancement in clustering via nonparametric density estimation. Statistics and Computing 24: 753–67. [Google Scholar]
  4. Azzalini, Adelchi, and Giovanna Menardi. 2014b. Clustering via nonparametric density estimation: The r package pdfcluster. Journal of Statistical Software 57: 1–26. [Google Scholar] [CrossRef]
  5. Azzalini, Adelchi, and Nicola Torelli. 2007. Clustering via nonparametric density estimation. Statistics and Computing 17: 71–80. [Google Scholar] [CrossRef] [Green Version]
  6. Barro, Robert J., and Xavier Sala-i Martin. 1992. Convergence. Journal of Political Economy 100: 223–51. [Google Scholar] [CrossRef]
  7. Battisti, Michele, and Christopher F. Parmeter. 2012. Gdp clustering: A reappraisal. Economics Letters 117: 837–40. [Google Scholar] [CrossRef]
  8. Battisti, Michele, and Christopher F. Parmeter. 2013. Clustering and polarization in the distribution of output: A multivariate perspective. Journal of Macroeconomics 35: 144–62. [Google Scholar] [CrossRef]
  9. Baumol, William J. 1986. Productivity growth, convergence, and welfare: What the long-run data show. The American Economic Review 76: 1072–85. [Google Scholar] [CrossRef]
  10. Becker, Gary S., Tomas J. Philipson, and Rodrigo R. Soares. 2005. The quantity and quality of life and the evolution of world inequality. American Economic Review 95: 277–91. [Google Scholar] [CrossRef]
  11. Berlage, Lodewijk, and Dirk Terweduwe. 1988. The classification of countries by cluster and by factor analysis. World Development 16: 1527–45. [Google Scholar] [CrossRef]
  12. Cordoba, Juan Carlos, and Genevieve Verdier. 2008. Inequality and growth: Some welfare calculations. Journal of Economic Dynamics and Control 32: 1812–29. [Google Scholar] [CrossRef]
  13. Dal Bianco, Silvia. 2016. Going clubbing in the eighties: Convergence in manufacturing sectors at a glance. Empirical Economics 50: 623–59. [Google Scholar] [CrossRef]
  14. Dowrick, Steve, and Duc-Tho. T. Nguyen. 1989. Oecd comparative economic growth 1950–1985: Catch-up and convergence. American Economic Review 79: 1010–30. [Google Scholar]
  15. Durlauf, Steven N., Paul A. Johnson, and Jonathan R. W. Temple. 2005. Growth econometrics. In Handbook of Economic Growth. Amsterdam: North Holland. [Google Scholar]
  16. Epstein, Philip, Peter Howlett, and Max-Stephan Schulze. 2003. Distribution dynamics: Stratification, polarization, and convergence among oecd economies, 1870–1992. Explorations in Economic History 40: 78–97. [Google Scholar] [CrossRef]
  17. Fleurbaey, Marc. 2009. Beyond gdp: The quest for a measure of social welfare. Journal of Economic Literature 47: 1029–75. [Google Scholar] [CrossRef]
  18. Fleurbaey, Marc, and Didier Blanchet. 2013. Beyond GDP: Measuring Welfare and Assessing Sustainability. Oxford: Oxford University Press. [Google Scholar]
  19. Fleurbaey, Marc, and Guillaume Gaulier. 2009. International comparisons of living standards by equivalent incomes. Scandinavian Journal of Economics 111: 597–624. [Google Scholar] [CrossRef]
  20. Galor, Oded. 1996. Convergence? Inferences from theoretical models. Economic Journal 106: 1056–69. [Google Scholar] [CrossRef]
  21. Hartigan, John A. 1975. Clustering Algorithms. New York: John Wiley and Sons. [Google Scholar]
  22. Johnson, Paul, and Chris Papageorgiou. 2018. What Remains of Cross-Country Convergence? MPRA Working Paper 89355. Munich: University Library of Munich. [Google Scholar]
  23. Jones, Charles I., and Peter J. Klenow. 2016. Beyond gdp? Welfare across countries and time. American Economic Review 106: 2426–57. [Google Scholar] [CrossRef]
  24. Kaufman, Leonard, and Peter J. Rousseeuw. 2010. Finding Groups in Data: An Introduction to Cluster Analysis. lNew York: John Wiley and Sons. [Google Scholar]
  25. Magrini, Stefano. 2009. Why should we analyse convergence using the distribution dynamics approach? Scienze Regionali 8: 5–34. [Google Scholar]
  26. Mendez, Carlos. 2017. Convergence Clubs Beyond GDP: A Non-Parametric Density Approach. MPRA Working Paper 82048. Munich: University Library of Munich. [Google Scholar]
  27. Mendez, Carlos. 2018. On the distribution dynamics of human development: Evidence from the metropolitan regions of bolivia. Economics Bulletin 38: 2467–75. [Google Scholar]
  28. Pittau, Maria Grazia, Roberto Zelli, and Riccardo Massari. 2016. Evidence of convergence clubs using mixture models. Econometric Reviews 35: 1317–42. [Google Scholar] [CrossRef]
  29. Quah, Danny. 1993. Galton’s fallacy and tests of the convergence hypothesis. The Scandinavian Journal of Economics 95: 427–43. [Google Scholar] [CrossRef]
  30. Quah, Danny T. 1996a. Empirics for economic growth and convergence. European Economic Review 40: 1353–75. [Google Scholar] [CrossRef]
  31. Quah, Danny T. 1996b. Twin peaks: Growth and convergence in models of distribution dynamics. Economic Journal 106: 1045–55. [Google Scholar] [CrossRef]
  32. Quah, Danny T. 1997. Empirics for growth and distribution: Stratification, polarization, and convergence clubs. Journal of Economic Growth 2: 27–59. [Google Scholar] [CrossRef]
  33. Sala-i Martin, Xavier. 1996. The classical approach to convergence analysis. Economic Journal 106: 1019–36. [Google Scholar] [CrossRef]
  34. Stiglitz, Joseph E., Jean-Paul Fitoussi, and Martine Durand. 2019. Measuring What Counts: A New Dashboard for Well-Being. New York: The New Press. [Google Scholar]
  35. Stiglitz, Joseph E., Amartya Sen, and Jean-Paul Fitoussi. 2010. Mismeasuring Our Lives: Why GDP Doesn’t Add Up. New York: The New Press. [Google Scholar]
1
GDP per capita is a useful variable in the sense that it correlates with other human development variables such as educational attainment, life expectancy, and even subjective happiness.
2
For further details on the measurement and calculations of the variables, see the Appendix of Jones and Klenow (2016).
3
The database can be accessed at https://web.stanford.edu/~chadj/BeyondGDP500.xls.
4
Although one could use the latest versions of the Penn World Table, UNI-WIDER, and the World Bank databases to extend the analysis beyond 2007, the purpose of this paper is to be directly comparable with the paper of Jones and Klenow (2016). Thus, the reference period for comparison is still the 1980–2007 period. Further research, beyond the scope of this paper, could extend the period of analysis and evaluate the persistence of the convergence clusters.
5
See Sala-i Martin (1996) for further details.
6
For a more comprehensive and recent presentation of the distributional convergence approach, see Dal Bianco (2016), Durlauf et al. (2005), Epstein et al. (2003), or Mendez (2018)
7
See Appendix A for a list of countries their respective clubs.
8
Although the frameworks are similar, they are not identical. The work in Battisti and Parmeter (2012) used a semi-parametric density-based clustering framework, while this paper uses a non-parametric density-based clustering framework.
Figure 1. Lack of sigma convergence in welfare across countries.
Economies 07 00074 g001
Figure 2. Lack of beta convergence in welfare across countries.
Economies 07 00074 g002
Figure 3. Limited forward and backward mobility in welfare across countries.
Economies 07 00074 g003
Figure 4. Stochastic kernel distribution and convergence clubs (3D surface plot).
Economies 07 00074 g004
Figure 5. Stochastic kernel distribution and convergence clubs (contour plot).
Economies 07 00074 g005
Figure 6. Local convergence clusters.
Economies 07 00074 g006
Figure 7. Sigma convergence in welfare within clubs.
Economies 07 00074 g007
Figure 8. Beta convergence in welfare within clubs.
Economies 07 00074 g008
Table 1. Sigma convergence in welfare within clubs.
Standard DeviationStandard DeviationDispersion RatioANOVA Test
Log of Relative Welfare 1980Log of Relative Welfare 20071980/2007p-Value
Total (128 members)1.221.410.860.10
Club 1 (All 54 members)0.460.580.790.09
Club 2 (All 40 members)0.450.490.920.62
Club 3 (All 34 members)0.370.390.960.80
Club 1 (Core 30 members)0.310.390.800.23
Club 2 (Core 17 members)0.250.270.920.75
Club 3 (Core 28 members)0.320.211.470.05
Table 2. Beta convergence in welfare within clubs.
Club 1
VariableCoefficientt-Statisticp-Value
constant0.03376.94420.0000
log(y0)/T−0.8252−4.760.0000
R20.3
Speed of convergence ( β )6.46%
Half-life (periods)11
Club 2
VariableCoefficientt-Statisticp-Value
constant0.05995.40130.0000
log(y0)/T−0.4388−2.91870.0059
R20.18
Speed of convergence ( β )2.14%
Half-life (periods)32
Club 3
VariableCoefficientt-Statisticp-Value
constant0.09664.62960.0001
log(y0)/T−0.5231−3.18320.0032
R20.24
Speed of convergence ( β )2.74%
Half-life (periods)25

