Article

Economic Reforms, Labour Markets and Formal Sector Employment: Evidence from India

Department of Economics, University of Sussex, Brighton BN1 9RH, UK
Economies 2019, 7(2), 31; https://doi.org/10.3390/economies7020031
Submission received: 25 January 2019 / Revised: 27 March 2019 / Accepted: 2 April 2019 / Published: 4 April 2019

Abstract

:
Development economists generally concur that the implications of economic reform for employment are influenced by an economy’s institutional framework. This paper examines the extent to which differences in regional labour market flexibility shaped the impact of unanticipated economic reforms on employment in formal manufacturing firms in India in the 1990s, using pooled cross-sectional firm survey data. It employs a difference-in-differences strategy for this analysis and finds that, on average and ceteris paribus in the 1990–1997 period, declines in input tariffs were associated with increased employment in formal firms across all Indian states, while FDI reform was associated with increased (reduced) formal firm employment in states with flexible (inflexible) labour markets. Supporting analysis indicates that these results were underpinned, at least in part, by product market competition within the formal sector. As policy makers in developing economies increasingly emphasise increases in formal employment as a key policy objective, these findings are of general interest. They underline the relevance of market structure and geographical variation in institutional characteristics to a study of the effects of economic reform. Furthermore, this paper highlights the continuing relevance of formal sector analysis, notwithstanding the persistent primacy of informal enterprises in developing economies.
JEL Classification:
F16; J08; O25; P21

1. Introduction

In the latter half of the twentieth century, a number of developing economies initiated comprehensive economic reform policies. A balance-of-payments crisis necessitating IMF assistance, preceded by a period of tepid growth and a growing realisation that the status quo was unsustainable, triggered this process in India in 1991. The Indian government subsequently implemented a series of far reaching economic reforms in the 1991–1997 period. Over two decades later, gaps persist in the literature that explores the labour market impacts of this reform programme. A number of studies, Nunn and Trefler (2014) and Ahsan (2013) being among the more recent, have documented that this impact is likely to be influenced by domestic institutions. However, this view has received scant attention in the Indian context, in particular at a ‘micro’ or firm level.
This paper contributes to addressing this gap in the literature by analysing the impact of India’s economic reforms in the 1990s on employment in formal manufacturing firms. In this context, the term ‘formal’ extends to all manufacturing businesses that employ ten or more workers and use electricity (for a small number of manufacturers that do not use electricity, the employment threshold rises to twenty workers). These firms are ‘formal’ in the sense that India’s Factories Act of 1948 requires them to register with the state government, which brings these firms under the purview of labour market legislation and other forms of regulation, as outlined in Amirapu and Gechter (2017). Although these firms account for a tiny fraction of all manufacturing firms in India, government survey data suggest that they produce approximately three-quarters of manufactured output and account for 70% of gross value added in manufacturing.
I also examine the extent to which the impacts of the reforms depend on differences in labour market flexibility at the state (provincial) level. This is key, given that inflexible labour market regulation is commonly cited as an impediment to investment and growth in manufacturing output and productivity (Ahsan and Pagés 2009). Further, as labour market regulation is binding only for the formal sector, any direct effect arising from its interplay with economic reform is likely to be focused on formal firms. I capture state level variations in labour market flexibility using the ‘FLEX 2’ indicator proposed by (Hasan et al. 2012). Unless otherwise specified, I use the terms ‘states with flexible labour markets’ and ‘states with inflexible labour markets’ to refer to states that are characterised as having flexible labour markets (score 1) and inflexible labour markets (score 0) by this ‘FLEX 2’ variable. Described in detail in Section 3.3, this indicator builds on the seminal state level labour legislation-based measure proposed by (Besley and Burgess 2004) by accounting for perceptions regarding the effectiveness of implementation of legislation.
The analysis in this paper uses pooled cross-sectional survey data compiled by the Central Statistics Office (CSO) through the Annual Survey of Industries (ASI) for formal manufacturing firms. It benefits from the rich cross-industry variation in India’s policy changes in the 1990s, particularly visible in the import tariff reductions that were enforced in this period. Moreover, the reform package of 1991 was an unanticipated event, which helps to obviate the usual concerns inherent in any analysis of the consequences of such measures. This paper is the first to examine the impact of declines in both final goods and input tariffs on firm level employment in India.
The results are suggestive of substantial employment shifts in the formal manufacturing sector in the post-reform period, with input tariffs (discussed in Section 3.2) and foreign direct investment (FDI) reform (in terms of the relaxation of stringent FDI controls) being statistically and economically significant explanatory variables. On average, a one percentage point decline in input tariffs is associated with an employment increase of 0.68% in the average formal firm in states with inflexible labour markets, and an employment increase of 0.66% in the average formal firm in states with flexible labour markets (1990–1997). Further, FDI reform is associated with average formal firm employment falling (rising) by 11.5 (9.3)% in states with inflexible (flexible) labour markets. These results are highly robust to a battery of sensitivity checks. Given the timing of the FDI liberalisation and the extent to which input tariffs declined in India through the 1990s, these estimates suggest that ceteris paribus, following the reforms, employment in the average formal firm increased by approximately 27.3% in states with flexible labour markets and by roughly 7.5% in states with inflexible labour markets. These findings uphold the notion that the interactions between the reform measures and states’ labour market flexibility have implications for employment in formal firms. Overall, no significance is attached to reductions in final goods tariffs. Delicensing, while not associated with significant firm level employment changes, precedes a significant rise in the number of formal firms in the average industry in states with flexible labour markets.
The remainder of this paper is organised as follows. Section 2 undertakes a brief review of the literature and discusses the context in which the 1991 reforms were phased in. Section 3 describes the data, while Section 4 outlines the empirical methodology. The main findings are presented in Section 5, with further analysis and robustness checks discussed in Section 6. Section 7 brings together the findings in a summary discussion, and concludes.

2. Background and Context

2.1. Literature Review

2.1.1. Impacts of Economic Reform on Firm Level Employment

The turn of the millennium witnessed an upsurge in academic interest in the impacts of economic reform programmes on firm level employment, both in terms of theoretical contributions and empirical work. Substantial ambiguity persists as regards these employment effects. One or more of a number of mechanisms may underpin any observed impact of economic reform on firm level employment. For instance, a reduction in final goods tariffs might be expected to result in a more competitive domestic product market landscape, on account of an increase in imports. This could induce domestic manufacturers to shed surplus labour in a bid to cut costs and remain competitive. On the other hand, in sectors where product quality is more variable, domestic manufacturers might seek to employ more labour, particularly skilled labour, following a final goods tariff cut.
Furthermore, as Section 3.2 outlines, a reduction in final goods tariffs across the manufacturing sector as a whole implies a decline in input tariffs for the average manufacturer. This would arguably lead to lower input prices, not only for imported inputs but also, over time and through general equilibrium effects, for indigenous inputs that were previously more expensive under the higher tariff regime. Facing lower input prices for manufactured items, employers might be incentivised to hire more, rather than less, workers in the post-tariff reform period. Whether such employment effects (arising from lower input prices in the post-reform period) move in the same direction as any effects attributable to final goods tariff cuts is an empirical issue. To the extent that some of these effects might cancel each other out, any impacts of significance that I observe in this study, either attaching to the final goods or input tariff reductions, might be taken to be net effects. Also, while the final goods and input tariff reductions in India in the 1989–2000 period were evidently positively correlated, there is sufficient variation between these two variables (see Section 3.2). The large sample size of the dataset used for the analysis presented in this paper also goes a long way towards mitigating any threat that moderate multicollinearity might in theory pose to the statistical significance of the results.
In considering employment impacts, then, declines in tariffs on intermediate goods (input tariffs) are arguably as important to assess as final goods tariff cuts. The question of which among the alternative channels discussed above would be dominant is an empirical issue. The OECD (2012) provides an excellent overview of the extensive literature that examines the links between trade liberalisation and employment. In considering employment impacts, then, declines in tariffs on intermediate goods (input tariffs) are arguably as important to assess as final goods tariff cuts. While there is some evidence that declines in input tariffs are associated with changes in formal sector employment, the direction of the effect does not appear to be uniform (see for instance Menezes-Filho and Muendler 2011; Paunov 2011; Sharma 2013; Kis-Katos and Sparrow 2015; Groizard et al. 2015). This paper contributes to building an evidence base in these areas.
As regards India’s trade reforms, most studies have tended to focus on tariffs on final goods, or final goods tariffs, and their implications for firm level productivity. However, an increasing body of evidence suggests that declines in tariffs on intermediate inputs (input tariffs) have a greater positive impact on firm level productivity in the formal sector, relative to final goods tariffs. Amiti and Konings (2007) arrive at this conclusion in a study focusing on Indonesian firms and Nataraj (2011) obtains a similar result for formal firms in India. These results make a strong case for simultaneously examining final goods and input tariff declines in a study of the implications of trade liberalisation for employment.
Moreover, the firm level implications of India’s delicensing and FDI reforms remain poorly studied. Aghion et al. (2008) establish that delicensing had implications for state level employment in India. The principal goal behind the delicensing reform was to slash some of the ‘red tape’ that had long been a major barrier to market entry. Therefore, a scenario in which delicensing may affect firm level employment, both through the entry of new firms and changes in employment in incumbent firms, becomes plausible. Similarly, with FDI reform (in terms of liberalisation of existing caps on FDI equity), it could be argued that firm level employment might undergo quantitative and qualitative increments on account of a greater likelihood of knowledge transfers, technology spillovers and related factors (Javorcik 2015). In tandem with the trade reforms, delicensing and FDI liberalisation might also have ‘extensive margin’ implications for market or industry size, on account of competition driven effects or collaborative or supply chain linkages between formal firms. This paper contributes to building an evidence base in these areas.

2.1.2. Does Labour Market Flexibility Matter?

A number of studies, including (Goldberg and Pavcnik 2003; Bosch et al. 2007), suggest that firm level employment is at least as much a function of the degree of domestic labour market flexibility as it is of economic policy shifts. Intuitively, the notion that the impact of economic reforms on labour markets is affected by domestic institutions is appealing. In other words, the impact of economic reforms on domestic labour markets is arguably likely to hinge on the interaction between policy change and domestic institutions, in particular labour market regulation.
This interaction could lead to a number of alternative outcomes, which makes the evaluation of the net effect an empirical question. For instance, in areas with more flexible labour markets, employers are arguably more likely to take on or shed additional labour following any given policy reform, relative to areas with less flexible labour markets. This could be reflected both in terms of a greater likelihood of post-reform increases in employment on the one hand, and greater variation in observed firm level employment, in areas with more flexible labour markets. In this paper, I restrict my attention to estimating the net average effect of the reforms of interest on firm level employment in Indian states with relatively more, as opposed to relatively less, flexible labour markets. In this section, I summarise the literature that considers the relevance of such a distinction for differential employment outcomes. The specific measure of labour market flexibility that I use in my baseline regressions is discussed at some length in Section 3.3.
The impacts of labour market regulation on employment outcomes have long constituted an area of research interest. Botero et al. (2004) study labour laws in 85 countries and conclude that more inflexible labour markets (in terms of higher levels of labour regulation) tend to have larger unofficial segments and higher unemployment. Given the federal structure of its economy and the fact that its numerous states (provinces) have considerable autonomy in terms of amending and implementing centrally driven labour market regulation, India offers fertile ground in this context. Besley and Burgess (2004) exploit the state and time level variation in amendments made to the Industrial Disputes Act (IDA) of 1947 up to 1990 to derive labour market flexibility scores that vary across states and over time (these are discussed in more detail in Section 3.3). Founded upon these scores, their analysis concludes that states that tended to make more ‘pro-worker’ amendments over time tended to witness inferior outcomes in terms of employment, output, investment, productivity and urban poverty, relative to states that tended to make more ‘pro-employer’ amendments over time.
Recent research is supportive of complementarities between the nationwide industry level reforms undertaken in India and domestic labour market flexibility. Aghion et al. (2008) argue that manufacturing output in states that made more ‘pro-worker’ amendments as per the Besley–Burgess methodology tended to be lower following the delicensing reforms undertaken in India in the 1990s, relative to states where amendments tended to be ‘pro-employer’. Along related lines, Gupta et al. (2009) find that after the delicensing reforms were initiated, states with more inflexible (‘pro-worker’) labour laws tended to undergo slower employment growth, while states with less competitive product market regulation registered slower output growth. Topalova and Khandelwal (2011), however, use the Besley-Burgess measure to suggest that formal firms in states with more ‘pro-worker’ legislation experienced higher productivity gains in the wake of India’s tariff liberalisation.
A recent study by Hasan et al. (2012) examines the extent to which final goods tariff liberalisation has differential impacts on the unemployment rate in Indian states with relatively more flexible and less flexible labour markets, as evaluated using the Besley-Burgess measure, the measure due to Gupta et al. (2009) and an additional measure (‘FLEX 2’, described in Section 3.3). Hasan et al. (2012) conclude that labour market flexibility is conducive to employment growth in the post-liberalisation period, particularly in industries that are net exporters. However, this analysis has limitations. It is conducted at a high level of industry aggregation, does not assess input tariff declines, and does not consider employment in formal and informal enterprises separately. In comparison, the current study focuses on formal firms, uses a more disaggregated industry classification and explores the effects of declines in both final goods tariffs and input tariffs, in addition to domestic industrial policy reforms.

2.2. Context to the Indian Reforms of 1991–1997

Prior to the 1980s, Indian economic policy was largely geared towards government regulation and national self-sufficiency. Trade policy was extremely restrictive and favoured import substitution, with exporters and importers alike facing a wide range of punitive tariff and non-tariff barriers. In tandem, domestic industrial policy imposed several constraints on businesses—most notoriously in the form of the infamous license policy (the ‘License Raj’)—and thereby stifled entrepreneurship and growth. Over time, this regulatory regime engendered a productivity decline in the 1970s and became a byword for red tape, graft, inefficiency and government monopoly in a number of sectors.
In the 1980s, a few reforms were initiated in an attempt to reverse the productivity decline of the previous decade. The domestic license regime was partially liberalised, with roughly one in three three-digit manufacturing industries being delicensed in 19851. In the domain of trade policy, however, tariffs on manufactured imports remained stubbornly high.
The piecemeal reforms of the 1980s proved inadequate in the face of growing fiscal and external macroeconomic imbalances. To worsen matters, a spike in oil prices owing to the Gulf War, a decline in remittance inflows from the Middle East, political uncertainty and a drop in demand for exports to major trade partners all combined to engender substantial capital outflows and, subsequently, a balance-of-payments crisis in 1990–1991.
In August 1991, the Indian government approached the IMF to request a Stand-By Arrangement to help it tide over this external payments crisis. The IMF agreed to provide the requisite support conditional on the government undertaking a series of macro-structural reforms, including substantive trade liberalisation measures. It was against this background that the trade reforms of 1991 were phased in. Given the circumstances, it may plausibly be argued that these reforms constituted an exogenous shock for the economy. Sivadasan (2009) and Topalova and Khandelwal (2011) provide additional background detail on the 1991 reforms.
The New Industrial Policy endorsed in 1991 provided a roadmap for reform and the five-year Export Import (Exim) Policy that came into effect in April 1992 encapsulated the new trade policy. Under the trade liberalisation programme initiated in 1992, the import license regime applying to nearly all capital goods and intermediate inputs was abolished. Tariffs were liberalised by capping peak tariff rates and by reducing the number of tariff bands. Further, the Indian rupee was devalued relative to the US dollar and a dual exchange rate was introduced.
In the 1991–1997 period, the average Indian final goods tariff (ad valorem) on manufactured imports fell from 95% to 35% (Harrison et al. 2013). However, as Table 1 reveals, the declining trend in final goods tariffs masked considerable dispersion around the mean, with peak tariffs remaining prohibitive. Under the terms of the support extended by the IMF, the deepest tariff cuts were applied to those industries with the highest pre-reform tariff levels. This simplification and harmonisation of the tariff regime was followed by an increase in imports, in particular imports of intermediate inputs.
In 1997, a new five-year Exim Policy was endorsed to consolidate the trade liberalisation and reform process. Tariff reductions continued in the post-1997 period, albeit with less urgency and at a slower pace. Topalova and Khandelwal (2011) argue that endogeneity concerns for this period are likely to be greater relative to the immediate post-reform (1991–1997) period, on the grounds that in contrast to the 1991–1997 period, the later tariff reductions are more likely to have been targeted at protecting less efficient industries. In Section 6, I undertake a number of checks and conclude that tariff endogeneity is unlikely to be a concern for the analysis in this paper.
In tandem with the tariff reductions, domestic economy deregulation, which had been promoted in ‘piecemeal’ fashion in the 1980s, received an impetus in the 1990s. This deregulation assumed numerous guises, most prominent among which were the quasi-elimination of the notorious industrial license regime and increases in the foreign direct investment (FDI) thresholds applicable to a number of manufacturing industries2. On the whole, the reforms of the early nineties resulted in the Indian economy becoming substantially more open relative to its position in the first four decades following independence. As a proportion of GDP, the share of overall trade increased considerably, from 15% in the 1980s to about 27% in 2000 and further to 47% in 2006 (Alessandrini et al. 2011).
As Nataraj (2011) documents, while many of the other domestic reforms of the 1990s were of an industry invariant nature, the delicensing and FDI liberalisation measures were phased in at different points in time for different manufacturing industries. In all my empirical specifications, I therefore include controls for these reforms (described in Section 3.2). Other major domestic reforms, such as currency devaluation and corporate tax reform, are accounted for by the use of time fixed effects.

3. Data

3.1. Labour Market Data

I use pooled cross-sections of firm survey data compiled by India’s Annual Survey of Industries (ASI), which covers all large firms (defined as having 100 or more employees in the period of my analysis) and a sample of smaller firms. The ASI provides inverse sampling probability-based weights, which enable me to arrive at results that apply to the population of formal firms. In the baseline regressions, employment is captured in terms of the total number of paid employees, hereafter referred to as ‘paid employment’. The baseline dependent variable is the natural logarithm of paid employment.
My dataset comprises formal firms surveyed in the periods 1989–1990, 1993–1994, 1994–1995 and 1996–1997. For convenience, I refer to these periods as 1990, 1994, 1995 and 1997 in this paper. As such, I observe firms in one pre-reform period (1990) and three post-reform periods (1994, 1995 and 1997). The ASI adopted the same sampling strategy and the same industrial classification, the National Industrial Classification (NIC) of 1987, across these four surveys. As the data do not comprise a firm level panel, I am unable to analyse market entry and exit, but I discuss the mechanisms through which the effects that are observed might operate.
The pooled distribution of the baseline dependent variable (paid employment) for the population of formal firms is presented in Figure 1a. The average formal firm has 71 paid employees, a number that registers very little variation over the 1990–1997 period. Figure 1a shows that a majority (over 75%) of formal firms have less than 50 paid employees. However, formal firms with over 100 paid employees account for almost 70% of paid employment in the formal sector. In other words, the distribution of paid employment is quite uneven across the formal sector, with a relatively small number of large firms accounting for a lion’s share of employment.
Figure 1b illustrates that on average, formal firms in states with less flexible labour markets (the definition of which is discussed further in Section 3.3) tend to be a little larger than their counterparts in states with more flexible labour markets, but there is no visible increasing or decreasing trend in these averages over the 1990–1997 period. In this paper, I explore whether the policy changes initiated in the 1990s had differing, and potentially mutually negating, formal firm employment effects, which could in theory be masked by the stable average employment estimates that are visible in Figure 1b.
The construction of the pooled dataset poses a number of challenges. As the state specific labour market flexibility measure used applies to sixteen states, I discarded firms located in most other states. The exception is the national capital region (Delhi), which accounts for a large number of firms relative to the states that are excluded and is assigned an inflexible labour market status in the baseline on account of a lack of relevant data. The baseline results hold if Delhi and Jammu & Kashmir (which is classified as being a state with an inflexible labour market, as described in Section 3.3) are, instead, assumed to be flexible labour markets (this is discussed further in Section 6). Restricting the dataset to the sixteen states of interest and Delhi does not appear to be a serious concern, as these regions consistently account for over 95% of Indian GDP and, further, the firms retained in my sample account for over 80% of formal manufacturing employment in each period.
I exclude firms that are reported to have been closed from my analysis and account for extreme outliers by ‘winsorizing’ the employment distribution for each year at the 0.1st and 99.9th percentiles. This entails setting the values of a selected fraction, in this case 0.1%, of observations at the top and bottom end of a distribution to equal the values of the corresponding top and bottom percentiles. In circumventing the issues that might arise from extreme outliers unduly affecting parameter values, this practice also seeks to address possible errors in data entry. Further, I observe that a number of formal firms report employing less than ten persons. Some of these firms may have undertaken temporary reductions in employment (Nataraj 2011), while others may have registered to be able to trade or raise equity. I therefore include these firms in my analysis while also undertaking a check to ensure that my findings are robust to their exclusion. A small number of formal firms provide zero or missing values for raw material use and/or physical product manufacturing; again, following Nataraj (2011), I drop these firms from the baseline, as they are likely to be engaged only in trading activity, but I conduct a check to establish that their inclusion does not affect the key results. These checks are outlined in Section 6.

3.2. Data on the 1990s Reforms

I use annual data on final goods and input tariff rates for the 1985–1997 period, compiled by Nataraj (2011) at the three-digit National Industrial Classification (NIC) of 1987 level. The final goods tariff data are based on the Government of India’s Customs Tariff Working Schedules and the United Nations Conference on Trade and Development—Trade Analysis Information System (UNCTAD-TRAINS) database, whereas the input tariff data are computed using sectoral final goods tariffs and the Indian Input-Output Transactions Table (IOTT). For example, as explained in Nataraj (2011), if leather goods and textiles comprise 80% and 20% of the inputs used by the footwear industry, the input tariff for the latter equals 0.8 times the final goods tariff for leather goods plus 0.2 times the final goods tariff for textiles. I follow Harrison et al. (2013) in using input tariffs constructed on the basis of manufacturing and non-manufacturing industry final goods tariffs, and in undertaking a robustness check for which input tariffs constructed using only manufacturing industry final goods tariffs are used (the results of this check differ in part from my baseline findings in terms of statistical significance and are discussed in Section 6). The IOTT classifies industries into only 62 relevant groups as opposed to the NIC (1987) classification, for which over 130 industry codes exist for which final goods tariff data are available. In spite of this limitation, a considerable degree of variation is observable in input tariffs across NIC (1987) industries. Summary statistics are provided in Table 1 (Section 2.2). Final goods and input tariffs are measured in terms of fractions in the dataset (so that, for instance, a tariff rate of 80% corresponds to 0.80).
To control for the delicensing and FDI regime reforms undertaken in India in the period of interest, I use industry and time varying indicator variables that are also due to Nataraj (2011). These data were first used by Aghion et al. (2008). The delicensing and FDI reform variables assume a value of ‘1’ for a given industry in a specific year if that industry was delicensed or FDI liberalised by the year in question and are otherwise equal to ‘0’. As discussed in Section 2.2, approximately one-third of three-digit NIC (1987) manufacturing industries (and a little over one-third of the industries represented in my dataset) had been delicensed in 1985. After the 1991 reform episode, the proportion of delicensed industries increased to almost 90 percent, while approximately 40% of industries were FDI liberalised.
As discussed in Section 2.2, final goods tariffs declined precipitously in 1992, which was the first year of reform implementation following the balance-of-payments crisis of 1990–1991. Input tariffs also fell and converged in the post-1991 period and display less variance relative to final goods tariffs. The scatterplots in Figure 2a,b capture tariff levels in 1989 and the declines that occurred in the 1989–2000 period for output and input tariffs, illustrating how the highest pre-reform tariff rates were subjected to the largest cuts3. Figure 2c plots pairwise declines in final goods tariffs and input tariffs over the 1989–1994 period. The resulting scatterplot suggests that while there may be a positive association between the shifts in tariff rates4, it is not sufficiently strong for multicollinearity to pose major concerns.

3.3. Measure of Labour Market Flexibility

The measure of state level labour market flexibility used in this study, labelled ‘FLEX 2’, is due to Hasan et al. (2012). This measure is founded upon the workhorse measure developed by Besley and Burgess (2004).
Besley and Burgess (2004) use the Industrial Disputes Act (IDA) of 1947, passed by the central government, as their baseline. They exploit the fact that fifteen major Indian states made a series of amendments to this Act in the 1958–1990 period to develop an econometric strategy that accounts for state level regulatory variation6. In total, the fifteen states made 113 amendments. Besley and Burgess assign a code of ‘1’ to each amendment they deem to be ‘pro-worker’, a code of ‘−1’ to amendments they find to be ‘pro-employer’ and a code of ‘0’ to ‘neutral’ amendments. Following this, they assign to each state a score of ‘1’, ‘−1’ or ‘0’ in each year when the state passed at least one amendment, based on the dominant direction of amendments passed. For instance, a state which passed three pro-worker amendments (‘1 + 1 + 1’) and one pro-employer amendment (‘−1’) in 1965 gains a score of one (for having been predominantly pro-worker, in the sense that ‘1 + 1 + 1 + (−1)’ exceeds zero) for 1965. The year specific scores assigned to each state are then cumulated over time for all relevant years (years in which the state made at least one amendment) to arrive at a final state specific score for 1990, on the basis of which the state is classified as being pro-worker, pro-employer or neutral in any given year.
Gupta et al. (2009) modify the Besley-Burgess measure to account for a number of suggestions offered by Bhattacharjea (2006) and for OECD (2007) survey research that assesses areas in which states have undertaken measures pertinent to the implementation of labour laws (including but not limited to the IDA). The labour market flexibility indicator developed by Gupta et al. (2009) is labelled ‘FLEX 3’ by Hasan et al. (2012)7, who construct an additional measure that they refer to as ‘FLEX 2’. Also rooted in the Besley-Burgess measure, the ‘FLEX 2’ index inverts the final Besley–Burgess scores of three states: Gujarat, Kerala and Maharashtra. Hasan et al. point out that World Bank (2005) research supports the view that Gujarat and Maharashtra, assigned overall scores of ‘1’ (pro-worker status) by Besley and Burgess, are generally regarded favourably by business representatives, whereas Kerala, although designated to be pro-employer by Besley and Burgess, is perceived to have a ‘poor investment climate’8. In summary, the ‘FLEX 2’ index assigns scores of −1, −1 and 1 to Gujarat, Maharashtra and Kerala respectively. Table 2 summarises the ‘FLEX 1’ (Besley and Burgess’ index), ‘FLEX 2’ and ‘FLEX 3’ scores for each state.
In this study, I use the ‘FLEX 2’ measure of labour market flexibility, as it takes account not only of the nature of labour market regulation but also of business managers’ perceptions regarding the enforcement of the same in terms of state specific investment environments (see 8). Dougherty (2009) notes that there were no major state level amendments to the IDA between 1990 and 2004.9 As my analysis is focused on the 1990–2001 time period, the ‘FLEX 2’ indicator varies only across states and not over time.
As I interact the ‘FLEX 2’ measure with the output and input tariffs in my regressions, I recode the ‘FLEX 2’ index to facilitate the interpretation of my findings. Along the lines of Hasan et al. (2012), states with flexible (‘pro-employer’) labour markets receive a score of ‘1’ (rather than ‘−1’, as is the case in the Besley–Burgess scores), whereas states with neutral or inflexible (‘pro-worker’) labour markets receive a score of ‘0’ (rather than ‘1’ for the states with inflexible labour laws, as is the case in the Besley–Burgess index).
Table 3 provides summary firm level employment statistics for the sample as a whole and separately for states with flexible and inflexible labour markets, as defined using the ‘FLEX 2’ measure. As the ASI surveys all large formal firms (generally specified to be firms having 100 or more employees in the 1990–1997 surveys) in each year while undertaking sampling for smaller formal firms, the sample employment distribution is skewed to the right in comparison with the population employment distribution (the latter is illustrated in Figure 1, Section 3.1, for the pooled dataset). The average firm in the sample has 115 paid employees. While this figure is slightly higher in states with inflexible labour markets (120) than in states with flexible labour markets (113), it is quite stable over time in both groups of states. Median paid employment for the sample is also stable and amounts to approximately 25 across all states.
The final column of Table 3 also shows that the total weighted numbers of paid employees in the population represented by these firms increased over the 1990–1997 period, both in states with more flexible labour markets and less flexible labour markets. These totals account for less than 20% of overall employment in the Indian manufacturing sector, with the remainder being accounted for informal enterprises. Nonetheless, as stated in Section 1, formal firms have long accounted for over 70% of output and gross value added in Indian manufacturing. Together, these observations underline the fact that Indian formal firms are substantially more productive than their informal counterparts and strengthen the case for an analysis of the extent to which the reforms of the 1990s affected employment in these firms. In this paper, I attempt to estimate the extent to which the ‘macro’ level formal employment increase is attributable to each major policy reform undertaken in India in the 1990s, at the firm and industry level. The analysis explores whether the observed net employment increase masks varying responses to individual policies in states with more and less flexible labour markets.

4. Method

The analysis harnesses the variation in policy change over time and across industries in India in the 1990s, as outlined in Section 2.2 and Section 3.1, to identify the impact of economic reform on employment. In the expanded baseline specification, I account for state level differences in labour market flexibility.
The preliminary regression that I employ is of the form:
ln e m p i j k t = α 0 + α 1 T A R I F F j t 2 + α 2 I N T A R j t 2 + α 3 D E L j t 2 + α 4 F D I j t 2 + δ t + δ j + δ k + ε i j k t
where ln(emp)ijkt is the natural logarithm of paid employment in firm i in industry j and state k at time t; TARIFFjt−2 and INTARjt−2 are two-year lags of final goods and input tariffs; DELjt−2 and FDIjt−2 are time varying indicator variables capturing whether industry j underwent delicensing and FDI regime reforms two years prior to year t; and δt, δj and δk are year, industry and state fixed effects. To explore any overarching associations between the reforms and average firm level employment, irrespective of variations in state level flexibility, I use Equation (1) as a primary firm level specification.
I also use a variant of Equation (1) to undertake panel fixed effects analysis at a broader, three-digit industry level, for the economy as a whole as well as separately for states with flexible and inflexible labour markets. This analysis, discussed in Section 5.2, considers the implications of the reforms for the ‘extensive margins’ of firm numbers and aggregate employment at the industry level (in logarithms). These industry level regressions are weighted by the pre-reform (1990) industry levels of the dependent variable in each case. Following (Martin et al. 2017), this analysis is restricted to industries that have ten or more firms in each weighted cross-section, a step which omits only a small number of industries.
The expanded baseline specification that I use to examine the implications of differences in state level labour market flexibility is similar to that used by (Hasan et al. 2012):
ln e m p i j k t = α 0 + α 1 T A R I F F j t 2 + β 2 T A R I F F j t 2 L M k + α 2 I N T A R j t 2 β 2 I N T A R j t 2 L M k + α 3 D E L j t 2 + β 3 D E L j t 2 L M k + α 4 F D I j t 2 β 4 F D I j t 2 L M k + δ t + δ j + ε i j k t
where LMk is a time invariant indicator variable capturing the degree of labour market flexibility in state k (the ‘FLEX 2’ measure) and the other variables follow the description provided for Equation (1). As LMk is time invariant, its level effect is subsumed within δk, the state fixed effects term.
In the specification presented in Equation (1), the overall impact of the reforms on employment is the sum of the coefficients α1, α2, α3 and α4. In the expanded specification of Equation (2), this impact derives from the sums α1 + β1LMk (for final goods tariff liberalisation), α2 + β2LMk (for input tariff liberalisation), α3 + β3LMk (for delicensing) and α4 + β4LMk (for FDI reform). In each instance, the first term captures the direct impact linked with the reform in question, whereas the interaction term (involving LMk) presents a measure of the indirect effect associated with the interplay between the reform and state level labour market flexibility. The sum of the two coefficients thus yields a measure of the net impact of each reform measure on average firm level employment. This varies across states, with the interaction-based effect amounting to zero for states with inflexible labour markets (as the ‘FLEX 2’ variable equals zero for these states).
As discussed in (Hasan et al. 2012), significant interstate migration flows could pose a threat to my identification strategy, by resulting in overestimation of the β coefficients. Although my tariff measures are state invariant, it could be argued that substantial tariff declines might result in larger numbers of workers moving out of states with more flexible labour markets, relative to states with less flexible labour markets. However, as (Hasan et al. 2012) document, work undertaken by (Dyson et al. 2004; Anant et al. 2006; Munshi and Rosenzweig 2009; Topalova 2010) suggests that migration within India has tended to be insubstantial in recent decades, with interstate migration levels having been particularly low. This indicates that any worker flows engendered by the trade reforms were limited, with spillovers straddling state borders likely to have been rare.

5. Results

5.1. Baseline Regressions: Firm Level

To begin, I assess whether the reforms are associated with statistically significant employment shifts at the firm level, irrespective of variations in regional labour market flexibility. In the first three columns of Table 4, I therefore run variations of Equation (1) presented in Section 4. As specified in Section 3.2, all the tariffs are entered into the dataset in fractional form (for instance, a tariff of 80% is entered as 0.80). As a result, given that the dependent variable is in logarithmic form, we may directly interpret the coefficients attaching to the tariff variables as proportional changes associating with a percentage point change in the tariffs, without having to multiply them by 100.
Final goods tariff reductions are associated with a weakly statistically significant reduction in paid employment. However, this coefficient is unstable and substantially outweighed by the coefficient attaching to the input tariff variable. A one percentage point decline in input tariffs is associated with paid employment rising by approximately 0.74% on average (Table 4, Column 3), with this result being highly statistically significant across specifications. Controlling for final goods and input tariff changes, delicensing and FDI reform are not associated with statistically significant changes in paid employment. When I use the natural logarithm of total employment as an alternative dependent variable, all the above-mentioned findings are virtually unchanged (Table 4, Columns 4 to 6).
In Table 5, I explore the extent to which state level differences in labour market flexibility have a bearing on the effects of the reforms, using alternative forms of the expanded baseline specification of Equation (2) discussed in Section 4. I focus on the results that are statistically significant at the significance level of 0.05. First, I confirm that final goods tariff reductions are not associated with significant changes in paid employment in all states, with the weakly significant negative effect visible in Table 4 being restricted to states with flexible labour markets, as defined using the ‘FLEX 2’ indicator described in Section 3.3 (Table 5, Row 1 and ‘Row 1 + Row 2’). On the other hand, lower input tariffs are associated with significantly increased paid employment in all states. More precisely, in states with inflexible labour markets, a one percentage point reduction in input tariffs is associated with paid employment rising by 0.68% (Table 5, Column 3, Row 3). In states with flexible labour markets, a one percentage point reduction in input tariffs is associated with paid employment increasing by 0.66% (Table 5, Column 3, ‘Row 3 + Row 4’). The corresponding p-value of 0.001 indicates that this result is highly statistically significant even at the 0.01 significance level.
As the delicensing and FDI reform variables are indicator variables and are not rescaled in a manner similar to the tariffs, the coefficients that attach to them must be multiplied by 100 for appropriate interpretation, given the logarithmic form of the dependent variable. Table 5 reveals that delicensing is not linked with significant changes in paid employment in all states. Interestingly, however, labour market flexibility appears to matter in terms of the response of paid employment to FDI reform. In states with inflexible labour markets, FDI liberalisation is associated with a significant fall of approximately 11.5% in paid employment (Table 5, Column 3, Row 7). Conversely, in states with flexible labour markets, FDI liberalisation is associated with paid employment being significantly higher by an average of 9.3% (Table 5, Column 3, ‘Row 7 + Row 8’). Again, these results are upheld when I use the natural logarithm of total employment as an alternative dependent variable (Table 5, Columns 4 to 6).
To summarise, these results suggest that on the whole, paid employment in India’s formal manufacturing firms in the 1990s responded primarily to reduced input tariffs and FDI regime changes and did not register significant changes in response to reductions in final goods tariffs and the delicensing reforms. Lower tariffs on inputs go hand-in-hand with significantly higher paid employment across all states. FDI reform is associated with a significant rise in paid employment in states with flexible labour markets, and a significant reduction in paid employment in states with inflexible labour markets.
The absence of significance for the baseline final goods tariff coefficients aligns with the findings of (Kambhampati et al. 1997; Kambhampati and Parikh 2005), which suggest that India’s final goods tariff reductions may have had mutually offsetting positive and negative impacts, and therefore an insignificant net impact, on formal sector employment, on account of their potentially double-edged effects on firm level mark-ups or profitability. Employing the alternative, ‘macro’ level techniques of factor content analysis, growth accounting and labour demand modelling, Sen 2008 draws broadly the same conclusion. Moreover, recent work by (De Loecker et al. 2016) points to marginal input costs having declined more substantially than final output prices following India’s trade liberalisation, on account of significant mark-up increments. Input tariff declines may therefore be a more prominent driver of changes in firm level input cost allocation, including for labour input, relative to final goods tariff cuts.

5.2. Industry Level Results

The results discussed in Section 5.1 may be driven either by actual changes in average firm level employment in response to the reforms or, alternatively, on account of shifts in the ‘extensive margins’ of industry level firm numbers or employment. While I am unable to study firm entry and exit owing to the lack of firm level panel data, I explore the potential for extensive margin shifts by constructing industry level data on firm numbers and employment, using the survey weights provided in the firm level data for aggregation. Following the discussion in Section 4, having thus obtained an industry level panel dataset, I regress the natural logarithm of industry level employment or firm numbers on the reform variables, controlling for industry and time fixed effects.
The results of this exercise are presented in Table 6. Input tariff declines and FDI reform, as well as final goods tariff reductions, are not associated with significant changes in industry level employment or firm numbers across all states. This suggests that the effects associated with the former two reforms in Section 5.1 may be restricted to subsets of formal firms, or to firms operating in specific industries. Importantly, Table 6 reveals the delicensing reform to be associated with significantly increased formal firm numbers in states with flexible labour markets, but not in inflexible labour markets. Specifically, over the 1990–1997 period, delicensing is associated with the number of formal firms rising by between eight per cent and nine per cent in the average delicensed industry in states with flexible labour markets, ceteris paribus. As delicensing is not associated with significant changes in firm level employment (Section 5.1), this appears to be an effect working purely on the ‘extensive margin’ of industry expansion. As delicensing facilitated business creation in industries that were previously regulated to a great extent (Section 2.2), this effect may be driven by shifts in the product market landscape. I explore this point further in Section 5.4.

5.3. Implications for the Indian Labour Market

The discussion in Section 5.1 implies that the changes in paid employment associated with the reforms of the 1990s are of a substantial magnitude. The average declines in final goods and input tariffs in the manufacturing industries in my dataset for the 1988–1995 period amount to 41.3 percentage points and 29.2 percentage points. The median declines in final goods and input tariffs for the 1988–1995 period are very similar, amounting to 41.5 percentage points and 27.8 percentage points respectively. Given these numbers, the results discussed in Section 5.1 indicate that if other variables are held constant over this period, paid employment in formal firms in industries that underwent the median input tariff decline increased by approximately 19 per cent in states with inflexible labour markets, and by approximately 18 per cent in states with flexible labour markets (I restrict my attention to those results that are statistically significant at a significance level of 0.05). As an example of how these numbers are arrived at, since a one percentage point fall in input tariffs is associated with average paid employment increasing by 0.68 per cent in states with inflexible labour markets, the median input tariff reduction of 27.8 percentage points would be associated with paid employment increasing by 19 per cent on average in those states (27.8 multiplied by 0.68).
At the same time, as discussed in Section 5.1, being in an FDI liberalised industry is associated with paid employment decreasing by 11.5 per cent in states with inflexible labour markets and increasing by 9.3 per cent in states with flexible labour markets. Taken together with the above-mentioned effects relating to the input tariff declines, this indicates that on average and ceteris paribus, paid employment in formal firms in FDI liberalised industries that underwent the median input tariff decline increased by 7.5 per cent in states with inflexible labour markets. The corresponding effect in states with flexible labour markets was substantially higher and amounted to 27.3 per cent, on account of the input tariff declines and FDI reforms both being associated with positive employment shifts. Given that the mean and median for formal firm employment in the 1990–1997 period amount to 74 and 20 respectively (Section 3.1), these are economically meaningful effects, in particular for states with flexible labour markets, where the number of formal firms also increased in industries that were delicensed in the 1990s (Section 5.2).

5.4. Increases in Product Market Competition

The reforms of the 1990s arguably led to increased product market competition over time. In particular, the sharp reductions in final goods tariffs, as discussed in Section 3.2, resulted in Indian manufacturers facing increased import competition. This may have engendered domestic product market compositional changes of the type described by the Melitz (2003) model, with larger, more productive domestic firms expanding and gaining market share at the expense of less productive incumbents. In addition, the delicensing reform streamlined the process of setting up a large registered business, thereby creating a more conducive environment for new entrants to challenge incumbents in several manufacturing industries. While a thorough examination of this potentially crucial driver of employment changes in formal firms in the 1990s is outside the scope of the current study and its data, I analyse some of its implications in this subsection.
First, I exploit the fact that one key manufacturing sector policy, that of small-scale industry (SSI) reservation, was left untouched up to 1997. Under this policy, Indian policy makers had, over time, reserved specific manufactured products for production in small firms, defined in terms of an investment threshold (Martin et al. 2017). Product information is provided by approximately 85 per cent of the formal firms in my dataset. A subset of these firms, accounting for 25 to 30 per cent of formal manufacturers in the 1990–1997 period, produce at least one of these reserved products, while the rest manufacture products that were never reserved. Firms producing at least one reserved product are consistently and significantly smaller than those producing items that were never reserved: on average, firms in the former category employ 79 paid persons, whereas their counterparts in the second category employ 144 paid persons.
As the SSI reservations were only lifted in 1997 and thereafter (and for the most part, as discussed in Martin et al. (2017), in the post-2000 period), firms producing SSI reserved items are likely to have experienced a lower degree of product market competition than other firms. I explore this possibility in Table 7. Column 2 of Table 7 contains results that apply to firms producing at least one SSI reserved item, which register a general loss of significance relative to the baseline. For these firms, declining input tariffs are associated with large and significant employment enhancing effects only in states with flexible labour markets. Further, the baseline FDI effects lose significance for firms in these less competitive product markets (as defined by products that were SSI reserved). In states with inflexible labour markets, final goods tariff reductions are associated with a significant increase in employment in these firms on average and ceteris paribus, with no corresponding significance being obtained for states with flexible labour markets. On the other hand, the results of the baseline specification for firms producing items that were never SSI reserved (Table 7, Column 3) are very similar to the overall baseline numbers (Table 7, Column 1), both for input tariff declines and for FDI liberalisation. This indicates that the competition channel may be relevant to the current analysis, with firm level employment in less competitive industries potentially being somewhat less responsive to the reforms.
An alternative measure of competition in three-digit industries in the formal sector is the four firm concentration ratio (CR4), which captures the proportion of each industry’s output that is accounted for by the four largest firms in that industry. The lower the CR4 estimate, the more competitive an industry may be perceived to be, as the largest firms account for a relatively small share of industry output. Conversely, industries with higher CR4 ratios are arguably less competitive, with the largest firms commanding a more substantial market share. The data reveal that the CR4 estimate declined in most (90 per cent of) three-digit manufacturing industries in the 1990–1995 period, which is suggestive of increases in product market competition driven by the economic liberalisation of the 1990s.
I compute the CR4 statistic for every three-digit industry in 1990, with output measured in terms of gross sale values, and run the baseline specification separately for industries with concentration ratios above and below the 1990 median. The results are presented in Table 8. I find that the employment enhancing effects of lower input tariffs apply to firms in both groups of industries in states with inflexible labour markets but hold only for more competitive industries (characterised by a CR4 ratio below the 1990 median) in states with flexible labour markets. The baseline FDI effects are robust only in the case of more competitive industries. Further, in states with flexible labour markets, delicensing is associated with significant increases in firm level employment only in less competitive industries, a finding that I discuss further below.
Further, in Table 9, I undertake industry level regressions separately for industries characterised by higher and lower CR4 ratios as defined for Table 8, to explore whether the results discussed in Section 5.2 are different for these industry groups. The finding that delicensing is associated with a significant ceteris paribus increase in the number of formal firms in the average industry in states with flexible labour markets, holds only for more competitive industries (in other words, industries with lower CR4 ratios). This is supportive of the notion that the effects which I observe in the baseline are driven, at least to some extent, by product market competition.
In Table 9, delicensing is not associated with significant shifts in formal employment and enterprise numbers in less competitive industries. Viewed in light of the results in Table 8, which suggest that delicensing is linked with increased employment in the average firm in less competitive industries, this may be interpreted as a sign of less competitive industries having been more vulnerable to (Melitz 2003) type structural changes, with smaller, less productive formal firms exiting the market following increased competition in the post-reform period. In the absence of a firm level panel, however, caution is warranted in this context.
While I use the CR4 as a baseline measure of intra-industry competition, I also consider two alternative metrics that are often used by market regulators in a number of economies around the globe: the eight-firm concentration ratio (CR8) and the Herfindahl-Hirschman Index (HHI)10. The CR8 is an extension of the CR4 and is defined as the proportion of each industry’s output that is accounted for by the eight largest firms in that industry. The HHI is an alternative indicator of intra-industry competition that is obtained by aggregating the squares of the market shares of all the firms in an industry. It seeks to weight each firm in an industry in proportion to its output share in the industry. The findings discussed in this section are robust to using either the CR8 or the HHI instead of the CR4 (Section 6).

5.5. Composition of Employment

The baseline regressions discussed in Section 5.1 focus on the implications of the economic reforms of the 1990s for overall firm level employment, with paid employment being the key dependent variable. This variable comprises workers who are directly employed by firms, workers hired through contractors (or ‘contract workers’), supervisory and managerial employees and other paid personnel (such as staff working on sales, marketing and administration issues). I proceed to analyse whether the impacts of the reforms differ across these employee categories.
This exercise yields a number of nuanced findings. Given that directly employed male workers tend to account for a majority of paid employees in most firms in the dataset, it is perhaps unsurprising that the baseline results apply most prominently to this group (Table 10, Column 1). Approximately one-third of firms report having directly employed female workers, but the only result of significance for this category is increased employment in firms in states with flexible labour markets, in response to the input tariff declines (Table 10, Column 2).
Although employed by a little less than 20 per cent of firms in the sample, contract workers constitute a case of some interest in this context, as state level labour market laws do not apply to them. As such, firms may have sought to hire more contract workers, relative to direct hires, in the post-reform period. I find that across all states, input tariff declines are not associated with significant shifts in contract employment (Table 10, Column 3). However, FDI reform is associated with a significant rise in the average number of contract workers hired by firms in states with flexible labour markets, with no effect of significance visible in states with inflexible labour markets.
In essence, in states with flexible labour markets, FDI reform is on average associated with increases in the number of directly employed adult male workers and contract workers, as also other staff (Table 10, Column 5), at the firm level. In states with inflexible labour markets, FDI reform is associated with reduced employment of directly hired adult male workers, supervisory or managerial employees and other staff (Table 10, Columns 1, 4 and 5). On the other hand, the baseline employment enhancing effect associated with lower input tariffs is reflected in significant increases in firm level employment of directly hired adult male workers in all states, with no corresponding significance attaching to contract employment.
An additional possibility is that the number of firms employing contract workers or using imported inputs, or both, may have increased in the post-reform period. Saha et al. (2013) find that rises in import penetration in India in the 1998–2004 period went hand-in-hand with increased employment of contract workers, particularly in states with relatively inflexible labour markets. Table 11 examines this question at the industry level and indicates that FDI reform is associated with a significant increase in the number of firms hiring contract labour at the industry level. In line with the firm level results presented in Table 10, this increase is restricted to states with flexible labour markets. No significance attaches to the tariff variables and delicensing, which suggests that the findings of (Saha et al. 2013) may be restricted to the post-1997 period. As regards the number of firms using imported inputs, no significance is visible for any of the reform variables in Table 11.

6. Further Analysis and Robustness Checks

Employment shifts at the firm level in the post-reform period may have varied across industries characterised by different degrees of trade orientation, in terms of export intensity or import competition. The first two columns of Table 12 present results for export-oriented industries and other industries as classified by (Nouroz 2001). In this context, it is important to note that the industries considered by (Nouroz 2001) follow the industry classification used in India’s Input-Output Transactions Table (IOTT) of 1990, which uses broader industry headings relative to the NIC (1987) industry codes, so that over 130 NIC industries correspond to 62 IOTT industry groups (Section 3.2). Nevertheless, in Table 12, I find that the baseline significance attaching to FDI reform is upheld only for firms in industries not classified as being export oriented by (Nouroz 2001). As regards the input tariff coefficients, significance is lost (at the 5 per cent significance level) for firms in export oriented industries but is retained for other industries. In summary, employment in firms in export-oriented industries appear to have been less responsive to the reforms.
As only a fairly small number of industries are classified as being export oriented by (Nouroz 2001), I use data on industrial exports and imports, obtained from India’s IOTT of 1990, to undertake an alternative check in this direction. I compute export-output and import-output ratios for each IOTT industry group and divide the firms in my sample into groups defined by whether these ratios are above or below the median for their industry of operation. The results obtained using this mode of industry grouping are presented in the final four columns of Table 12. As regards export orientation, Columns 3 and 4 of Table 12 confirm that input tariff declines are associated with significant employment shifts in non-export-oriented industries (with export-output ratios falling below the 1990 median). However, the baseline findings associated with FDI reform appear to be restricted to firms in export-oriented industries (with export-output ratios exceeding the 1990 median).
In terms of import-output ratios, I find that all my baseline results of significance hold for industries where these ratios are below the 1990 median (Column 5 and Column 6, Table 12). Conversely, as might be expected, the coefficients attaching to final goods tariffs are larger (although still not statistically significant) in the case of industries with import-output ratios exceeding the 1990 median. This provides further suggestive evidence that collinearity between the final goods and input tariffs reductions is unlikely to be an issue for this study.
As explained in Section 3.2, the tariff declines that were phased in during the initial years of reform (1991–1997) were arguably an exogenous event, although tariff policy endogeneity might be an issue in the post-1997 period, when the pressure to adhere to externally imposed guidelines had waned. Bown and Tovar (2011) present evidence which suggests that political economy considerations acquired considerable importance in the formulation of India’s trade policy in the late 1990s, as opposed to their having been of little relevance to the tariff liberalisation episode of 1991–1997. Although my dataset focuses on employment shifts in the 1990–1997 period, I explore whether tariff endogeneity poses problems for my results in a number of ways.
First, I regress final goods and input tariffs on lagged industry level employment (in logarithmic and absolute terms) and lagged industry employment shares for the formal sector in alternative specifications, including year and industry fixed effects throughout. The time lags used vary over one to three years. In all instances, as demonstrated in Table A1 in the Appendix A, there is no evidence of any association between formal industry employment levels and tariff rates in later years.
Second, I run separate regressions of the changes in final goods and input tariffs on the lagged changes in formal industry level paid employment, including period and industry fixed effects throughout. As evidenced in Table A2 in the Appendix A, there is no significant association between changes in formal employment and tariff changes in subsequent periods. Topalova and Khandelwal (2011) report that the changes in final goods tariffs and input tariffs in the 1987–1997 period are not significantly associated with a wide range of 1987 formal industry characteristics, including log employment, log output and the capital-to-labour ratio. In Table A2, I also confirm that the period-to-period final goods and input tariff changes are not correlated with pre-existing formal industry employment levels.
As an additional check, I dropped two industries that were highly protected in the pre-reform period, yet were subjected to visibly low tariff declines relative to other industries with comparably high tariff rates in the 1991–1997 period. Figure 2a in Section 3.2 suggests that some endogeneity may have seeped into tariff policy as regards these two industries even in the face of the IMF backed reforms of 1991, given that the high degree of tariff protection enjoyed by these industries in the pre-reform period was relaxed to a lesser extent in the reform years relative to other industries with comparably high pre-reform tariffs. Column 2 of Table 13 reveals that the omission of these outliers leaves the baseline results virtually unchanged in terms of both magnitude and significance (the comparison is with the figures presented in Table 5, Column 3, which are reproduced in Column 1 of Table 13 for convenience).
To assess whether my results are influenced by state level, time varying characteristics other than the flexibility of labour market regulation (such as income and population levels, for instance), I run a regression in which I add state-year interaction fixed effects to my baseline specification. The results, presented in Column 3 of Table 13, indicate that all the baseline results are similar in magnitude and significance following the addition of these interactions. This suggests that the baseline statistical significance of the interplay between the reforms and labour market flexibility is retained after accounting for other state level trends.
Next, as an initial round of delicensing had been undertaken for some industries in 1985–1986 (Section 2.2), it could be argued that these firms in these industries may have responded differently to the reforms of the 1990s. I therefore examine whether the results differ for firms in industries that were delicensed by 1986, as opposed to the remainder (a large majority of which were delicensed in 1991). The key baseline results for input tariff declines hold for both groups of industries (Column 2 and Column 3, Table 14). However, I find that FDI liberalisation had a significant effect on employment in formal firms only in industries that were delicensed by 1986. This may be suggestive of the chronology of different reform measures being relevant to future, longer run analyses of reform impacts.
In light of recent work by (Haltiwanger et al. 2013) that suggests that young firms may be likely to grow faster than older firms in general, I proceed to include a control for firm age, captured in terms of the number of years of operation reported by the firms surveyed in my dataset (Column 4, Table 14). While this variable is subject to some measurement error, I find that my findings are robust to its inclusion. Further, using either of the ‘FLEX 1’ or ‘FLEX 3’ variables discussed in Section 3.3 as an index of state level labour market flexibility, instead of the ‘FLEX 2’ indicator used in the baseline, does not lead to substantial changes in the results (Column 5 and Column 6, Table 14). While these measures are positively correlated, it is reassuring to note that the headline findings do not hinge on the use of a particular measure.
In all of the results presented so far in this paper, the reform measures have been lagged by two years. In Table 15, I examine the extent to which the baseline figures in Table 5 (Column 3) are affected if a one-year or three-year lag is used instead of a two-year lag. Columns 2 and 3 of Table 15 suggest that these modifications yield figures that are similar in magnitude and significance to the baseline numbers. Further, the exclusion of any one of the post-reform cross-sections that I use also leaves the baseline findings largely unchanged (Table 15, Columns 4 to 6), which indicates that the results discussed in Section 5.1 are not heavily reliant on retaining a specific post-reform survey sample in the dataset.
Results deriving from a battery of supplementary checks are presented in the Appendix A. First, Column 2 of Table A3 shows that the baseline findings are robust to changing the ‘FLEX 2’ indicator value for Delhi and Jammu & Kashmir from 0 to 1 (following the discussion in Section 3.1). Second, Column 3 of Table A3 shows that dropping formal firms that report having fewer than ten paid employees did not affect the headline estimates. Third, Column 4 of Table A3 establishes that including formal firms that report zero or missing values for raw material use and/or physical product manufacturing does not affect the baseline results. Fourth, as stated in Section 3.2, I find that the input tariff coefficients lose statistical significance, although their signs are unchanged, if input tariffs based only on manufacturing industry final goods tariffs are used instead of the baseline input tariffs, which are based on final goods tariffs applying to both manufacturing and non-manufacturing industries (Column 5, Table A3). This is arguably only a minor concern in the context of the current study, as the baseline input tariffs are a more comprehensive measure of input costs given that they account for changes in the real prices of non-manufacturing industry inputs, especially as regards agricultural goods, while the alternative ‘manufacturing only’ input tariffs do not account for the same. Topalova (2010) presents evidence that India’s final goods tariffs on agricultural products excepting cereals and oilseeds were slashed in tandem with the manufacturing industry tariff cuts of the 1990s. This suggests that a measure of manufacturing sector input tariffs that accounts for real price changes in agricultural markets is preferable to an alternative that fails to do so.
Furthermore, Nataraj (2011) notes that while India’s tariff reductions were applied virtually to the entire manufacturing sector in the 1990s, non-tariff barriers (such as import licensing) were relaxed more selectively, with protection for consumer goods being maintained for a longer period. In Column 2 and Column 3 of Table A4, I explore whether the baseline findings differ for firms in consumer and capital (or basic) goods industries, as classified in Nouroz (2001). The significance of the input tariff effects is robust for both groups of industries across all states. However, in states with flexible labour markets, these effects are substantially stronger for firms in capital goods industries, which may be attributable to the simultaneous dismantling of tariff and non-tariff barriers in these industries. Interestingly, FDI reform significantly associates with employment shifts only in consumer goods industries, which may be an artefact of the sequencing of FDI liberalisation in India in the 1990s.
Goldberg et al. (2010) document that India’s trade reforms, in particular the lowering in imported input prices, led to an increase in output in the manufacturing sector on account of firms using a wider range of inputs. As this effect may have been stronger for multi-product manufacturers, I examine whether employment impacts are stronger for these firms, as opposed to single product manufacturers (Column 4 and Column 5, Table A4). This reveals that the baseline results are indeed stronger for firms manufacturing multiple products, which is in line with the findings of (De Loecker et al. 2016). In addition, I confirm that my findings are driven by firms that are wholly privately owned, which comprise over 90 per cent of the sample (Column 6 and Column 7, Table A4). Following Aghion et al. (2008), I also establish that dropping individual states from the analysis leaves the baseline findings largely unchanged in magnitude and significance (Table A5, Table A6 and Table A7).
Finally, following the discussion in Section 5.4, I examine the robustness of the findings regarding variations in intra-industry product market competition to the use of two alternative metrics of this competition, the CR8 and the HHI (outlined in Section 5.4). Table A8 and Table A9 show that the results yielded by the use of these metrics are very similar to those deriving from the use of the CR4 (presented in Table 8 and Table 9).

7. Discussion and Conclusions

This paper exploits the initiation of a quasi-exogenous round of tariff liberalisation and concurrent domestic policy reform to examine changes in employment in formal Indian manufacturing firms in the 1990s. Using repeated cross-sections of firm survey data, it also analyses the extent to which differences in state level labour market flexibility influence these changes. To my knowledge, this is the first firm-level analysis of the employment impacts associated with the Indian reforms of the 1990s.
The results point to input tariff declines and FDI reform, hitherto virtually ignored by the literature exploring post-liberalisation employment shifts, being associated with significant employment shifts in formal firms. Lower input tariffs are associated with employment gains across all states, with the average formal firm hiring more directly employed workers following declines tariffs in input supplying industries. FDI reform is, on average, associated with reduced employment in firms in states with inflexible labour markets, with this reduction visible across all categories of permanent (non-contract based) employment. On the other hand, in states with flexible labour markets, FDI reform is associated with increments in firm level employment, encompassing directly employed workers as well as contract workers. At a broader, industry level, the delicensing reform is associated with significant increases in formal firm numbers, only in states with flexible labour markets.
In summary, India’s import tariff reductions in the 1990s affected formal firm level employment more on account of cheaper input costs benefiting manufacturers across the country, as opposed to effects driven by changes in final goods tariffs. The latter could be surmised to be more dependent on responses from existing and potential importers, which might undergo a longer run transition. Future research could examine this question further, in addition to probing the implications for FDI policy reform for longer term FDI inflows and their employment implications.
The evidence is supportive of the baseline results being driven by product market competition within the formal sector. Both the firm and industry level findings are robust in magnitude and significance for industries characterised as being more competitive. In particular, the employment changes associated with delicensing and FDI reform tend to be restricted to more competitive industries, highlighting the relevance of competition to structural change and, potentially, improved formal sector productivity in the longer run. While other mechanisms such as value chain linkages involving formal (and possibly informal) businesses may also have a role to play, they are beyond the scope of the current study and dataset and may be valuable areas for further research.
The results of this study derive from a dataset that shows evidence of robustness, as regards employment shifts, to tariff endogeneity concerns. They retain significance following minor changes to the baseline time lag and dataset composition (in terms of the inclusion or omission of specific post-reform survey cross-sections). There is some evidence that the employment enhancing effects associated with reductions in input tariffs are more prominent in industries that are relatively less export oriented and import intensive. This may be indicative of vertical linkages or agglomeration externalities that operate across industries characterised by varying degrees of trade orientation, although that is also an area for future research.
As policy makers in developing economies tend to emphasise increases in formal employment as a key goal of economic liberalisation, these findings are of general interest. They contribute to the growing literature examining the role of interactions between India’s 1991 reforms and variations in domestic state level institutional characteristics in driving post-reform economic outcomes. The results highlight that an analysis of the implications of economic reform for firm level employment is incomplete unless shifts in input tariffs and variations in regional labour market flexibility are accounted for. They strongly indicate that a consideration of the impacts of economic reform on the formal sector continues to be a highly relevant research question, notwithstanding the persistent primacy of informality in developing economy labour markets.

Funding

This research received no external funding.

Acknowledgments

The author gratefully acknowledges feedback received from Dimitra Petropoulou, Andrew Newell, and Amalavoyal Chari in particular, and more generally from faculty and research students at the University of Sussex, and funding received from the Department of Economics of the University of Sussex for purchasing survey data from the Government of India. In addition, the author is grateful to Shanthi Nataraj of the RAND Corporation for sharing her data on India’s manufacturing import tariff rates, delicensing and FDI reforms, and for providing guidance and clarification on a number of issues of relevance to this study. The author also appreciates constructive feedback offered by a large number of participants at the DEGIT XX Conference 2015 in Geneva, the European Trade Study Group (ETSG) Conference 2015 in Paris, the Royal Economic Society (RES) Conference 2015 in Manchester, and the 14th Global Economic Policy (GEP) Annual Postgraduate Conference 2015 in Nottingham.

Conflicts of Interest

The author declares no conflict of interest.

Appendix A

Table A1. Tariff endogeneity check—regression of tariffs on lagged formal industry employment.
Period (Dependent Variable)t + 1t + 2t + 3
Dependent variable: Final goods tariffs
ln (Formal employment—paid)0.0058100.0177250.025388
(0.061842)(0.023411)(0.019702)
ln (Formal employment—total)0.0045610.0198720.023948
(0.061523)(0.022773)(0.019359)
Absolute formal employment (paid)−0.0000000.0000000.000001
(0.000000)(0.000000)(0.000000)
Share of formal employment (paid)−4.120364 *−0.7501200.803087
(1.600927)(0.924981)(0.895980)
Dependent variable: Input tariffs
ln (Formal employment—paid)−0.0369290.000577−0.000784
(0.031397)(0.008518)(0.006740)
ln (Formal employment—total)−0.0326530.002355−0.000268
(0.029948)(0.008517)(0.006744)
Absolute formal employment (paid)−0.000000−0.000000−0.000000
(0.000000)(0.000000)(0.000000)
Share of formal employment (paid)−6.129283 **−0.7455110.048776
(2.239942)(0.534617)(0.513832)
The independent variables are measured in period t. All specifications include period and industry fixed effects. Standard errors, in parentheses, are robust to heteroscedasticity. **: Significant at 5% *: Significant at 10%.
Table A2. Tariff endogeneity check—regression of changes in tariffs on lagged changes in formal employment (industry level).
Period (Dependent Variable)t + 1t + 2t + 3
Dependent variable: Change in final goods tariffs
Change in ln (formal employment)0.0975080.0577360.022285
(0.076559)(0.044515)(0.035028)
ln (formal employment)0.219995 *0.0970650.074310
(0.107854)(0.057578)(0.057011)
Change in absolute formal employment0.0000010.0000010.000001 *
(0.000001)(0.000001)(0.000000)
Absolute formal employment0.000002 **0.000001 *0.000002 *
(0.000001)(0.000001)(0.000001)
Dependent variable: Change in input tariffs
Change in ln (formal employment)0.0191530.014280−0.001239
(0.024563)(0.015291)(0.010634)
ln (formal employment)0.069189 *0.0039840.007497
(0.031352)(0.016301)(0.013051)
Change in absolute formal employment0.000001 *0.0000000.000000
(0.000001)(0.000000)(0.000000)
Absolute formal employment0.000002−0.000000−0.000000
(0.000001)(0.000000)(0.000000)
The independent variables are measured in period t. All specifications include period and industry fixed effects. Standard errors, in parentheses, are robust to heteroscedasticity. **: Significant at 5% *: Significant at 10%.
Table A3. Economic reforms, labour market flexibility and employment in formal firms (1990–1997): Additional robustness checks—I.
BaselineChange in ‘FLEX 2’ Value for Delhi and Jammu & Kashmir (0 to 1)Excluding Firms with Fewer Than Ten Paid EmployeesIncluding Firms Reporting Zero or No Value for Raw Material Use/Physical ProductsUsing Input Tariffs Based on Final Goods Tariffs for Manufacturing Industries Only
Final goods tariffs−0.020−0.0180.059−0.007−0.130 *
(0.075)(0.081)(0.054)(0.075)(0.076)
Final goods tariffs * FLEX 20.1320.1220.0390.1180.199 *
(0.115)(0.119)(0.084)(0.114)(0.115)
Input tariffs−0.680 ***−0.703 ***−0.656 ***−0.720 ***−0.059
(0.211)(0.218)(0.191)(0.215)(0.187)
Input tariffs * FLEX 20.0210.0560.1890.028−0.162
(0.216)(0.222)(0.193)(0.216)(0.149)
Delicensing0.0840.0890.0720.0810.073
(0.061)(0.066)(0.048)(0.061)(0.063)
Delicensing * FLEX 2−0.098−0.099−0.048−0.086−0.119
(0.083)(0.085)(0.067)(0.085)(0.087)
FDI reform−0.115 **−0.103 **−0.080 **−0.107 **−0.090 *
(0.045)(0.048)(0.035)(0.046)(0.047)
FDI reform * FLEX 20.208 ***0.178 ***0.140 ***0.206 ***0.192 ***
(0.067)(0.069)(0.051)(0.067)(0.068)
Flexible labour markets: Effects of changes in final goods tariffs
Row 1 + Row 20.1110.1040.0980.1110.069
Standard Error0.0630.0610.0460.0620.062
p-value (combined effect = 0)0.0780.0880.0350.0750.268
Flexible labour markets: Effects of changes in input tariffs
Row 3 + Row 4−0.659−0.646−0.468−0.692−0.221
Standard Error0.1990.1950.1810.2020.176
p-value (combined effect = 0)0.0010.0010.0100.0010.209
Flexible labour markets: Effects of delicensing
Row 5 + Row 6−0.013−0.0100.025−0.005−0.046
Standard Error0.0360.0340.0290.0380.039
p-value (combined effect = 0)0.7070.7810.4000.8960.238
Flexible labour markets: Effects of FDI reform
Row 7 + Row 80.0930.0750.0600.0990.102
Standard Error0.0390.0380.0270.0390.039
p-value (combined effect = 0)0.0170.0470.0270.0110.010
State FEYesYesYesYesYes
Year FEYesYesYesYesYes
Industry FEYesYesYesYesYes
Observations160,883160,883131,147163,921160,883
R-squared0.2050.2050.2010.2030.205
Dependent variable: natural logarithm of number of paid employees ‘FE’ denotes fixed effects. Standard errors, in brackets, are clustered at the state-industry level. ***: Significant at 1% **: Significant at 5% *: Significant at 10%.
Table A4. Economic reforms, labour market flexibility and employment in formal firms (1990–1997): Additional robustness checks—II.
Baseline (All Firms)Consumer Goods IndustriesBasic/Capital/Intermediate Goods IndustriesSingle Product FirmsMulti-Product FirmsFirms That Are Fully Privately OwnedFirms That Are Not Fully Privately Owned
Final goods tariffs−0.0200.031−0.0100.0420.035−0.0700.078
(0.075)(0.083)(0.080)(0.057)(0.089)(0.077)(0.126)
Final goods tariffs * FLEX 20.1320.0730.198−0.0330.1400.1780.037
(0.115)(0.119)(0.136)(0.076)(0.142)(0.121)(0.143)
Input tariffs−0.680 ***−0.667 **−0.623 **−0.407−1.317 ***−0.537 ***−0.554
(0.211)(0.295)(0.265)(0.248)(0.265)(0.206)(0.472)
Input tariffs * FLEX 20.021−0.022−0.460 *−0.1410.417−0.070−0.080
(0.216)(0.298)(0.244)(0.233)(0.272)(0.211)(0.348)
Delicensing0.0840.183 *−0.095 *0.1480.0110.100−0.063
(0.061)(0.096)(0.051)(0.095)(0.051)(0.066)(0.076)
Delicensing * FLEX 2−0.098−0.1890.068−0.253 *−0.004−0.0990.011
(0.083)(0.128)(0.067)(0.140)(0.059)(0.089)(0.081)
FDI reform−0.115 **−0.136 **0.015−0.049−0.092 *−0.108 **0.185 **
(0.045)(0.067)(0.046)(0.050)(0.048)(0.046)(0.093)
FDI reform * FLEX 20.208 ***0.338 ***−0.0430.0060.281 ***0.218 ***−0.278 **
(0.067)(0.097)(0.046)(0.056)(0.075)(0.068)(0.127)
Flexible labour markets: Effects of changes in final goods tariffs
Row 1 + Row 20.1110.1040.1880.0100.1740.1080.115
Standard Error0.0630.0700.0980.0600.0830.0670.106
p-value (combined effect = 0)0.0780.1390.0560.8740.0350.1060.279
Flexible labour markets: Effects of changes in input tariffs
Row 3 + Row 4−0.659−0.689−1.083−0.548−0.900−0.606−0.634
Standard Error0.1990.2790.3050.2490.2360.2010.496
p-value (combined effect = 0)0.0010.0140.0000.0280.0000.0030.202
Flexible labour markets: Effects of delicensing
Row 5 + Row 6−0.013−0.006−0.027−0.1050.0070.001−0.052
Standard Error0.0360.0500.0410.0610.0400.0380.081
p-value (combined effect = 0)0.7070.9010.5030.0870.8540.9810.523
Flexible labour markets: Effects of FDI reform
Row 7 + Row 80.0930.202−0.028−0.0420.1890.110−0.093
Standard Error0.0390.0580.0410.0420.0480.0400.095
p-value (combined effect = 0)0.0170.0000.4970.3100.0000.0060.328
State FEYesYesYesYesYesYesYes
Year FEYesYesYesYesYesYesYes
Industry FEYesYesYesYesYesYesYes
Observations160,88396,94763,93659,16483,640150,34710,536
R-squared0.2050.2360.1460.1980.2430.1890.400
Dependent variable: natural logarithm of number of paid employees ‘FE’ denotes fixed effects. Standard errors, in brackets, are clustered at the state-industry level. ***: Significant at 1% **: Significant at 5% *: Significant at 10%.
Table A5. Economic reforms, labour market flexibility and employment in formal firms (1990–1997): Excluding individual states (I).
Excluding:
Baseline (All Firms)Jammu & KashmirPunjabHaryanaDelhiRajasthanUttar Pradesh
Final goods tariffs−0.020−0.0200.0430.007−0.028−0.034−0.042
(0.075)(0.076)(0.066)(0.079)(0.079)(0.075)(0.090)
Final goods tariffs * FLEX 20.1320.1310.0290.0830.1350.1470.153
(0.115)(0.116)(0.093)(0.117)(0.119)(0.117)(0.130)
Input tariffs−0.680 ***−0.676 ***−0.685 ***−0.717 ***−0.714 ***−0.605 ***−0.620 ***
(0.211)(0.212)(0.211)(0.217)(0.218)(0.212)(0.239)
Input tariffs * FLEX 20.0210.0170.0450.1020.047−0.042−0.062
(0.216)(0.218)(0.206)(0.218)(0.223)(0.221)(0.238)
Delicensing0.0840.0840.0700.0840.0940.0820.114 *
(0.061)(0.062)(0.064)(0.065)(0.065)(0.061)(0.068)
Delicensing * FLEX 2−0.098−0.097−0.084−0.092−0.102−0.104−0.116
(0.083)(0.083)(0.086)(0.086)(0.086)(0.085)(0.084)
FDI reform−0.115 **−0.115 **−0.095 *−0.129 ***−0.109 **−0.109 **−0.121 **
(0.045)(0.046)(0.049)(0.048)(0.048)(0.045)(0.057)
FDI reform * FLEX 20.208 ***0.206 ***0.153 **0.221 ***0.202 ***0.198 ***0.216 ***
(0.067)(0.067)(0.062)(0.070)(0.069)(0.068)(0.079)
Flexible labour markets: Effects of changes in final goods tariffs
Row 1 + Row 20.1110.1110.0720.0910.1070.1130.110
Standard Error0.0630.0630.0550.0620.0630.0660.065
p-value (combined effect = 0)0.0780.0810.1880.1450.0900.0850.087
Flexible labour markets: Effects of changes in input tariffs
Row 3 + Row 4−0.659−0.658−0.641−0.615−0.666−0.646−0.682
Standard Error0.1990.2000.2010.2010.2010.2070.207
p-value (combined effect = 0)0.0010.0010.0010.0020.0010.0020.001
Flexible labour markets: Effects of delicensing
Row 5 + Row 6−0.013−0.014−0.013−0.008−0.008−0.022−0.002
Standard Error0.0360.0360.0360.0360.0350.0380.033
p-value (combined effect = 0)0.7070.7020.7110.8310.8180.5570.961
Flexible labour markets: Effects of FDI reform
Row 7 + Row 80.0930.0910.0580.0920.0920.0890.094
Standard Error0.0390.0390.0340.0390.0390.0400.039
p-value (combined effect = 0)0.0170.0190.0830.0180.0180.0270.016
State FEYesYesYesYesYesYesYes
Year FEYesYesYesYesYesYesYes
Industry FEYesYesYesYesYesYesYes
Observations160,883160,075151,784154,624155,381154,261144,998
R-squared0.2050.2060.2120.2080.2080.2070.198
Dependent variable: natural logarithm of number of paid employees ‘FE’ denotes fixed effects. Standard errors, in brackets, are clustered at the state-industry level. ***: Significant at 1% **: Significant at 5% *: Significant at 10%.
Table A6. Economic reforms, labour market flexibility and employment in formal firms (1990–1997): Excluding individual states (II).
Excluding:
Baseline (All Firms)BiharAssamWest BengalOrissaMadhya PradeshGujarat
Final goods tariffs−0.020−0.016−0.033−0.064−0.027−0.036−0.038
(0.075)(0.080)(0.076)(0.087)(0.079)(0.081)(0.072)
Final goods tariffs * FLEX 20.1320.1470.1540.1820.1370.1490.117
(0.115)(0.119)(0.115)(0.127)(0.118)(0.121)(0.119)
Input tariffs−0.680 ***−0.754 ***−0.685 ***−0.690 ***−0.653 ***−0.643 ***−0.591 ***
(0.211)(0.216)(0.213)(0.225)(0.216)(0.223)(0.214)
Input tariffs * FLEX 20.0210.018−0.016−0.0050.0160.0380.125
(0.216)(0.221)(0.215)(0.228)(0.219)(0.223)(0.224)
Delicensing0.0840.0910.0980.0900.0770.0950.084
(0.061)(0.063)(0.064)(0.067)(0.063)(0.065)(0.061)
Delicensing * FLEX 2−0.098−0.091−0.117−0.098−0.088−0.110−0.107
(0.083)(0.083)(0.084)(0.087)(0.084)(0.087)(0.088)
FDI reform−0.115 **−0.133 ***−0.125 ***−0.124 **−0.126 ***−0.133 ***−0.128 ***
(0.045)(0.047)(0.046)(0.051)(0.046)(0.049)(0.043)
FDI reform * FLEX 20.208 ***0.239 ***0.216 ***0.215 ***0.219 ***0.237 ***0.252 ***
(0.067)(0.068)(0.067)(0.073)(0.068)(0.071)(0.070)
Flexible labour markets: Effects of changes in final goods tariffs
Row 1 + Row 20.1110.1300.1210.1180.1100.1130.079
Standard Error0.0630.0640.0630.0640.0630.0650.071
p-value (combined effect = 0)0.0780.0400.0570.0660.0810.0810.263
Flexible labour markets: Effects of changes in input tariffs
Row 3 + Row 4−0.659−0.736−0.701−0.695−0.637−0.606−0.467
Standard Error0.1990.2010.2010.2040.2010.2050.204
p-value (combined effect = 0)0.0010.0000.0000.0010.0020.0030.023
Flexible labour markets: Effects of delicensing
Row 5 + Row 6−0.013−0.000−0.018−0.008−0.011−0.015−0.023
Standard Error0.0360.0350.0360.0360.0360.0360.041
p-value (combined effect = 0)0.7070.9970.6050.8270.7520.6740.575
Flexible labour markets: Effects of FDI reform
Row 7 + Row 80.0930.1060.0910.0910.0940.1040.125
Standard Error0.0390.0380.0390.0390.0390.0390.044
p-value (combined effect = 0)0.0170.0060.0190.0200.0170.0080.004
State FEYesYesYesYesYesYesYes
Year FEYesYesYesYesYesYesYes
Industry FEYesYesYesYesYesYesYes
Observations160,883156,478157,852153,119157,954154,757144,400
R-squared0.2050.2060.1980.2070.2030.2070.207
Dependent variable: natural logarithm of number of paid employees ‘FE’ denotes fixed effects. Standard errors, in brackets, are clustered at the state-industry level. ***: Significant at 1% **: Significant at 5% *: Significant at 10%.
Table A7. Economic reforms, labour market flexibility and employment in formal firms (1990–1997): Excluding individual states (III).
Excluding:
Baseline (All Firms)MaharashtraAndhra PradeshKarnatakaKeralaTamil Nadu
Final goods tariffs−0.020−0.013−0.011−0.016−0.033−0.004
(0.075)(0.072)(0.071)(0.075)(0.078)(0.066)
Final goods tariffs * FLEX 20.1320.1330.1610.1330.1430.128
(0.115)(0.124)(0.118)(0.119)(0.117)(0.104)
Input tariffs−0.680 ***−0.713 ***−0.751 ***−0.716 ***−0.609 ***−0.569 ***
(0.211)(0.216)(0.213)(0.214)(0.212)(0.195)
Input tariffs * FLEX 20.0210.1260.0230.037−0.004−0.250
(0.216)(0.237)(0.220)(0.225)(0.215)(0.215)
Delicensing0.0840.0770.0130.0980.0960.084
(0.061)(0.066)(0.050)(0.063)(0.062)(0.062)
Delicensing * FLEX 2−0.098−0.101−0.026−0.107−0.123−0.115
(0.083)(0.098)(0.071)(0.087)(0.080)(0.091)
FDI reform−0.115 **−0.089 **−0.113 ***−0.110 **−0.084 **−0.096 **
(0.045)(0.043)(0.042)(0.044)(0.042)(0.044)
FDI reform * FLEX 20.208 ***0.218 ***0.185 ***0.204 ***0.161 **0.162 **
(0.067)(0.072)(0.067)(0.068)(0.064)(0.067)
Flexible labour markets: Effects of changes in final goods tariffs
Row 1 + Row 20.1110.1200.1490.1170.1100.124
Standard Error0.0630.0770.0680.0680.0630.067
p-value (combined effect = 0)0.0780.1190.0280.0850.0810.065
Flexible labour markets: Effects of changes in input tariffs
Row 3 + Row 4−0.659−0.587−0.728−0.679−0.613−0.819
Standard Error0.1990.2210.2080.2090.1920.227
p-value (combined effect = 0)0.0010.0080.0000.0010.0010.000
Flexible labour markets: Effects of delicensing
Row 5 + Row 6−0.013−0.025−0.012−0.010−0.028−0.031
Standard Error0.0360.0450.0360.0380.0340.045
p-value (combined effect = 0)0.7070.5830.7300.8030.4230.494
Flexible labour markets: Effects of FDI reform
Row 7 + Row 80.0930.1290.0720.0950.0770.066
Standard Error0.0390.0470.0410.0400.0390.045
p-value (combined effect = 0)0.0170.0060.0820.0200.0480.142
State FEYesYesYesYesYesYes
Year FEYesYesYesYesYesYes
Industry FEYesYesYesYesYesYes
Observations160,883138,989146,228151,390153,984137,854
R-squared0.2050.2130.2100.2060.2040.209
Dependent variable: natural logarithm of number of paid employees ‘FE’ denotes fixed effects. Standard errors, in brackets, are clustered at the state-industry level. ***: Significant at 1% **: Significant at 5% *: Significant at 10%.
Table A8. Economic reforms, labour market flexibility and employment in formal firms (1990–1997): Analysis based on the eight firm concentration ratio (CR8) and the Herfindahl-Hirschman Index (HHI) in 1990.
Baseline (All Firms)Firms in Industries with CR8 above Median in 1990
(Less Competitive)
Firms in Industries with CR8 below Median in 1990
(More Competitive)
Firms in Industries with HHI Above Median in 1990
(Less Competitive)
Firms in Industries with HHI below Median in 1990
(More Competitive)
Final goods tariffs−0.0200.193 **−0.1150.231 **−0.054
(0.075)(0.076)(0.099)(0.109)(0.083)
Final goods tariffs * FLEX 20.132−0.1140.257 *−0.1350.156
(0.115)(0.077)(0.155)(0.127)(0.127)
Input tariffs−0.680 ***−0.892 **−0.530 **−0.942 **−0.621 ***
(0.211)(0.441)(0.247)(0.438)(0.231)
Input tariffs * FLEX 20.0210.842 ***−0.1600.868 **−0.018
(0.216)(0.277)(0.273)(0.341)(0.236)
Delicensing0.084−0.0680.093−0.0610.094
(0.061)(0.065)(0.069)(0.064)(0.071)
Delicensing * FLEX 2−0.0980.236 ***−0.1280.215 ***−0.132
(0.083)(0.073)(0.095)(0.073)(0.097)
FDI reform−0.115 **−0.089−0.120 **−0.093−0.125 **
(0.045)(0.069)(0.049)(0.067)(0.050)
FDI reform * FLEX 20.208 ***0.174 *0.219 ***0.186 **0.224 ***
(0.067)(0.095)(0.071)(0.093)(0.073)
Flexible labour markets: Effects of changes in final goods tariffs
Row 1 + Row 20.111 *0.0790.1420.0960.102
Standard Error0.0630.0860.0820.1130.070
p-value (combined effect = 0)0.0780.3610.0840.3980.145
Flexible labour markets: Effects of changes in input tariffs
Row 3 + Row 4−0.659 ***−0.050−0.690−0.075−0.639
Standard Error0.1990.4310.2330.4110.225
p-value (combined effect = 0)0.0010.9080.0030.8560.005
Flexible labour markets: Effects of delicensing
Row 5 + Row 6−0.0130.168−0.0360.154−0.037
Standard Error0.0360.0570.0410.0560.042
p-value (combined effect = 0)0.7070.0030.3840.0060.371
Flexible labour markets: Effects of FDI reform
Row 7 + Row 80.093 **0.0850.0980.0930.100
Standard Error0.0390.0750.0430.0730.043
p-value (combined effect = 0)0.0170.2600.0210.2000.020
State FEYesYesYesYesYes
Year FEYesYesYesYesYes
Industry FEYesYesYesYesYes
Observations160,88323,709137,17424,376136,507
R-squared0.2050.2170.2050.2040.207
Dependent variable: natural logarithm of number of paid employees ‘FE’ denotes fixed effects. Standard errors, in brackets, are clustered at the state-industry level. ***: Significant at 1% **: Significant at 5% *: Significant at 10%.
Table A9. Economic reforms and formal sector employment: Industry level effects for firm numbers (1990–1997) based on the eight firm concentration ratio (CR8) and the Herfindahl-Hirschman Index (HHI) in 1990.
A: All StatesDependent Variable: ln (Number of Formal Firms in Three-Digit Industry)
All IndustriesIndustries with CR8 above Median in 1990
(Less Competitive)
Industries with CR8 below Median in 1990
(More Competitive)
Industries with HHI above Median in 1990
(Less Competitive)
Industries with HHI below Median in 1990
(More Competitive)
Final goods tariffs−0.0570.026−0.0600.091−0.064
(0.045)(0.066)(0.057)(0.076)(0.055)
Input tariffs0.151−0.881 *0.201−0.884 *0.204
(0.249)(0.481)(0.294)(0.466)(0.296)
Delicensing0.079 **−0.0110.096 **−0.0410.096 **
(0.036)(0.069)(0.044)(0.076)(0.045)
FDI reform0.0190.0160.0180.0260.018
(0.034)(0.057)(0.038)(0.057)(0.038)
Observations556256300260296
R-squared0.3790.1590.4580.1740.457
B: States with flexible labour markets (FLEX 2 = 1)
Final goods tariffs−0.068−0.088−0.045−0.027−0.053
(0.059)(0.073)(0.072)(0.081)(0.070)
Input tariffs0.003−0.845−0.059−0.862 *−0.058
(0.300)(0.537)(0.368)(0.509)(0.367)
Delicensing0.086 **−0.0100.110 **−0.0360.113 **
(0.042)(0.079)(0.052)(0.084)(0.052)
FDI reform−0.005−0.027−0.011−0.021−0.011
(0.036)(0.079)(0.041)(0.077)(0.042)
Observations520228292232288
R-squared0.3860.1560.4660.1470.471
C: States with inflexible labour markets (FLEX 2 = 0)
Final goods tariffs−0.0410.131−0.0640.158−0.062
(0.052)(0.085)(0.064)(0.129)(0.061)
Input tariffs0.271−0.6820.362−0.6840.362
(0.291)(0.535)(0.325)(0.576)(0.325)
Delicensing0.045−0.0050.055−0.0110.050
(0.037)(0.084)(0.042)(0.099)(0.042)
FDI reform0.0520.133 *0.0450.133 *0.045
(0.038)(0.072)(0.041)(0.077)(0.041)
Observations484188296192292
R-squared0.1690.1010.2210.1110.215
Dependent variable: natural logarithm of industry level number of formal enterprises All regressions include a constant and industry and year fixed effects and are weighted by pre-reform (1990) levels of the dependent variable. Standard errors, in brackets, are robust to heteroscedasticity. **: Significant at 5% *: Significant at 10%.

References

  1. Aghion, Philippe, Robin Burgess, Stephen J. Redding, and Fabrizio Zilibotti. 2008. The Unequal Effects of Liberalization: Evidence from Dismantling the License Raj in India. American Economic Review 98: 1397–412. [Google Scholar] [CrossRef]
  2. Ahsan, Reshad. 2013. Input Tariffs, Speed of Contract Enforcement, and the Productivity of Firms in India. Journal of International Economics 90: 181–92. [Google Scholar] [CrossRef]
  3. Ahsan, Ahmed, and Carmen Pagés. 2009. Are All Labor Regulations Equal? Evidence from Indian Manufacturing. Journal of Comparative Economics 37: 62–75. [Google Scholar] [CrossRef]
  4. Alessandrini, Michele, Bassam Fattouh, Benno Ferrarini, and Pasquale Scaramozzino. 2011. Tariff Liberalization and Trade Specialization: Lessons from India. Journal of Comparative Economics 39: 499–513. [Google Scholar] [CrossRef]
  5. Amirapu, Amrit, and Michael Gechter. 2017. Labor Regulations and the Cost of Corruption: Evidence from the Indian Firm Size Distribution. IED Working Paper No. 266. The Review of Economics and Statistics. accepted. [Google Scholar]
  6. Amiti, Mary, and Jozef Konings. 2007. Trade Liberalization, Intermediate Inputs, and Productivity: Evidence from Indonesia. American Economic Review 97: 1611–38. [Google Scholar] [CrossRef]
  7. Anant, T. C. A., Rana Hasan, Prabhu Mohapatra, Rayaprolu Nagaraj, and S. K. Sasikumar. 2006. Labor Markets in India: Issues and Perspectives. In Labor Markets in Asia: Issues and Perspectives. London: Palgrave Macmillan, pp. 205–300. [Google Scholar]
  8. Besley, Tim, and Robin Burgess. 2004. Can Labor Regulation Hinder Economic Performance? Evidence from India. The Quarterly Journal of Economics 119: 91–134. [Google Scholar] [CrossRef]
  9. Bhattacharjea, Aditya. 2006. Labour Market Regulation and Industrial Performance in India: A Critical Review of the Empirical Evidence. Indian Journal of Labour Economics 49: 211–32. [Google Scholar]
  10. Bosch, Mariano, Edwin Goni, and William Maloney. 2007. The Determinants of Rising Informality in Brazil: Evidence from Gross Worker Flows. Policy Research Working Papers. The World Bank. Available online: http://elibrary.worldbank.org/doi/book/10.1596/1813-9450-4375 (accessed on 4 April 2019).
  11. Botero, Juan C., Simeon Djankov, Rafael La Porta, Florencio Lopez-de-Silanes, and Andrei Shleifer. 2004. The Regulation of Labor. The Quarterly Journal of Economics 119: 1339–82. [Google Scholar] [CrossRef]
  12. Bown, Chad P., and Patricia Tovar. 2011. Trade Liberalization, Antidumping, and Safeguards: Evidence from India’s Tariff Reform. Journal of Development Economics 96: 115–25. [Google Scholar] [CrossRef]
  13. De Loecker, Jan, Pinelopi K. Goldberg, Amit K. Khandelwal, and Nina Pavcnik. 2016. Prices, Markups, and Trade Reform. Econometrica 84: 445–510. [Google Scholar] [CrossRef]
  14. Dougherty, Sean. 2009. Labour Regulation and Employment Dynamics at the State Level in India. Review of Market Integration 1: 295–337. [Google Scholar] [CrossRef]
  15. Dyson, Tim, Robert Cassen, and Leela Visaria. 2004. Twenty-First Century India: Population, Economy, Human Development, and the Environment. Oxford: Oxford University Press. [Google Scholar]
  16. Goldberg, Pinelopi K., and Nina Pavcnik. 2003. The response of the informal sector to trade liberalization. Journal of Development Economics 72: 463–96. [Google Scholar] [CrossRef]
  17. Goldberg, Pinelopi, Amit K. Khandelwal, Nina Pavcnik, and Petia Topalova. 2010. Imported Intermediate Inputs and Domestic Product Growth: Evidence from India. The Quarterly Journal of Economics 125: 1727–67. [Google Scholar] [CrossRef]
  18. Groizard, Jose L., Priya Ranjan, and Antonio Rodriguez-Lopez. 2015. Trade Costs and Job Flows: Evidence from Establishment-Level Data. Economic Inquiry 53: 173–204. [Google Scholar] [CrossRef]
  19. Gupta, Poonam, Rana Hasan, and Utsav Kumar. 2009. Big Reforms but Small Payoffs: Explaining the Weak Record of Growth and Employment in Indian Manufacturing. India Policy Forum 5: 59–123. [Google Scholar] [CrossRef]
  20. Haltiwanger, John, Ron S. Jarmin, and Javier Miranda. 2013. Who Creates Jobs? Small versus Large versus Young. Review of Economics and Statistics 95: 347–61. [Google Scholar] [CrossRef]
  21. Harrison, Ann E., Leslie A. Martin, and Shanthi Nataraj. 2013. Learning versus Stealing: How Important Are Market-Share Reallocations to India’s Productivity Growth? The World Bank Economic Review 27: 202–28. [Google Scholar] [CrossRef]
  22. Hasan, Rana, Devashish Mitra, Priya Ranjan, and Reshad N. Ahsan. 2012. Trade Liberalization and Unemployment: Theory and Evidence from India. Journal of Development Economics 97: 269–80. [Google Scholar] [CrossRef]
  23. Javorcik, Beata. 2015. Does FDI Bring Good Jobs to Host Countries? World Bank Research Observer 30: 74–94. [Google Scholar] [CrossRef]
  24. Kambhampati, Uma, and Ashok Parikh. 2005. Has liberalization affected profit margins in Indian Industry? Bulletin of Economic Research 57: 273–304. [Google Scholar] [CrossRef]
  25. Kambhampati, Uma, Pravin Krishna, and Devashish Mitra. 1997. The effect of trade policy reforms on labour markets: Evidence from India. Journal of International Trade & Economic Development 6: 287–97. [Google Scholar] [CrossRef]
  26. Kis-Katos, Krisztina, and Robert Sparrow. 2015. Poverty, Labour Markets and Trade Liberalization in Indonesia. Journal of Development Economics 117: 94–106. [Google Scholar] [CrossRef]
  27. Martin, Lesley A., Shanthi Nataraj, and Ann E. Harrison. 2017. In with the Big, Out with the Small: Removing Small-Scale Reservations in India. American Economic Review 107: 354–86. [Google Scholar] [CrossRef]
  28. Melitz, Marc J. 2003. The Impact of Trade on Intra-Industry Reallocations and Aggregate Industry Productivity. Econometrica 71: 1695–725. [Google Scholar] [CrossRef]
  29. Menezes-Filho, Naércio Aquino, and Marc-Andreas Muendler. 2011. Labor Reallocation in Response to Trade Reform. NBER Working Paper 17372. Cambridge: National Bureau of Economic Research. [Google Scholar]
  30. Munshi, Kaivan, and Mark Rosenzweig. 2009. Why Is Mobility in India so Low? Social Insurance, Inequality, and Growth. Working Paper 14850. Cambridge: National Bureau of Economic Research. [Google Scholar]
  31. Nataraj, Shanthi. 2011. The Impact of Trade Liberalization on Productivity: Evidence from India’s Formal and Informal Manufacturing Sectors. Journal of International Economics 85: 292–301. [Google Scholar] [CrossRef]
  32. Nouroz, Hasheem. 2001. Protection in Indian Manufacturing: An Empirical Study. Delhi: Macmillan India. [Google Scholar]
  33. Nunn, Nathan, and Daniel Trefler. 2014. Domestic Institutions as a Source of Comparative Advantage. Handbook of International Economics 4: 263–315. [Google Scholar] [CrossRef]
  34. Organization for Economic Co-operation and Development (OECD). 2007. OECD Economic Surveys: India. 2007–2014. Paris: Organization for Economic Co-operation and Development. [Google Scholar]
  35. Organization for Economic Co-operation and Development (OECD). 2012. Trade and Employment in a Fast-Changing World. In Policy Priorities for International Trade and Jobs. A product of the International Collaboration Initiative for Trade and Employment (ICITE). Paris: OECD. [Google Scholar]
  36. Paunov, Caroline. 2011. Imports, Innovation and Employment after Crisis. OECD Science, Technology and Industry Working Paper 2011/05. Paris: OECD. [Google Scholar]
  37. Saha, Bibhas, Kunal Sen, and Dibyendu Maiti. 2013. Trade Openness, Labour Institutions and Flexibilisation: Theory and Evidence from India. Labour Economics 24: 180–95. [Google Scholar] [CrossRef]
  38. Sen, Kunal. 2008. Trade Policy and Wage Inequality: Evidence from Indian Manufacturing. Indian Growth and Development Review 1: 147–71. [Google Scholar] [CrossRef]
  39. Sharma, Gunjan. 2008. Competing or Collaborating Siblings? Industrial and Trade Policies in India. Working Paper 06-10. Columbia: University of Missouri-Columbia. [Google Scholar]
  40. Sharma, Shruti. 2013. Imported Intermediate Inputs and Workforce Composition: Evidence from India’s Tariff Liberalization. Economics Program Working Papers 13-03. Hong Kong, China: The Conference Board, Economics Program. [Google Scholar]
  41. Sivadasan, Jagadeesh. 2009. Barriers to Competition and Productivity: Evidence from India. The B.E. Journal of Economic Analysis & Policy 9. [Google Scholar] [CrossRef]
  42. Topalova, Petia. 2010. Factor Immobility and Regional Impacts of Trade Liberalization: Evidence on Poverty from India. American Economic Journal: Applied Economics 2: 1–41. [Google Scholar] [CrossRef]
  43. Topalova, Petia, and Amit K. Khandelwal. 2011. Trade Liberalization and Firm Productivity: The Case of India. Review of Economics and Statistics 93: 995–1009. [Google Scholar] [CrossRef]
  44. World Bank. 2005. Improving the Investment Climate in India. Washington: The World Bank. [Google Scholar]
1
Up to the 1980s, all manufacturing firms with over 50 employees (over 100 employees if electricity was not used) and with assets above a specified threshold were required to obtain a license from the government. This policy was extremely restrictive and discouraged industry entry and competition (Sharma 2008). In this context, the term ‘delicensing’ implies that firms in a given industry or industries were no longer required to obtain such a license.
2
Prior to 1991, most industries were characterised by a 40 per cent FDI ceiling. In 1991 and in the following years, this ceiling was raised to 51 per cent for a number of industries, with ‘automatic’ FDI approval, and other regulations concerning FDI were liberalised (Sivadasan 2009).
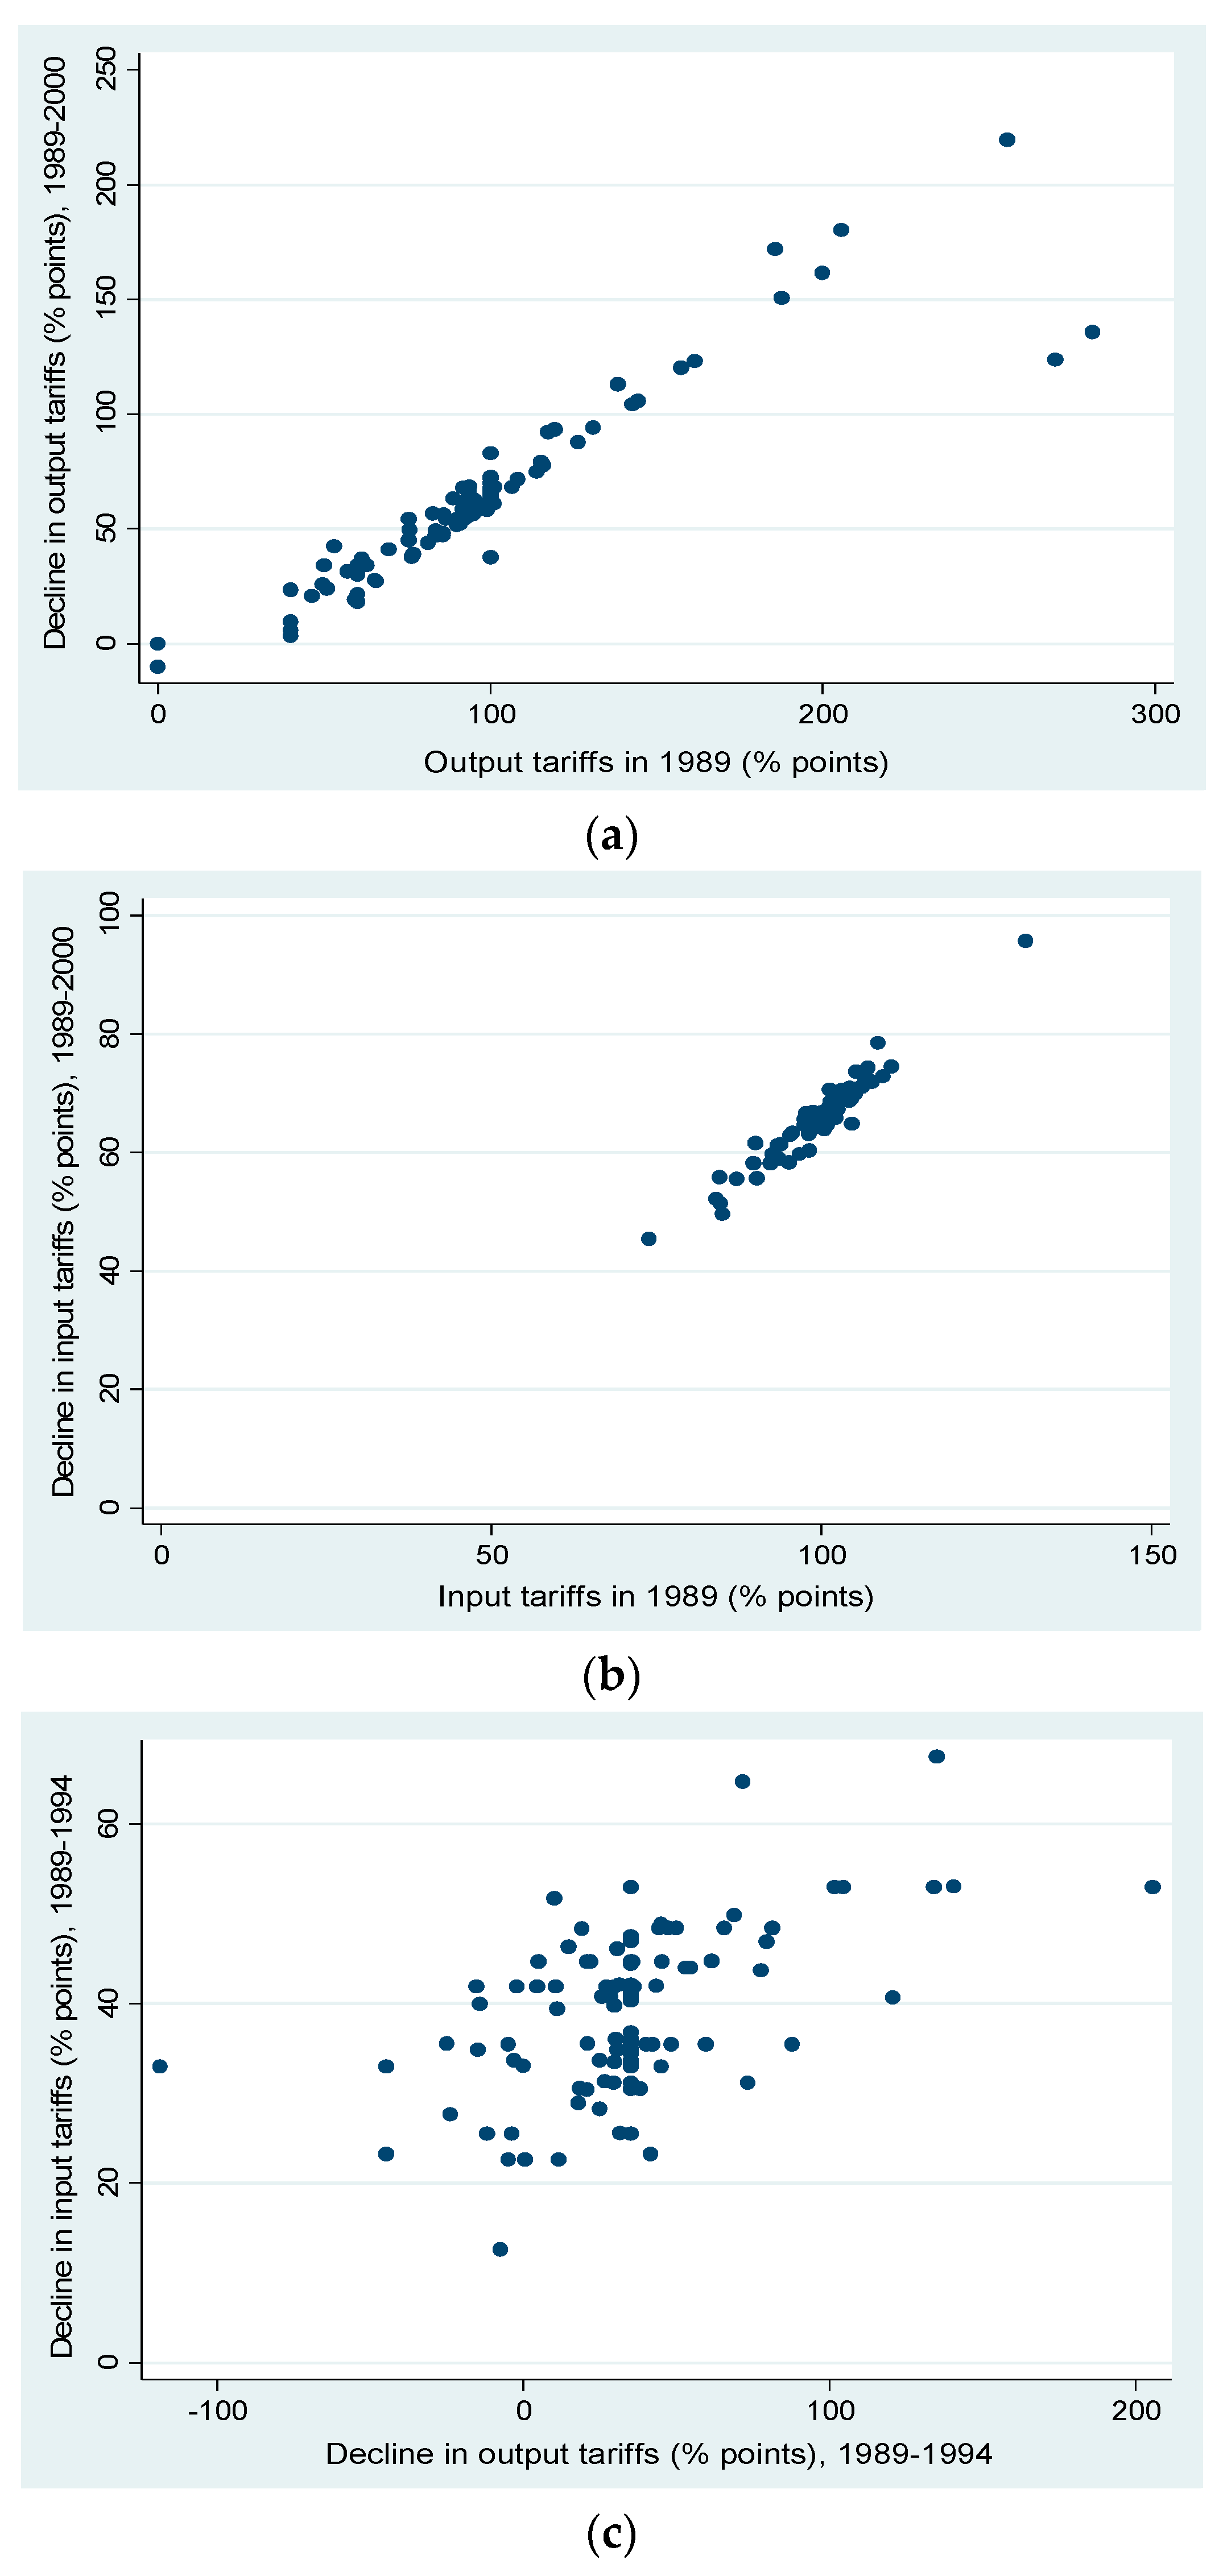
3
This was purposefully undertaken in the case of final goods tariffs, with input tariffs undergoing related, albeit not equivalent, declines.
4
The correlation coefficient for the changes in output and input tariffs over the 1989–1994 period is 0.5776, while that for the corresponding changes over the 1989–2000 period is 0.5927.
5
The two outliers visible to the right of this graph are the wine manufacturing and spirit distillation, rectification and blending industries, the tariffs for which amounted to over 250 per cent in 1989, but were subjected to smaller reductions relative to other industries with very high tariff rates in 1989. A robustness check which omits these outliers from the baseline regressions (outlined in Section 4) is discussed in Section 6.
6
Besley and Burgess (2004) consider sixteen states in their analysis, but the state of Jammu and Kashmir made no amendment to the IDA in the 1958–1990 period.
7
The Besley–Burgess measure, with a minor correction incorporated for the state of Madhya Pradesh, is labelled ‘FLEX 1’ by Hasan et al. (2012).
8
In their online appendix, Hasan et al. (2012) provide additional detail in this regard. Gujarat and Maharashtra are typically considered to be prime business locations by Indian businessmen, whereas Kerala is not. The World Bank’s 2005 research presents firm level survey findings in which managers rank Maharashtra and Gujarat highly, labelling them to be ‘Best Investment Climate’ states more consistently than other states. Kerala, conversely, attains a ‘Poor Investment Climate’ ranking. Small and medium-sized firms report having been subjected to twice as many factory inspections in ‘Poor Investment Climate’ states as in ‘Best Investment Climate’ states, suggesting that enforcement of ostensibly ‘pro-worker’ amendments to the IDA is likely to be less stringent in the latter type of state. Further, firms perceive that ‘over-manning’ (the gap between optimal and actual employment levels given current output levels) is on average less visible in Maharashtra and Gujarat than elsewhere. In ‘Poor Investment Climate’ states (such as Kerala), restrictive labour regulations were considered to be a primary driver of ‘over-manning’, whereas in ‘Best Investment Climate’ states, ‘over-manning’ (lower than in other states in the first place) was perceived more favourably, in the sense that it was considered to occur when firms expected higher future growth.
9
Dougherty (2009) states that there have been only eight state level IDA amendments in the post-1990 period, of which the only amendments of relevance for labour market outcomes were made by the state of Gujarat in 2004, which falls outside the period of interest for my analysis.
10
Figure 1. Employment in formal manufacturing firms in India (1990–1997). (a) Formal firm and paid employment shares by firm size (1990–1997); (b) Average employment per formal firm (1990–1997). Source: ASI survey data (1990, 1994, 1995, 1997) As inverse sampling probability-based multipliers have been used to aggregate the raw data, these distributions are representative of the population of formal firms. The measure of labour market flexibility used in Figure 1b is the ‘FLEX 2’ measure due to Hasan et al. (2012) and is described in Section 3.3.
Economies 07 00031 g001aEconomies 07 00031 g001b
Figure 2. Final goods tariffs and input tariffs (1989–2000). (a) Final goods tariffs (1989) and declines in final goods tariffs (1989–2000)5; (b) Input tariffs (1989) and declines in input tariffs (1989–2000); (c) Declines in final goods tariffs and declines in input tariffs (1989–1994). Source: Output and input tariff data compiled by Nataraj (2011) on the basis of Indian government data and India’s IOTT.
Economies 07 00031 g002
Table 1. Summary statistics by year: Final goods tariffs, input tariffs, delicensing and FDI liberalisation (1985–1997) *.
YearFINAL GOODS TARIFFS (%)INPUT TARIFFS (%)% DEL% FDI
MeanMedianMaxMinSDMeanMedianMaxMinSD
198588.9791.93203.910.0032.8357.8958.0986.8223.4211.73350
198695.37100.00242.220.0037.9560.2959.7788.3023.9711.23360
198794.75100.00242.220.0037.6058.6358.1679.5023.6710.25360
198894.86100.00248.890.0037.5359.3358.9283.0923.8910.55360
198995.54100.00281.250.0040.3459.4459.0583.1123.8910.58370
199095.68100.00281.250.0040.5659.4558.9983.2223.9010.57370
199195.68100.00281.250.0040.5659.4458.9983.2223.9010.578438
199263.4864.65281.250.0027.7139.7340.2553.2720.545.428438
199363.9264.15340.6322.5031.0338.5339.7054.3520.425.318638
199464.4665.00400.0011.2836.0637.3437.9755.428.926.068638
199553.5753.50320.7512.0830.8630.1130.8348.978.645.328638
199642.4144.25254.270.0024.8522.7623.3942.518.155.158638
199734.1534.48176.670.0018.5918.3719.3132.956.374.098945
Source: Output and input tariff data obtained from Nataraj (2011); 132 three-digit NIC (1987) industries included. * ‘% DEL’ and ‘% FDI’ refer to the proportions of industries that were delicensed and FDI liberalised (respectively) up to a given year.
Table 2. Summary of labour market flexibility indices *.
StateMeasure of Labour Market Flexibility *
FLEX 1FLEX 2FLEX 3
Andhra Pradesh111
Assam000
Bihar000
Gujarat010
Haryana000
Karnataka111
Kerala100
Madhya Pradesh000
Maharashtra010
Orissa000
Punjab000
Rajasthan111
Tamil Nadu111
Uttar Pradesh001
West Bengal000
Source: Besley and Burgess (2004)—FLEX 1; Hasan et al. (2012)—FLEX 2; Gupta et al. (2009)—FLEX 3. * Recoded scores: 1 = flexible labour market regulation, 0 = inflexible labour market regulation.
Table 3. Summary statistics for paid employment * in formal firms (1990–1997).
YearObservationsMeanMedianStandard DeviationMinimumMaximumWeighted Total **
All states
199041,463116.5024.00407.02174794,830,441
199447,576116.8125.67387.67176195,557,393
199548,435114.7125.00369.14167155,556,124
199748,724116.5226.00357.97161925,677,288
Overall186,198115.1225.00379.831761921,621,246
States with flexible labour markets (FLEX 2 = 1)
199023,109114.4523.00386.95172822,644,720
199427,325113.2125.00367.54168693,093,462
199527,830110.8025.00347.13161253,083,672
199728,312113.4926.00341.98161923,213,061
Overall106,576112.9225.00360.041728212,034,915
States with inflexible labour markets (FLEX 2 = 0)
199018,354119.0925.00430.96174792,185,721
199420,251121.6727.00413.25176192,463,931
199520,605119.9926.00396.88167152,472,451
199720,412120.7227.00379.01159752,464,228
Overall79,622120.4026.00404.76176199,586,331
Source: ASI data (1990–1997). The data are unweighted and apply only to the sample of formal firms surveyed in each year. * The employment distribution for each year has been ‘winsorized’ at the 0.1st and 99.9th percentiles. ** This refers to the total number of paid employees in the population represented by the formal firms in the sample dataset, derived using the survey weights provided for each firm surveyed in the sample dataset.
Table 4. Economic reforms and employment in formal firms (1990–1997).
Dependent Variable: Paid EmploymentDependent Variable: Total Employment
(1)(2)(3)(4)(5)(6)
Final goods tariffs0.063 *0.0550.061 *0.061 *0.0520.059 *
(0.035)(0.036)(0.036)(0.033)(0.034)(0.034)
Input tariffs−0.753 ***−0.706 ***−0.737 ***−0.675 ***−0.619 ***−0.653 ***
(0.168)(0.170)(0.174)(0.162)(0.163)(0.167)
Delicensing0.019 0.0200.021 0.023
(0.023) (0.024)(0.022) (0.023)
FDI reform 0.0050.009 0.0070.012
(0.024)(0.025) (0.023)(0.024)
State FEYesYesYesYesYesYes
Year FEYesYesYesYesYesYes
Industry FEYesYesYesYesYesYes
Observations160,883160,883160,883160,984160,984160,984
R-squared0.2040.2040.2040.2030.2030.203
Dependent variable: natural logarithm of number of paid employees (Columns 1, 2, 3) and natural logarithm of total number of persons engaged (Columns 4, 5, 6) ‘FE’ denotes fixed effects. Standard errors, in brackets, are clustered at the state-industry level. ***: Significant at 1% *: Significant at 10%.
Table 5. Economic reforms, labour market flexibility and employment in formal firms (1990–1997).
Dependent Variable:
Paid Employment
Dependent Variable:
Total Employment
(1)(2)(3)(4)(5)(6)
Row 1 + Row 20.124 *0.1240.111 *0.115 *0.1160.103 *
Final goods tariffs−0.030−0.037−0.020−0.023−0.031−0.014
(0.078)(0.078)(0.075)(0.073)(0.074)(0.070)
Final goods tariffs * FLEX 20.1540.1610.1320.1380.1470.117
(0.122)(0.122)(0.115)(0.114)(0.115)(0.108)
Input tariffs−0.609 ***−0.729 ***−0.680 ***−0.531 **−0.646 ***−0.597 ***
(0.214)(0.202)(0.211)(0.207)(0.195)(0.205)
Input tariffs * FLEX 2−0.1820.0440.021−0.1700.0410.018
(0.228)(0.211)(0.216)(0.218)(0.204)(0.209)
Delicensing0.0460.0210.0840.0540.0240.089
(0.059)(0.024)(0.061)(0.057)(0.023)(0.059)
Delicensing * FLEX 2−0.040 −0.098−0.047 −0.101
(0.081) (0.083)(0.080) (0.081)
FDI reform0.010−0.105 **−0.115 **0.013−0.092 **−0.103 **
(0.026)(0.045)(0.045)(0.025)(0.043)(0.043)
FDI reform * FLEX 2 0.191 ***0.208 *** 0.174 ***0.192 ***
(0.066)(0.067) (0.063)(0.063)
Flexible labour markets: Effects of changes in final goods tariffs
Standard Error0.0660.0660.0630.0620.0620.059
p-value (combined effect = 0)0.0610.0590.0780.0650.0600.082
Flexible labour markets: Effects of changes in input tariffs
Row 3 + Row 4−0.791 ***−0.684 ***−0.659 ***−0.701 ***−0.605 ***−0.579 ***
Standard Error0.2090.2020.1990.1990.1920.190
p-value (combined effect = 0)0.0000.0010.0010.0000.0020.002
Flexible labour markets: Effects of delicensing
Row 5 + Row 60.007 −0.0130.007 −0.012
Standard Error0.037 0.0360.036 0.036
p-value (combined effect = 0)0.854 0.7070.854 0.737
Flexible labour markets: Effects of FDI reform
Row 7 + Row 8 0.086 **0.093 ** 0.082 **0.089 **
Standard Error 0.0380.039 0.0360.037
p-value (combined effect = 0) 0.0220.017 0.0220.016
State FEYesYesYesYesYesYes
Year FEYesYesYesYesYesYes
Industry FEYesYesYesYesYesYes
Observations160,883160,883160,883160,984160,984160,984
R-squared0.2040.2050.2050.2030.2040.205
Dependent variable: natural logarithm of number of paid employees (Columns 1, 2, 3) and natural logarithm of total number of persons engaged (Columns 4, 5, 6) ‘FE’ denotes fixed effects. Standard errors, in brackets, are clustered at the state-industry level. ***: Significant at 1% **: Significant at 5% *: Significant at 10%.
Table 6. Economic reforms and formal sector employment: Industry level effects (1990–1997).
A: All StatesDependent Variable (in Natural Logarithms):
Paid EmploymentTotal EmploymentNumber of Firms
(1)(2)(3)
Final goods tariffs0.0420.039−0.057
(0.061)(0.059)(0.045)
Input tariffs−0.544−0.5180.151
(0.363)(0.357)(0.249)
Delicensing0.0520.0560.079 **
(0.046)(0.046)(0.036)
FDI reform0.0260.0170.019
(0.045)(0.045)(0.034)
Observations556556556
R-squared0.2400.2150.379
B: States with flexible labour markets (FLEX 2 = 1)
Final goods tariffs−0.026−0.043−0.068
(0.118)(0.115)(0.059)
Input tariffs−0.610−0.5510.003
(0.441)(0.431)(0.300)
Delicensing0.0680.0690.086 **
(0.073)(0.072)(0.042)
FDI reform0.0120.004−0.005
(0.058)(0.056)(0.036)
Observations520520520
R-squared0.2340.2130.386
C: States with inflexible labour markets (FLEX 2 = 0)
Final goods tariffs0.100 *0.113 *−0.041
(0.057)(0.060)(0.052)
Input tariffs−0.363−0.3640.271
(0.412)(0.406)(0.291)
Delicensing0.0220.0290.045
(0.057)(0.057)(0.037)
FDI reform0.0350.0240.052
(0.056)(0.057)(0.038)
Observations484484484
R-squared0.1160.0980.169
Dependent variable: natural logarithm of number of paid employees/total number of persons engaged/number of formal enterprises (Column 1/Column 2/Column 3). All regressions include a constant and industry and year fixed effects and are weighted by pre-reform (1990) levels of the dependent variable. Standard errors, in brackets, are robust to heteroscedasticity. **: Significant at 5% *: Significant at 10%.
Table 7. Economic reforms, labour market flexibility and employment in formal firms (1990–1997): Exploring product market competition through the lens of SSI reservation.
Baseline (All Firms)Firms Producing at Least One SSI Reserved Item
(Less Competitive)
Firms Producing (Only) Items that Were Never SSI Reserved
(More Competitive)
Final goods tariffs−0.020−0.373 **0.089
(0.075)(0.179)(0.055)
Final goods tariffs * FLEX 20.1320.677 **−0.037
(0.115)(0.321)(0.077)
Input tariffs−0.680 ***−0.131−0.698 ***
(0.211)(0.401)(0.221)
Input tariffs * FLEX 20.021−0.7590.198
(0.216)(0.486)(0.236)
Delicensing0.0840.127 *0.067
(0.061)(0.070)(0.062)
Delicensing * FLEX 2−0.098−0.087−0.129
(0.083)(0.088)(0.091)
FDI reform−0.115 **−0.022−0.098 **
(0.045)(0.068)(0.039)
FDI reform * FLEX 20.208 ***0.0940.164 ***
(0.067)(0.081)(0.054)
Flexible labour markets: Effects of changes in final goods tariffs
Row 1 + Row 20.111 *0.3050.052
Standard Error0.0630.1830.057
p-value (combined effect = 0)0.0780.0960.362
Flexible labour markets: Effects of changes in input tariffs
Row 3 + Row 4−0.659 ***−0.891−0.500
Standard Error0.1990.4060.215
p-value (combined effect = 0)0.0010.0290.020
Flexible labour markets: Effects of delicensing
Row 5 + Row 6−0.0130.040−0.063
Standard Error0.0360.0620.043
p-value (combined effect = 0)0.7070.5160.143
Flexible labour markets: Effects of FDI reform
Row 7 + Row 80.093 **0.0720.066
Standard Error0.0390.0570.036
p-value (combined effect = 0)0.0170.2050.071
State FEYesYesYes
Year FEYesYesYes
Industry FEYesYesYes
Observations160,88341,52994,764
R-squared0.2050.1710.235
Dependent variable: natural logarithm of number of paid employees ‘FE’ denotes fixed effects. Standard errors, in brackets, are clustered at the state-industry level. ***: Significant at 1% **: Significant at 5% *: Significant at 10%.
Table 8. Economic reforms, labour market flexibility and employment in formal firms (1990–1997): Analysis based on the four firm concentration ratio (CR4) in 1990 (the proportion of industry level output accounted for by the four largest firms in 1990).
Baseline (All Firms)Firms in Industries with CR4 above Median in 1990
(Less Competitive)
Firms in Industries with CR4 below Median in 1990
(More Competitive)
Final goods tariffs−0.0200.226 **−0.053
(0.075)(0.110)(0.083)
Final goods tariffs * FLEX 20.132−0.1360.157
(0.115)(0.127)(0.127)
Input tariffs−0.680 ***−0.915 **−0.626 ***
(0.211)(0.450)(0.230)
Input tariffs * FLEX 20.0210.877 **−0.021
(0.216)(0.346)(0.236)
Delicensing0.084−0.0570.093
(0.061)(0.065)(0.071)
Delicensing * FLEX 2−0.0980.212 ***−0.129
(0.083)(0.074)(0.097)
FDI reform−0.115 **−0.106−0.123 **
(0.045)(0.069)(0.049)
FDI reform * FLEX 20.208 ***0.208 **0.222 ***
(0.067)(0.097)(0.072)
Flexible labour markets: Effects of changes in final goods tariffs
Row 1 + Row 20.111 *0.0890.104
Standard Error0.0630.1130.070
p-value (combined effect = 0)0.0780.4310.139
Flexible labour markets: Effects of changes in input tariffs
Row 3 + Row 4−0.659 ***−0.039−0.647 ***
Standard Error0.1990.4230.223
p-value (combined effect = 0)0.0010.9270.004
Flexible labour markets: Effects of delicensing
Row 5 + Row 6−0.0130.155 ***−0.036
Standard Error0.0360.0580.041
p-value (combined effect = 0)0.7070.0070.385
Flexible labour markets: Effects of FDI reform
Row 7 + Row 80.093 **0.1030.099 **
Standard Error0.0390.0780.042
p-value (combined effect = 0)0.0170.1900.020
State FEYesYesYes
Year FEYesYesYes
Industry FEYesYesYes
Observations160,88323,244137,639
R-squared0.2050.2100.206
Dependent variable: natural logarithm of number of paid employees ‘FE’ denotes fixed effects. Standard errors, in brackets, are clustered at the state-industry level. ***: Significant at 1% **: Significant at 5% *: Significant at 10%.
Table 9. Economic reforms and formal sector employment: Industry level effects for firm numbers (1990–1997) based on the four firm concentration ratio (CR4) in 1990.
A: All StatesDependent Variable: ln (Number of Formal Firms in Three Digit Industry)
All IndustriesIndustries with CR4 Above Median in 1990
(Less Competitive)
Industries with CR4 Below Median in 1990
(More Competitive)
Final goods tariffs−0.0570.097−0.064
(0.045)(0.078)(0.054)
Input tariffs0.151−0.922 *0.208
(0.249)(0.489)(0.291)
Delicensing0.079 **−0.0460.096 **
(0.036)(0.078)(0.044)
FDI reform0.0190.0150.019
(0.034)(0.061)(0.038)
Observations556252304
R-squared0.3790.1670.458
B: States with flexible labour markets (FLEX 2 = 1)
Final goods tariffs−0.068−0.023−0.054
(0.059)(0.081)(0.069)
Input tariffs0.003−0.890 *−0.050
(0.300)(0.528)(0.360)
Delicensing0.086 **−0.0420.112 **
(0.042)(0.087)(0.051)
FDI reform−0.005−0.032−0.011
(0.036)(0.085)(0.041)
Observations520224296
R-squared0.3860.1390.472
C: States with inflexible labour markets (FLEX 2 = 0)
Final goods tariffs−0.0410.166−0.062
(0.052)(0.132)(0.060)
Input tariffs0.271−0.7270.367
(0.291)(0.612)(0.322)
Delicensing0.045−0.0180.051
(0.037)(0.102)(0.042)
FDI reform0.0520.1220.046
(0.038)(0.081)(0.041)
Observations484184300
R-squared0.1690.1100.217
Dependent variable: natural logarithm of industry level number of formal enterprises. All regressions include a constant and industry and year fixed effects and are weighted by pre-reform (1990) levels of the dependent variable. Standard errors, in brackets, are robust to heteroscedasticity. **: Significant at 5% *: Significant at 10%.
Table 10. Economic reforms, labour market flexibility and employment in formal firms (1990–1997): Results by employee type.
Baseline (All Paid Employees)Directly Employed Adult Male WorkersDirectly Employed Adult Female WorkersContract WorkersSupervisory/Managerial Level EmployeesOther Employees
Final goods tariffs−0.0200.059−0.114−0.1380.098 **0.031
(0.075)(0.059)(0.143)(0.107)(0.047)(0.057)
Final goods tariffs * FLEX 20.132−0.0160.2250.245 *−0.018−0.001
(0.115)(0.088)(0.167)(0.129)(0.063)(0.084)
Input tariffs−0.680 ***−0.676 ***−0.2220.025−0.275−0.323
(0.211)(0.212)(0.369)(0.412)(0.196)(0.206)
Input tariffs * FLEX 20.0210.223−0.552 *−0.204−0.0340.405 **
(0.216)(0.198)(0.331)(0.378)(0.190)(0.192)
Delicensing0.0840.0320.225 *0.2040.019−0.018
(0.061)(0.039)(0.125)(0.144)(0.049)(0.034)
Delicensing * FLEX 2−0.098−0.055−0.208−0.202−0.067−0.020
(0.083)(0.053)(0.143)(0.178)(0.059)(0.044)
FDI reform−0.115 **−0.117 ***−0.191 *0.035−0.094 ***−0.106 ***
(0.045)(0.041)(0.109)(0.081)(0.035)(0.032)
FDI reform * FLEX 20.208 ***0.180 ***0.2110.196 **0.105 ***0.193 ***
(0.067)(0.055)(0.132)(0.088)(0.039)(0.046)
Flexible labour markets: Effects of changes in final goods tariffs
Row 1 + Row 20.111 *0.0430.1110.1070.080 *0.030
Standard Error0.0630.0550.0720.1060.0450.054
p-value (combined effect = 0)0.0780.4280.1260.3130.0780.578
Flexible labour markets: Effects of changes in input tariffs
Row 3 + Row 4−0.659 ***−0.452 **−0.774 ***−0.179−0.310 *0.082
Standard Error0.1990.2050.2650.4300.1820.176
p-value (combined effect = 0)0.0010.0270.0040.6770.0890.641
Flexible labour markets: Effects of delicensing
Row 5 + Row 6−0.013−0.0230.0170.001−0.048 *−0.037
Standard Error0.0360.0290.0490.0830.0280.026
p-value (combined effect = 0)0.7070.4300.7290.9870.0870.148
Flexible labour markets: Effects of FDI reform
Row 7 + Row 80.093 **0.062 **0.0210.231 ***0.0110.087 ***
Standard Error0.0390.0320.0490.0780.0260.029
p-value (combined effect = 0)0.0170.0490.6740.0030.6670.003
State FEYesYesYesYesYesYes
Year FEYesYesYesYesYesYes
Industry FEYesYesYesYesYesYes
Observations160,883153,28451,97930,221122,368131,267
R-squared0.2050.2190.3120.1870.1490.181
Dependent variable: natural logarithm of number of employees of the relevant type (as specified in the column headings) ‘FE’ denotes fixed effects. Standard errors, in brackets, are clustered at the state-industry level. ***: Significant at 1% **: Significant at 5% *: Significant at 10%.
Table 11. Economic reforms and formal sector employment: Industry level effects for the number of firms employing contract workers/using imported inputs (1990–1997).
A: All Statesln (Number of Firms Employing Contract Workers)ln (Number of Firms Using Imported Inputs)
Final goods tariffs−0.082−0.148
(0.117)(0.194)
Input tariffs−0.7391.986
(0.518)(1.251)
Delicensing0.087−0.215
(0.082)(0.262)
FDI reform0.135 *−0.320
(0.077)(0.260)
Observations544479
R-squared0.2510.507
B: States with flexible labour markets (FLEX 2 = 1)
Final goods tariffs−0.168−0.316
(0.143)(0.237)
Input tariffs−0.5392.231
(0.629)(1.477)
Delicensing0.103−0.160
(0.097)(0.243)
FDI reform0.219 **−0.176
(0.097)(0.261)
Observations504440
R-squared0.2240.433
C: States with flexible labour markets (FLEX 2 = 0)
Final goods tariffs−0.096−0.208
(0.117)(0.247)
Input tariffs−0.3181.181
(0.707)(1.264)
Delicensing0.001−0.298
(0.097)(0.202)
FDI reform0.065−0.095
(0.085)(0.191)
Observations467378
R-squared0.1440.384
Dependent variable: natural logarithm of number of formal enterprises employing contract workers/using imported inputs All regressions include a constant and industry and year fixed effects and are weighted by pre-reform (1990) levels of the dependent variable. Standard errors, in brackets, are robust to heteroscedasticity. **: Significant at 5% *: Significant at 10%.
Table 12. Economic reforms, labour market flexibility and employment in formal firms (1990–1997): Results by trade orientation of industry of operation.
Export Oriented Industries (Nouroz 2001)Non-Export Oriented Industries (Nouroz 2001)Export-Output Ratio above Median (1990 IOTT)Export-Output Ratio below Median (1990 IOTT)Import-Output Ratio above Median (1990 IOTT)Import-Output Ratio below Median (1990 IOTT)
Final goods tariffs−0.723−0.017−0.318 *0.127 **−0.071−0.002
(0.573)(0.075)(0.167)(0.051)(0.072)(0.087)
Final goods tariffs * FLEX 20.3490.1260.539 **−0.0740.200 **0.076
(0.587)(0.115)(0.247)(0.075)(0.094)(0.137)
Input tariffs−1.742 **−0.620 ***−0.121−0.898 ***0.167−0.773 ***
(0.837)(0.217)(0.390)(0.257)(0.294)(0.254)
Input tariffs * FLEX 2−0.2930.044−0.388−0.057−0.2660.018
(0.428)(0.228)(0.432)(0.244)(0.213)(0.289)
Delicensing−0.208 *0.123 *−0.0240.0760.0290.141 *
(0.123)(0.067)(0.051)(0.080)(0.050)(0.079)
Delicensing * FLEX 20.178−0.1450.033−0.0580.003−0.164
(0.154)(0.092)(0.060)(0.121)(0.068)(0.108)
FDI reform−0.061−0.119 **−0.153 ***−0.020−0.041−0.151 **
(0.110)(0.048)(0.058)(0.055)(0.044)(0.065)
FDI reform * FLEX 2−0.0290.255 ***0.253 ***0.0140.0580.249 **
(0.129)(0.071)(0.077)(0.072)(0.048)(0.097)
Flexible labour markets: Effects of changes in final goods tariffs
Row 1 + Row 2−0.3740.109 *0.221 *0.0530.129 *0.075
Standard Error0.4390.0640.1140.0610.0740.080
p-value (combined effect = 0)0.3940.0890.0520.3830.0810.353
Flexible labour markets: Effects of changes in input tariffs
Row 3 + Row 4−2.035 ***−0.576 ***−0.509 *−0.955 ***−0.099−0.755 ***
Standard Error0.7760.2070.2990.2880.2840.250
p-value (combined effect = 0)0.0090.0050.0890.0010.7270.003
Flexible labour markets: Effects of delicensing
Row 5 + Row 6−0.030−0.0220.0080.0180.032−0.022
Standard Error0.0750.0400.0420.0560.0440.046
p-value (combined effect = 0)0.6920.5790.8390.7500.4660.624
Flexible labour markets: Effects of FDI reform
Row 7 + Row 8−0.0900.136 ***0.100 **−0.0060.0170.099 *
Standard Error0.0820.0400.0490.0440.0380.053
p-value (combined effect = 0)0.2760.0010.0400.8920.6460.065
State FEYesYesYesYesYesYes
Year FEYesYesYesYesYesYes
Industry FEYesYesYesYesYesYes
Observations23,887136,99696,81464,06957,795103,088
R-squared0.1790.2140.1790.2520.1080.257
Dependent variable: natural logarithm of number of paid employees ‘FE’ denotes fixed effects. Standard errors, in brackets, are clustered at the state-industry level. ***: Significant at 1% **: Significant at 5% *: Significant at 10%.
Table 13. Economic reforms, labour market flexibility and employment in formal firms (1990–1997): Tariff endogeneity check—dropping outlier industries (Wine manufacturing and the distillation, rectification and blending of spirits) and adding state-year interaction fixed effects.
Baseline (All Firms)Dropping Outlier IndustriesAdding State-Year Interactions
Final goods tariffs−0.020−0.085−0.016
(0.075)(0.090)(0.075)
Final goods tariffs * FLEX 20.1320.241 *0.133
(0.115)(0.141)(0.114)
Input tariffs−0.680 ***−0.583 **−0.984 ***
(0.211)(0.228)(0.281)
Input tariffs * FLEX 20.021−0.1410.445
(0.216)(0.254)(0.377)
Delicensing0.0840.0850.099
(0.061)(0.061)(0.063)
Delicensing * FLEX 2−0.098−0.100−0.118
(0.083)(0.083)(0.091)
FDI reform−0.115 **−0.113 **−0.117 ***
(0.045)(0.045)(0.045)
FDI reform * FLEX 20.208 ***0.204 ***0.200 ***
(0.067)(0.066)(0.070)
Flexible labour markets: Effects of changes in final goods tariffs
Row 1 + Row 20.111 *0.156 **0.117 *
Standard Error0.0630.0750.063
p-value (combined effect = 0)0.0780.0370.062
Flexible labour markets: Effects of changes in input tariffs
Row 3 + Row 4−0.659 ***−0.725 ***−0.539 **
Standard Error0.1990.2100.228
p-value (combined effect = 0)0.0010.0010.018
Flexible labour markets: Effects of delicensing
Row 5 + Row 6−0.013−0.015−0.019
Standard Error0.0360.0360.040
p-value (combined effect = 0)0.7070.6760.641
Flexible labour markets: Effects of FDI reform
Row 7 + Row 80.093 **0.091 **0.083 **
Standard Error0.0390.0390.038
p-value (combined effect = 0)0.0170.0190.031
State FEYesYesYes
Year FEYesYesYes
Industry FEYesYesYes
State-Year FENoNoYes
Observations160,883160,255160,883
R-squared0.2050.2040.207
Dependent variable: natural logarithm of number of paid employees ‘FE’ denotes fixed effects. Standard errors, in brackets, are clustered at the state-industry level. ***: Significant at 1% **: Significant at 5% *: Significant at 10%.
Table 14. Economic reforms, labour market flexibility and employment in formal firms (1990–1997): Robustness checks—accounting for the timing of delicensing, firm age, and alternative measures of labour market flexibility.
Baseline (All Firms)Delicensed by 1986Not Delicensed by 1986Controlling for Firm AgeFLEX 1 Instead of FLEX 2FLEX 3 Instead of FLEX 2
Final goods tariffs−0.020−0.1350.110 *−0.0450.0680.071
(0.075)(0.096)(0.066)(0.075)(0.054)(0.061)
Final goods tariffs * FLEX0.1320.392 **−0.156 *0.165−0.0110.009
(0.115)(0.153)(0.083)(0.116)(0.122)(0.120)
Input tariffs−0.680 ***−0.722 **−0.823 ***−0.600 ***−0.846 ***−0.961 ***
(0.211)(0.289)(0.254)(0.203)(0.201)(0.230)
Input tariffs * FLEX0.021−0.0140.281−0.0490.740 ***0.580 **
(0.216)(0.252)(0.264)(0.210)(0.265)(0.262)
Delicensing0.084 0.0920.0610.034
(0.061) (0.062)(0.042)(0.050)
Delicensing * FLEX−0.098 −0.094−0.103−0.038
(0.083) (0.084)(0.083)(0.088)
FDI reform−0.115 **−0.158 ***0.021−0.113 **−0.071 **−0.094 ***
(0.045)(0.050)(0.067)(0.045)(0.028)(0.035)
FDI reform * FLEX0.208 ***0.304 ***−0.0600.208 ***0.200 ***0.230 ***
(0.067)(0.081)(0.096)(0.069)(0.071)(0.070)
Firm age 0.008 ***
(0.001)
Flexible labour markets: Effects of changes in final goods tariffs
Row 1 + Row 20.111 *0.257 ***−0.0460.120 *0.0570.081
Standard Error0.0630.0920.0630.0640.0890.080
p-value (combined effect = 0)0.0780.0050.4690.0600.5170.313
Flexible labour markets: Effects of changes in input tariffs
Row 3 + Row 4−0.659 ***−0.736 **−0.542 **−0.649 ***−0.106−0.381 *
Standard Error0.1990.3050.2660.1920.2030.203
p-value (combined effect = 0)0.0010.0160.0420.0010.6020.061
Flexible labour markets: Effects of delicensing
Row 5 + Row 6−0.013 −0.003−0.042−0.004
Standard Error0.036 0.0350.0530.050
p-value (combined effect = 0)0.707 0.9440.4300.937
Flexible labour markets: Effects of FDI reform
Row 7 + Row 80.093 **0.147 ***−0.0400.095 **0.129 **0.136 ***
Standard Error0.0390.0530.0580.0400.0600.051
p-value (combined effect = 0)0.0170.0060.4950.0170.0310.008
State FEYesYesYesYesYesYes
Year FEYesYesYesYesYesYes
Industry FEYesYesYesYesYesYes
Observations160,88377,69283,191159,872160,883160,883
R-squared0.2050.0990.2770.2110.2060.206
Dependent variable: natural logarithm of number of paid employees ‘FE’ denotes fixed effects. Standard errors, in brackets, are clustered at the state-industry level. The measure of labour market flexibility used in Columns 1, 2, 3 and 4 is the ‘FLEX 2’ measure, while Columns 5 and 6 use alternative measures, as specified in the column headings. ***: Significant at 1% **: Significant at 5% *: Significant at 10%.
Table 15. Economic reforms, labour market flexibility and employment in formal firms (1990–1997): Robustness checks—Modifying the baseline reform time lag and excluding individual post-reform cross-sections.
Baseline (All Firms, Time Lag: 2 Years)Time Lag: 1 YearTime Lag: 3 YearsExcluding 1994Excluding 1995Excluding 1997
Final goods tariffs−0.020−0.039−0.084−0.041−0.0150.003
(0.075)(0.078)(0.065)(0.079)(0.069)(0.070)
Final goods tariffs * FLEX 20.1320.1650.1260.1780.1220.120
(0.115)(0.123)(0.098)(0.119)(0.103)(0.101)
Input tariffs−0.680 ***−0.574 ***−0.306 **−0.766 ***−0.703 ***−0.866 ***
(0.211)(0.197)(0.154)(0.226)(0.212)(0.225)
Input tariffs * FLEX 20.021−0.090−0.062−0.0620.0140.261
(0.216)(0.199)(0.196)(0.216)(0.199)(0.229)
Delicensing0.0840.0850.0880.0660.0780.060
(0.061)(0.061)(0.060)(0.058)(0.058)(0.059)
Delicensing * FLEX 2−0.098−0.100−0.115−0.074−0.076−0.057
(0.083)(0.083)(0.080)(0.076)(0.076)(0.078)
FDI reform−0.115 **−0.112 **−0.092 **−0.109 **−0.118 ***−0.123 ***
(0.045)(0.045)(0.044)(0.047)(0.045)(0.044)
FDI reform * FLEX 20.208 ***0.203 ***0.199 ***0.199 ***0.209 ***0.214 ***
(0.067)(0.065)(0.064)(0.067)(0.067)(0.066)
Flexible labour markets: Effects of changes in final goods tariffs
Row 1 + Row 20.111 *0.127 **0.0420.137 **0.107 *0.122 **
Standard Error0.0630.0610.0470.0650.0610.062
p-value (combined effect = 0)0.0780.0370.3670.0350.0800.049
Flexible labour markets: Effects of changes in input tariffs
Row 3 + Row 4−0.659 ***−0.665 ***−0.368 **−0.829 ***−0.689 ***−0.604 ***
Standard Error0.1990.1720.1530.2170.2040.202
p-value (combined effect = 0)0.0010.0000.0170.0000.0010.003
Flexible labour markets: Effects of delicensing
Row 5 + Row 6−0.013−0.015−0.027−0.0070.0020.004
Standard Error0.0360.0380.0340.0370.0340.035
p-value (combined effect = 0)0.7070.6910.4310.8410.9470.919
Flexible labour markets: Effects of FDI reform
Row 7 + Row 80.093 **0.091 **0.108 ***0.090 **0.091 **0.091 **
Standard Error0.0390.0380.0370.0400.0380.039
p-value (combined effect = 0)0.0170.0170.0040.0270.0180.020
State FEYesYesYesYesYesYes
Year FEYesYesYesYesYesYes
Industry FEYesYesYesYesYesYes
Observations160,883160,883160,883119,735119,075118,602
R-squared0.2050.2050.2050.2050.2040.209
Dependent variable: natural logarithm of number of paid employees ‘FE’ denotes fixed effects. Standard errors, in brackets, are clustered at the state-industry level. ***: Significant at 1% **: Significant at 5% *: Significant at 10%.

