Market Efficiency and News Dynamics: Evidence from International Equity Markets


Abstract
:1. Introduction
2. News and Market Efficient Market Theory
2.1. Efficient Market Hypothesis
2.2. The Model with News Information
2.3. Uncertainty Premium Hypotheses
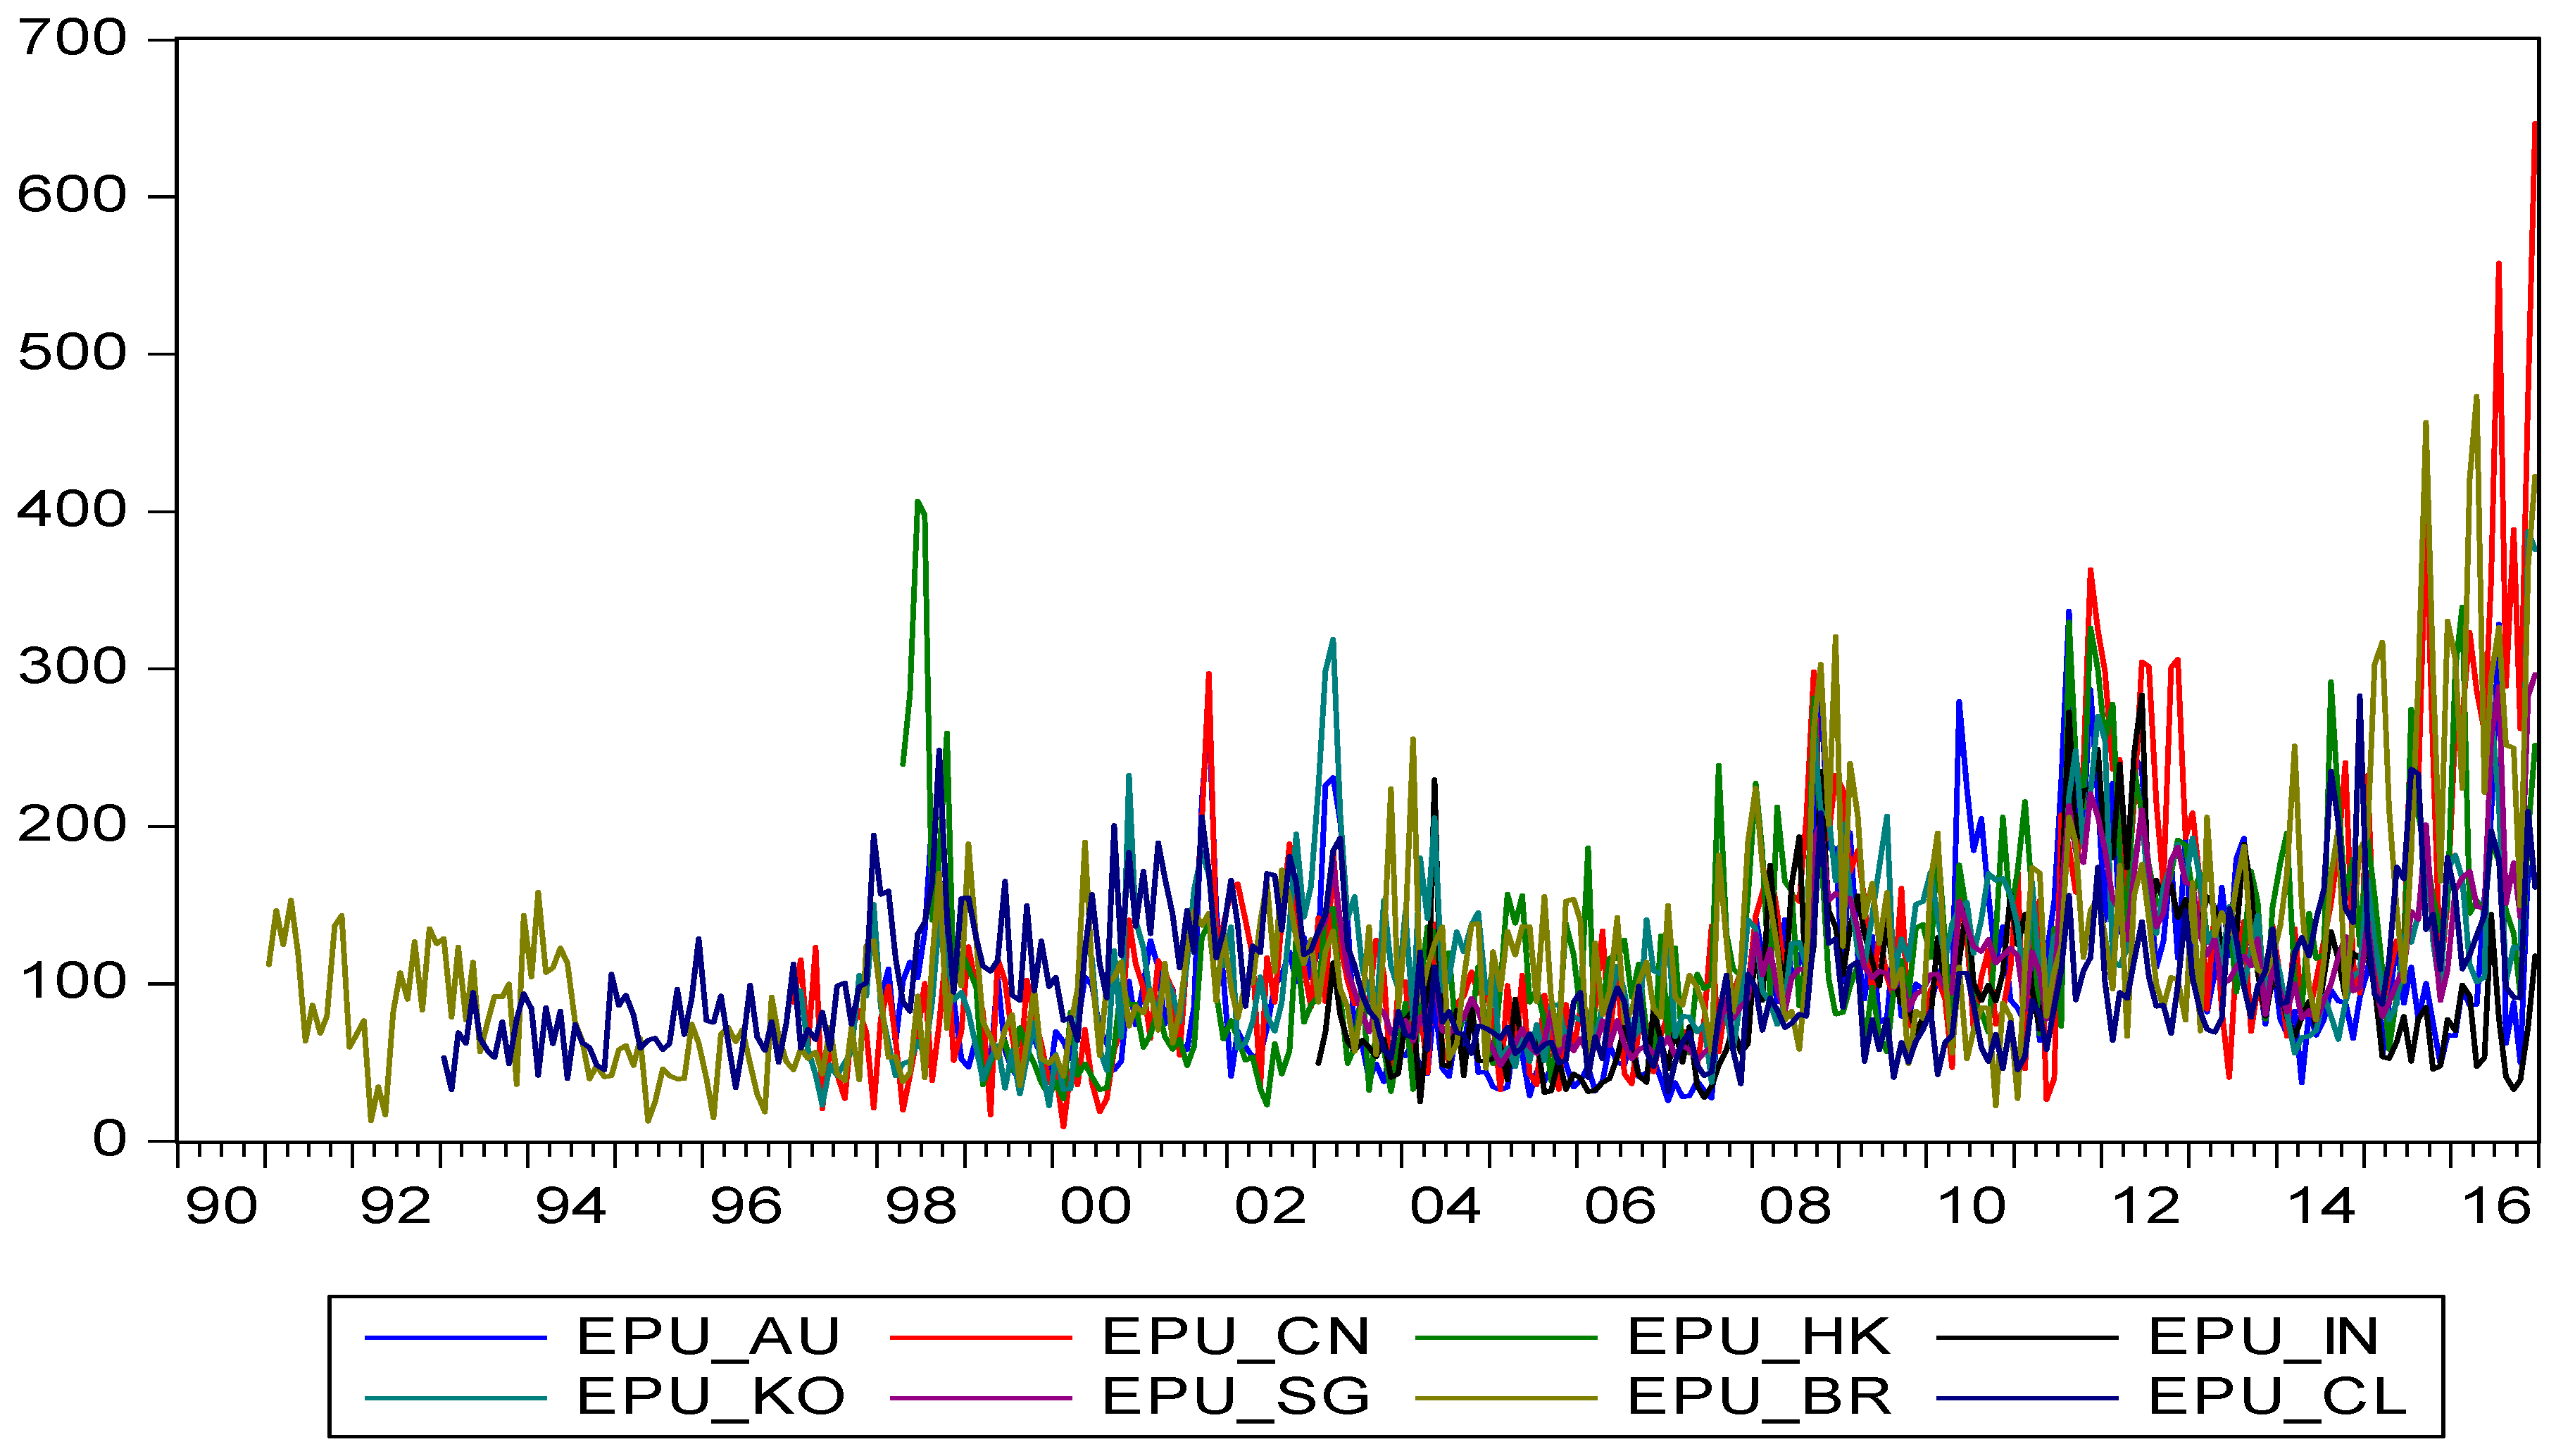
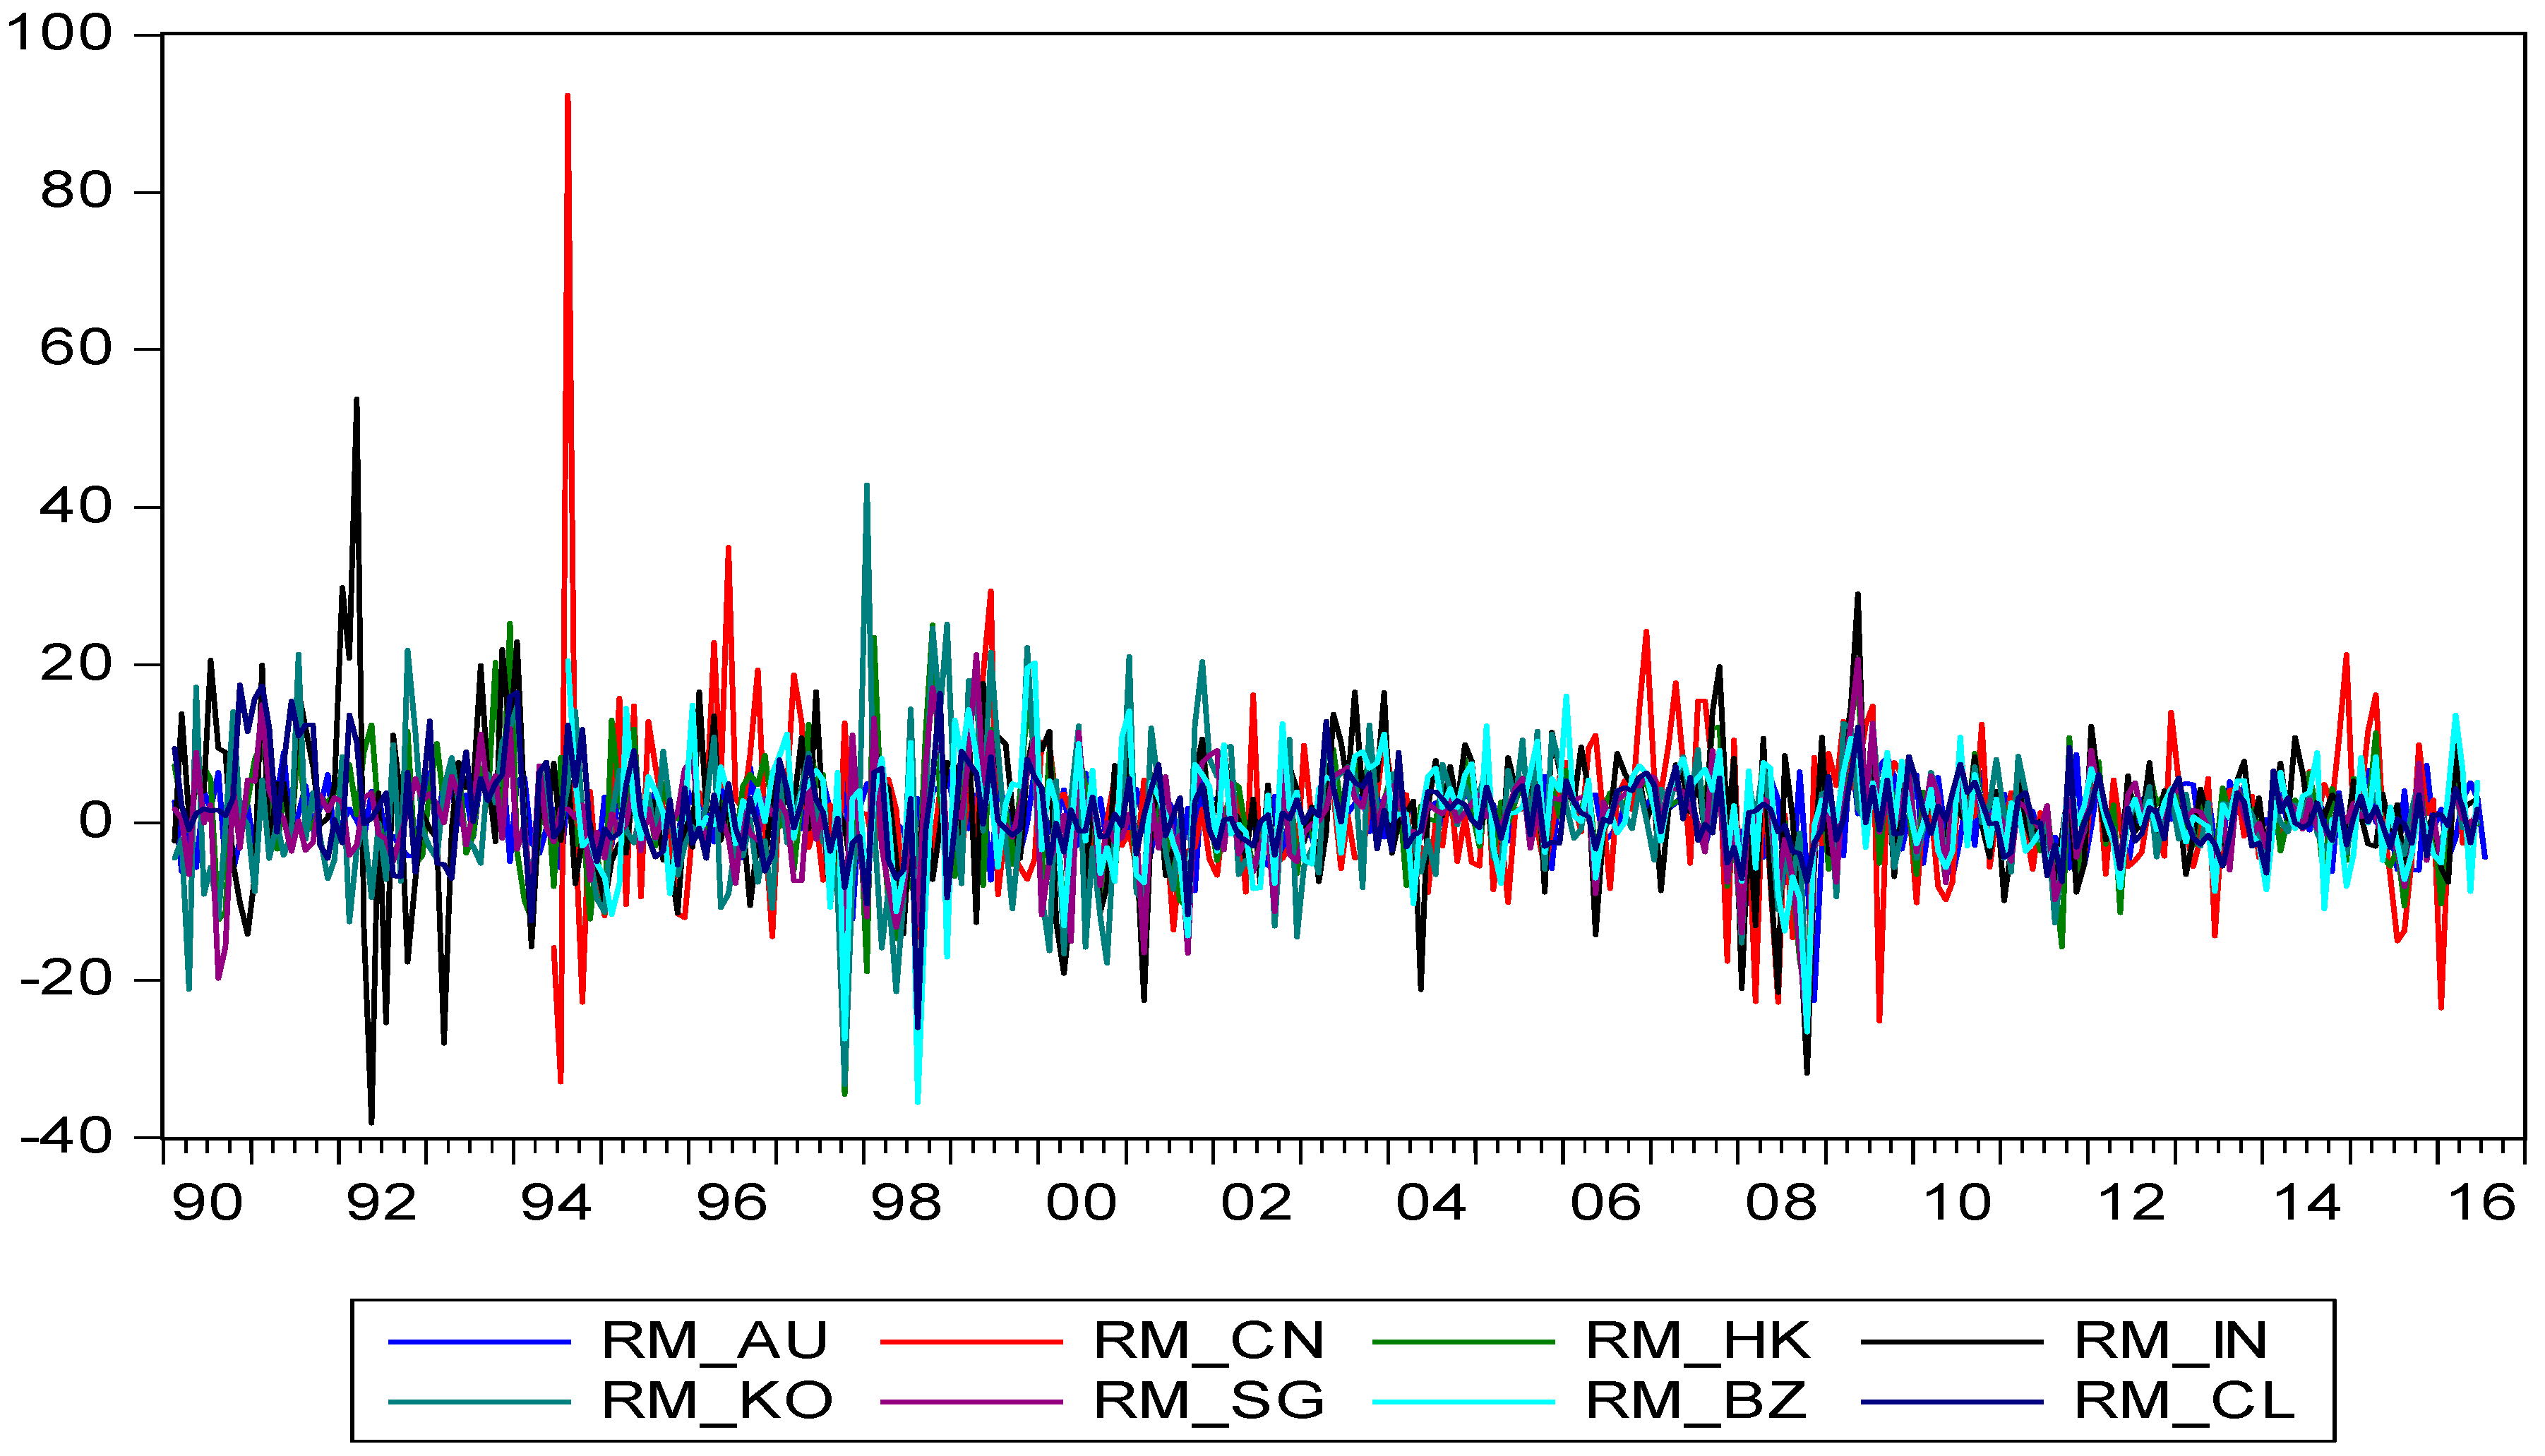
3. Description of Data and Variables
4. Test of Return Autocorrelations
5. Empirical Results
5.1. Evidence from the Regression Method
5.2. GARCH(1,1)-X Method
6. Conclusions
Funding
Conflicts of Interest
Appendix A

| Variable | Description | Source |
|---|---|---|
| = ln() | is the market stock index for each country. | Datastream |
| Market stock returns, which is obtained by taking the natural log-difference of stock price index times 100. | Datastream | |
| Market information set up to time t − 1. | ||
| Variance of stock returns generated from the GARCH(1,1)-M process | ||
| Autocorrelation coefficient with s period lag. | ||
| Economic policy uncertainty index at time t − i from Baker et al. (2016). This variable was transformed by taking the natural logarithm. | Baker et al. (2016) * | |
| EPU innovation measured by natural log-difference of the EPU index. | ||
| Global economic policy uncertainty index at time t − i from Davis (2016). This variable was transformed by taking the natural logarithm. | Davis (2016) * | |
| Global EPU innovation measured by the natural log-difference of GEPU index. | ||
| Random error term. | ||
| Information set conditional on time t − 1 in the empirical test. | ||
| CED (·) | Generalized error distribution. | |
| G7 | Group 7 industrial markets | |
| APLA | Asian-Pacific and Latin American (APLA) markets |
References
- Antonakakis, Nikolaos, Ioannis Chatziantoniou, and George Filis. 2013. Dynamic co-movements of stock market returns, implied volatility and policy uncertainty. Economics Letters 120: 87–92. [Google Scholar] [CrossRef]
- Baker, Scott R., Nicholas Bloom, and Steven J. Davis. 2016. Measuring economic policy uncertainty. Quarterly Journal of Economics 131: 1593–636. [Google Scholar] [CrossRef]
- Bali, Turan G., and Nusret Cakici. 2010. World market risk, country-specific risk and expected returns in international stock markets. Journal of Banking and Finance 34: 1152–65. [Google Scholar] [CrossRef]
- Bali, Turan G., K. Ozgur Demirtas, and Haim Levy. 2009. Is there an intertemporal relation between downside risk and expected returns? Journal of Financial and Quantitative Analysis 44: 883–909. [Google Scholar] [CrossRef]
- Bansal, Ravi, Varoujan Khatchatrian, and Amir Yaron. 2005. Interpretable asset markets? European Economic Review 49: 531–56. [Google Scholar] [CrossRef]
- Bekaert, Geert, and Campbell R. Harvey. 1995. Time-varying world market integration. Journal of Finance 50: 403–44. [Google Scholar] [CrossRef]
- Birz, Gene, and John R. Lott Jr. 2011. The effect of macroeconomic news on stock returns: New evidence from newspaper coverage. Journal of Banking & Finance 11: 2791–800. [Google Scholar]
- Bloom, Nicholas. 2009. The impact of uncertainty shocks. Econometrica 77: 623–85. [Google Scholar]
- Bollerslev, Tim. 2010. Glossary to ARCH (GARCH). In Volatility and Time Series Econometrics: Essays in Honor of Robert Engle. Edited by Tim Bollerslev, Jeffrey Russell and Mark Watson. Oxford: Oxford University Press. [Google Scholar]
- Bollerslev, Tim, Ray Y. Chou, and Kenneth F. Kroner. 1992. ARCH modeling in finance: A review of the theory and empirical evidence. Journal of Econometrics 52: 5–59. [Google Scholar] [CrossRef]
- Boyd, John H., Jian Hu, and Ravi Jagannathan. 2005. The Stock market’s reaction to unemployment news: Why bad news is usually good for stocks. Journal of Finance 60: 649–70. [Google Scholar] [CrossRef]
- Caggiano, Giovanni, Efrem Castelnuovo, and Nicolas Groshenny. 2014. Uncertainty shocks and unemployment dynamics in U.S. recessions. Journal of Monetary Economics 67: 78–92. [Google Scholar] [CrossRef]
- Campbell, John Y., Andrew W. Lo, and Archie Craig MacKinlay. 1997. The Econometrics of Financial Markets. Princeton: Princeton University Press. [Google Scholar]
- Chen, Xiaoyu, and Thomas C. Chiang. 2016. Stock returns and economic forces—An empirical investigation of Chinese markets. Global Finance Journal 30: 45–65. [Google Scholar] [CrossRef]
- Chen, Jian, Fuwei Jiang, and Guoshi Tong. 2017. Economic policy uncertainty in China and stock market expected returns. Accounting & Finance 57: 1265–86. [Google Scholar]
- Chen, Cathy Yi-Hsuan, Thomas C. Chiang, and Wolfgang Karl Härdle. 2018. Downside risk and stock returns in the G7 countries: An empirical analysis of their long-run and short-run dynamics. Journal of Banking & Finance 93: 21–32. [Google Scholar]
- Chiang, Thomas C. 1985. The Impact of unexpected macro-disturbances on exchange rates in monetary models. Quarterly Review of Economics and Business 25: 49–57. [Google Scholar]
- Chiang, Thomas C. 2019. Empirical Analysis of Economic Policy Uncertainty and Stock Returns in Asian Markets. In Advances in Pacific Basin Business, Economics and Finance. Bingley: Emerald Group Publishing. [Google Scholar]
- Chiang, Thomas C., and Shuh-Chyi Doong. 2001. Empirical Analysis of Stock Returns and Volatilities: Evidence from Seven Asian Stock Markets Based on TAR-GARCH Model. Review of Quantitative Finance and Accounting 17: 301–18. [Google Scholar] [CrossRef]
- Chiang, Thomas C., and Y. Zhang. 2018. An Empirical Investigation of Risk-Return Relations in Chinese Equity Markets: Evidence from Aggregate and Sectoral Data. International Journal of Financial Studies 6: 35. [Google Scholar] [CrossRef]
- Chiang, Thomas C., Bang Nam Jeon, and Huimin Li. 2007. Dynamic correlation analysis of financial contagion: Evidence from Asian markets. Journal of International Money and Finance 26: 1206–28. [Google Scholar] [CrossRef]
- Cornell, Bradford. 1983. The Money supply announcements puzzle: Review and interpretation. American Economic Review 73: 644–58. [Google Scholar]
- Davis, Steven J. 2016. An Index of Global Economic Policy Uncertainty. NBER Working Paper 22740. Available online: http://faculty.chicagobooth.edu/steven.davis/pdf/GlobalEconomic.pdf (accessed on 30 November 2018).
- Ding, Zhuanxin, Clive W. J. Granger, and Robert F. Engle. 1993. A long memory property of stock market returns and a new model. Journal of Empirical Finance 1: 83–106. [Google Scholar] [CrossRef]
- Fama, Eugene. 1976. Foundations of Finance. New York: Basic Books. [Google Scholar]
- Flannery, Mark J., and Aris Protopapadakis. 2002. Macroeconomic factors do influence aggregate stock returns. Review of Financial Studies 15: 751–82. [Google Scholar] [CrossRef]
- Forbes, Kristin J. 2012. The “Big C”: identifying and mitigating contagion. In Proceedings—Economic Policy Symposium. Jackson Hole: Federal Reserve Bank of Kansas City, pp. 23–87. [Google Scholar]
- Glezakos, Michalis, John Mylonakis, and Charalampos Kafouros. 2012. The Impact of Accounting Information on Stock Prices: Evidence from the Athens Stock Exchange. International Journal of Economics and Finance 4: 55–68. [Google Scholar] [CrossRef]
- Glosten, Lawrence R., Ravi Jagannathan, and David E. Runkle. 1993. On the relation between the expected value and volatility of the nominal excess return on stocks. Journal of Finance 48: 1779–801. [Google Scholar] [CrossRef]
- Jianu, Iulia, Ionel Jianu, Bogdan V. Ileanu, Monica V. Nedelcu, and Claudiu Herţeliu. 2014. The Value Relevance of Financial Reporting in Romania. Economic Computation and Economic Cybernetics Studies and Research/Academy of Economic Studies 48: 167–82. [Google Scholar] [CrossRef]
- Klößner, Stefan, and Rodrigo Sekkel. 2014. International spillovers of policy uncertainty. Economics Letters 124: 508–12. [Google Scholar] [CrossRef]
- Knight, Frank. 1921. Risk, Uncertainty, and Profit, 5th ed. New York: Dover Publications. [Google Scholar]
- Lauterbach, Beni. 1989. Consumption volatility, production volatility, spot-rate volatility, and the returns on treasury bills and bonds. Journal of Financial Economics 24: 155–79. [Google Scholar] [CrossRef]
- Leduc, Sylvain, and Zheng Liu. 2016. Uncertainty shocks are aggregate demand shocks. Journal of Monetary Economics 82: 20–35. [Google Scholar] [CrossRef]
- Li, Xiao-Ming. 2017. New evidence on economic policy uncertainty and equity premium. Pacific-Basin Finance Journal 46: 41–56. [Google Scholar] [CrossRef]
- Li, Qi, Jian Yang, Cheng Hsiao, and Young-Jae Chang. 2005. The relationship between stock returns and volatility in international stock markets. Journal of Empirical Finance 12: 650–65. [Google Scholar] [CrossRef]
- Liu, Li, and Tao Zhang. 2015. Economic policy uncertainty and stock market volatility. Finance Research Letter 15: 99–105. [Google Scholar] [CrossRef]
- Lopez de Carvalho, Teresa. 2017. Economic Policy Uncertainty and Return on Financial Assets—The G7 Case. Master’s thesis, ISCTE Business School, Lisbon, Portugal. [Google Scholar]
- McQueen, Grant, and V. Vance Roley. 1993. Stock prices, news and business conditions. Review of Financial Studies 6: 683–707. [Google Scholar] [CrossRef]
- Mishkin, Frederic S. 1982. Monetary policy and short-term interest rates: An efficient markets-rational expectations approach. Journal of Finance 37: 63–72. [Google Scholar]
- Nelson, Daniel B. 1991. Conditional heteroskedasticity in asset returns: A new approach. Econometrica 59: 347–70. [Google Scholar] [CrossRef]
- Newey, Whitney K., and Kenneth D. West. 1987. A simple, positive semi-definite, heteroskedasticity and autocorrelation consistent covariance matrix. Econometrica 55: 703–8. [Google Scholar] [CrossRef]
- Ohlson, J. 1995. Earnings, book values and dividends in quality valuations. Contemporary Accounting Research 11: 661–88. [Google Scholar] [CrossRef]
- Ozoguz, Arzu. 2009. Good times or bad times? Investors’ uncertainty and stock returns. Review of Financial Studies 22: 4377–422. [Google Scholar] [CrossRef]
- Pearce, Douglas K., and V. Vance Roley. 1985. Stock prices and economic news. Journal of Business 58: 49–67. [Google Scholar] [CrossRef]
- Tsai, I-Chun. 2017. The source of global stock market risk: A viewpoint of economic policy uncertainty. Economic Modelling 60: 122–31. [Google Scholar] [CrossRef]
- Whaley, Robert E. 2009. Understanding the VIX. Journal of Portfolio Management 35: 98–105. [Google Scholar] [CrossRef]
| 1 | This may stem from Frank Knight’s statement (Knight 1921) regarding uncertainty that suggests economic agents have no historical data from which a probability distribution is developed. If there is any measure of uncertainty, which can be used as a proxy for the unexpected component of the state variable (Cornell 1983; Chiang 1985; Lauterbach 1989), then the omitted variable problem may arise. |
| 2 | This statement is based on Fama’s perception (1976) of market efficiency. However, Ohlson (1995); Glezakos et al. (2012) and Jianu et al. (2014) find that financial statements provide a significant source information for predicting the stock price. |
| 3 | The popularity of this model is due to Bollerslev et al. (1992). Bollerslev (2010) provides different specifications of the conditional volatility models. In addition, some papers (Glosten et al. 1993; Chiang and Doong 2001) prefer to add an asymmetric term to the conditional variance equation to capture the bad news, which has a more profound impact on variance as compared to an equal amount of good news. Our specification indicates that this is redundant, since the inclusion of Δηt−1 and Δzt−1 already captures the effect arising from bad news. |
| 4 | Appendix A provides a description of a list of variables and data sources. |
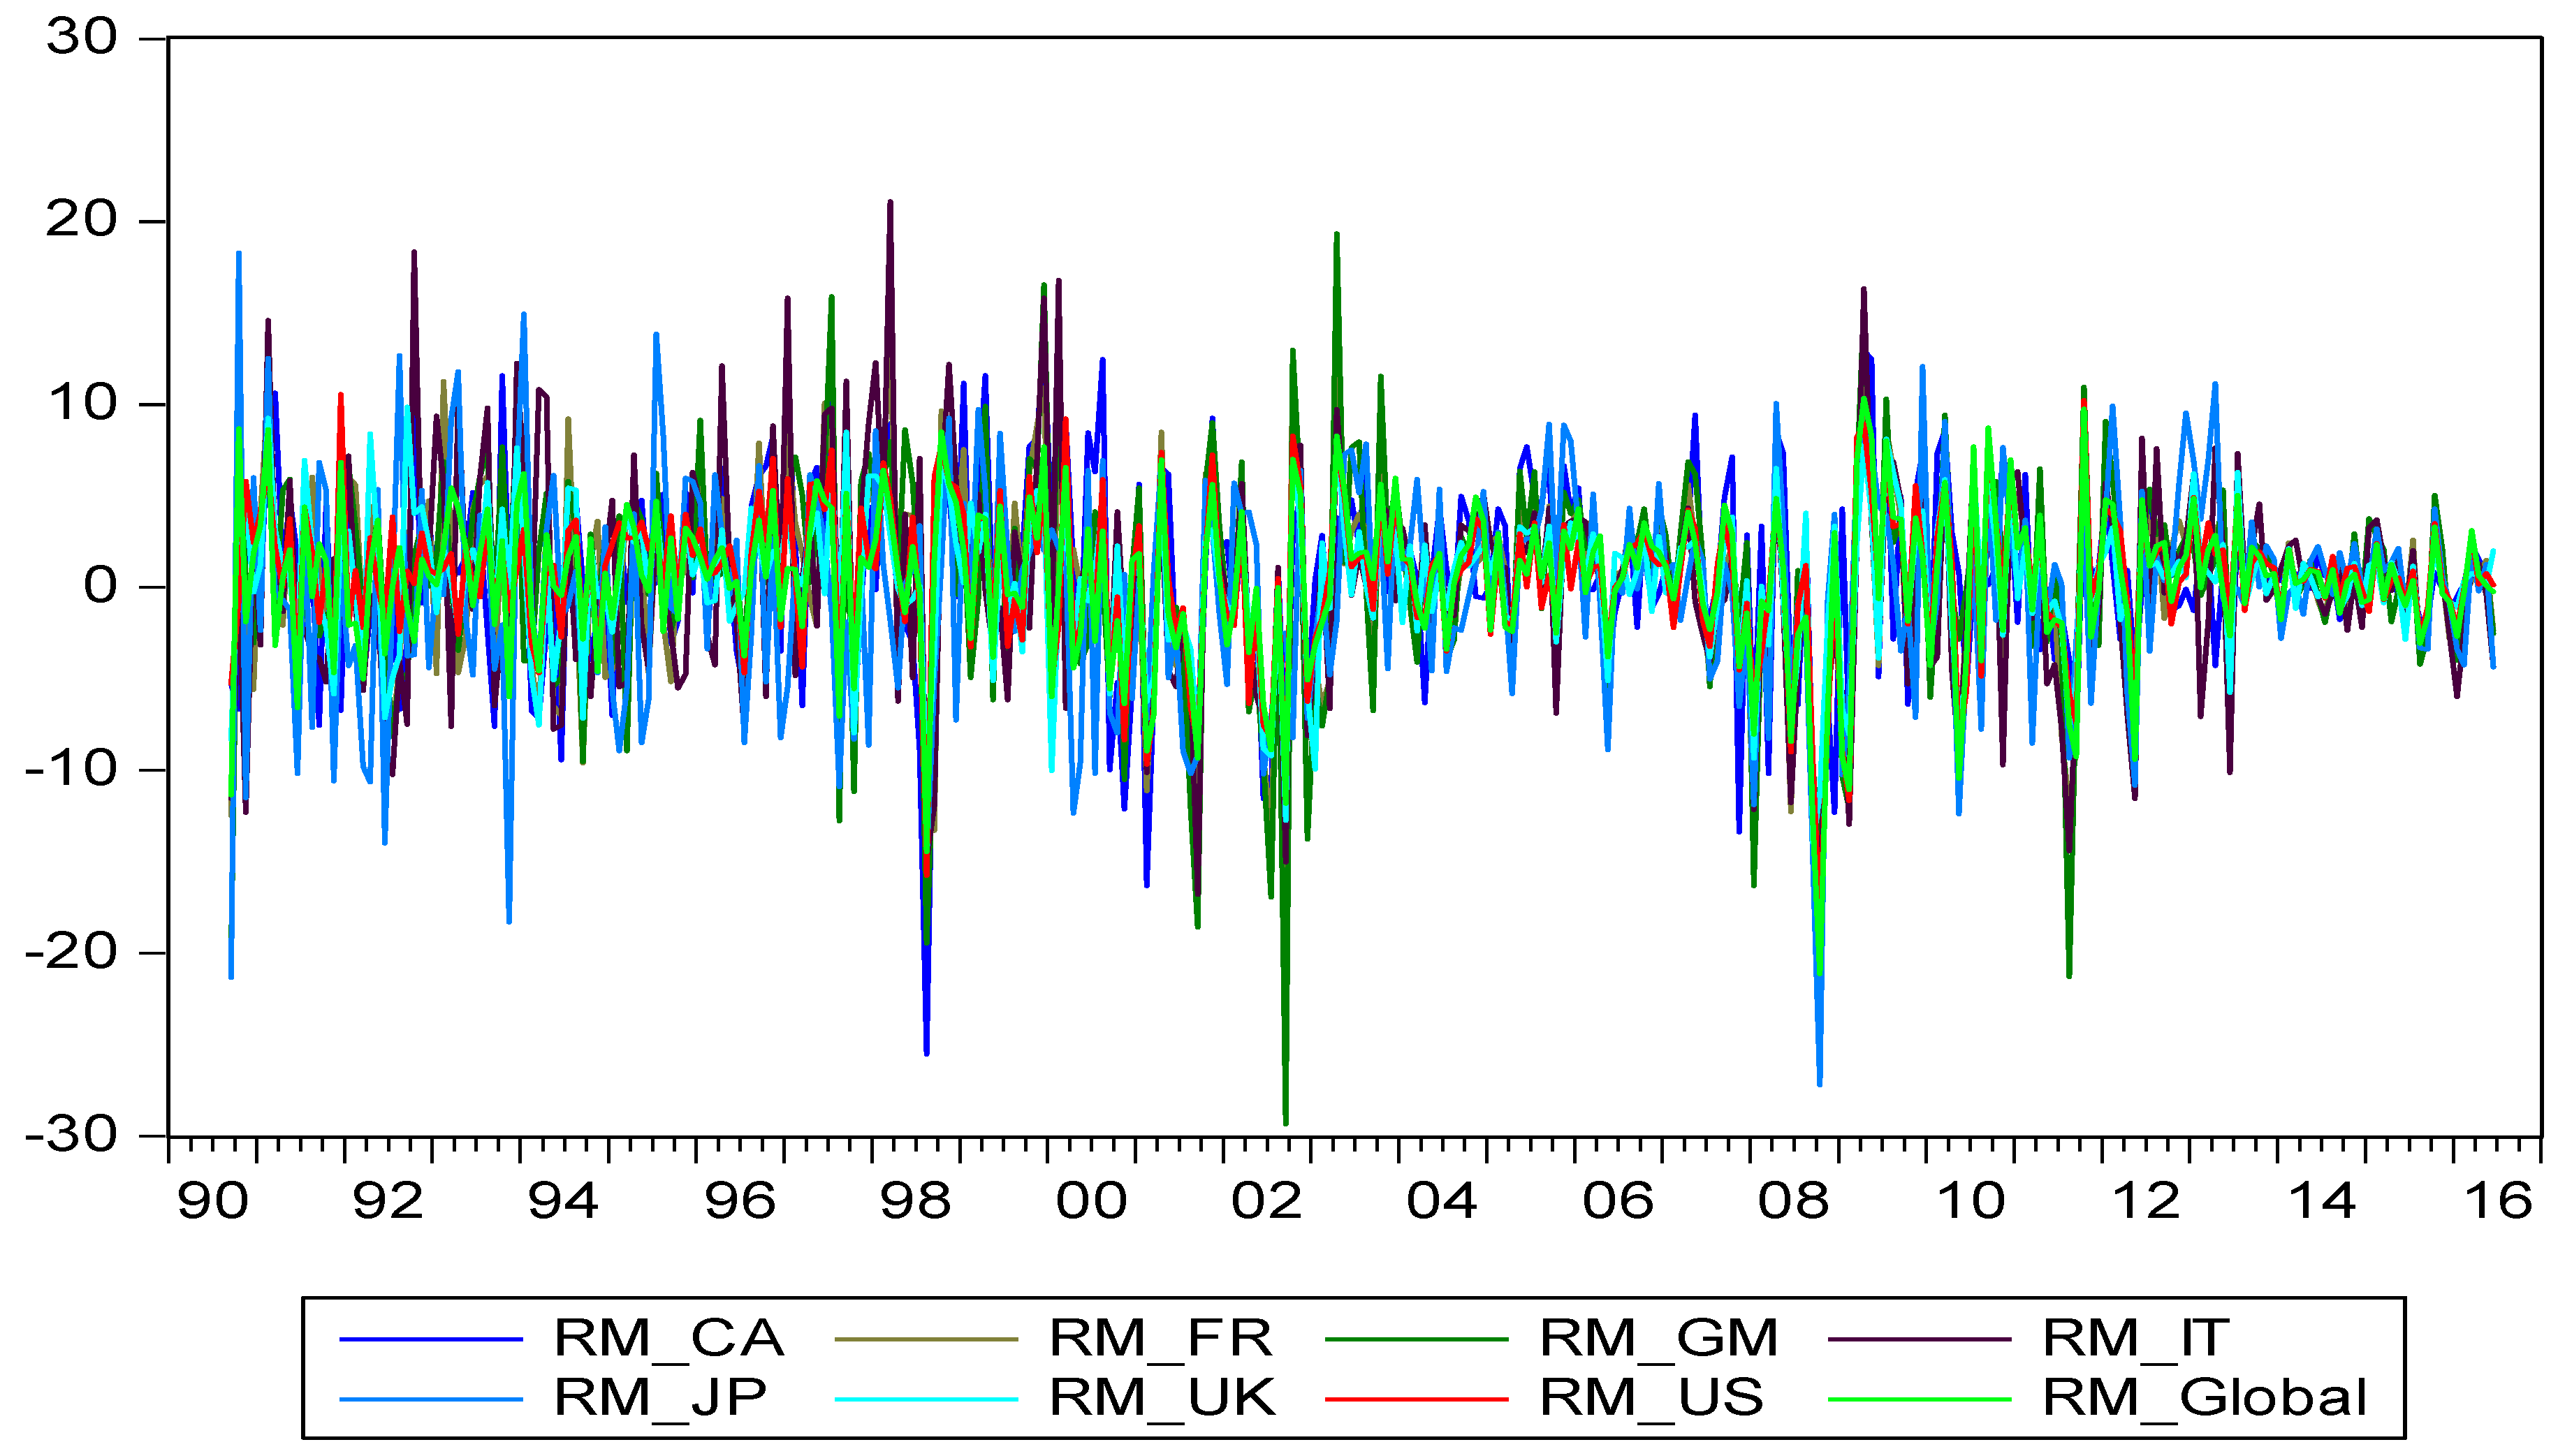
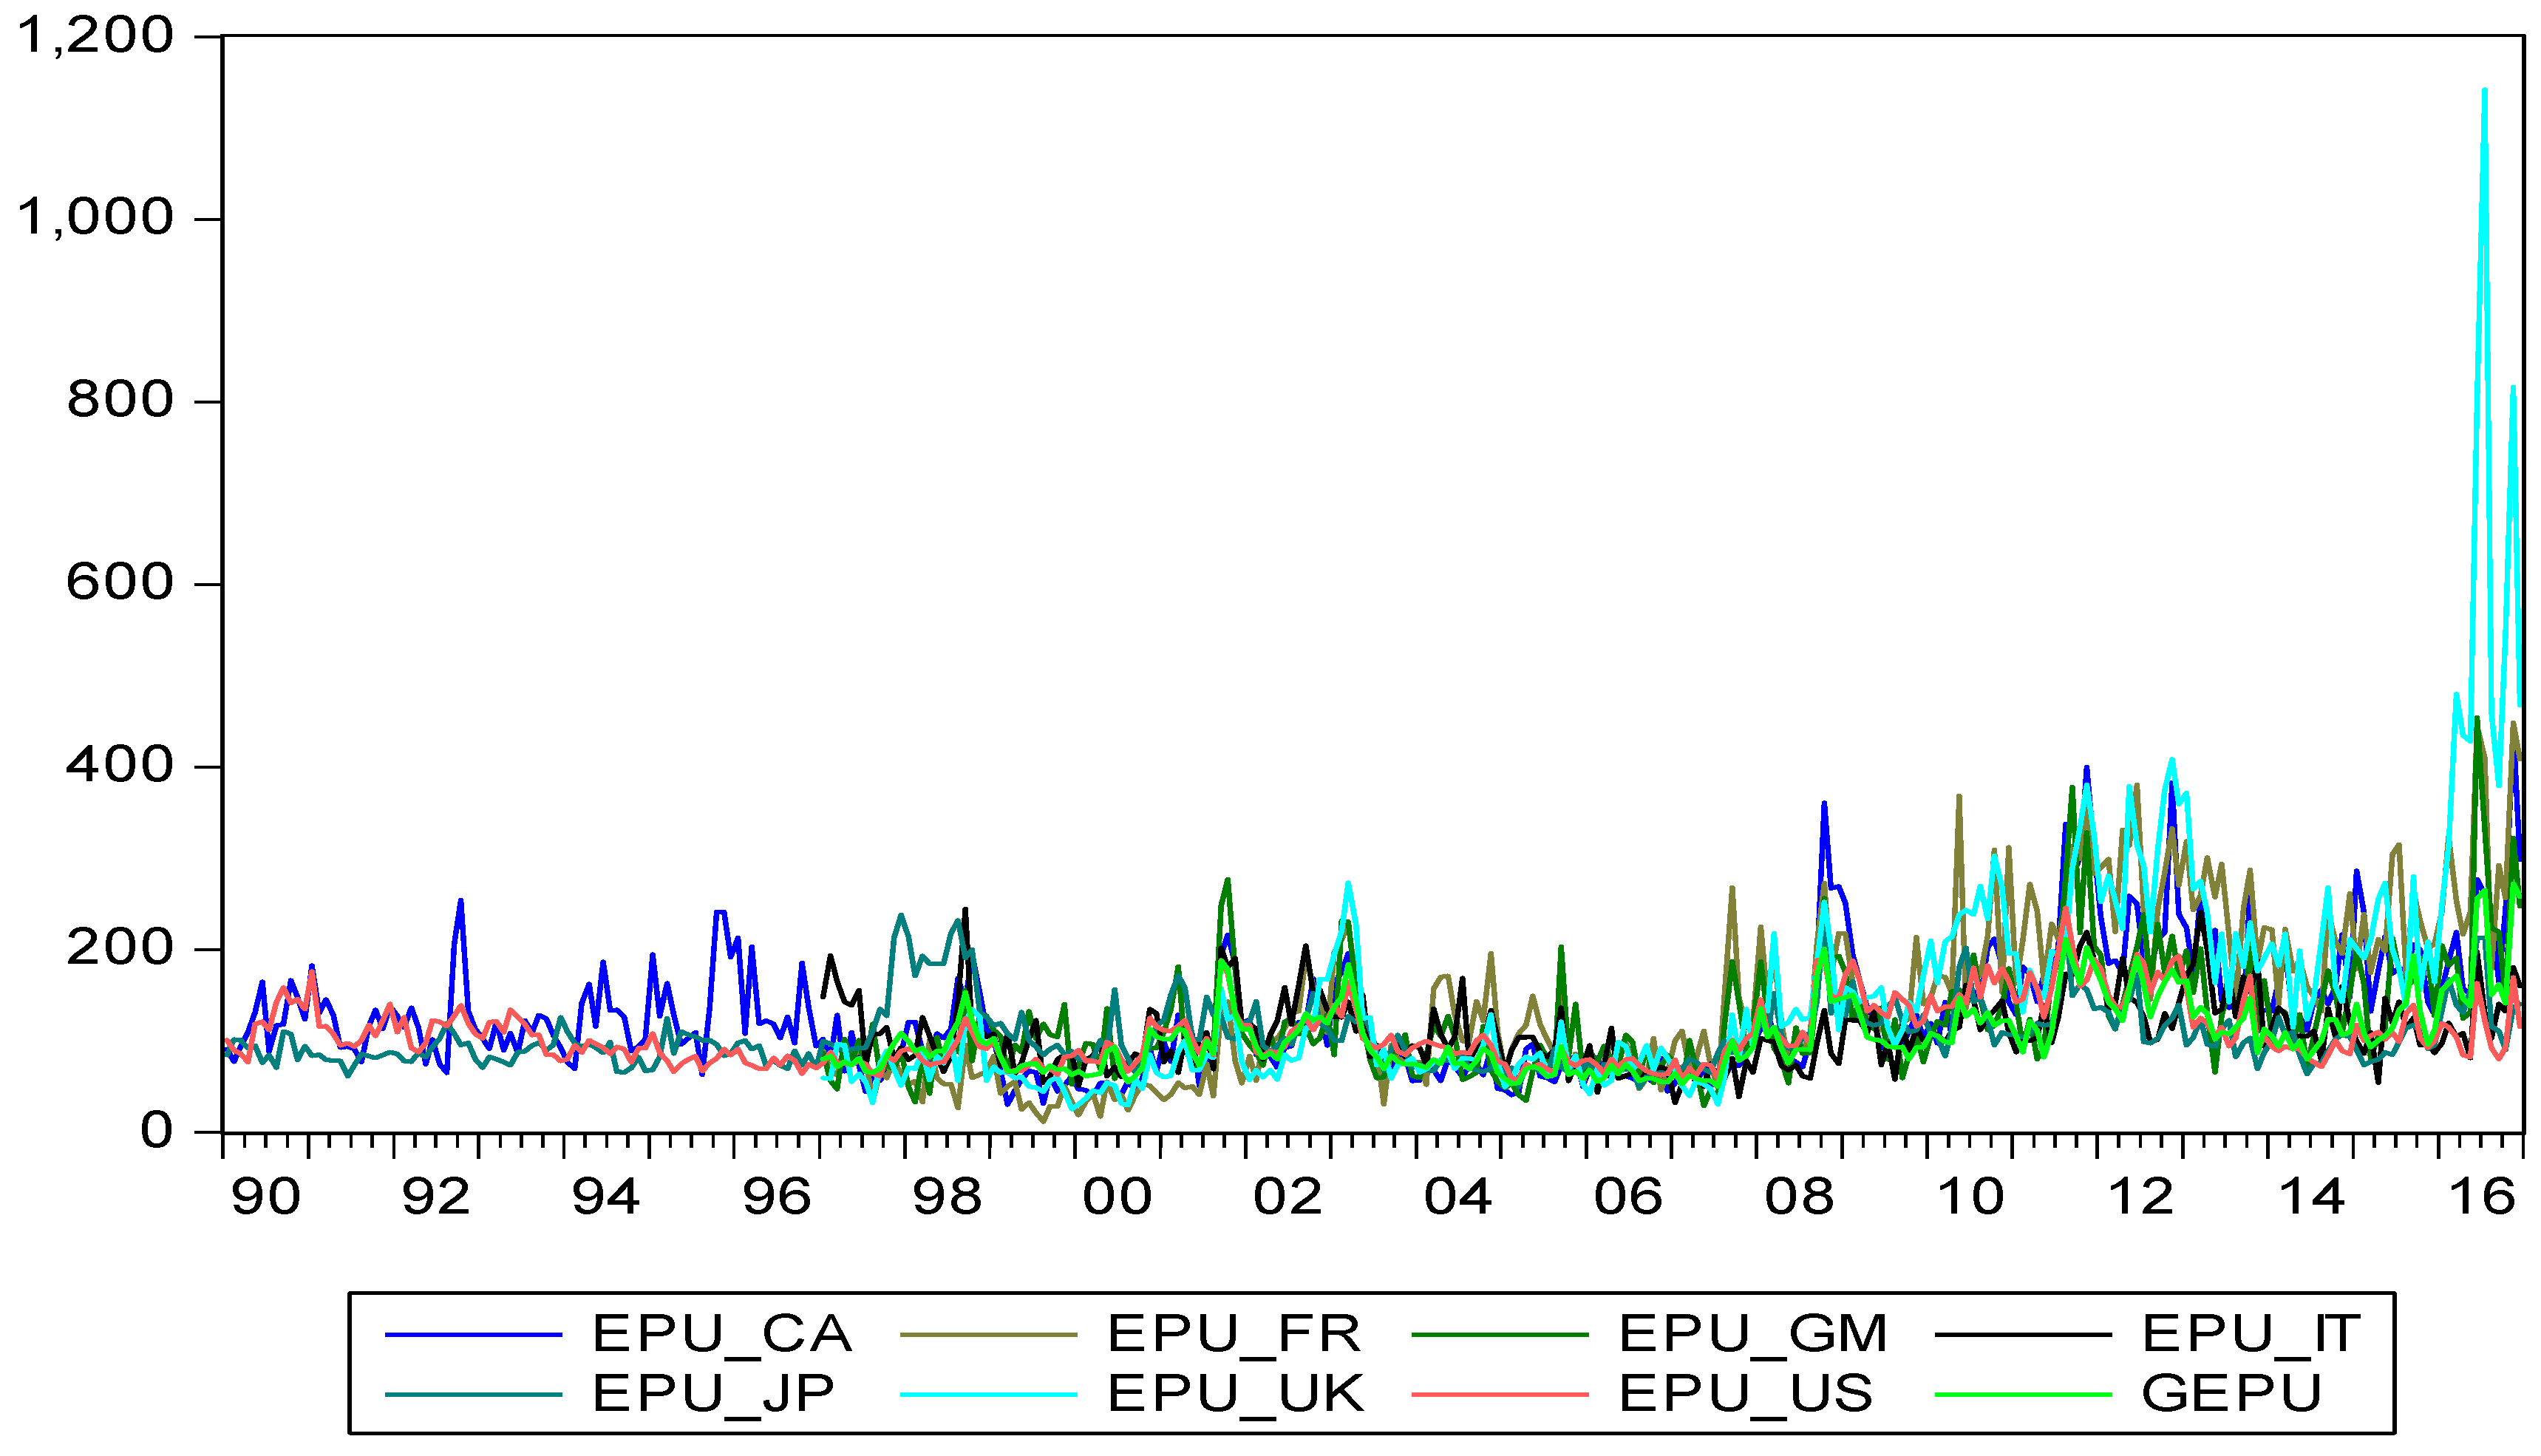

| Panel A. G7 Market | ||||||||
| CA | FR | GM | IT | JP | UK | US | Global | |
| Mean | 0.55 | 0.30 | 0.55 | 0.11 | −0.19 | 0.37 | 0.57 | 0.39 |
| Median | 0.62 | 0.90 | 0.95 | 0.04 | 0.24 | 0.66 | 1.00 | 0.78 |
| Maximum | 13.89 | 12.59 | 19.37 | 21.09 | 18.29 | 9.89 | 10.58 | 10.35 |
| Minimum | −25.53 | −19.23 | −29.33 | −16.80 | −27.22 | −13.95 | −18.56 | −21.13 |
| Std. Dev. | 5.56 | 5.30 | 6.02 | 6.00 | 6.02 | 3.95 | 4.08 | 4.23 |
| Skewness | −0.62 | −0.50 | −0.94 | 0.15 | −0.49 | −0.62 | −0.84 | −0.94 |
| Kurtosis | 4.77 | 3.58 | 6.22 | 3.80 | 4.40 | 3.93 | 5.17 | 5.56 |
| Jarque-Bera | 60.37 | 17.49 | 179.73 | 9.47 | 37.72 | 31.28 | 97.13 | 130.74 |
| Observations | 310 | 310 | 310 | 310 | 310 | 310 | 310 | 310 |
| Panel B. Asian-Pacific and Latin America markets | ||||||||
| AU | CN | HK | IN | KO | SG | BZ | CL | |
| Mean | 0.79 | 0.75 | 0.90 | 1.11 | 0.67 | 0.50 | 1.11 | 1.27 |
| Median | 1.25 | 0.63 | 1.51 | 1.04 | 0.26 | 0.84 | 1.54 | 0.52 |
| Maximum | 9.73 | 92.34 | 25.30 | 53.79 | 42.89 | 21.33 | 20.54 | 17.44 |
| Minimum | −22.58 | −32.94 | −34.50 | −38.14 | −33.29 | −26.61 | −35.56 | −26.06 |
| Std. Dev. | 4.02 | 10.63 | 7.17 | 9.28 | 8.21 | 5.78 | 7.24 | 5.29 |
| Skewness | −0.89 | 2.33 | −0.30 | 0.13 | 0.41 | −0.47 | −0.81 | 0.14 |
| Kurtosis | 5.99 | 23.54 | 5.66 | 7.74 | 6.23 | 5.89 | 6.30 | 5.62 |
| Jarque-Bera | 156.67 | 4898.77 | 96.29 | 291.48 | 142.93 | 118.76 | 148.43 | 89.56 |
| Observations | 310 | 265 | 310 | 310 | 310 | 310 | 263 | 310 |
| Market | |||||||||||||
|---|---|---|---|---|---|---|---|---|---|---|---|---|---|
| CA | 0.086 | 0.097 | 0.092 | −0.002 | −0.081 | −0.062 | −0.017 | 0.100 | 0.046 | 0.018 | 0.047 | −0.081 | 18.58 |
| 1.47 | 1.64 | 1.55 | −0.03 | −1.37 | −1.06 | −0.28 | 1.70 | 0.78 | 0.30 | 0.81 | −1.38 | [0.10] | |
| FR | 0.125 | −0.081 | 0.095 | 0.029 | −0.006 | 0.025 | −0.076 | 0.146 | −0.072 | 0.110 | −0.050 | 0.101 | 13.18 |
| 2.13 * | −1.37 | 1.62 | 0.49 | −0.10 | 0.43 | −1.32 | 2.53 * | −1.23 | 1.90 | −0.86 | 1.77 | [0.36] | |
| GM | 0.068 | 0.006 | 0.045 | 0.035 | 0.017 | 0.037 | −0.079 | 0.098 | −0.049 | 0.005 | −0.004 | 0.116 | 10.00 |
| 1.17 | 0.11 | 0.76 | 0.60 | 0.29 | 0.64 | −1.36 | 1.68 | −0.83 | 0.09 | −0.06 | 2.03 * | [0.62] | |
| IT | 0.036 | 0.004 | 0.120 | 0.099 | −0.111 | −0.004 | −0.119 | 0.148 | 0.099 | −0.019 | 0.034 | 0.040 | 23.46 |
| 0.61 | 0.06 | 2.03 * | 1.68 | −1.90 | −0.07 | −2.05 * | 2.55 * | 1.70 | −0.33 | 0.58 | 0.70 | [0.02] * | |
| JP | 0.086 | −0.021 | 0.103 | 0.032 | 0.004 | −0.128 | −0.027 | 0.053 | 0.028 | 0.038 | −0.012 | −0.037 | 7.36 |
| 1.46 | −0.35 | 1.76 | 0.54 | 0.07 | −2.17 * | −0.45 | 0.91 | 0.48 | 0.66 | −0.22 | −0.67 | [0.83] | |
| UK | 0.044 | −0.034 | −0.022 | 0.136 | −0.015 | −0.011 | 0.005 | 0.068 | 0.015 | −0.003 | −0.024 | 0.036 | 12.63 |
| 0.75 | −0.58 | −0.38 | 2.31 * | −0.26 | −0.18 | 0.08 | 1.16 | 0.25 | −0.05 | −0.42 | 0.62 | [0.40] | |
| US | 0.073 | −0.017 | 0.105 | 0.047 | 0.052 | −0.079 | 0.051 | 0.035 | −0.010 | 0.010 | 0.038 | 0.070 | 11.47 |
| 1.24 | −0.29 | 1.79 | 0.80 | 0.88 | −1.34 | 0.87 | 0.60 | −0.17 | 0.18 | 0.66 | 1.20 | [0.49] |
| Market | |||||||||||||
|---|---|---|---|---|---|---|---|---|---|---|---|---|---|
| AU | 0.002 | 0.079 | 0.130 | 0.041 | −0.062 | −0.045 | 0.126 | 0.019 | 0.061 | −0.035 | −0.056 | 0.061 | 8.68 |
| 0.04 | 1.35 | 2.23 | 0.70 | −1.05 | −0.77 | 2.17 * | 0.33 | 1.04 | −0.61 | −0.96 | 1.04 | [0.73] | |
| CN | 0.131 | 0.136 | −0.059 | 0.123 | 0.033 | −0.138 | 0.073 | 0.002 | 0.002 | −0.041 | 0.068 | −0.024 | 9.44 |
| 2.05 * | 2.12 * | −0.92 | 1.90 | 0.51 | −2.11 * | 1.11 | 0.03 | 0.04 | −0.79 | 1.33 | −0.47 | [0.67] | |
| HK | 0.084 | 0.037 | 0.004 | −0.032 | 0.023 | −0.019 | 0.132 | 0.026 | 0.050 | 0.049 | −0.110 | −0.076 | 21.25 |
| 1.44 | 0.64 | 0.06 | −0.56 | 0.41 | −0.32 | 2.32 * | 0.45 | 0.87 | 0.85 | −1.90 | −1.32 | [0.05] * | |
| IN | 0.121 | 0.050 | −0.010 | −0.068 | 0.097 | 0.061 | −0.046 | −0.034 | −0.038 | 0.003 | 0.043 | −0.083 | 16.96 |
| 2.08 * | 0.86 | −0.17 | −1.16 | 1.66 | 1.03 | −0.79 | −0.58 | −0.65 | 0.05 | 0.75 | −1.45 | [0.15] | |
| KO | 0.152 | −0.069 | 0.030 | −0.092 | 0.030 | 0.010 | 0.040 | −0.016 | 0.061 | −0.063 | 0.060 | −0.084 | 9.75 |
| 2.61 * | −1.18 | 0.52 | −1.58 | 0.52 | 0.18 | 0.69 | −0.28 | 1.07 | −1.12 | 1.05 | −1.49 | [0.64] | |
| SG | 0.120 | 0.142 | −0.043 | 0.058 | −0.031 | −0.037 | 0.036 | 0.007 | −0.005 | −0.042 | −0.091 | 0.042 | 17.38 |
| 2.06 * | 2.43 * | −0.73 | 0.99 | −0.53 | −0.64 | 0.63 | 0.12 | −0.08 | −0.74 | −1.60 | 0.74 | [0.14] | |
| BR | 0.089 | 0.046 | 0.033 | 0.108 | −0.099 | −0.069 | 0.057 | 0.003 | −0.003 | 0.124 | 0.026 | −0.013 | 15.17 |
| 1.38 | 0.71 | 0.50 | 1.66 | −1.52 | −1.06 | 0.87 | 0.04 | −0.04 | 1.93 | 0.41 | −0.20 | [0.23] | |
| CL | 0.201 | −0.012 | −0.005 | 0.170 | −0.036 | 0.009 | 0.148 | 0.057 | 0.041 | −0.025 | −0.017 | 0.014 | 43.84 |
| 3.48 * | −0.20 | −0.09 | 2.93 * | −0.61 | 0.15 | 2.53 * | 0.96 | 0.70 | −0.43 | −0.29 | 0.25 | [0.00] * |
| Market | ||||||||||||||
|---|---|---|---|---|---|---|---|---|---|---|---|---|---|---|
| Panel A | ||||||||||||||
| CA | 0.231 | 0.291 | 0.255 | 0.149 | 0.269 | 0.266 | 0.215 | 0.276 | 0.170 | 0.168 | 0.218 | 0.142 | 195.88 | 0.00 |
| FR | 0.203 | 0.242 | 0.189 | 0.092 | 0.164 | 0.170 | 0.142 | 0.085 | 0.147 | 0.124 | 0.064 | 0.133 | 90.84 | 0.00 |
| GM | 0.124 | 0.222 | 0.195 | 0.084 | 0.167 | 0.191 | 0.123 | 0.098 | 0.169 | 0.148 | 0.046 | 0.118 | 84.33 | 0.00 |
| IT | 0.134 | 0.140 | 0.241 | 0.090 | 0.076 | 0.174 | 0.088 | 0.113 | 0.139 | 0.068 | 0.030 | 0.079 | 66.36 | 0.00 |
| JP | 0.147 | 0.101 | 0.101 | 0.101 | 0.098 | 0.019 | 0.043 | 0.047 | 0.110 | 0.032 | 0.040 | 0.050 | 26.49 | 0.01 |
| UK | 0.177 | 0.177 | 0.222 | 0.117 | 0.155 | 0.153 | 0.101 | 0.090 | 0.091 | 0.132 | 0.038 | 0.005 | 69.11 | 0.00 |
| US | 0.235 | 0.213 | 0.215 | 0.241 | 0.231 | 0.216 | 0.175 | 0.110 | 0.089 | 0.182 | 0.050 | 0.125 | 128.92 | 0.00 |
| Panel B | ||||||||||||||
| Au | 0.081 | 0.152 | 0.064 | 0.055 | 0.108 | 0.003 | 0.033 | −0.036 | 0.119 | 0.045 | 0.052 | 0.012 | 22.16 | 0.04 |
| CN | 0.142 | 0.159 | 0.048 | 0.087 | 0.105 | 0.044 | 0.13 | 0.041 | 0.124 | 0.1 | 0.117 | 0.034 | 34.69 | 0.00 |
| HK | 0.049 | 0.118 | 0.162 | 0.126 | 0.099 | 0.15 | 0.16 | 0.19 | 0.086 | 0.03 | 0.125 | 0.11 | 59.96 | 0.00 |
| IN | 0.109 | 0.328 | 0.101 | 0.119 | 0.202 | 0.101 | 0.139 | 0.084 | 0.018 | 0.073 | 0.031 | 0.155 | 79.69 | 0.00 |
| KO | 0.053 | 0.19 | 0.265 | 0.189 | 0.219 | 0.209 | 0.169 | 0.163 | 0.29 | 0.092 | 0.175 | 0.127 | 137.45 | 0.00 |
| SG | 0.227 | 0.122 | 0.081 | 0.091 | 0.102 | 0.207 | 0.222 | 0.183 | 0.155 | 0.100 | 0.024 | 0.049 | 80.73 | 0.00 |
| BZ | 0.148 | 0.094 | 0.125 | 0.112 | 0.065 | 0.036 | 0.152 | 0.124 | 0.095 | 0.125 | 0.114 | 0.088 | 40.29 | 0.00 |
| CL | 0.247 | 0.167 | 0.25 | 0.183 | 0.123 | 0.164 | 0.331 | 0.133 | 0.093 | 0.082 | 0.004 | 0.085 | 119.24 | 0.00 |
| Markets | |||||||||
|---|---|---|---|---|---|---|---|---|---|
| CA | 1.751 | −0.042 | 0.009 | 0.024 | −0.082 | 0.052 | 0.020 | 0.05 | 0.11 |
| 1.87 | −3.57 | 0.78 | 2.38 | −3.46 | 2.00 | 0.90 | 0.71 | ||
| FR | 0.745 | −0.029 | 0.019 | 0.006 | −0.111 | 0.073 | 0.016 | 0.01 | 0.14 |
| 1.11 | −4.27 | 2.34 | 0.90 | −5.60 | 2.91 | 0.80 | 0.14 | ||
| GM | 0.676 | −0.072 | 0.046 | 0.024 | −0.130 | 0.059 | 0.033 | −0.07 | 0.16 |
| 0.63 | −5.14 | 2.40 | 1.96 | −5.09 | 1.73 | 1.24 | −1.08 | ||
| IT | −0.198 | −0.070 | 0.031 | 0.041 | −0.093 | 0.063 | 0.003 | −0.07 | 0.16 |
| −0.16 | −5.34 | 1.91 | 3.09 | −5.05 | 2.56 | 0.14 | −1.03 | ||
| JP | 2.006 | −0.089 | 0.029 | 0.043 | −0.062 | 0.032 | 0.043 | −0.02 | 0.19 |
| 1.92 | −4.47 | 1.34 | 2.57 | −3.85 | 1.24 | 1.81 | −0.30 | ||
| UK | −0.334 | −0.017 | 0.022 | −0.001 | −0.081 | 0.037 | 0.015 | −0.09 | 0.15 |
| −0.75 | −2.42 | 2.48 | −0.21 | −4.98 | 1.77 | 0.95 | −1.27 | ||
| US | 0.975 | −0.053 | 0.020 | 0.030 | −0.053 | 0.043 | 0.034 | −0.02 | 0.12 |
| 1.11 | −5.22 | 1.16 | 2.38 | −1.85 | 1.49 | 1.37 | −0.18 |
| Markets | |||||||||
|---|---|---|---|---|---|---|---|---|---|
| AU | 2.079 | −0.010 | −0.039 | 0.035 | −0.007 | −0.042 | 0.054 | −0.089 | 0.15 |
| 3.71 | −1.04 | −2.46 | 5.64 | −0.33 | −1.93 | 3.14 | −0.96 | ||
| CN | 0.848 | −0.026 | 0.005 | 0.018 | −0.076 | 0.030 | −0.009 | 0.058 | 0.03 |
| 0.90 | −2.44 | 0.33 | 1.61 | −2.44 | 0.92 | −0.22 | 0.86 | ||
| HK | 1.539 | −0.038 | 0.009 | 0.022 | −0.087 | 0.068 | 0.009 | 0.052 | 0.13 |
| 1.62 | −4.45 | 0.68 | 2.15 | −3.40 | 1.99 | 0.38 | 0.72 | ||
| IN | 3.956 | −0.080 | 0.024 | 0.030 | −0.017 | −0.058 | 0.073 | 0.003 | 0.17 |
| 3.16 | −4.16 | 1.10 | 1.43 | −0.56 | −1.45 | 1.82 | 0.03 | ||
| KO | −0.605 | −0.055 | 0.039 | 0.029 | −0.079 | 0.057 | 0.019 | 0.090 | 0.06 |
| −0.33 | −3.32 | 1.46 | 1.65 | −2.79 | 1.35 | 0.62 | 1.59 | ||
| SG | 2.346 | −0.057 | 0.003 | 0.041 | −0.087 | 0.051 | 0.057 | 0.159 | 0.15 |
| 2.19 | −2.80 | 0.10 | 1.72 | −1.26 | 0.71 | 0.59 | 1.53 | ||
| BR | 0.862 | −0.027 | 0.012 | 0.016 | −0.095 | 0.049 | 0.022 | −0.023 | 0.06 |
| 0.80 | −2.84 | 1.04 | 1.73 | −3.89 | 1.51 | 0.88 | −0.33 | ||
| CL | 1.109 | −0.035 | 0.007 | 0.025 | −0.034 | 0.025 | 0.002 | −0.006 | 0.08 |
| 1.48 | −2.95 | 0.52 | 2.37 | −2.11 | 1.23 | 0.12 | −0.07 |
| Markets | ||||||||||||||||
|---|---|---|---|---|---|---|---|---|---|---|---|---|---|---|---|---|
| CA | 1.887 | −0.038 | 0.012 | 0.017 | −0.088 | 0.068 | 0.014 | −0.006 | 17.410 | 0.116 | 0.343 | 0.241 | 0.514 | 1093.00 | 25.20 | 0.10 |
| 2.37 | −3.70 | 0.85 | 1.68 | −4.10 | 2.24 | 0.57 | −0.08 | 2.73 | 1.60 | 1.93 | 4.71 | 3.17 | [0.03] | [0.00] | ||
| FR | 0.377 | −0.025 | 0.020 | 0.003 | −0.086 | 0.056 | 0.011 | 0.014 | 0.269 | 0.017 | 0.963 | 0.080 | 0.320 | 16.33 | 34.49 | 0.13 |
| 0.65 | −4.48 | 2.23 | 0.33 | −4.07 | 2.22 | 0.47 | 0.20 | 1.13 | 0.99 | 40.10 | 2.07 | 5.32 | [0.00] | [0.00] | ||
| GM | −0.175 | −0.066 | 0.047 | 0.022 | −0.135 | 0.076 | 0.016 | −0.054 | 19.578 | 0.186 | 0.178 | 0.170 | 0.547 | 60.83 | 34.80 | 0.15 |
| −0.19 | −8.97 | 3.62 | 1.95 | −5.82 | 2.58 | 0.73 | −0.69 | 5.11 | 1.72 | 1.69 | 2.61 | 4.09 | [0.00] | [0.00] | ||
| IT | −0.024 | −0.054 | 0.034 | 0.021 | −0.081 | 0.080 | −0.011 | −0.021 | 1.641 | 0.159 | 0.788 | 0.153 | 0.293 | 42.26 | 16.71 | 0.14 |
| −0.02 | −5.33 | 2.81 | 1.90 | −7.16 | 4.05 | −0.63 | −0.27 | 1.69 | 2.72 | 11.23 | 2.66 | 2.55 | [0.00] | [0.00] | ||
| JP | 1.654 | −0.100 | 0.051 | 0.034 | −0.038 | 0.022 | 0.037 | −0.104 | 1.365 | 0.115 | 0.827 | 0.245 | 0.002 | 52.34 | 9.81 | 0.16 |
| 1.74 | −6.63 | 2.38 | 2.36 | −2.65 | 1.01 | 1.97 | −1.49 | 2.38 | 3.96 | 4.54 | 2.81 | 0.01 | [0.00] | [0.00] | ||
| UK | −1.211 | −0.015 | 0.022 | 0.001 | −0.106 | 0.067 | −0.003 | −0.091 | 4.946 | 0.220 | 0.472 | −0.040 | 0.166 | 55.39 | 6.96 | 0.12 |
| −3.23 | −3.98 | 4.70 | 0.16 | −6.78 | 2.99 | −0.15 | −1.33 | 2.64 | 2.11 | 2.50 | −1.47 | 2.47 | [0.00] | [0.03] | ||
| US | −0.348 | −0.036 | 0.001 | 0.039 | −0.029 | 0.024 | 0.032 | −0.097 | 1.537 | 0.046 | 0.868 | 0.317 | −0.097 | 51.76 | 59.55 | 0.07 |
| −0.40 | −4.86 | 4.90 | 5.64 | −1.30 | 0.96 | 1.24 | −1.15 | 2.32 | 1.20 | 16.00 | 7.32 | −1.20 | [0.00] | [0.00] |
| Markets | ||||||||||||||||
|---|---|---|---|---|---|---|---|---|---|---|---|---|---|---|---|---|
| AU | 2.052 | −0.024 | −0.021 | 0.033 | −0.028 | −0.018 | 0.039 | −0.168 | 0.345 | 0.110 | −0.195 | 0.145 | 0.032 | 18.41 | 7.85 | 0.13 |
| 4.24 | −3.05 | −1.82 | 3.76 | −1.96 | −1.010 | 2.71 | −2.28 | 0.12 | 1.008 | −0.55 | 2.80 | 0.42 | [0.00] | [0.02] | ||
| CN | 1.039 | −0.027 | 0.005 | 0.018 | −0.070 | 0.021 | −0.008 | 0.021 | 62.381 | 1.617 | 0.749 | −1.231 | −1.748 | 192.73 | 0.16 | 0.03 |
| 4.65 | −16.40 | 2.74 | 9.31 | −13.06 | 11.80 | −2.21 | 2.01 | 0.36 | 0.53 | 1.57 | −0.29 | −0.15 | [0.00] | [0.93] | ||
| HK | 1.563 | −0.042 | 0.009 | 0.025 | −0.052 | 0.016 | 0.019 | 0.102 | 1.849 | 0.078 | 0.861 | 0.001 | 0.345 | 12.77 | 9.27 | 0.10 |
| 1.62 | −5.04 | 1.23 | 3.06 | −2.47 | 0.52 | 0.79 | 1.05 | 2.32 | 1.44 | 13.98 | 0.02 | 2.43 | [0.01] | [0.01] | ||
| IN | 2.593 | −0.057 | 0.014 | 0.027 | 0.039 | −0.091 | 0.034 | 0.044 | 3.870 | 0.153 | 0.761 | 0.236 | 0.269 | 37.69 | 7.98 | 0.13 |
| 2.23 | −3.96 | 0.71 | 1.60 | 1.67 | −4.43 | 2.16 | 0.40 | 2.12 | 1.50 | 6.08 | 1.76 | 1.62 | [0.00] | [0.02] | ||
| KO | 2.566 | −0.071 | 0.054 | 0.002 | −0.056 | 0.049 | 0.052 | 0.040 | 14.088 | 0.350 | 0.548 | 0.514 | 0.057 | 19.22 | 25.69 | 0.01 |
| 1.59 | −5.60 | 3.06 | 0.10 | −1.83 | 1.00 | 1.61 | 20.50 | 3.97 | 4.03 | 9.23 | 5.01 | 0.16 | [0.00] | [0.00] | ||
| SG | 1.791 | −0.033 | −0.010 | 0.028 | 0.015 | −0.035 | 0.064 | 0.271 | 5.797 | 0.478 | 0.426 | 0.330 | −0.192 | 25.54 | 28.43 | 0.10 |
| 1.29 | −3.17 | −0.48 | 2.87 | 0.32 | −0.59 | 1.19 | 2.15 | 3.92 | 3.66 | 6.25 | 5.18 | −0.83 | [0.00] | [0.00] | ||
| BR | −1.477 | −0.020 | 0.017 | 0.015 | −0.089 | 0.066 | 0.024 | 0.022 | 19.723 | 0.497 | 0.348 | 0.211 | 0.545 | 14.40 | 10.49 | 0.02 |
| −1.86 | −1.82 | 1.26 | 1.89 | −2.87 | 1.71 | 0.89 | 0.21 | 2.49 | 4.82 | 2.47 | 3.17 | 2.00 | [0.01] | [0.01] | ||
| CL | 2.294 | −0.036 | −0.001 | 0.023 | −0.039 | 0.060 | −0.022 | 0.006 | 9.511 | 0.221 | 0.426 | 0.055 | 0.533 | 12.89 | 26.19 | 0.04 |
| 1.93 | −3.93 | −0.11 | 1.67 | −3.86 | 2.55 | −1.55 | 0.05 | 2.93 | 1.80 | 2.47 | 1.40 | 4.50 | [0.02] | [0.00] |
© 2019 by the author. Licensee MDPI, Basel, Switzerland. This article is an open access article distributed under the terms and conditions of the Creative Commons Attribution (CC BY) license (http://creativecommons.org/licenses/by/4.0/).
Share and Cite
Chiang, T.C. Market Efficiency and News Dynamics: Evidence from International Equity Markets. Economies 2019, 7, 7. https://doi.org/10.3390/economies7010007
Chiang TC. Market Efficiency and News Dynamics: Evidence from International Equity Markets. Economies. 2019; 7(1):7. https://doi.org/10.3390/economies7010007
Chicago/Turabian StyleChiang, Thomas C. 2019. "Market Efficiency and News Dynamics: Evidence from International Equity Markets" Economies 7, no. 1: 7. https://doi.org/10.3390/economies7010007
APA StyleChiang, T. C. (2019). Market Efficiency and News Dynamics: Evidence from International Equity Markets. Economies, 7(1), 7. https://doi.org/10.3390/economies7010007