1. Introduction
There are dominant narratives about the Ethiopian economy that are often repeated, but infrequently assessed for accuracy. The Government of Ethiopia has long been promoting the “Ethiopia rising” image, academics have called it the “China of Africa” (
Cowen 2018), international agencies rank it as one of the fastest-growing economies in the world (
World Bank 2018), and journalists have lauded its miraculous transformation (
Kopf 2017). One challenge to these narratives is a line of questioning regarding the distribution of benefits of the growing economy—in other words, for whom does the economic growth benefit, and at whose expense (
Haylemariam 2017). Effectively, this line of critique questions the accuracy of the data, as well as the relevance of the aggregate narratives to lived experiences of the majority of Ethiopians. Aggregations have the potential to make invisible rising inequalities, chronic poverty, and new vulnerabilities resulting from economic change. These are important questions to ask, and critiques to make. With regard to inequalities, emerging research is highlighting the manifestations of, and challenges brought about by, rising inequality (e.g.,
Cochrane and Rao 2018;
Rammelt et al. 2017;
UNDP 2015). In this paper, we have a different objective. We use primary datasets to assess if the common narratives are supported by the available data, while recognizing that even those narratives that are supported by data may not necessarily be actual, as we identify indications of inaccurate data. In other words, we assess for internal consistency. For example, we analyze if the narrative of the Government of Ethiopia is supported by its own data.
While high levels of sustained macroeconomic growth is one of the most common narratives about the Ethiopian economy, it is not the only narrative that is common to the Ethiopian macro-economic story. There are also narratives about economic transformation and, in particular, the diversification of the economy into manufacturing, as opposed to being heavily reliant upon agriculture. A third narrative surrounds the agricultural sector, and its critical role in the economy. A more recent narrative is that of an emerging debt crisis and, in particular, the problematic role of Chinese lending contributing to that. In this article, we return to primary data sources, and present long-term data in order to assess the trends with regard to these narratives. We draw upon two datasets about economic growth, use data on sectoral shares in the economy, analyze import and export trends, and explore the extent of national debt. Few long-term assessments of the broader macroeconomy are available (
Geda 2011), and, as far as we know, there are no comparative studies of datasets or analyses of data consistency within single sources. There are some papers that analyze long-term data, but focus on specific issues, such as government expenditure (
Menyah and Wolde-Rufael 2013) or exports (
Allaro 2012). In highlighting some critical issues about correcting narratives and data inconsistencies, we hope to encourage further research of this nature.
Analyzing the narratives, claims made to support them, and counter-claims made against them, is important. For example, there are claims made that the Government of Ethiopia posts higher GDP growth rates than third party entities, such as the World Bank. Although commonly made (e.g.,
Mandefro 2016;
Mandefro and Jerven 2015), they are justified with reference to single data points or specific years. The problem with these singular selections is that the data utilized may not be representative of the trend, which is the case for GDP growth rates, as we show below. It is not only researchers and journalists that create narratives. The Government of Ethiopia also presents narratives, often framed within broader ideological foundations, such its presentation of transformation in the context of the “developmental state”, or with reference to objectives, as they are outlined in the Growth and Transformation Plans. The Ethiopian manifestation of the developmental state exhibits typical characteristics of other developmental states: interventionist, strong, and vision-oriented (
Dejene and Cochrane 2018). The key architect, the late Prime Minister Meles Zenawi, believed that the developmental state allowed for the creation of effective and appropriate policies that can be sustained over the long term (
Clapham 2017;
Zenawi 2012,
n.d.). It is the developmental state that is the foundation of some of the narratives evaluated in this article, such as in assuming that this approach can lead economic transformation and facilitate rapid economic growth. These narratives are codified as objectives within the Growth and Transformation Plans. The Ethiopian developmental state has been able to foster positive changes, some of which are outlined in this paper, but has also come alongside great costs, particularly in the realm of rights and freedoms (
Dejene and Cochrane 2018). This paper critically evaluates four narratives of the macroeconomy, however, it will also provide the foundation for future research on a range of issues, including the Ethiopian developmental state.
In using data from the Government of Ethiopia, we do not suggest that it is always accurate. Our analysis finds multiple inconsistencies and agrees with other findings that the statistics produced by the government are problematic (
Cochrane and Bekele 2018;
IMF 2013). This critical assessment of data and data quality is part of a broader recognition of challenges with governmental statistical agencies and data throughout the Global South (
Carletto et al. 2015;
Jerven 2013;
Sandefur and Glassman 2015;
Sundaram 2016). We conclude that the commonly made claims about the Ethiopian economy are sometimes accurate, sometimes incomplete and, at other times, inaccurate.
2. Methodology
In order to assess the narratives, we have returned to primary datasets and analyzed the data over the long term. The primary sources we have used on the economy are drawn from the annual reports of the National Bank of Ethiopia, reports from the Ethiopian Customs and Revenue Authority (ECRA) and data from the Ministry of Trade. We have also used data from the World Bank and the Observatory of Economic Complexity for comparative or complementary purposes.
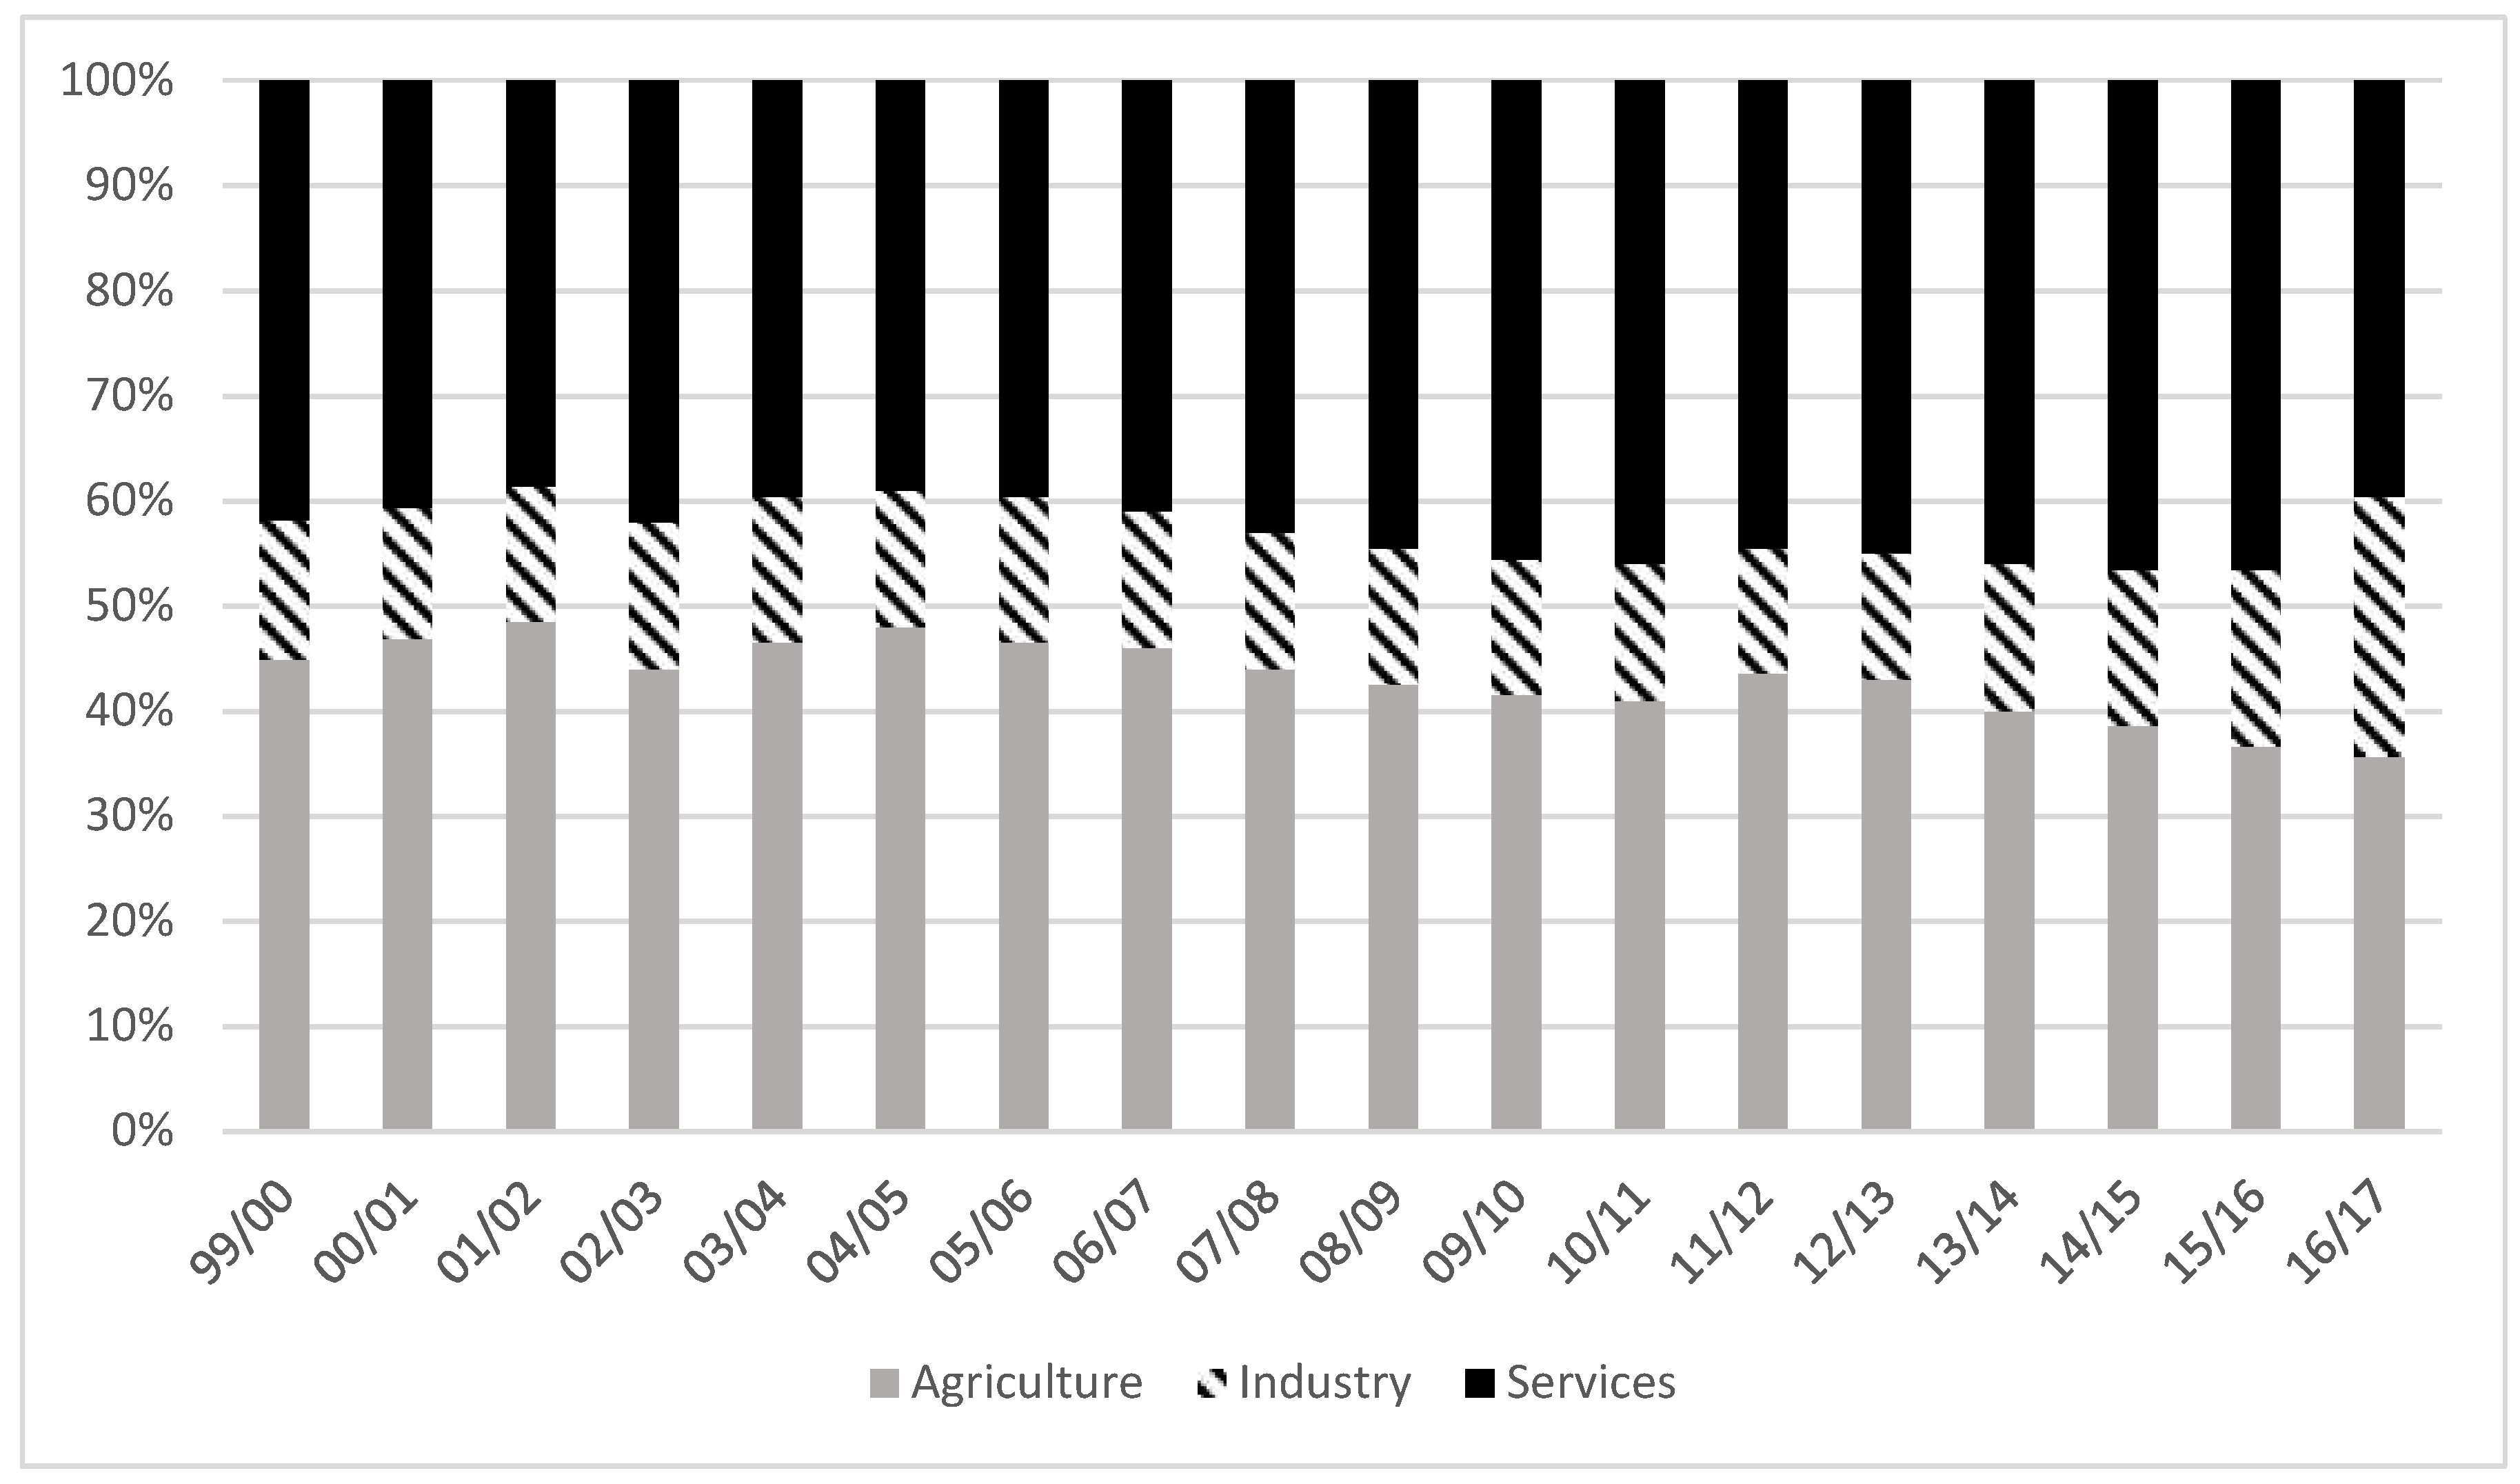
Some of these datasets posed challenges. In particular, using the National Bank of Ethiopia as one of the sources of the data was problematic on several accounts. First and foremost, the data is inconsistent. For example, each annual report provides contextual and comparative data from past years, but the data listed for a particular year varies from report to report. In the 2004/05 Annual Report, the share of agriculture in the GDP for 2000/01 is listed as 45% while, in the 2005/06 Annual Report, the share for 2000/01 is listed as 48.4% (
NBE 2005;
2006; see
Table 1 for examples). Public annual reports from the National Bank of Ethiopia began in 2004/05 and, thus, for data on years previous to this, we rely on reports published after this date. The challenge is that the data varies based on which report is referred to. This poses significant methodological challenges. We have used the oldest available report, 2004/05, to acquire the data for years previous to 2004/05. In the instance that an annual report exists for a particular year, we use the data reported for the year of its publication (in other words, we used the 2004/05 report for 2004/05 data). This is admittedly an arbitrary decision on our part, however, we felt that the alternatives were either just as arbitrary or more problematic, in terms of adjusting or recalculating data (and, thus, presenting figures not found in the National Bank of Ethiopia reports).
There is no easy solution to rectify the inconsistent data for the years prior to 2004/05 (from which the annual reports are available). This is particularly problematic because 3% of the GDP equates to massive sums. However, the problem of data inconsistency does not only exist for data from before 2004/05, it also affects data in newer reports, reporting on past years. For example, there is an annual report for 2004/05, in which agriculture, as a % of GDP, is listed as 48%, but, in the 2006/07 report, the figure for 2004/05 (listed for comparative purposes) is 47%. Data inconsistency does not reduce over time, and exists in more recent annual reports, as well. In the 2010/11 annual report, the share of agriculture in the GDP was listed as 41.1%, and in the 2011/12 report the figure for 2010/11 is listed as 45.3%.
The same problems exist for other data. Growth in real GDP exhibits the same inconsistencies. The variances are just as wide; to give one example, real GDP growth was listed as 8.8% in the 2004/05 report, for that year, but in the 2011/12 report, the rate for 2004/05 was listed as 12.7% (
NBE 2005,
2011). Inconsistencies exist regarding export data, however, these were more minor in comparison to the other datasets (export data is also made available by the National Bank of Ethiopia). We have applied the same process, described above, in dealing with these data problems (using the figure listed in the year of publication, for that year, and not adjusting based on different figures reported in later reports).
We can only speculate why the figures vary from report to report. However, there is the potential for these figures to be politicized in seeking to support a narrative of economic transformation promoted by the government, and as a means to demonstrate advancement toward the goals outlined in the Growth and Transformation Plans. Consider the abovementioned data of agriculture as a share of GDP for 2010/11, listed as 41.1% for that year of publication (
NBE 2011), while later years change the figure for 2010/11 to 45.3% (
NBE 2012,
2013), 44.4% (
NBE 2014,
2015), and 44.7% (
NBE 2016). This could be used as a potential means to show how, during the most recent year, the year of publication, economic transformation is taking place, while the figure is adjusted (increased) in later years when that figure is used for comparative purposes (thus showing high rates of change to support the transformation narrative). We cannot confirm this is the reason for data inconsistency, or if other methodological changes were occurring. The adjustments do not appear to be consistent, suggesting that, if methodological changes were taking place, they would be consistent after a certain point, but they are not. Additionally, if these are corrections, it would be expected that a degree of consistency would exist for past years, once corrected, but this is also not the case. What we can say with certainty is that the data is inconsistent, and should be used with caution. Users of these datasets should know that there is a significant degree of uncertainty with regard to the actual figures and which reports ought to be used to ascertain the most accurate figures. One way that we have encouraged the taking of a cautionary approach to using the share of the economy data (which was the most problematic dataset), is by not including a data table for that figure (e.g., in
Figure 1), emphasizing trends over specific figures. Whereas, for other figures, we have provided accompanying data tables. This is not to suggest that the other data was consistent, as it was not, but the data on the sectoral share of the economy in the National Bank of Ethiopia reports presented the greatest inconsistencies.
3. Results
Is Ethiopia’s economy transforming? The Government of Ethiopia’s narrative suggests that it is facilitating significant economic transformation (
MoFED 2014,
2017), and this is the first narrative we seek to evaluate. The second Growth and Transformation Plan (2015/16 to 2019/20) places a strong emphasis on developing the industrial sector (
NPC 2016). The government has sought to enable the industrial transformation with the establishment of industrial parks throughout the country. Ethiopia completed the construction of the first industrial zone in Dukem in 2008, a second in Addis Ababa in 2014, and a third in Hawassa in 2016. There are at least 20 more either up-and-running or in construction (
ABP 2017). In line with the Growth and Transformation Plan for the country (
NPC 2016), this is one of the focal initiatives designed to transform the economy.
According to the National Bank of Ethiopia, the share of agriculture in the GDP declined slightly over the last two decades, with industry and services respectively increasing. The exception to the minor shifts is the final year for which we have data, 2016/17, where industry made a significant increase, rising from 17% to 25% as a share of the GDP (both agriculture and services declined relative to industry growth). The rise of industry as a share of the GDP in this year aligns with changes in the country, in that several industrial parks were completed or near completion in the 2016/17 report year (e.g., Kombolcha and Mekelle industrial parks). It does appear that the emphasis placed on industrial parks by the Government of Ethiopia, as a means of economic transformation, is resulting in change. It remains to be seen to what extent this change will be sustained, or increased, in the years to come. At this junction, we have indications of long-term stability on the macroscale regarding the sectoral shares of the economy, with indications that industry may play a more significant role in the years to come.
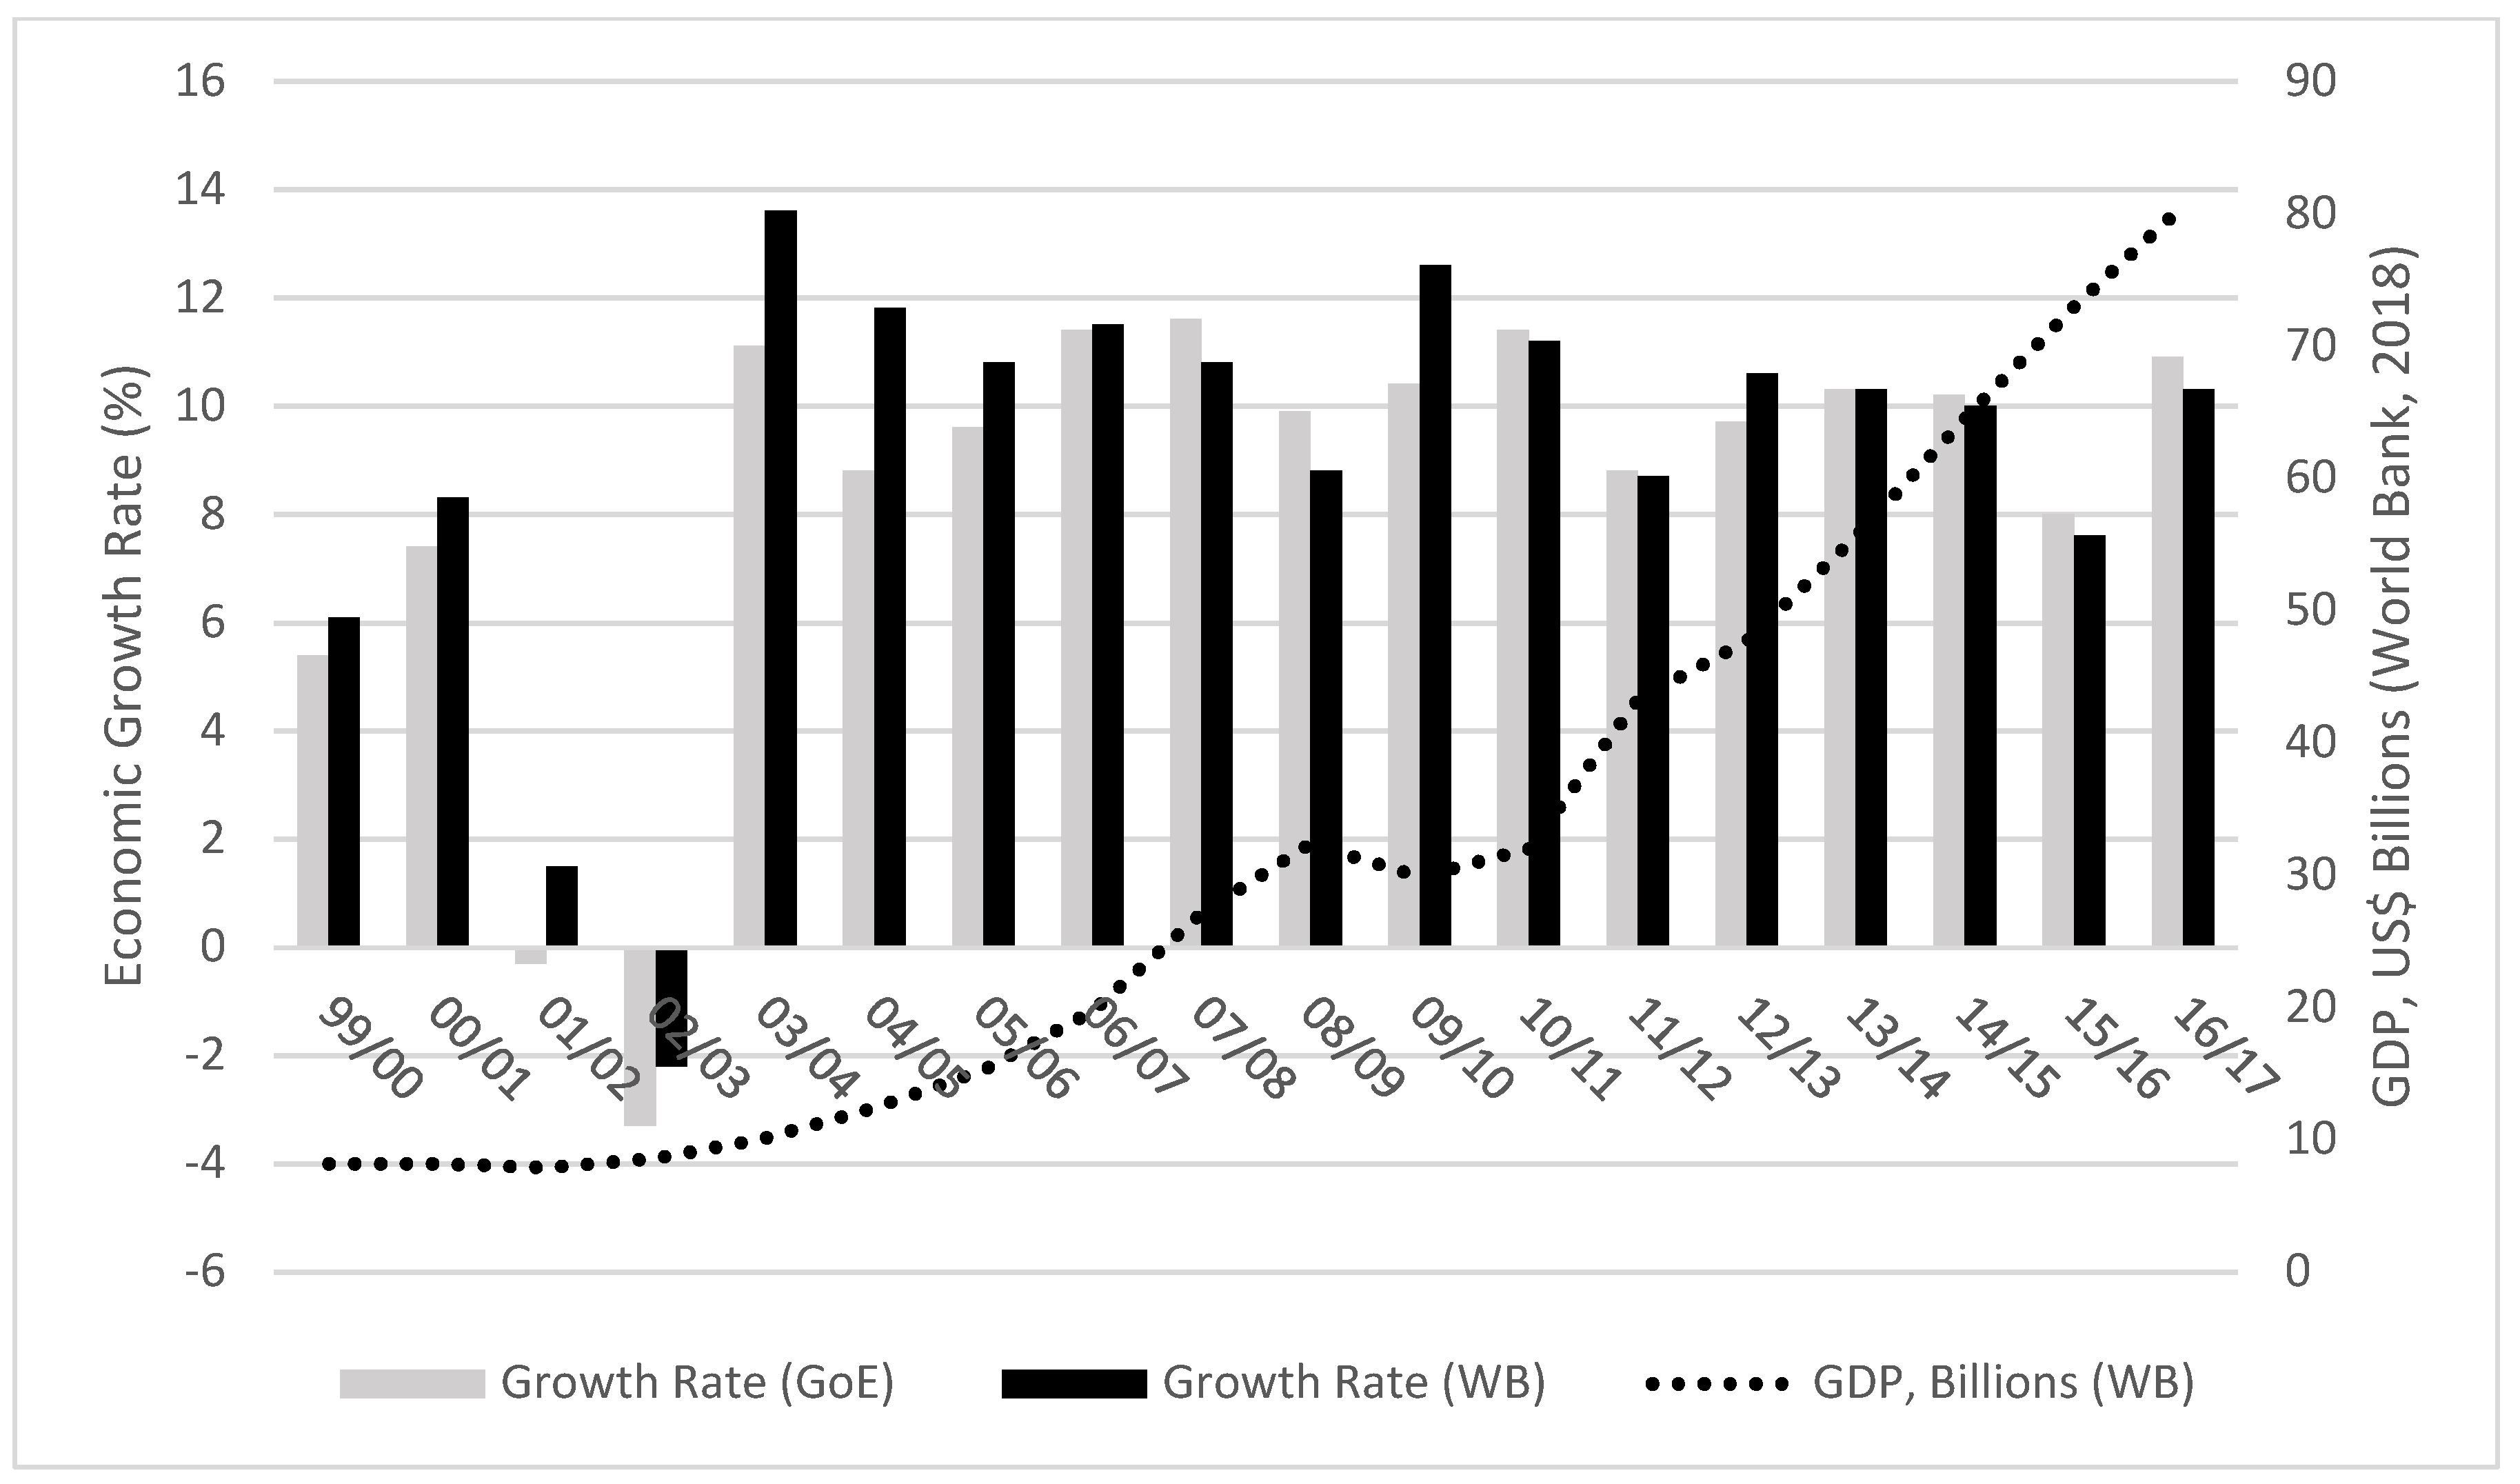
The second narrative that we evaluate is a narrative of a rapidly growing economy. While there is some divergence between its own data and that of the World Bank, both datasets identify Ethiopia as one of the fastest growing economies in Africa and, in fact, the world, something that has been sustained since 2003 (see
Figure 2;
Table 2). The rapid growth started from a relative point, as Ethiopia had one of the world’s lowest per capita GDP levels and, despite much growth, it still remains as one of the world’s lowest. This is noteworthy because the economic gains are relative to the size of the economy at the outset. Notable is that the growth rates listed by the Government of Ethiopia are not consistently higher than the World Bank, as one might expect if the data was serving political objectives or being inflated. Furthermore, the actual data is counter to claims made by other scholars, such as
Mandefro and Jerven (
2015, p. 1), who claim third party sources “consistently show a lower GDP growth rate.” A long-term assessment of primary data presents a more complicated narrative, wherein the rates presented by the Government of Ethiopia are not consistently higher. As shown in
Figure 2, the World Bank growth rates were actually higher than the Government of Ethiopia in ten of the last eighteen years.
Mandefro (
2016) references IMF data from two years to support the claim that the Government of Ethiopia inflates growth rate data, also years that the World Bank rate was lower than the Government of Ethiopia. However, those years are not representative of the overall trend. It is worth noting that, in recent years (since 2013/14), the rates of the Government of Ethiopia have been higher than the World Bank.
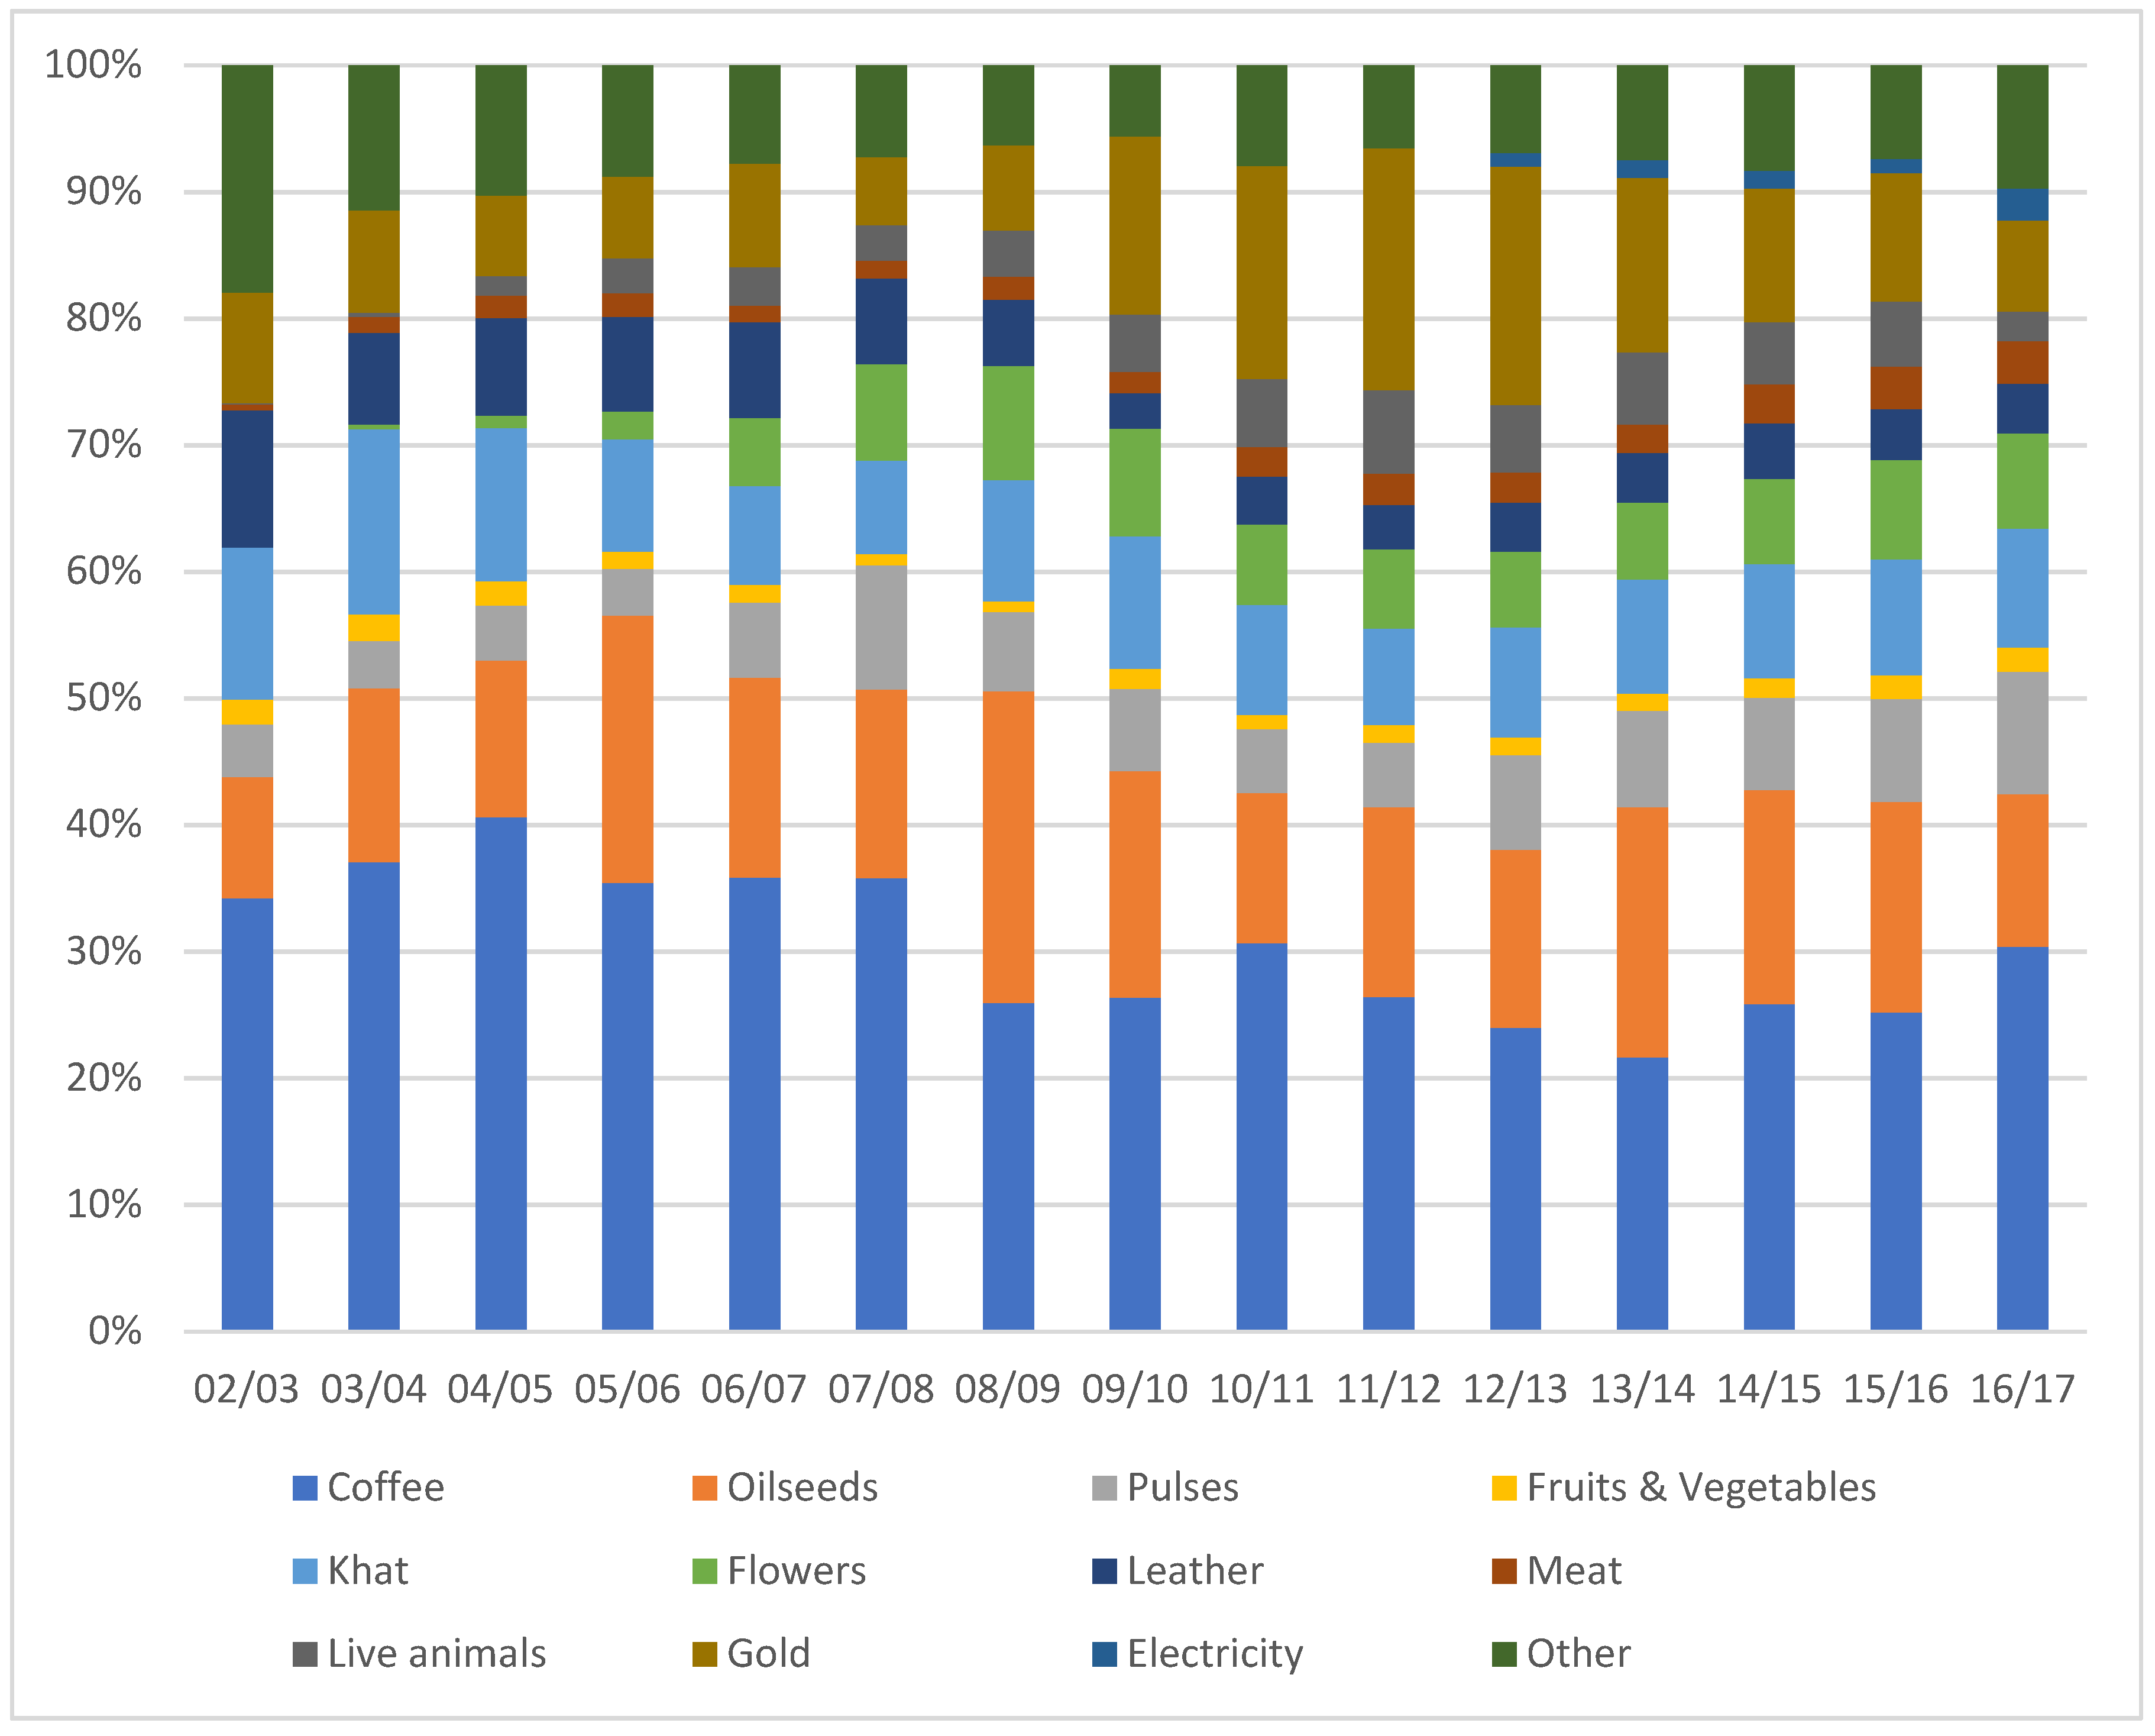
The third narrative we evaluate is the commonly stated description that agriculture is the backbone of the Ethiopian economy, and contributes the largest share of GDP, employment, and exports (e.g.,
Cochrane 2017;
Haylemariam 2017;
Loening et al. 2009). We analyze this narrative using export and import trade data, obtained from the National Bank of Ethiopia, and compare that with other available data. Indeed, the Ethiopian economy and the export market is dominated by agricultural commodities, with coffee playing a critical role amongst the exported commodities. Of the twelve key export commodities, as determined by the National Bank of Ethiopia, six are agricultural (coffee, fruits and vegetables, pulses, flowers, oilseeds, and khat). The data from the National Bank of Ethiopia indicate that these six commodities never account for less than 60% of all export value (
Figure 3). Less well known is the important role that livestock and livestock-related commodities play in Ethiopia’s export market, accounting for an additional three of the twelve key commodities (leather, meat, and live animals). The livestock and livestock-related commodities account for approximately a tenth of the exports, by value. These two commodity types (agriculture and livestock), together, accounted for no less than 70% of all export value, in every year between 2002/03 and 2016/17.
It is worth noting some emerging trends from the export data. While agricultural and livestock-related commodities were consistently important throughout the time period, there are emerging commodities. For example, electricity emerges as a new key export commodity in 2012/13 (
Table 3), but has remained relatively minor in the overall export landscape. However, with the development of large-scale hydroelectric dams, we expect that this figure will increase in the coming years and may become a vital component of the export market (
Department of Commerce 2017a). In addition to general rises in the total value of exports over the time period (see Table 5), the number of trade destinations for Ethiopian export commodities nearly doubled. This indicates the relatively narrow export commodity types (primarily agricultural and livestock) have a diversified global market (
ERCA 2018).
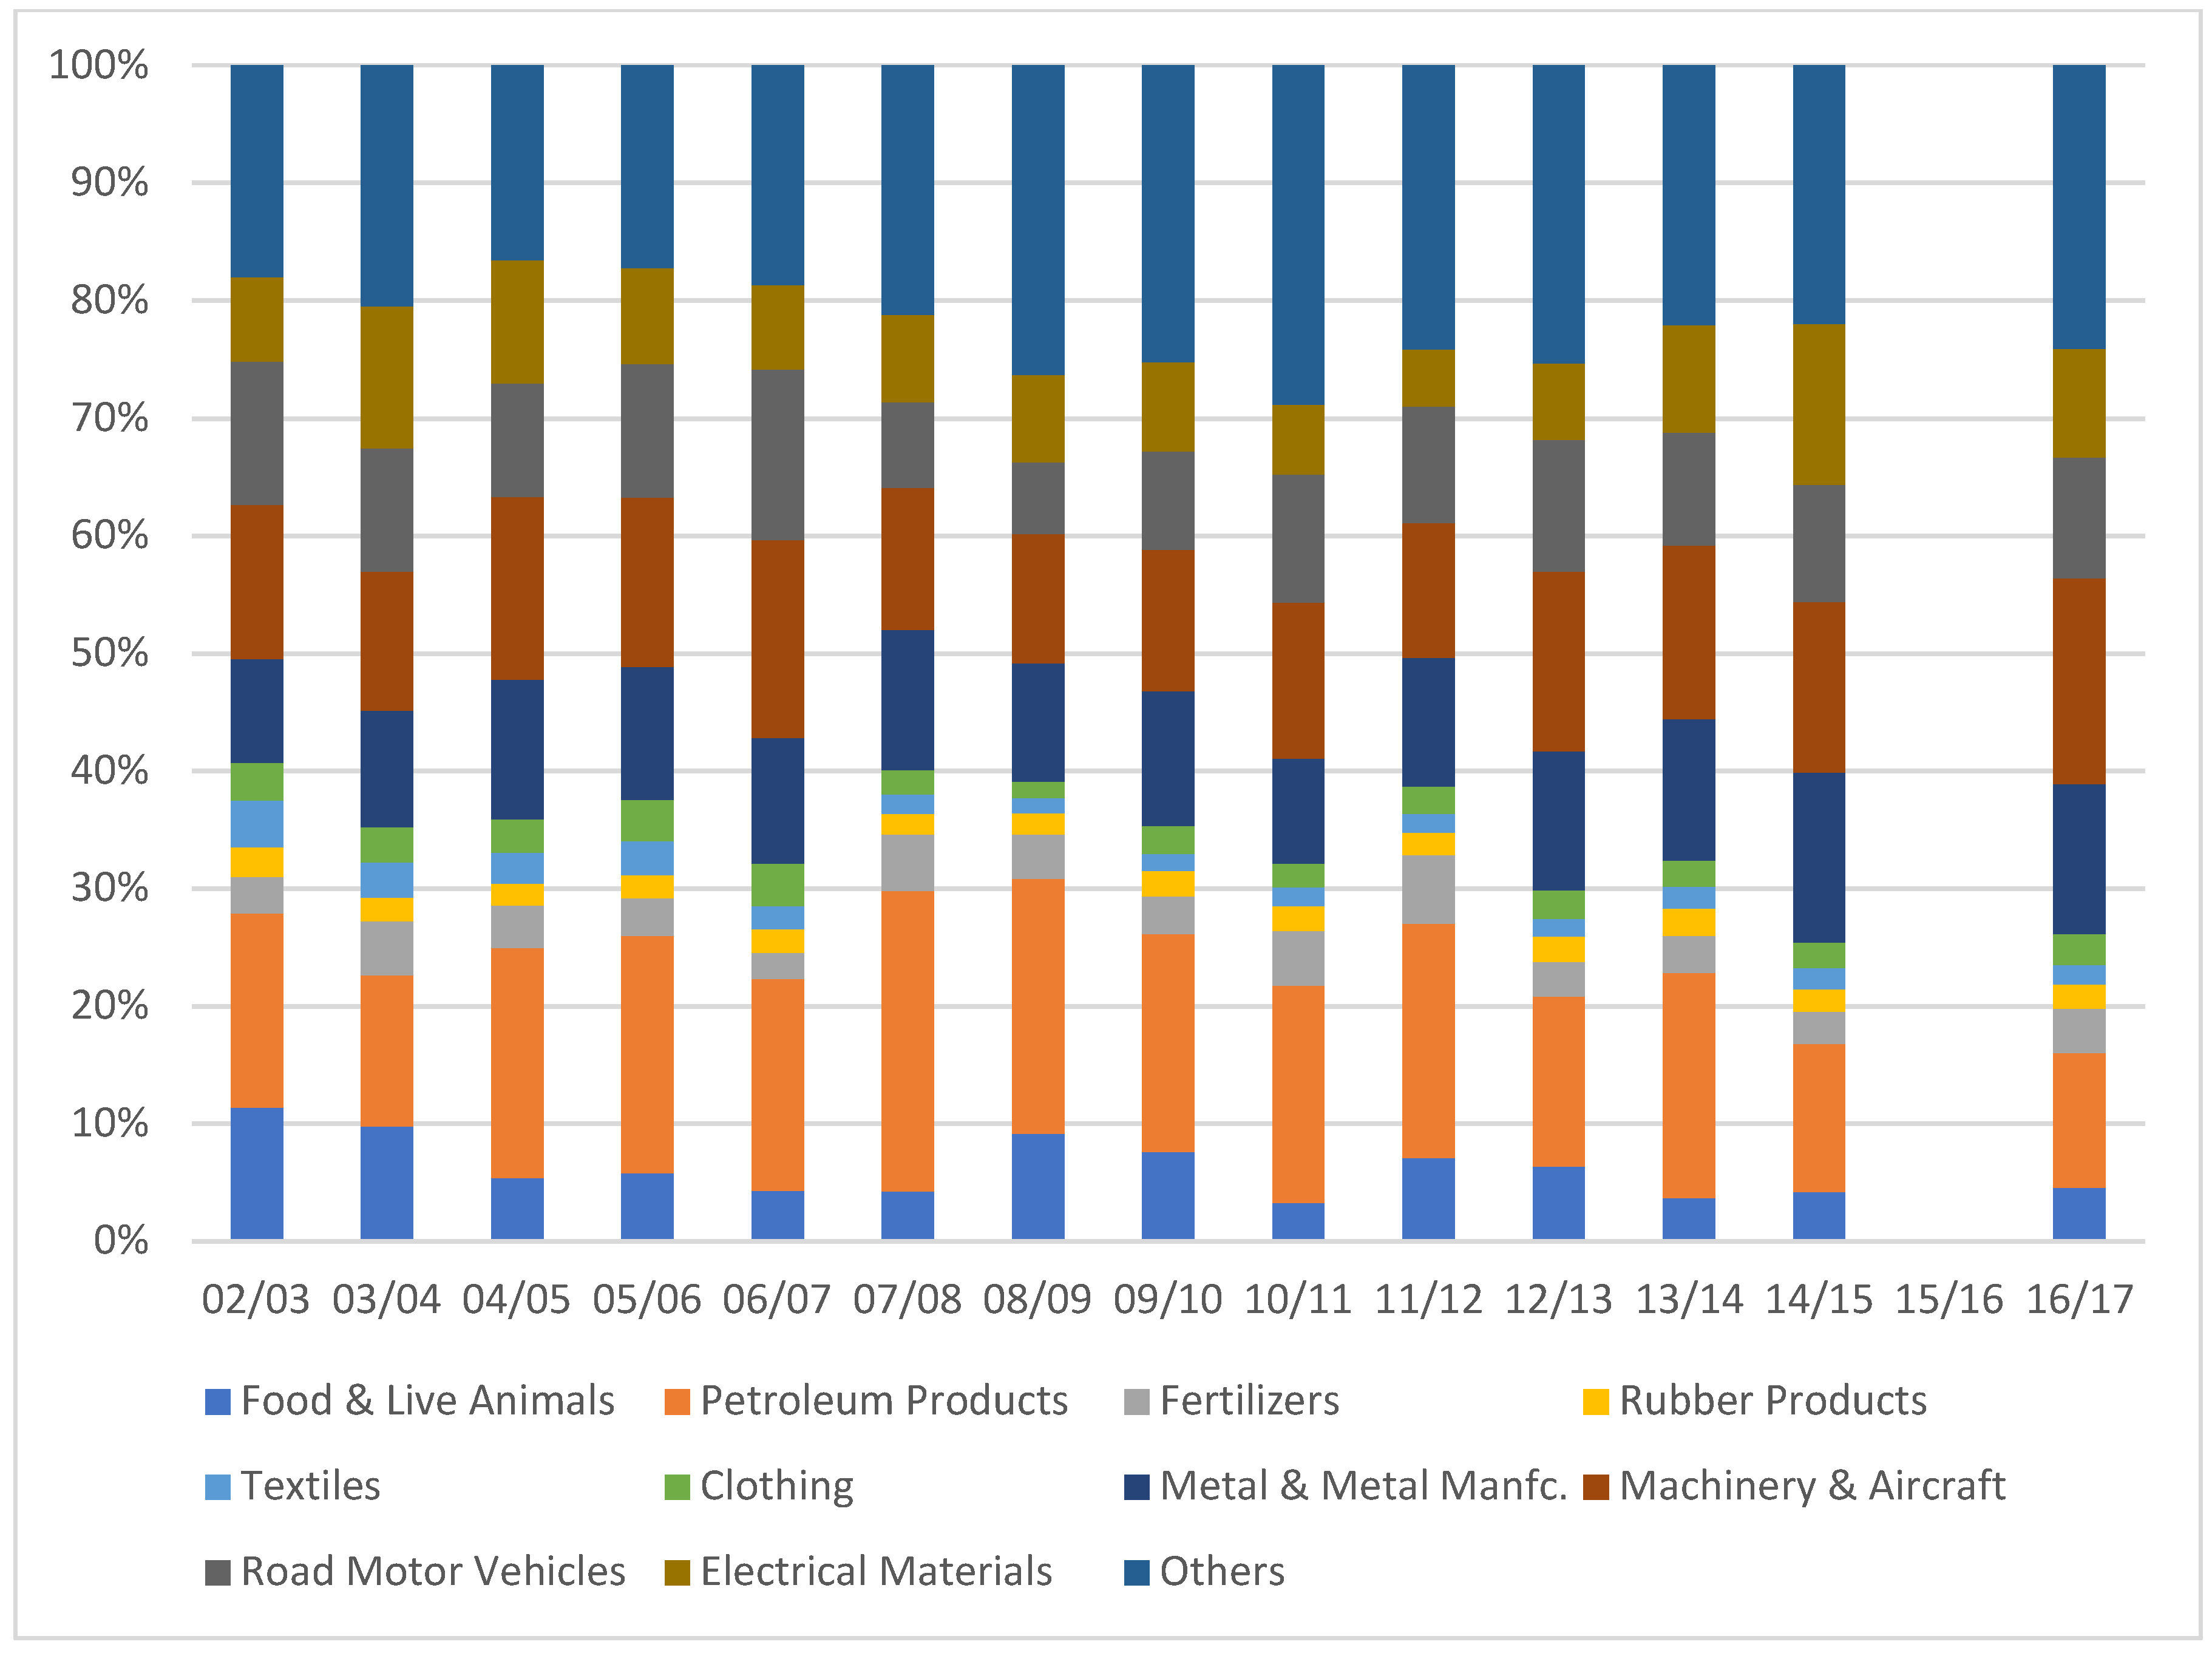
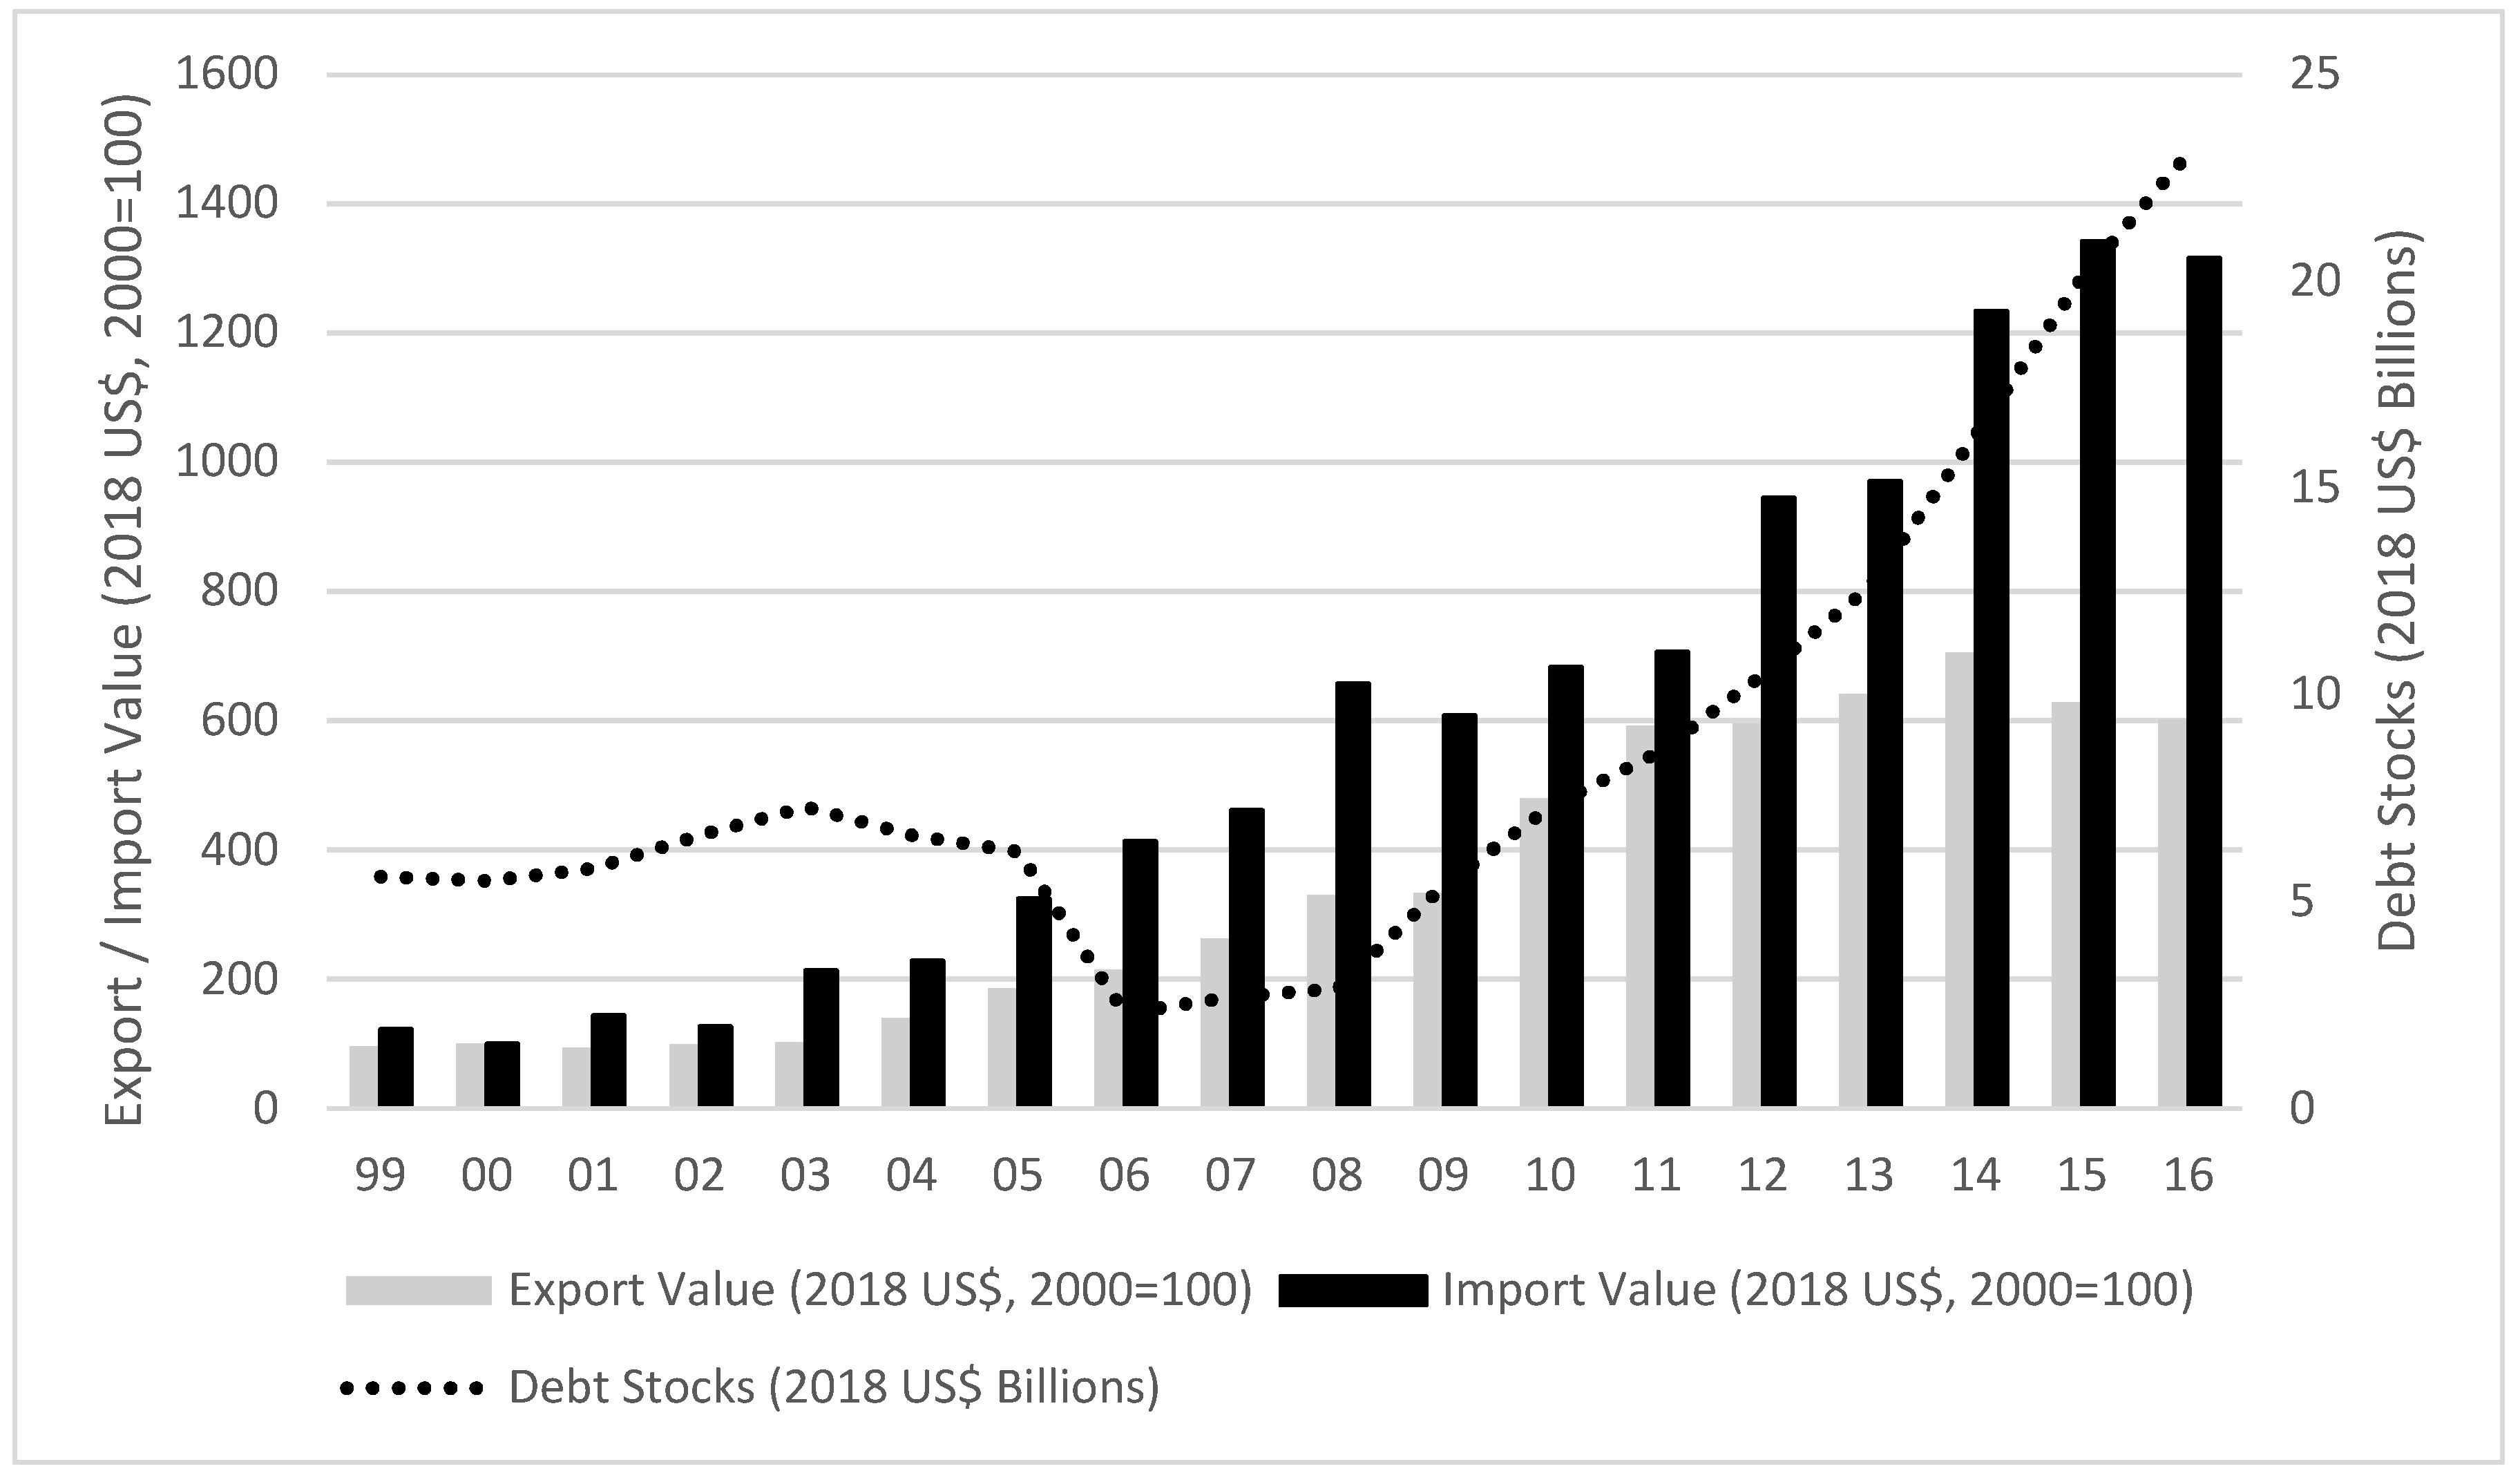
The import trends also shed light on the ways in which the economy of Ethiopia is changing over time. The 2016/17 Annual Report of the National Bank of Ethiopia lists 21 major imports, by year, going back more than three decades. In line with the export data, we present the trends from 2002/03 to 2016/17 (
Figure 4;
Table 4). To enhance readability of the figure and table, we have removed 10 commodities that had relatively lower levels of imports, by value (namely: beverages, tobacco, petroleum crude, chemicals, medical and pharmaceutical products, soap and polish, paper and paper manfc., glass and glassware, grain, and telecom. appara.), resulting in 11 major imports listed in
Figure 4 (namely: food and live animals, petroleum products, fertilizers, rubber products, textiles, clothing, metal and metal manfc., machinery and aircraft, road motor vehicles, electrical materials, and others). It is notable that the listing of “grain” is actually included in the “food and live animals” category, however, its inclusion highlights specific years when grain imports double or triple the norm, namely, 2008/09, 2009/10, 2011/12, and 2012/13, aligned with drought situations.
The import data provides insight into where the economy is reliant upon the global market to meet domestic demand and, also, identifies some apparent contradictions. Petroleum is imported as Ethiopia does not have domestic supplies (or, at least, no supplies of significant production levels to date), which are related to the ability to manufacture synthetic fertilizers and rubber products. Areas where the nation needs greater capacity is in mining exploration and development, to exploit existing resources, and thereby provide domestic supplies for the production of metal and electrical commodities (
Department of Commerce 2017b). The rapid growth and continued success of Ethiopian Airlines explains the role of machinery and aircraft imports. Despite high tariffs and strong governmental efforts to have motor vehicle manufacturing done domestically, the supply has continued to reply upon international sources with the percentage of imports by value for motor vehicles remaining relatively stable throughout the period. The contradictions that emerge are that Ethiopia exports food and live animals which, together, comprise the vast majority of exports, yet, it also has high levels of imports of food and live animals. This apparent contradiction is explained, in part, by commodity type demand, with some food imports being those that are not predominately grown or exported, such as rice. However, the import of grains suggests another story, one that highlights the vulnerability of the nation to drought, and the need for imports to provide emergency food aid. Notably, the import data is not government imports, but are inclusive of the private sector, and as it relates to grains, this includes the donor and NGO community, which procure food commodities for distribution in drought years (
USDA 2016). Further studies are needed to better assess the specifics of the import and export of food and live animals. Given that cotton is one of Ethiopia’s major cash crops, one might not expect to see significant imports of textiles and clothing, but clothing is a significant import item. There are indications that this relates to demand being greater than supply, limitations of domestic production capacity, higher comparative production costs, as well as a general trend toward a declining area used for cotton production in Ethiopia (
USDA 2018). Further research is needed on that subsector of the agricultural economy to better assess the trends and potential opportunities.
The Observatory of Economic Complexity (
OEC 2018) offers a breakdown of imports for a single year, 2016, showing that the single largest import item for that year was refined petroleum, accounting for 10.1% of all imports. The OEC categorization of “machines” (an aggregated category of commodities) accounted for 27% of all imports. Notably, the “machines” category did not include transportation, which accounted for 13% of imports in that year (primarily planes, trucks, and cars). This aligns with the data presented by the National Bank of Ethiopia, although categorized slightly differently. Although the data period is limited, the
World Bank (
2018) shows that, in relation to the rapidly growing economy, imports of goods and services as a percentage of the GDP has been declining, from nearly 32% in 2011, to 23.7% in 2017. This provides important context as, at face value, the rising cost of imports over time appears to be a negative trend, however, when contextualized with the broader economic growth, the percentage of imports in relation to the overall GDP is declining.
An emerging narrative, raising concerns for many, is the level of debt in many African nations, particularly, as new forms of financing have emerged, with many reports focusing on the role of China (
AlJazeera 2018;
Kpodo 2018;
Reuters 2018). With regard to its lending status, Ethiopia was recently downgraded to “high risk of debt distress” (
Madowo 2018), and from “moderately stressed” to “highly stressed” (
Anberbir 2018). The narratives of debt, alongside these rating changes, have resulted in lending policy changes, garnering the attention of Ethiopian politicians. Indeed, since a low in 2006 of US
$ 2.3 billion, external debt has ballooned to US
$ 23.1 billion in 2016 (
Figure 5;
Table 5), a ten-fold increase of external debt in a ten-year period. The narratives of rising debt are well founded, as are the concerns, particularly for Ethiopia. Compounding the rise of external debt is the increasing trade deficit, notably, since 2014, when export value declines were not matched with equal declines in import values, resulting in a widening of the gap. In addition to external debt and trade deficit challenges, the government may face additional financial pressure, as there have been some large initiatives, launched since the inauguration of Prime Minister Abiy Ahmed. The narrative of debt, however, has primarily focused on China. Obtaining data on the exact sources of all the nation’s debt is challenging, however, between 2000 and 2014, Ethiopia received US
$ 12 billion in loans from China (
New Business Ethiopia 2018). This indicates that, while China is playing a key role in the Ethiopian debt crisis, other lenders account for approximately half of the current debt load. Identifying China as being at fault presents only part of the picture.
4. Discussion
There are many narratives, and counter-narratives, about the macroeconomy of Ethiopia (
Mandefro 2016). Many of these narratives, however, are based upon single data points, or specific years. This article presented data over a two-decade period to assess the trends and reflect on four of the common narratives. The greatest challenge in assessing these narratives, as outlined in the methods section, is data inconsistency. Specifically, data points from a single governmental agency vary from report to report. This presents a methodological problem for analysis but, more fundamentally, it poses a problem for understanding the reality of the economy, as the variances translate into millions of Ethiopian birr. There is speculation (and accusation) that some figures are intentionally manipulated to promote a narrative of economic growth (see
Mandefro 2016). We have identified some instances where the changed figures could be used in this way, but we have also identified changes where the opposite is the case. We echo the calls made by others that there is a critical need to improve the capacity of national statistical agencies, as well as others, such as agencies dealing with customs, trade, and finance (
Carletto et al. 2015;
Jerven 2013;
Sandefur and Glassman 2015;
Sundaram 2016).
The first narrative that we addressed was that of the narrative of economic transformation, as assessed by the share of sectors in the economy over time. We found, as the Government of Ethiopia advocates, that the share of agriculture has slightly declined, while the service and industrial sectors have slightly risen. The exception to these minor shifts was the final year for which we have data, 2016, when the industrial sector grew significantly (from 17% to 25%). This occurred in a year when several industrial parks were opening and/or near completion. However, the data on the share of each sector in the economy was particularly problematic in terms of displaying multiple inconsistencies. The rise of the industrial sector has not yet resulted in the addition of a new category in the list of key export commodities. However, looking at the history of the National Bank of Ethiopia annual reports, it appears that the addition of key commodities occurs after several years of significant exports begin. For example, electricity was not listed until the 2014/15 annual report but, when it was listed, it also provided export figures for the newly introduced key commodity for 2012/13 and 2013/14. We anticipate a similar process may occur for the industrial sector.
The second narrative addressed rapid economic growth and, secondly, the accusation of inflated growth figures by the Government of Ethiopia. On the sustained high growth rate, the data from governmental and third-party sources confirm that economic growth has been high and sustained. The exact nature of that growth varies based on the source. We compared the growth rates presented by the Government of Ethiopia and the World Bank, as it is claimed that the Government of Ethiopia inflates the rates to present a brighter economic picture than is reality. It is not possible to directly compare these two datasets because they operate on different fiscal calendars. However, the claim that the Government of Ethiopia consistently inflates the figures higher than third parties was not found to be accurate over the long term. It was the case that, in the most recent years (2014–2017), the rates listed by the Government of Ethiopia were higher than the World Bank, but this was not consistently the case for the 18 years for which we have data.
The third narrative analyzed was that of Ethiopia being an agricultural economy, often with non-specific figures given to support this general description. We found that agricultural commodities were, consistently, the dominant component of exported goods, in terms of value. Indeed, the importance of the agricultural sector may be greater than is sometimes described, as the agricultural share of the export market does not drop below 60% in any year in the analyzed period. If one includes livestock-related export commodities, the two sectors (agriculture and livestock) do not comprise less than 70% of export commodities, by value, during the period. Thus, the narrative may, in fact, understate the extent to which Ethiopia is reliant upon agricultural commodities within its economy, and, specifically, within its exported commodities. The rise of electricity exports, starting in 2012/13, and the emerging industrial sector, may diversify the export market in the coming years. However, the extent of this change remains to be seen. For the near- and medium-term, Ethiopia’s key export commodities will continue to be agricultural. This is well recognized by the Government of Ethiopia, which views enhancing agricultural productivity as a critical area for development (
NPC 2016). In this paper, we have not addressed questions regarding the distribution of benefits within the transformation of the economy. It is well worth noting that a focus on growth and productivity does not equate with supporting small-holder farmers, who are the majority of the population of the nation, nor those living outside of the high production potential areas (
Cochrane 2017). In fact, that growth may come at their expense. The import data presented insight into the economy, as well as the vulnerabilities of the agricultural sector, particularly, the inability to consistently meet domestic needs during years of drought.
The fourth narrative emerged more recently, that of African nations becoming heavily indebted and, in particular, highlighting the role of China as a new, problematic lender. The narrative of debt is well substantiated, with Ethiopian debt rising ten-fold during a period of a single decade, resulting in the downgrading of the Government of Ethiopia by some lending agencies, due to concerns about high levels of debt and the potential for debt distress in the economy. This was combined with a widening of the import–export trade deficit, signaling that the economic woes may pose yet more challenges. Given changes in 2018, we anticipate that the debt challenge may worsen still. However, the singling out of the role of China, with regard to the debt crisis in Ethiopia, is only part of the story. Based on the available data, it appears that China is the largest single lender to Ethiopia. However, a host of other lenders have also contributed to the current level of debt, with lenders other than China accounting for approximately half of the debt load.


