1. Introduction
Since the implementation of the reform and opening-up policy in 1978, China’s economy has entered a period of sustained and rapid growth, and the income levels of urban and rural residents have shown a significant upward trend. However, the imbalance in income distribution resulting from the expansion of the total economic volume has gradually become a key contradiction restricting the balanced development of society. Data shows that China’s Gini coefficient reached 0.467 in 2022, which is at the international warning line, with the income gap between urban and rural areas contributing more than 40 percent to overall inequality. Compared with static income disparity, household income mobility, as a core indicator of dynamic changes in economic status, is a dynamic portrayal of the changes in income ranking achieved by micro individuals at different times, which can more essentially reveal social opportunity equity and resource allocation efficiency (
Fields & Ok, 1999;
H. Wang et al., 2012). If income mobility remains low for a long time, even if the Gini coefficient remains stable, low-income groups will be trapped in a vicious cycle of intergenerational poverty transmission due to the path dependence effect, ultimately leading to social class solidification and intensification of structural contradictions (
S. Li, 2021). In response to this realistic predicament, the Party Central Committee explicitly proposed in the report of the 20th National Congress of the Communist Party of China, “to unblock upward mobility channels and expand the middle-income group”. However, existing research has largely examined financial literacy effects on static income levels or wealth, while its role in dynamic income mobility—especially across urban–rural divides—remains underexplored.
The Central Committee of the Communist Party of China has listed unblocking upward mobility channels as a core task of the common prosperity strategy. Under this policy framework, the economic decision-making ability of micro-entities becomes a key variable affecting the efficiency of income flows.
As digital technology penetrates both urban and rural areas, the accessibility boundaries of financial services continue to expand. However, the complexity of financial products and the problem of information overload stand out simultaneously. As of 2022, the number of Internet finance users in China reached 320 million, up 217 percent from 2015. However,
People’s Bank of China (
2021) on Consumer Financial Literacy shows that only 38.2 percent of respondents can accurately identify investment risks, and the proportion of rural residents lacking risk awareness is 14.7 percentage points higher than that in urban areas. Against this backdrop, financial literacy, as an immune barrier for families to cope with changes in the financial ecosystem, has evolved from basic financial knowledge reserves to a comprehensive decision-making system that includes information screening, risk pricing, and cross-market arbitrage capabilities (
Lusardi & Mitchell, 2023). It is worth noting that there are significant differences in the distribution and pathways of financial literacy under the urban–rural dual structure: on the one hand, urban families, relying on high-quality educational resources, a dense network of financial institutions and diverse information channels, are more likely to accumulate systematic financial knowledge and practical skills. In rural areas, due to insufficient investment in education, weak financial infrastructure and the digital divide, residents’ financial literacy is generally in a “cognitive depression”. On the other hand, policy orientation and market resource allocation have further exacerbated the urban–rural divide—urban financial innovation policies are often piloted first, and inclusive financial products are designed to better meet the needs of high-income groups, while rural families have long faced structural constraints such as a single financial tool and a lack of risk hedging mechanisms. This disparity not only directly leads to the gap between urban and rural households in terms of asset allocation efficiency and risk management ability, but also forms a cyclical cumulative effect of literacy—opportunity—mobility through intergenerational transmission, ultimately solidifying into the urban–rural differentiation pattern of income mobility. Although the existing literature has extensively explored the impact of financial literacy on household asset allocation and wealth levels, there is insufficient attention paid to the dynamic process of how it affects income mobility, and there is a lack of in-depth analysis of the mechanisms of urban–rural heterogeneity. The possible marginal contribution of this paper lies in: First, unlike static studies that focus on income levels, we provide a dynamic perspective by systematically examining the long-term impact of financial literacy on income mobility using a Markov transition matrix, thereby addressing the lack of dynamic analysis in the existing literature. Second, a detailed breakdown of the mechanism of action was achieved. This paper divides general financial participation into two paths: savings behaviour centred on risk resistance and investment behaviour centred on wealth appreciation, which responds to the call for disentangling heterogeneous pathways of financial literacy. Third, it deepens the multi-dimensional comparative analysis of urban–rural heterogeneity. Through regional and income class grouping tests, this paper reveals the complex picture of the empowering effect of financial literacy in the urban–rural dual structure, providing new empirical evidence for understanding the differentiated effects of financial inclusion and its potential Matthew effect.
This paper will use the tracking data of the Chinese Household Finance Survey (CHFS) from 2015 to 2019 to construct a dynamic analysis model based on the Markov transition matrix to systematically examine the pathways and effects of financial literacy.
2. Literature Review
Under the guidance of the common prosperity goal, research on the impact of financial literacy on the disparity in income mobility between urban and rural areas has significant policy value and social significance. Although the income gap between urban and rural areas in China shows a trend of narrowing, the structural differences in income mobility may still exacerbate intergenerational transmission problems and hinder the development of social equity.
A growing body of literature has examined the role of financial literacy in household asset allocation, wealth accumulation, and debt management, as reviewed below. However, most existing studies focus on static outcomes such as income inequality or wealth levels, paying insufficient attention to the dynamic process of income mobility. Moreover, the literature largely treats financial literacy as a homogeneous concept without systematically comparing its pathways across different financial behaviours (savings vs. investment) or accounting for the moderating role of digital finance. Finally, empirical evidence on urban–rural heterogeneity remains fragmented, with few studies explicitly testing whether the effects differ between urban and rural households or across income groups within the same region. This study aims to fill these gaps by offering a dynamic analysis framework that incorporates two mediating channels (savings and investment) and examines heterogeneous effects across urban–rural, regional, and income dimensions.
Financial literacy represents the cognitive level and decision-making ability of economic entities regarding core financial concepts such as the time value of money, risk management tools, and portfolio strategies in the process of intertemporal resource allocation. The essence of financial literacy lies in enhancing the efficiency of resource allocation throughout an individual’s life cycle by optimising financial decision-making behaviour, thereby maximising the intertemporal welfare function (
Lusardi & Mitchell, 2011). Financial literacy has become a core mechanism for promoting wealth accumulation by improving the efficiency of family asset allocation and risk management capabilities. Several studies have shown that the improvement of financial literacy can lead families to shift from conservative savings preferences to diversified asset allocation, especially by increasing the proportion of risky assets such as stocks and funds (
Qin et al., 2018;
W. Wu et al., 2018). For rural households, improved financial literacy not only reduces their reliance on non-productive assets but also enhances the efficiency of wealth accumulation by optimising productive and operational investments (
Y. Wu et al., 2016). Recent evidence from
Feng and Li (
2026) further shows that financial literacy significantly promotes household entrepreneurial decisions and performance, with risk preference and financial capital serving as mediating channels. Focusing on urban households,
Chen et al. (
2024) show that financial literacy promotes risky financial investment and broadens the types of risky assets held, with fintech usage as a mediator; the effect is strongest for risk-inclined families. In addition, those with higher financial literacy tend to diversify their risk through tools such as commercial insurance, thereby reducing income fluctuations caused by sudden shocks (
L. Yang & Liu, 2019). A comparative study between urban and rural areas found that rural households, due to their lower initial level of financial knowledge, were significantly more sensitive to the improvement of financial literacy than urban households in terms of asset allocation efficiency (
Xu et al., 2024). With the spread of digital technology, digital financial literacy has become a new variable influencing the allocation of household assets in both urban and rural areas. By enhancing digital financial literacy, rural households can break through geographical limitations to participate in online financial management, and their risk asset allocation ratio is 21% higher than that of households without digital financial education (
Liu et al., 2024). By contrast, urban households are more inclined to use digital tools to optimise their existing portfolios rather than expand asset classes (
Y. Wu et al., 2016).
He and An (
2026) find that digital financial literacy promotes household wealth accumulation through increasing income and reducing expenditure, with stronger effects for low-income and rural households. Similarly,
Y. L. Zhang et al. (
2025) show that digital financial literacy alleviates consumption inequality and weakens the inequality effect of income disparity.
Yu et al. (
2025) further document that digital financial literacy significantly increases rural household income by expanding social capital, with regional financial development moderating this effect. This disparity suggests that digital technology is more financially inclusive for rural households and could be a key lever to narrow the gap in asset allocation between urban and rural areas. The impact of financial literacy on household debt behaviour presents a dual feature: on the one hand, it can enhance the household’s ability to obtain loans through formal channels and reduce financing costs. On the other hand, it can reduce irrational borrowing by enhancing risk awareness (
W. Wu et al., 2019). For low-income families, improved financial literacy can significantly alleviate mobility constraints and prevent financial distress due to high-interest debt (
Meng et al., 2019). It is notable that there are significant differences in debt behaviour between urban and rural households: Rural households are more likely to rely on informal borrowing due to the lack of formal financial service channels, and improved financial literacy can effectively guide them to the formal financial system, thereby improving their debt structure (
Liu et al., 2024).
Song et al. (
2025) additionally demonstrate that financial literacy enhances the development resilience of middle-income households, preventing them from falling out of the middle-income group and facilitating upward mobility for potential middle-income households. This disparity suggests that the role of financial literacy needs to be analysed differently in combination with the characteristics of regional financial ecosystems.
Long-term follow-up studies have shown a paradox of improved absolute mobility and weakened relative mobility in urban and rural income mobility in China. The problem of the solidification of urban residents’ income ranks has become increasingly prominent, as low-income groups have fewer opportunities for upward mobility and high-income groups have more stability in their ranks (
Wan et al., 2019). Although rural areas have seen increased mobility due to the expansion of non-farm employment, the risk of intergenerational transmission in low-income families remains high (
S. Yang, 2016). Recent evidence further indicates that digital literacy significantly promotes upward income mobility for rural households, particularly by enabling the reallocation of land, capital, labour, and technology, and exerts a bottom-protection effect for low-income families (
Ma & Mao, 2025). Similarly, digital literacy enhances household income mobility through the accumulation of human and social capital, as well as through participation in non-agricultural employment and financial market investment, with stronger effects observed in rural, less-developed, and middle-aged/less-educated households (
B. C. Sun, 2025). The root cause of this structural imbalance lies in the urban–rural division of social mobility channels, such as education and occupation—rural families rely more on non-agricultural employment to achieve income leaps. In contrast, urban families gain sustained advantages through human capital accumulation (
Yan et al., 2014). In this context, formal credit accessibility has been shown to significantly improve household income mobility by enhancing asset allocation efficiency, employment quality, and social capital maintenance, with particularly positive effects for urban and better-educated households (
Tian et al., 2025). Moreover, education plays a dual role in both lifting low-income households into the middle-income group and stabilising the middle-income group, with university education exerting a stronger “raising” effect and being especially beneficial for agricultural Hukou holders, children of less-educated fathers, and families with low social status (
L. C. Wang & Zong, 2024). Intergenerational spillover effects of financial literacy further exacerbate the mobility gap between urban and rural areas. The study found that for every one-unit increase in financial literacy of rural parents, the probability of their children leaving low-income groups increased by 12 percent, compared with only 7 percent in urban areas (
L. Zhang, 2009). This disparity stems from the fact that rural families are more dependent on intergenerational resource transmission: parents guide their children’s career choices through financial knowledge (such as non-agricultural entrepreneurship), directly influencing their children’s income transition paths (
Hu & Zang, 2017). However, it should be noted that flexible employment has been found to increase the risk of downward income mobility, partly due to higher job interruption probability and the persistence of the urban–rural Hukou divide (
S. C. Yang et al., 2024).
There is significant urban–rural heterogeneity in the contribution of financial literacy to income mobility. For rural households, the improvement of financial literacy not only directly affects wealth accumulation but also indirectly enhances income mobility by promoting non-agricultural entrepreneurship and improving credit availability (
Liu et al., 2024). By contrast, urban households, with better access to financial instruments, rely more on the dynamic adjustment of their portfolios for income mobility (
Ding & Zhang, 2019). The study also found that the inclusive effect of financial literacy is more prominent in rural areas, especially in regions where digital financial infrastructure is weak, and improving financial literacy can partially make up for the deficiency of institutional supply (
Hu, 2018). Non-economic factors such as social networks and demographic structure significantly regulate the effect of financial literacy. The “Matthew effect” of social capital in rural areas may amplify the benefits of financial literacy: families with high financial literacy obtain scarce financial information through social networks to further consolidate their competitive advantage. On the contrary, the inhibitory effect of ageing on rural income flows may be mitigated by financial literacy. Elderly families with basic financial knowledge are more inclined to land transfer or participate in cooperatives to hedge against the risk of a declining labour force (
S. Yang, 2016). This effect is weaker in urban areas where the pension system is more complete (
Hong & Ma, 2018).
The existing research on the relationship between financial literacy and income distribution has accumulated a lot of results, but it is still in its infancy, with three main limitations. First, most of the literature focuses on the impact of financial literacy on static indicators such as income gap and wealth level, lacking attention to the dynamic process of income mobility, and thus making it difficult to reveal how financial knowledge drives the intertemporal leap of household economic status. Second, the existing mechanism analysis is mostly based on a single behavioural path. It fails to systematically compare the behavioural differentiation between urban and rural households in terms of savings optimisation and investment appreciation, especially ignoring the strategic conservatism of rural households due to financial exclusion. Third, most of the existing studies compare urban and rural areas as a homogeneous whole, ignoring the heterogeneity within urban and rural areas. The present study directly addresses these three limitations by (i) shifting from static income levels to dynamic income mobility using a Markov transition matrix, (ii) decomposing the mediating pathways into savings-oriented and investment-oriented behaviours separately for urban and rural households, and (iii) conducting heterogeneity analyses across regions and income subgroups to reveal within-group differences. This paper attempts to break through these limitations and provide a new perspective for understanding the economic empowerment effect of financial literacy through a dynamic analysis framework and heterogeneity mechanism tests.
3. Theoretical Analysis and Research Hypotheses
Income mobility measures the dynamic changes in a household’s economic status over time (
Becker, 1964). It contains two key dimensions: one is stability against downside risks, that is, the ability of households to avoid a decline in income ranks; the second is the growth in seizing upward opportunities, that is, the potential for a household to achieve a leap in income rank. Therefore, improving income mobility means that households need to enhance both the resilience of the income floor and the height of the income ceiling. This requires not only the ability to smooth out short-term consumption shocks and prevent class decline due to risk shocks, but also the ability to seize investment and career opportunities and accumulate wealth to achieve class mobility.
According to modern portfolio theory, households manage risks and gain returns by allocating different types of financial assets. This process profoundly affects the stability and growth of their income streams. Financial literacy is the ability to understand and use financial tools. The main way to influence income mobility is through optimising family asset allocation decisions, as follows:
First, in terms of stabilising income, families with higher financial literacy can more effectively use risk-free or low-risk assets such as savings and insurance to build financial buffers. They have a better understanding of the importance of emergency savings, can accurately calculate the actual returns of various savings products, and are good at using insurance tools to hedge against unexpected risks, such as health and property. This enhances households’ ability to cope with negative shocks and significantly reduces the likelihood of downward income flows due to sudden spending or income disruptions. Secondly, in terms of promoting growth, families with high financial literacy are more likely to overcome information barriers and behavioural biases and participate reasonably in risky asset markets such as stocks and funds. They can better understand the trade-off between risk and return, diversify basic portfolios, and identify arbitrage opportunities in the market. Through the long-term appreciation effect of risky assets, households can accelerate the accumulation of wealth, thereby providing capital for entrepreneurship, educational investment, or career change and increasing the likelihood of income mobility.
Therefore, the improvement of financial literacy can enhance the income mobility of households in both anti-decline and pro-upward dimensions by prompting them to optimise their asset allocation structure—that is, by strengthening the defensive allocation oriented towards stability and the aggressive allocation oriented towards growth. As a result, this paper puts forward the overarching research hypothesis:
H1. Financial literacy can significantly enhance household income mobility.
Financial literacy does not work in a vacuum but is embedded in specific financial ecosystems. The urban–rural dual structure leads to systemic differences in the financial ecosystem, resulting in heterogeneous effects of financial literacy on income mobility.
In urban areas, financial markets are developed, financial products are abundant, and information flows rapidly. Urban households with high financial literacy have easy access to a wide range of savings and investment tools, and competition among financial institutions reduces service costs. At the same time, a better legal and credit environment reduces the risk of contract enforcement. As a result, urban households are able to translate financial knowledge more fully and efficiently into practical, complex asset allocation behaviours, and the marginal output of financial literacy is higher. Rural areas, on the contrary, face typical financial exclusion. Financial infrastructure is weak, product offerings are limited, and risk hedging tools are severely lacking. Even if rural residents have some financial knowledge, they often face the dilemma of having knowledge but no tools or having tools but the cost is too high. Their financial activities are more confined to traditional savings, and the threshold for participating in risky asset markets is extremely high. As a result, the same amount of financial literacy improvement in rural areas may have a weaker effect on asset allocation optimisation and wealth appreciation. Based on this, this paper proposes:
H2. The promoting effect of financial literacy on income mobility is heterogeneous between urban and rural areas, with a stronger effect on urban households than on rural households.
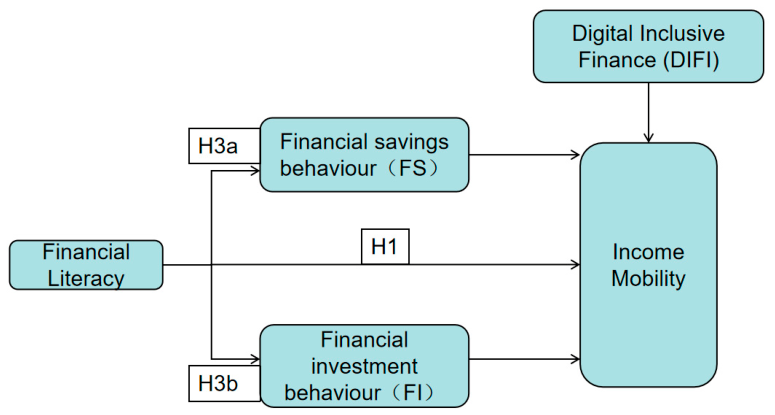
Based on the previous framework, financial literacy needs to play a role through specific asset allocation behaviours. This paper further breaks down the key intermediary mechanisms into two categories: financial savings behaviour centred on stability and financial investment behaviour centred on growth (
Figure 1).
H3a. Financial literacy reduces the risk of downward income flow by increasing the diversity of household savings tools and enhancing financial resilience.
H3b. Financial literacy promotes upward income flows by expanding the types of risky assets held by households and enhancing the efficiency of wealth appreciation.
Moreover, the differences in the financial ecosystem exist not only between urban and rural areas but also between regions, and the financial needs and constraints of families in different income brackets are also different. Therefore, this paper anticipates:
H4. The marginal effect of financial literacy on income mobility in low-income households is stronger because of their weak initial financial capacity and greater potential to break through participation constraints.
5. Empirical Research
5.1. Comparative Analysis of the Income Transfer Matrix Between Urban and Rural Areas
This paper analyses income mobility by constructing a transfer matrix. As a fundamental tool for studying income mobility, the income transfer matrix can effectively reveal the dynamic changes in income distribution across different states, as follows:
Among them,
represents the probability that an individual is at level
i at the beginning of the period and flows to level
j at the end of the period, m represents the number of income levels arranged in ascending order, and
represents the combination of all income levels from the beginning to the end of the period. In income flows, the following three situations exist: when
i <
j, it indicates an upward flow of household income levels. When
i =
j, it indicates that the household income level has not changed; when
i >
j, it indicates a downward flow of household income. These three situations correspond to different flows of household income. Based on these probabilities, the income shift matrix is constructed as follows:
To explore the differences in the impact of financial literacy on household income mobility between urban and rural areas, the study selected 2015, 2017, and 2019 as sample observation periods and divided the entire sample into two sub-samples, urban households and rural households, based on the regions where the households were located. Income transfer matrices were constructed respectively. By comparing the two matrices of urban and rural areas, the differences in income mobility between urban and rural areas can be initially studied. The specific calculation results of the income transfer matrix will be presented in
Table 3,
Table 4,
Table 5 and
Table 6.
According to
Table 3, 33.6% of households in the lowest income bracket in urban households remained in the low-income bracket during the two-year period, but as many as 36.4% of households jumped to the second income bracket, suggesting that lower-income households have some potential for upward mobility in urban areas. At the same time, the retention rate of households in the high-income class (Class 5) reached 67.4%, indicating that high-income groups have relatively stable incomes in urban areas. In contrast, among rural households shown in
Table 4, low-income households have a slightly higher retention rate, but at the same time, a larger proportion of households have jumped to the middle-income level. The retention rate for the top income group was only 30.1%, indicating that the stability of the high-income group in rural households is relatively weak and income fluctuates more.
A further comparison between
Table 5 and
Table 6 shows that the retention rate of the low-income group in urban households was 48.6% during 2017–2019, while the high-income group showed a much higher retention rate of 57.2%, indicating growing income stability among top earners. Meanwhile, middle-class families also exhibited a relatively stable mobility trend. For rural households during the same period,
Table 6 shows a retention rate of 38.0% for the low-income group and 45.2% for the high-income group, both lower than the corresponding levels in urban households, indicating higher uncertainty and greater volatility in income mobility.
Overall, the four income transfer matrices show significant differences in income mobility between urban and rural households. Urban households, due to their more developed financial markets and more abundant financial products, have relatively stable income flows and strong upward mobility potential. In rural households, due to insufficient supply of financial services and the difficulty in implementing relevant policies, the high-income group is less stable. In contrast, the low-income group has upward mobility, but the overall income structure is more volatile. This disparity not only reflects the significant differences in economic structure and financial ecology between urban and rural areas, but also provides an empirical basis for further exploring the role of financial literacy in promoting the mobility of household income.
5.2. Baseline Regression
In this study, the Ordered Probit model was used to analyse the impact of financial literacy on household income mobility in urban and rural areas, and the urban and rural samples were grouped for regression to explore their heterogeneous effects. The baseline regression results are presented in
Table 7. The following are the main findings of the baseline regression results:
Financial literacy significantly positively affected household income mobility in all regression models, suggesting that improved financial literacy helped increase the probability of rising household income. Among them, in Model 1, the coefficient of financial literacy was 0.072, and after controlling for variables in Model 2, the coefficient rose to 0.123, indicating that the impact of financial literacy on income mobility was more significant after controlling for potential influencing factors.
When viewed by urban and rural areas, financial literacy has a stronger impact on urban households and a relatively weaker impact on rural households. The results suggest that financial markets in urban areas are more mature, financial products are more diverse, and information is more accessible, enabling urban households to translate financial knowledge into actual financial management behaviour more effectively, thereby boosting income levels and class mobility. In rural areas, financial services are relatively less accessible, and the financial environment and infrastructure remain to be improved, resulting in financial literacy, although also having a positive effect on income mobility, having a weaker marginal effect.
To examine the intensity of the effect of financial literacy on household income mobility in different regions in more detail, the study further measured its marginal effect, and the results are shown in
Table 8 and
Table 9. The regression analysis based on the Ordered Probit model indicates that the direction of the effect of financial literacy on household income mobility in urban and rural areas is consistent. However, there are significant differences in the intensity and distribution characteristics of the effect. The inhibitory effect of financial literacy on downward income flows shows “hierarchical sensitivity” between urban and rural areas. In urban households, for every 1-unit increase in financial literacy, the probability of extreme down decreases by 0.4%, while the inhibitory effect on minor down1 risk reaches 2.0%, indicating that the ability to cope with risk systematically increases with the severity of the shock. This phenomenon may stem from the optimisation of risk exposure by urban households through dynamic asset restructuring (such as reducing holdings of highly volatile stocks and increasing holdings of government bonds) (
W. Wu et al., 2018). By contrast, rural households’ inhibitory effect on extreme downside risk (down4) was only 0.3%. The inhibitory effect weakened as mobility increased (down1: −1.5%), reflecting the insufficient availability of their risk management tools, such as agricultural insurance and futures hedging, which limited the function of the “protective valve” of literacy (
Liu et al., 2024). The essence of the urban–rural disparity is the “institutional division” of financial markets—urban households rely on multiple tools to diversify risks, while rural households still rely on informal borrowing to ease mobility crises (
L. Zhang, 2009). At this point, the research H1 proposed in this paper has been effectively verified. These results indicate that the promoting effect of financial literacy on income mobility is stronger for urban households than for rural households. This difference validates Hypothesis H2, which posits significant urban–rural heterogeneity in the effect of financial literacy.
5.3. Robustness Tests
To ensure the reliability of the baseline regression conclusion, the study conducts robustness tests from multiple dimensions. This was carried out through four methods: first, replacing the explained variable and using different metrics to measure household income mobility to avoid the impact of bias in measuring a single metric on the results; second, adjust the explanatory variables by constructing different calculation standards of financial literacy to test whether differences in the definition of core variables lead to changes in the conclusion; third, narrow the sample range, exclude samples from specific regions, and examine the stability of the core conclusion under stricter sample conditions; fourth, the PSM propensity matching method was used to evaluate the consistency of the estimated results after matching between the treatment group and the control group by controlling the sample selection bias. The results showed that regardless of the robustness test method used, financial literacy still significantly promoted income mobility, verifying Hypothesis 1 that financial literacy significantly promoted income mobility between urban and rural households, and the characteristics of urban–rural differences still existed, with a stronger promoting effect on urban households, indicating that the baseline regression results were robust and reliable. The results are presented in
Table 10.
5.3.1. Replace the Explained Variable
To test whether the impact of financial literacy on household income mobility is affected by the setting of the dependent variable, a dummy variable of income flow direction is constructed in this paper. When the income rank of a household in period t is less than or equal to period t − 1, it is considered that income has not increased, and the variable is assigned 0; When the income rank of a household in period t is higher than that in period t − 1, it is considered that household income is on an upward trend and is assigned 1. The results showed that in the urban sample, the coefficient of financial literacy was 0.108, still significantly positive, similar to the benchmark regression results, indicating that financial literacy still has a strong promoting effect on the mobility of urban household income. In the rural sample, the coefficient of financial literacy is 0.097, which is still significant but slightly lower, indicating that its promoting effect on rural household income mobility still exists but is relatively weak. This result validates that the baseline regression results do not depend on the specific setting of the explained variable, and the positive effect of financial literacy on income mobility still holds.
5.3.2. Replace the Explanatory Variable
In this paper, the construction method of the explanatory variables was changed, and the residents’ responses to the financial literacy question were scored and summarised to test the robustness of financial literacy. The method was to divide the scores of the options for “degree of interest in financial and economic information” and “risk appetite questions” by 5, respectively; 1 point is awarded for each correct answer to the remaining item, with a maximum total of 4 points. The results showed that in the urban sample, the coefficient of financial literacy was 0.210, still significantly positive, similar to the benchmark regression results, indicating that financial literacy still has a strong promoting effect on the income mobility of urban households. In the rural sample, the coefficient of financial literacy was 0.102, still significant but slightly lower, indicating that its promoting effect on rural household income mobility still exists but is relatively weak. This result validates that the baseline regression results do not depend on the specific setting of the explained variable, and the positive effect of financial literacy on income mobility still holds.
5.3.3. Shrink the Sample Size
Considering that municipalities directly under the Central Government have particularities in terms of the distribution of economic and financial resources, which may affect the robustness of the benchmark regression, this paper re-conducts the regression after eliminating the samples of municipalities directly under the Central Government. In the urban sample, the coefficient of financial literacy is 0.146, which is significantly positive, indicating that the effect of financial literacy on urban income mobility remains robust even after the municipalities were removed. In the rural sample, the coefficient of financial literacy remained significantly positive, indicating that the exclusion of the municipal sample did not weaken the effect of financial literacy in rural areas. The test results further suggest that the baseline regression results are not driven by the particularity of the municipalities directly under the Central Government, and the promoting effect of financial literacy on income mobility still holds in the broader sample range.
5.3.4. Propensity Score Matching (PSM)
In the process of exploring the association between financial literacy and household income mobility, traditional regression models have difficulty effectively separating the interaction effect of individual household heterogeneity and differences in financial literacy on research results, which may lead to sample self-selection bias. To eliminate this problem, in this study, the samples were grouped based on the degree of mastery of financial knowledge: families with high financial literacy were defined as the treatment group, and those with low financial literacy were defined as the control group. The propensity score values were calculated by constructing the Logit binary choice model, and the nearest neighbour 1:1 matching strategy under the calliper limit (0.05) was used to select the household characteristics as the matching dimension. The post-matching test showed that the standardised deviation of each covariate was controlled within 10%, successfully achieving feature balance between groups. The results showed that under the condition of controlling for selective bias, the estimated coefficients of financial literacy were statistically significant and consistent in direction. The results confirm that the marginal effect of financial literacy on cross-class household income mobility remains robust when balanced sample regression analysis is used. It provides support for Hypothesis 1.
Robustness tests fully demonstrate the reliability of the baseline regression results, further enhancing the credibility of the conclusions of this study. The positive impact of financial literacy remains significant, whether the explained variable is changed or the samples of municipalities are removed, indicating robust results. The urban–rural differences remained, and the coefficient of influence of financial literacy in the urban sample was consistently higher than that in the rural sample, further confirming the reliability of the benchmark regression conclusion. After excluding municipalities directly under the Central Government, the impact of financial literacy did not weaken; instead, it increased slightly in rural samples, indicating that the particularity of municipalities directly under the Central Government did not drive the benchmark conclusion.
5.4. Endogeneity Test
To further verify the causal relationship between financial literacy and income mobility of urban and rural households, this paper uses the conditional mixed process (CMP) estimation method for the endogeneity test and selects the average financial literacy of other households in the community as the instrumental variable. The results in
Table 11 show that the positive impact of financial literacy on income mobility remains significant after addressing endogeneity, thereby verifying the robustness of the baseline regression results.
In the CMP estimation method, instrumental variables need to meet both the conditions of correlation and exogeneity. This paper selects the average financial literacy of other families in the community as the instrumental variable for the following reasons: An individual’s financial literacy level is influenced by the overall financial literacy environment of the community where they live, so the average financial literacy of the community is highly correlated with individual financial literacy. Financial literacy at the community level, as a macro variable, does not directly affect individual income mobility but rather exerts its effect by influencing individual financial literacy to meet exogenous requirements.
From the estimated results, the core variable, financial literacy, still has a significant promoting effect on income mobility. The coefficient has increased significantly compared to the benchmark regression: the coefficient of financial literacy in the urban sample is 0.501, which is significantly higher than that of the benchmark regression, indicating that after endogeneity is controlled, the impact of financial literacy on income mobility is underestimated and its actual promoting effect is stronger. The coefficient of financial literacy in the rural sample is 0.561, which also shows a significant increase compared to the baseline regression, indicating that the impact of financial literacy on income mobility in rural areas is also underestimated and is more important than the results presented by the baseline regression. In addition, the coefficient of the instrumental variable was significantly positive in both urban and rural areas, further confirming that community financial literacy has a significant impact on individual financial literacy and indicating that the instrumental variable selection is reasonable.
The atanhrho 12 statistic in the CMP estimation method was used to test the correlation between financial literacy and the error term, with an estimated value of −0.618 in the urban sample and −0.558 in the rural sample, both significantly denying the null hypothesis, indicating that there is indeed an endogeneity problem in financial literacy if not controlled. It is likely to underestimate its true impact on income mobility.
Endogeneity tests show that the real impact of financial literacy on income mobility in both urban and rural households is significantly underestimated. In the CMP estimates, the coefficient of financial literacy for urban households was significantly higher than that for rural households, indicating that its absolute promoting effect was stronger in urban areas. However, rural households, due to their lower initial level of financial literacy, have greater marginal potential for improved mobility in terms of unit literacy improvement. This finding reveals the duality of the urban–rural disparity: towns need to improve the fit of advanced financial instruments. At the same time, rural areas should convert marginal potential into actual mobility improvement through infrastructure deficiencies and inclinations in inclusive policies. This means there is more room for improvement in financial literacy in rural areas, and rural residents’ acquisition of financial knowledge and improvement of their own financial literacy will result in a higher marginal return on investment in financial savings and investment behaviour. This result validates Hypothesis 4, demonstrating that financial literacy has a stronger marginal effect on income mobility for low-income families.
5.5. Mechanism Testing
Based on a systematic review of existing research results and in combination with available data resources, the study will further analyse the internal pathways by which financial literacy affects income mobility of urban and rural households and use the mediating effect model to obtain the measurement results in
Table 12. Financial literacy can affect the income mobility of urban and rural households through their financial savings behaviour and financial investment behaviour.
Financial literacy significantly affects income mobility by optimising household savings behaviour. The empirical results show that financial literacy has a significant positive effect on household savings behaviour in both urban and rural areas. However, the intensity of the effect varies significantly between urban and rural areas. In particular, the savings behaviour of urban households is more sensitive to financial literacy, with an influence coefficient as high as 0.454, and the diversity of savings tools has significantly increased, as shown by the adoption of diversified savings methods such as time deposits and money funds. This optimisation of savings behaviour not only enhances the financial resilience of households but also reduces the downside risk of income, thereby providing a stable foundation for income mobility. In contrast, although savings behaviour in rural households is also positively influenced by financial literacy, its effect is relatively weak, with a regression coefficient of only 0.319. The difference is mainly due to the lack of financial infrastructure and the singularity of financial products in rural areas, which limits the space for optimising household savings behaviour. In addition, rural households tend to choose more low-risk, low-return traditional savings tools, making it difficult to achieve a leap in income class through the optimisation of savings behaviour. Overall, financial literacy validates H3a by increasing the diversity of household savings tools and enhancing financial resilience, thereby reducing the downside risk of income.
Financial literacy has a significant effect on income mobility by influencing household financial investment behaviour, but the mechanism of this effect shows significant heterogeneity between urban and rural areas.
Table 13 presents the results for the financial investment mechanism. The financial investment behaviour of urban households is more sensitive to financial literacy, and the breadth and depth of their risk asset allocation have significantly increased. Specifically, the improvement in financial literacy significantly boosts the participation of urban households in complex financial products such as stocks and funds, and significantly increases the probability of upward income flow through the wealth appreciation effect. The empirical results show that the mediating effect coefficient of financial investment behaviour of urban households on income mobility is as high as 0.323, indicating that the improvement of financial literacy significantly promotes the expansion of risk asset allocation, thereby significantly increasing the probability of income mobility through the wealth appreciation effect. In contrast, although the financial investment behaviour of rural households was also positively affected by financial literacy, the intensity of the effect was significantly lower than that of urban households, verifying H3b.
5.6. Heterogeneity Test
5.6.1. Regional Heterogeneity
Table 14 shows that there is significant regional heterogeneity in the impact of financial literacy on household income mobility in urban and rural areas, and this difference is closely related to the economic structure, financial ecology and policy support intensity of each region.
In urban areas, the coefficient of financial literacy in eastern provinces is relatively high (0.167) and significant, which is closely related to the highly developed financial market environment in the eastern region. Economic circles such as the Yangtze River Delta and the Pearl River Delta, for example, are home to a large number of financial institutions and digital service platforms. Residents can increase their wealth through diversified investment tools such as stocks and funds, and the marginal return rate of financial knowledge is higher. In contrast, the coefficient in northeastern towns is the highest (0.273), but the sample size is relatively small (N=349), which may reflect the particularity of policy intervention. In recent years, the Northeast Revitalization strategy has promoted inclusive finance pilot projects such as supply chain finance innovation and government-subsidised loans, reducing the cost for households to participate in financial markets and making it easier for the improvement of literacy to translate into actual benefits. The effect intensity of the central and western towns shows a decreasing pattern: the coefficient is 0.137 in the central region (significant at 5%) and only 0.080 in the western region (not significant). The central region is dominated by a mixed economy of agriculture and manufacturing, household income is dependent on wage income, and the participation of financial instruments is low, which limits the ability of literacy to leverage mobility; In the western region, due to the lagging digital infrastructure, even if residents have financial knowledge, the lack of channels makes it difficult for them to invest effectively, weakening the income-increasing effect of literacy.
The regional heterogeneity in rural areas is even more complex. The rural coefficient in the east is 0.092, which is lower than that in urban areas but still significant, mainly benefiting from rural industrial integration practices. For instance, “Taobao villages” in Zhejiang have activated the demand for supply chain finance through e-commerce startups, farmers can use tools such as accounts receivable pledge to optimise operating cash flow, and financial literacy has directly contributed to the increase in income. The rural coefficient in the western region is 0.103, which is more effective than that in the central region, and this is closely related to the national key assistance policy for rural revitalization. In Guizhou and other places, new tools such as land management rights, mortgage loans, and carbon sink trading have been piloted, allowing farmers to avoid contract risks and seize the opportunity to monetize ecological resources through financial literacy, forming a virtuous cycle of “policy—literacy—mobility”. In contrast, rural areas in central China have a less significant coefficient and have become a “low-lying area for transformation”. The region is densely populated with agriculture. However, lacks the support of characteristic industries, has a low coverage rate of financial institutions, and farmers are in a predicament of “having knowledge but no access”, making it difficult to translate literacy into actual behavioural improvement. The rural coefficient in Northeast China is relatively high, but the sample size is the smallest. It may be affected by local policies, such as the reform pilot of Heilongjiang Agricultural Reclamation Group, and should be interpreted with caution. This result validates H4, demonstrating regional heterogeneity in the impact of financial literacy on household income mobility.
5.6.2. Income Heterogeneity
According to the results of the income heterogeneity group test shown in
Table 15, the impact of financial literacy on the income mobility of families at different income levels in urban and rural areas presents notable features. The following is a detailed analysis of this result.
From the perspective of overall significance, the promoting effect of financial literacy is mainly reflected in low-income families. In both urban and rural samples, the estimated coefficients of low-income families are significantly positive at the 5% level. Among them, the impact coefficient of low-income families in urban areas is 0.065, and that of rural low-income families is 0.080. This indicates that the improvement of financial literacy has a significant positive impact on the upward income mobility of low-income families. In contrast, although the coefficients of high-income families are also positive, with 0.038 for urban high-income families and 0.055 for rural high-income families, they have not passed the significance test, indicating that the impact of financial literacy on the income mobility of high-income families is not statistically robust. This result reveals that the income-increasing effect of financial literacy is more likely to benefit the groups at the bottom of the income distribution. Further observation of the differences between groups shows that the marginal effect of financial literacy has a clear differentiation pattern among different groups. In the urban sample, the impact coefficient of 0.065 for low-income families is not only significant but also higher than that of 0.038 for high-income families; in the rural sample, a similar pattern emerges, with the coefficient of 0.080 for low-income families being higher than that of 0.055 for high-income families. This result contrasts sharply with the previous conclusion that high-income families in rural areas benefit more. The new evidence indicates that, whether in urban or rural areas, the promoting effect of financial literacy on income mobility is mainly concentrated on low-income groups. In contrast, high-income groups have not achieved significant improvements in income mobility.
This heterogeneous pattern may be attributed to the following mechanisms: For low-income families, the improvement of financial literacy has a stronger marginal value. These families usually face more severe credit constraints, more limited information channels, and more restricted social capital. The accumulation of financial knowledge can help them overcome these structural obstacles, understand formal credit products to alleviate financing difficulties, master basic financial management knowledge to optimise the allocation of meagre savings, and identify market information to capture non-agricultural employment or micro-entrepreneurship opportunities. These improvements in basic financial capabilities often have a snowball effect, directly driving their income class upward. In contrast, high-income families already have relatively rich market participation experience and diverse asset allocation channels, and the marginal increase in financial literacy has a relatively limited additional contribution to their income mobility, making it difficult to detect a significant impact statistically.
Based on the comparison of the four groups across urban and rural areas and income levels, it can be concluded that financial literacy is not universally beneficial to all groups but shows a distinct feature of helping the disadvantaged. Its effect intensity is profoundly regulated by the initial resource endowment of families: in resource-poor low-income groups, financial literacy can play a key role in making up for deficiencies and breaking through bottlenecks. In contrast, in resource-rich high-income groups, its marginal effect tends to be blunted. This finding has important implications for policy-making: when promoting financial literacy improvement programmes, priority should be given to low-income families in both urban and rural areas. Through targeted financial education and service provision, the channels for upward mobility of disadvantaged groups can be opened up, thereby effectively connecting financial empowerment with the goal of common prosperity.
5.7. Moderating Effect
Table 16 presents the moderating effects of digital inclusive finance. The interaction term between financial literacy and digital inclusive finance is negative and statistically significant in the full sample (−0.107) and the urban subsample (−0.145), but negative and insignificant in the rural subsample (−0.089). This indicates that digital inclusive finance weakens the positive effect of financial literacy on income mobility, rather than enhancing it, suggesting a potential substitution effect between digital tools and household financial knowledge. The negative moderating effect is more pronounced in urban areas, which may be attributed to the "technology dependency trap": highly developed digital financial infrastructure may lead urban households to rely excessively on automated tools, thereby reducing their active use of financial knowledge in decision-making and weakening the marginal contribution of financial literacy to income mobility. In rural areas, however, the insignificant interaction suggests that the moderating role of digital inclusive finance has not yet taken effect, potentially due to limited digital access or lower financial literacy levels that cannot fully utilise digital tools. Overall, these results reveal a heterogeneous moderating effect of digital inclusive finance across urban and rural households, consistent with the "automation bias" theory (
Parasuraman & Manzey, 2010).
Unlike in urban areas, the coefficient of the interaction term in rural samples failed the significance test, indicating that digital inclusive finance has not yet formed an effective moderating mechanism. This result is closely related to the primary nature of the rural digital ecosystem: on the one hand, weak infrastructure (such as incomplete network coverage, low penetration rate of smart terminals) makes it difficult for digital tools to deeply integrate into household economic decisions; on the other hand, farmers’ lack of digital skills leads them to use digital technology more for basic payment functions rather than complex wealth management, resulting in the inability to fully translate the improvement of financial literacy into income-generating capacity through digital channels. The findings provide new evidence for understanding the double-edged sword effect of the digital economy. For urban households, beware of the erosion of active financial capabilities by technological convenience, and policy design should promote “human–machine collaboration” models, such as embedding financial knowledge learning modules in intelligent investment advisors, to enable households to use tools while maintaining decision-making autonomy. In rural areas, the top priority is to break the application bottleneck through a combination of software and hardware: at the hardware level, it is necessary to accelerate the construction of 5G base stations and village-level financial service stations to lower the threshold for using digital tools; at the software level, financial education products tailored to rural scenarios should be developed, such as disseminating risk prevention knowledge through short video platforms to help farmers turn digital access into real “literacy dividends”. Only in this way can the digital economy be activated to enhance the mobility of income amid urban–rural disparity.
6. Conclusions and Policy Recommendations
6.1. Implement Differentiated Financial Capacity Enhancement Programmes for Urban and Rural Areas
In view of the significant differences in financial ecology, resource endowments, and behavioural patterns between urban and rural households, policy design should adhere to the principle of “precise empowerment and classified measures” and implement differentiated financial capacity enhancement plans for urban and rural areas.
For urban households, the policy focus can be placed on improving the quality and efficiency of financial market services. For example, intelligent investment advisor tools could be promoted to optimise household asset portfolio allocation through algorithms, analyse household risk preferences and life cycle stages, and dynamically recommend the allocation ratios of products such as stocks, bonds, and target-date pension funds to reduce the risk of irrational trading. At the same time, it is possible to explore the establishment of “family financial health centres” at the community level, providing public asset diagnosis services to help families identify potential risks such as excessive debt and concentrated investment. For high-net-worth families, a “wealth succession planning” service could be piloted to explore the use of family trusts, tax optimisation, and other tools for the stable transfer of wealth across generations.
For rural families, efforts should be made to build a two-tier support system that combines “popularisation of basic financial knowledge” with “financial empowerment of characteristic industries”. On the one hand, financial infrastructure should be strengthened, and the functions of village-level financial service stations should be enhanced. In addition to providing basic deposit and withdrawal services, “financial literacy classes” should be added to explain practical knowledge, such as compound interest on savings and insurance claims, in dialects and other popular forms. On the other hand, compound financial products that are deeply integrated with rural production and life scenarios can be developed. For example, explore low-interest loan products based on land management rights, allowing farmers to use land contracting rights as collateral to obtain productive funds; explore the “futures + insurance” model in major agricultural production areas and encourage qualified households to participate in futures hedging of major agricultural products to hedge against price fluctuations; pilot innovative tools such as “home-stay income rights pledge loans” in rural tourism demonstration zones, replacing traditional collateral requirements with future cash flow assessment to break financing bottlenecks.
6.2. Design Precise Empowerment Programmes for Low-Income Groups
Improving the financial literacy of low-income groups is the key to breaking the “low-income low-literacy” vicious cycle and enhancing their income mobility. Policy design should focus on precision and incentives, and implement a three-in-one comprehensive empowerment programme of “literacy improvement—industry support—credit access”.
For rural low-income families, a step-by-step and progressive financial training program should be developed first: at the primary stage, focus on basic savings planning and the popularisation of anti-fraud skills; In the middle stage, introduce household financial diagnostic tools and teach the use of digital tools to record income and expenditure and set budgets; The advanced stage can be combined with specialised agricultural skills training. Secondly, financial subsidies and microcredit resources should be integrated to offer incentive policies of “training instead of subsidies” to families that complete the training, such as providing differentiated credit limits and interest rate discounts based on the training level. In addition, explore the establishment of a “financial literacy—credit score” linkage mechanism, incorporating course participation, repayment records, etc., into the credit scoring system, and giving priority to opening up opportunities such as low-interest start-up loans to high-scoring families.
For low-income groups in urban areas, it is necessary to strengthen the synergy mechanism of “career transformation” and “financial support”. The “Digital Finance Practice” module can be embedded in vocational and technical schools and reemployment training, covering practical skills such as basic financial tool operation and social security and housing fund inquiry, and customised insurance products can be provided in cooperation with gig economy platforms. At the same time, families can be guided to achieve gradual wealth accumulation through simple, low-risk combinations such as regular investment in index funds and money market funds. The government may consider providing policies such as margin financing incentives to help them use the accumulated funds for skill improvement or small and micro entrepreneurship.
6.3. Break Down Barriers to the Flow of Factors Between Urban and Rural Areas
The full realisation of the financial literacy empowerment effect ultimately depends on the breaking down of the urban–rural dual structural barriers. Therefore, a series of deep-seated systemic reforms must be carried out to create a fair, competitive market environment for both urban and rural families.
First of all, the process of integrating the social security systems in urban and rural areas should be accelerated, and the implementation path for steadily increasing the replacement rate of rural residents’ endowment insurance should be clarified. Through various channels such as central government transfer payments, local government collective subsidies, and individual flexible contributions, the level of rural social security can be jointly enhanced to alleviate their concerns. Secondly, we should promote the deep integration of fintech and rural finance, explore the establishment of a credit assessment system based on big data at the county level, integrate information such as land rights confirmation, e-commerce transactions, and agricultural Internet of Things, build a multi-dimensional credit profile, gradually replace the excessive reliance on traditional mortgage guarantees, and improve the credit accessibility of rural families.
Thirdly, we should deepen the reform of the household registration system and establish a financial rights and interests protection mechanism covering “new citizens”. Include migrant workers in the urban housing provident fund system and explore the use of their rights across regions; encourage commercial banks to develop credit products that fit the characteristics of new urban residents. At the same time, one-stop “financial rights service stations” can be set up in urban–rural fringe areas to provide policy consultations on medical insurance, education, pensions, etc., and reduce the institutional costs of their integration into the city.
Fourth, the government should strive to build an environment for the dissemination of complete, truthful, and transparent financial information. On the one hand, supervision of financial institutions‘ information disclosure should be strengthened, requiring that marketing materials for financial products clearly present risks, fees, and return structures, eliminating misleading statements. On the other hand, relying on communities, village committees, and digital platforms, authoritative channels for financial knowledge popularisation should be established to promptly clarify false information and market rumours, reducing the probability of households making erroneous decisions due to information asymmetry. A complete and truthful information environment is a fundamental guarantee for financial literacy to play its positive role.
To sum up, financial literacy is a key lever to solve the dilemma of income mobility between urban and rural areas, but its effect is highly dependent on the design of supporting systems. Emphasising inclusiveness alone is likely to fall into the trap of the “Matthew effect”. Improving financial literacy is a necessary foundation, but it is by no means a panacea. Only by embedding it in a systematic framework that includes strict regulation, consumer protection, industrial support, social security and inclusive policy design can it truly activate its positive driving effect on income mobility between urban and rural areas and prevent inclusive finance from being alienated into a new source of inequality. Otherwise, the lack of institutional safeguards in financial expansion is likely to reinforce rather than break the “Matthew effect”, making it even more difficult to relieve the urban–rural mobility dilemma. Financial literacy is like water, and institutions are like canals. Water needs to flow into the canals to moisten the good fields; if left unchecked, it may lead to disaster.