3. Methodology and Data
3.1. Data Collection and Categorization
The Hungarian food industry’s industry-level data from 1993 to 2022 are used in this study. Three main sources provided the data: (1) a national dataset gathered by Central European University (CEU); (2) the KRTK Databank “HUN-REN Hungarian Research Network database” (accessed on 6 May 2025); and (3) the STATISTA database (accessed on 6 May 2025). The database includes comprehensive data on a variety of food industry subsectors, including production, employment, value added, wages, bonuses, working-time arrangements, and employment structures. A structural analysis of corporate concentration and its connection to labour market outcomes over a 30-year period is made possible by the level of analysis carried out at both the subsector and industry levels.
The unit of observation in this study is defined as a subsector–year panel. Each observation corresponds to a specific food industry subsector in a given year over the period 1993–2022. The final dataset therefore consists of a balanced panel of 120 observations (4 subsectors × 30 years).
Each subsector is made up of a group of companies that work in the Hungarian food industry. The concentration measures are derived from firm-level market shares within each subsector; however, the empirical analysis is performed at the aggregated subsector level due to limitations in data availability. Consequently, individual firm-level observations are not directly discernible in the dataset.
The chosen period includes significant institutional, political, and economic changes that occurred in Hungary after the country moved from a centrally planned communist system to a market-oriented economy and democratic government. In order to avoid incomplete and untrustworthy records from the early post-communist transition period, the beginning year (1993) was chosen based on data availability, accessibility, validity, reliability, and comprehensiveness. Comprehensive and verified data on important labour-related variables were only available through 2022, despite the original goal of extending the dataset through 2024. As a result, the empirical analysis ends in 2022 because the data for the following years is still lacking.
The Hungarian food industry saw significant changes in ownership structures and competitive conditions during this time, as well as widespread privatization, a notable increase in foreign direct investment, and the country’s 2004 EU accession. The chosen time frame is especially appropriate for examining trends in corporate concentration and their effects on the labour market because of these long-term developments.
Section 3.2 and
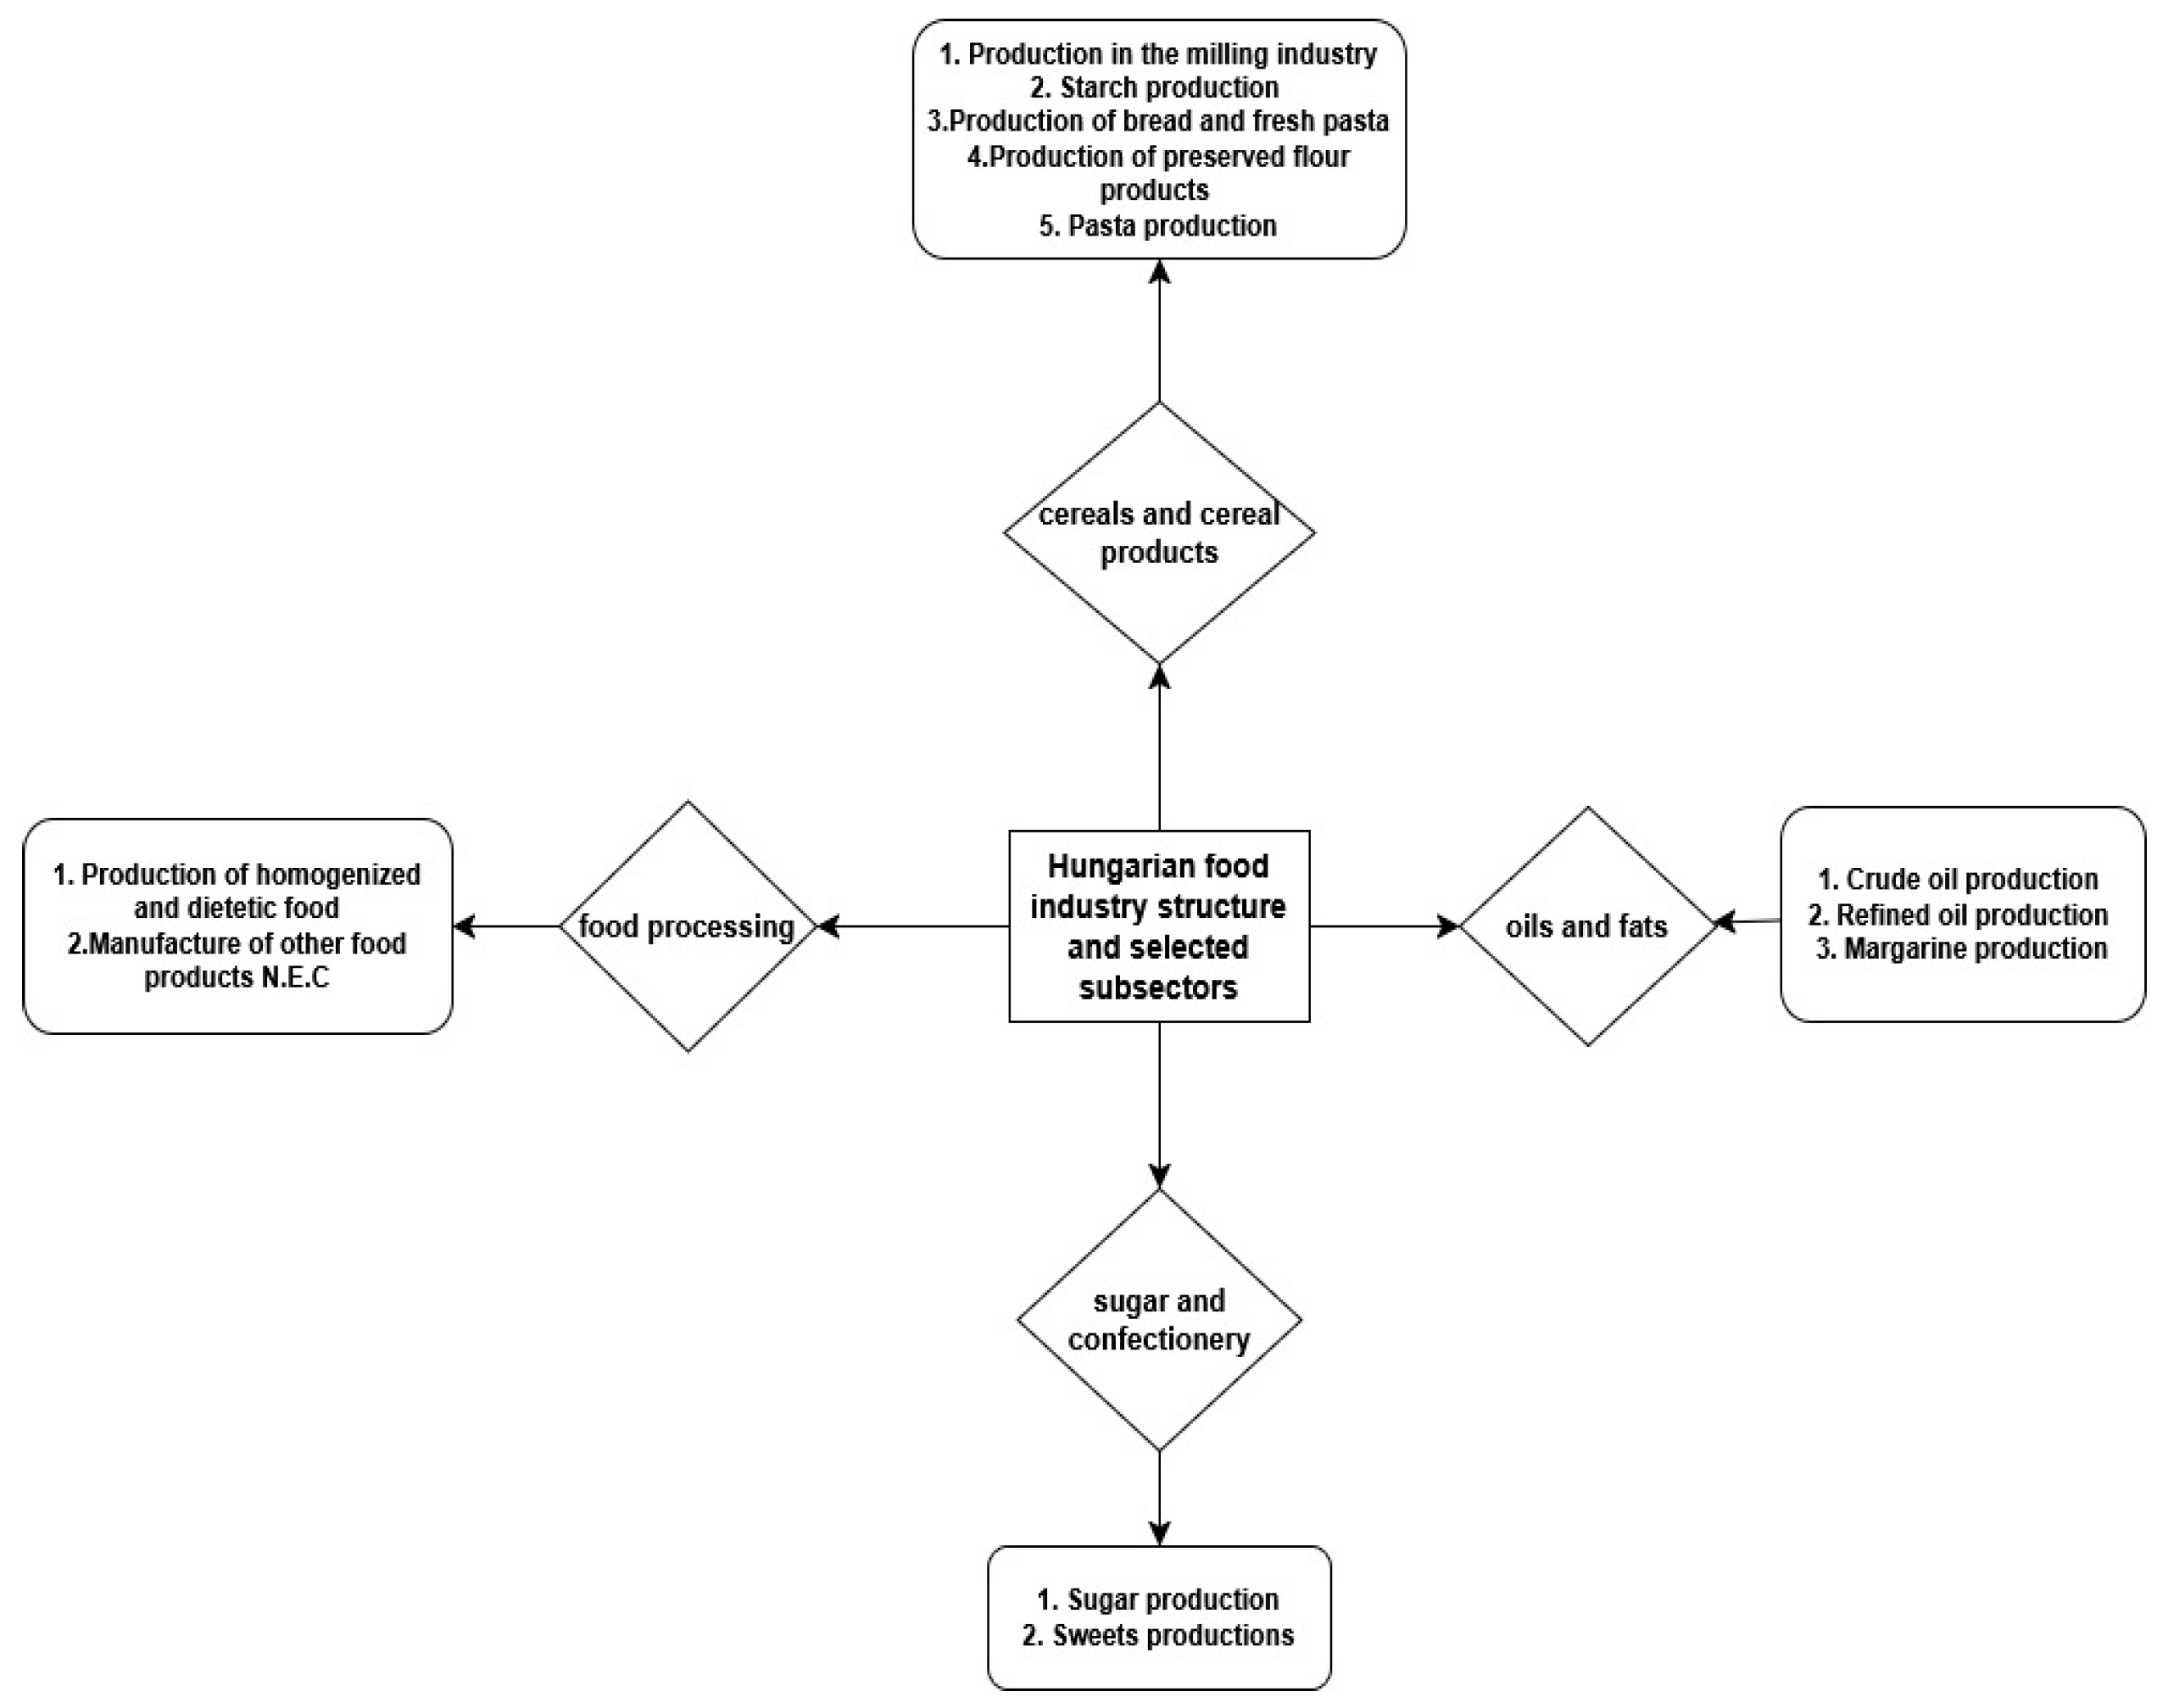
Section 3.3 go into great detail about measuring corporate concentration and labour market outcome variables. Hungary’s export-oriented growth model, the food industry’s strategic importance for employment, value added creation, and supply chain organization led to its selection. This study focuses on four major subsectors; the selection of these four subsectors is intentional and driven by the study’s focus on environments with the highest levels of corporate concentration. Including all nine subsectors would introduce substantial heterogeneity in market structure, potentially obscuring the relationship between corporate concentration and labour market outcomes. By focusing on the most concentrated subsectors, the analysis provides a clearer and more consistent empirical setting for identifying the mechanisms through which concentration affects wages and working conditions, like cereals and cereal products, food processing, oils and fats, and sugar and confectionery that exhibit the highest levels of corporate concentration among the nine subsectors of the Hungarian food industry, based on standard market concentration indicators. Detailed sector categorization can be seen in
Figure 1.
3.2. Measuring Corporate Concentration
The Herfindahl–Hirschman Index (HHI), introduced by Hirschman (
Hirschman, 1945) and Herfindahl (
Herfindahl, 1963), serves as a tool to measure corporate concentration. This study uses the Herfindahl–Hirschman Index (HHI) as the primary measure of market concentration. For a market with n firms, where the market share of firm
j is
; the HHI is calculated as the sum of the squares of the market shares:
while this study used percentages (0 <
≤ 100) market shares are typically expressed as fractions. As a result, the HHI falls between 0 and 10,000. It represents the distribution of firm sizes within a market, with a single dominant firm reaching its maximum value of 10,000 and many small firms of equal size approaching zero. As the number of businesses declines or their market share gap widens, the HHI rises (
Ericsson et al., 2024;
Johnston et al., 2024). There are general guidelines for corporate concentration levels, even though the exact numerical thresholds are not always set. For example, the
U.S. Department of Justice and the Federal Trade Commission (
2010) divide markets into three groups:
Unconcentrated Markets: HHI below 1500
Moderately Concentrated Markets: HHI between 1500 and 2500
Highly Concentrated Markets: HHI above 2500
The
European Commission (
2004) also uses the HHI to evaluate corporate concentration and horizontal mergers, with some methodological variations. Since the HHI calculation squares each firm’s percentage market share, smaller firms have limited influence on the overall HHI. Their contribution diminishes rapidly as their market share decreases. Therefore, a complete HHI can often be estimated using the market shares of the largest firms and the total market size to approximate the cumulative share of smaller participants (
Cao et al., 2023;
Ericsson et al., 2024;
Johnston et al., 2024). As a result, the following table and figure show how corporate concentration changed between 1993 and 2022 across a selected Hungarian food manufacturing subsector, as determined using the HHI (
Figure 1).
Table 1 shows consistently high levels of corporate concentration across the selected subsectors of the Hungarian food manufacturing industry. The HHI values are consistently well above the conventional threshold for highly concentrated markets, indicating the dominance of a small number of firms in all observed periods. Notably, in eight of the twenty subsector–period observations, the implied minimum market share of the largest firm exceeds 50%, suggesting substantial dominance within these markets.
HHI values represent average concentration levels within each subsector over the specified time periods. The Herfindahl–Hirschman Index (HHI) is the primary measure of corporate concentration used in this study. CR4 refers to the concentration ratio of the four largest firms, although it is not the main indicator used in the analysis.
The time periods are grouped into multi-year intervals to smooth short-term fluctuations and improve the interpretability of long-term trends in corporate concentration.
Although some variation is observed over time, including a modest decline in concentration in certain subsectors during the later period (2017–2022), the overall market structure remains highly concentrated. These patterns provide important context for the empirical analysis, indicating that labour market outcomes are shaped within environments characterized by strong market power and limited competitive pressure.
Therefore, CR4 is commonly used as an alternative concentration measure; this study relies primarily on the HHI due to its ability to capture the full distribution of firm market shares.
3.3. Labour Market Outcome Variables
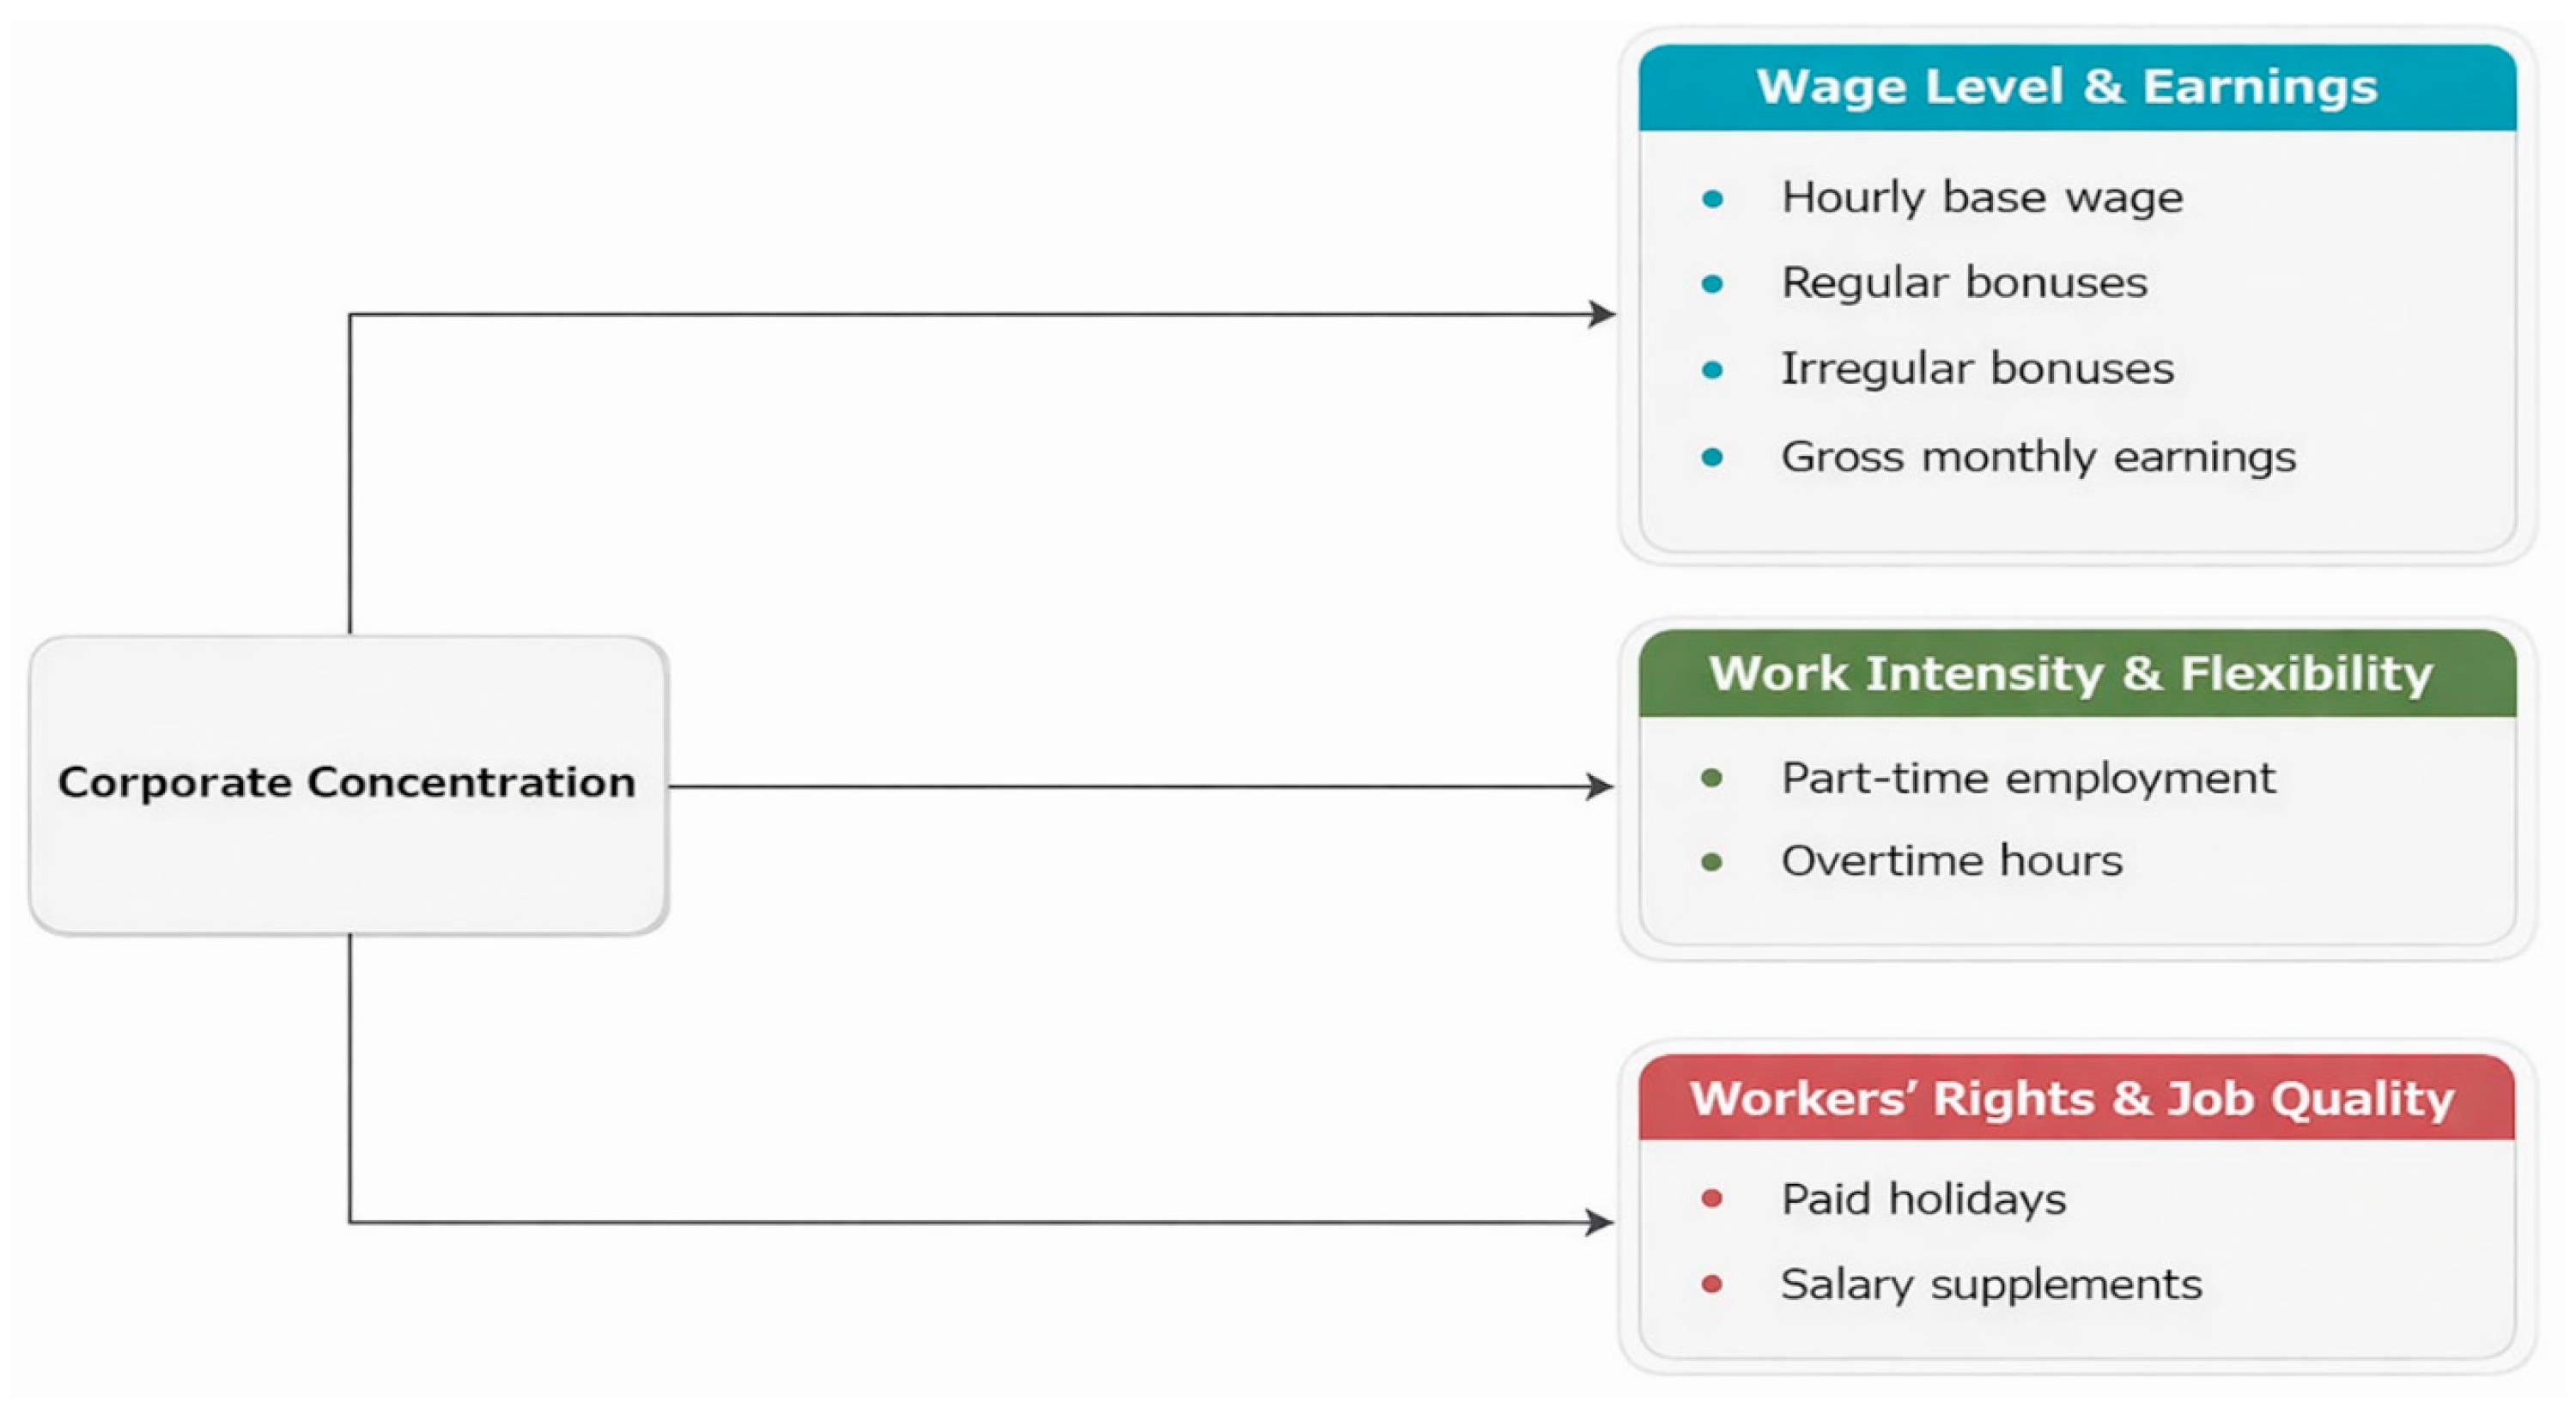
Three primary dimensions and eight sub-dimensions that directly capture and reflect corporate concentration and employer monopsony power in labour markets are used to categorize labour market outcomes in this study. The chosen variables are intended to address various facets of working conditions in the Hungarian food industry, such as work intensity, job quality, labour flexibility, and compensation structures.
Four sub-variables make up the first dimension, Wage Level and Core Earnings: base hourly wages, regular bonuses, non-regular bonuses, and gross monthly earnings. The main measure of fixed compensation is base hourly wages at the subsector level. While irregular bonuses include indirect, discretionary, and unpredictable payments that are usually given outside of formal wage-setting procedures and collective bargaining frameworks, regular bonuses are defined as predictable and periodic payments made to employees. In order to examine structural changes in earnings composition and overall worker compensation, gross monthly earnings offer a more comprehensive measure of total income. All variables related to wages are given in nominal terms and measured at the subsector level. Base hourly wages are given in Euro per hour, and gross monthly earnings, regular bonuses, and non-regular bonuses are given in Euro per month.
The percentage of share of part-time employment and overtime hours are the two sub-variables used to measure the second dimension, Work Intensity and Flexibility. While overtime hours are a measure of labour intensity and work pressure, the percentage of part-time workers indicates the degree of employment flexibility and employment uncertainty within each subsector.
Two sub-variables are used to evaluate the third dimension, Workers’ Rights and Job Quality: Paid holidays and Supplement to salary. While supplemental wage-related benefits capture the scope of non-wage coverage and the general quality of employment conditions, paid leave is used as a stand-in for institutional protections and workers’ rights.
The study’s conceptual framework is shown in
Figure 2 below. Three important aspects of labour market outcomes, wage level and earnings structure, work intensity and flexibility, and workers’ rights and job quality, are shown in the figure to be influenced by company concentration as the main explanatory variable. A systematic empirical analysis of how corporate concentration affects employment conditions throughout the chosen subsectors of the Hungarian food industry is made possible by the operationalization of each dimension through particular, quantifiable sub-variables.
4. Empirical Results
This section presents the empirical findings of the study. The analysis proceeds in four stages. First, descriptive statistics provide an overview of wage structures and earnings dispersion. Second, the evolution of corporate concentration over time is examined (H1). Third, panel regression models are employed to assess the relationship between concentration and both wage and non-wage labour market outcomes (H2–H4). Finally, a combined specification is estimated to explore potential mediation effects.
4.1. Descriptive Analysis
This subsection provides a descriptive overview of wage structures and earnings distribution across the four selected subsectors of Hungary’s food industry over the period 1993–2022. The aim is to identify preliminary patterns in wage dispersion and income composition prior to the multivariate analysis.
Table 2 reports mean hourly wages, mean gross monthly earnings, and dispersion measures across subsectors. Substantial variation is observed in average hourly wages. Food processing exhibits the highest mean hourly wage (4.63), while cereals and cereal products record the lowest (2.93). However, despite this variation in base wages, mean gross monthly earnings remain relatively similar across sectors, ranging between 225 and 241.
This divergence between hourly wages and total earnings suggests that fixed wage components alone do not fully explain income formation. Instead, additional compensation elements such as bonuses and supplementary payments likely play an important role in shaping overall earnings.
Measures of dispersion further reveal considerable within-sector inequality. High standard deviations and wide ranges between minimum and maximum earnings indicate substantial heterogeneity in compensation structures. For example, the cereals subsector shows earnings ranging from 15 to 730, reflecting the coexistence of relatively low-paid and high-income positions within the same industrial segment.
Importantly, minimum earnings remain comparatively low across all subsectors, suggesting the persistence of lower-wage employment even in capital-intensive and highly concentrated industries. However, part of the observed dispersion may also reflect differences in working-time arrangements, including variations in hours worked and overtime intensity across subsectors. In addition, as earnings are reported in nominal terms over a long time period (1993–2022), part of the variation may be influenced by wage inflation, largely reflecting underlying price dynamics. While descriptive statistics do not establish causal relationships, these preliminary patterns are consistent with the possibility that compensation structures differ across sectors in ways not captured solely by base wage levels.
The descriptive statistics presented in
Table 3 provide a detailed picture of wage structures, earnings composition, and corporate concentration across the four subsectors, Cereals and Products, Food Processing, Oils and Fats, and Sugar and Candies over the period 1993–2022.
A key insight emerges from the analysis of bonus structures. Regular bonuses average 160.40 € in Cereals, 200.87 € in Food Processing, and 232.36 € in Oils and Fats, indicating that structured, predictable bonuses are more prominent in the latter sectors. However, the Sugar and Candies subsector stands out dramatically, with an exceptionally high mean regular bonus of 943.43 € and a very large standard deviation of 813.84. This suggests extreme variability and a strong reliance on bonus-based compensation.
For non-regular (irregular) bonuses, the averages are also substantial: 450.14 € in Cereals, 662.56 € in Food Processing, 718.33 € in Oils and Fats, and even higher dispersion in Sugar and Candies (with a maximum reaching 2400 €). The high standard deviations, 438.06, 646.36, and 677.48, respectively, indicate that these payments are highly volatile and unevenly distributed. This reinforces the idea that firms increasingly rely on flexible, performance-based compensation mechanisms rather than stable wages.
Overall, the descriptive analysis reveals three major patterns. First, base wages differ significantly across sectors, with Food Processing leading and Cereals lagging behind. Second, gross earnings are relatively similar despite wage differences, indicating that bonuses and supplements play a compensatory role. Third, and most importantly, earnings variability is high across all sectors, driven largely by irregular bonus payments and differing employment structures. These findings support the broader argument that corporate concentration does not simply reduce wages, but reshapes the entire compensation structure. Workers in more concentrated sectors appear to rely more heavily on variable income components, leading to greater income uncertainty and inequality, even when average earnings remain stable. The descriptive evidence points to a relative decoupling between hourly wages and total earnings, as well as significant intra-sector dispersion. Part of this divergence may be associated with differences in working-time arrangements, including variations in hours worked and overtime intensity across subsectors. These aspects are examined more explicitly in the subsequent analysis of working-time variables.
These findings motivate the subsequent regression analysis, which formally evaluates the relationship between corporate concentration and labour market outcomes.
4.2. Stationarity Tests
Panel unit-root tests to assess the stationarity properties of the key variables prior to estimation. For the corporate concentration measure (Herfindahl–Hirschman Index, HHI) we report the Levin–Lin–Chu (LLC) and Im–Pesaran–Shin (IPS) tests. The LLC test yields a test statistic z = −0.522 with p = 0.03007, which allows rejection of the null hypothesis of a unit root at the 5% significance level, indicating that HHI is stationary in levels. The IPS test could not be reliably computed for our sample (warning/NA) due to the small cross-sectional dimension (N = 4); IPS is known to be less reliable when N is very small. Given the small cross-section, we place primary weight on the LLC result, which has greater power in panels with limited cross-sectional units. In sum, the evidence supports that the HHI series is I (0) and can be used in level form in the panel regressions. Therefore, differencing is unnecessary and the risk of spurious regression induced by non-stationarity is low; fixed-effects.
4.3. Evolution of Corporate Concentration (H1)
To evaluate Hypothesis 1, which examines whether corporate concentration increased over the period 1993–2022, a fixed-effects panel regression model was estimated. The Herfindahl–Hirschman Index (HHI) serves as the dependent variable, while a linear time trend captures overall temporal dynamics. Sector fixed effects are included to account for time-invariant structural differences across subsectors.
Table 4 reports the estimated time coefficients for both the overall fixed-effects model and the sector-specific linear trends.
Table 5 presents the estimated time trends in corporate concentration, measured using the Herfindahl–Hirschman Index (HHI). Panel A reports the results from a within (fixed-effects) panel model, where the coefficient on the time variable captures the overall trend in concentration across subsectors over the period 1993–2022. The estimated coefficient is not statistically significant, indicating the absence of a uniform trend in corporate concentration at the aggregate level.
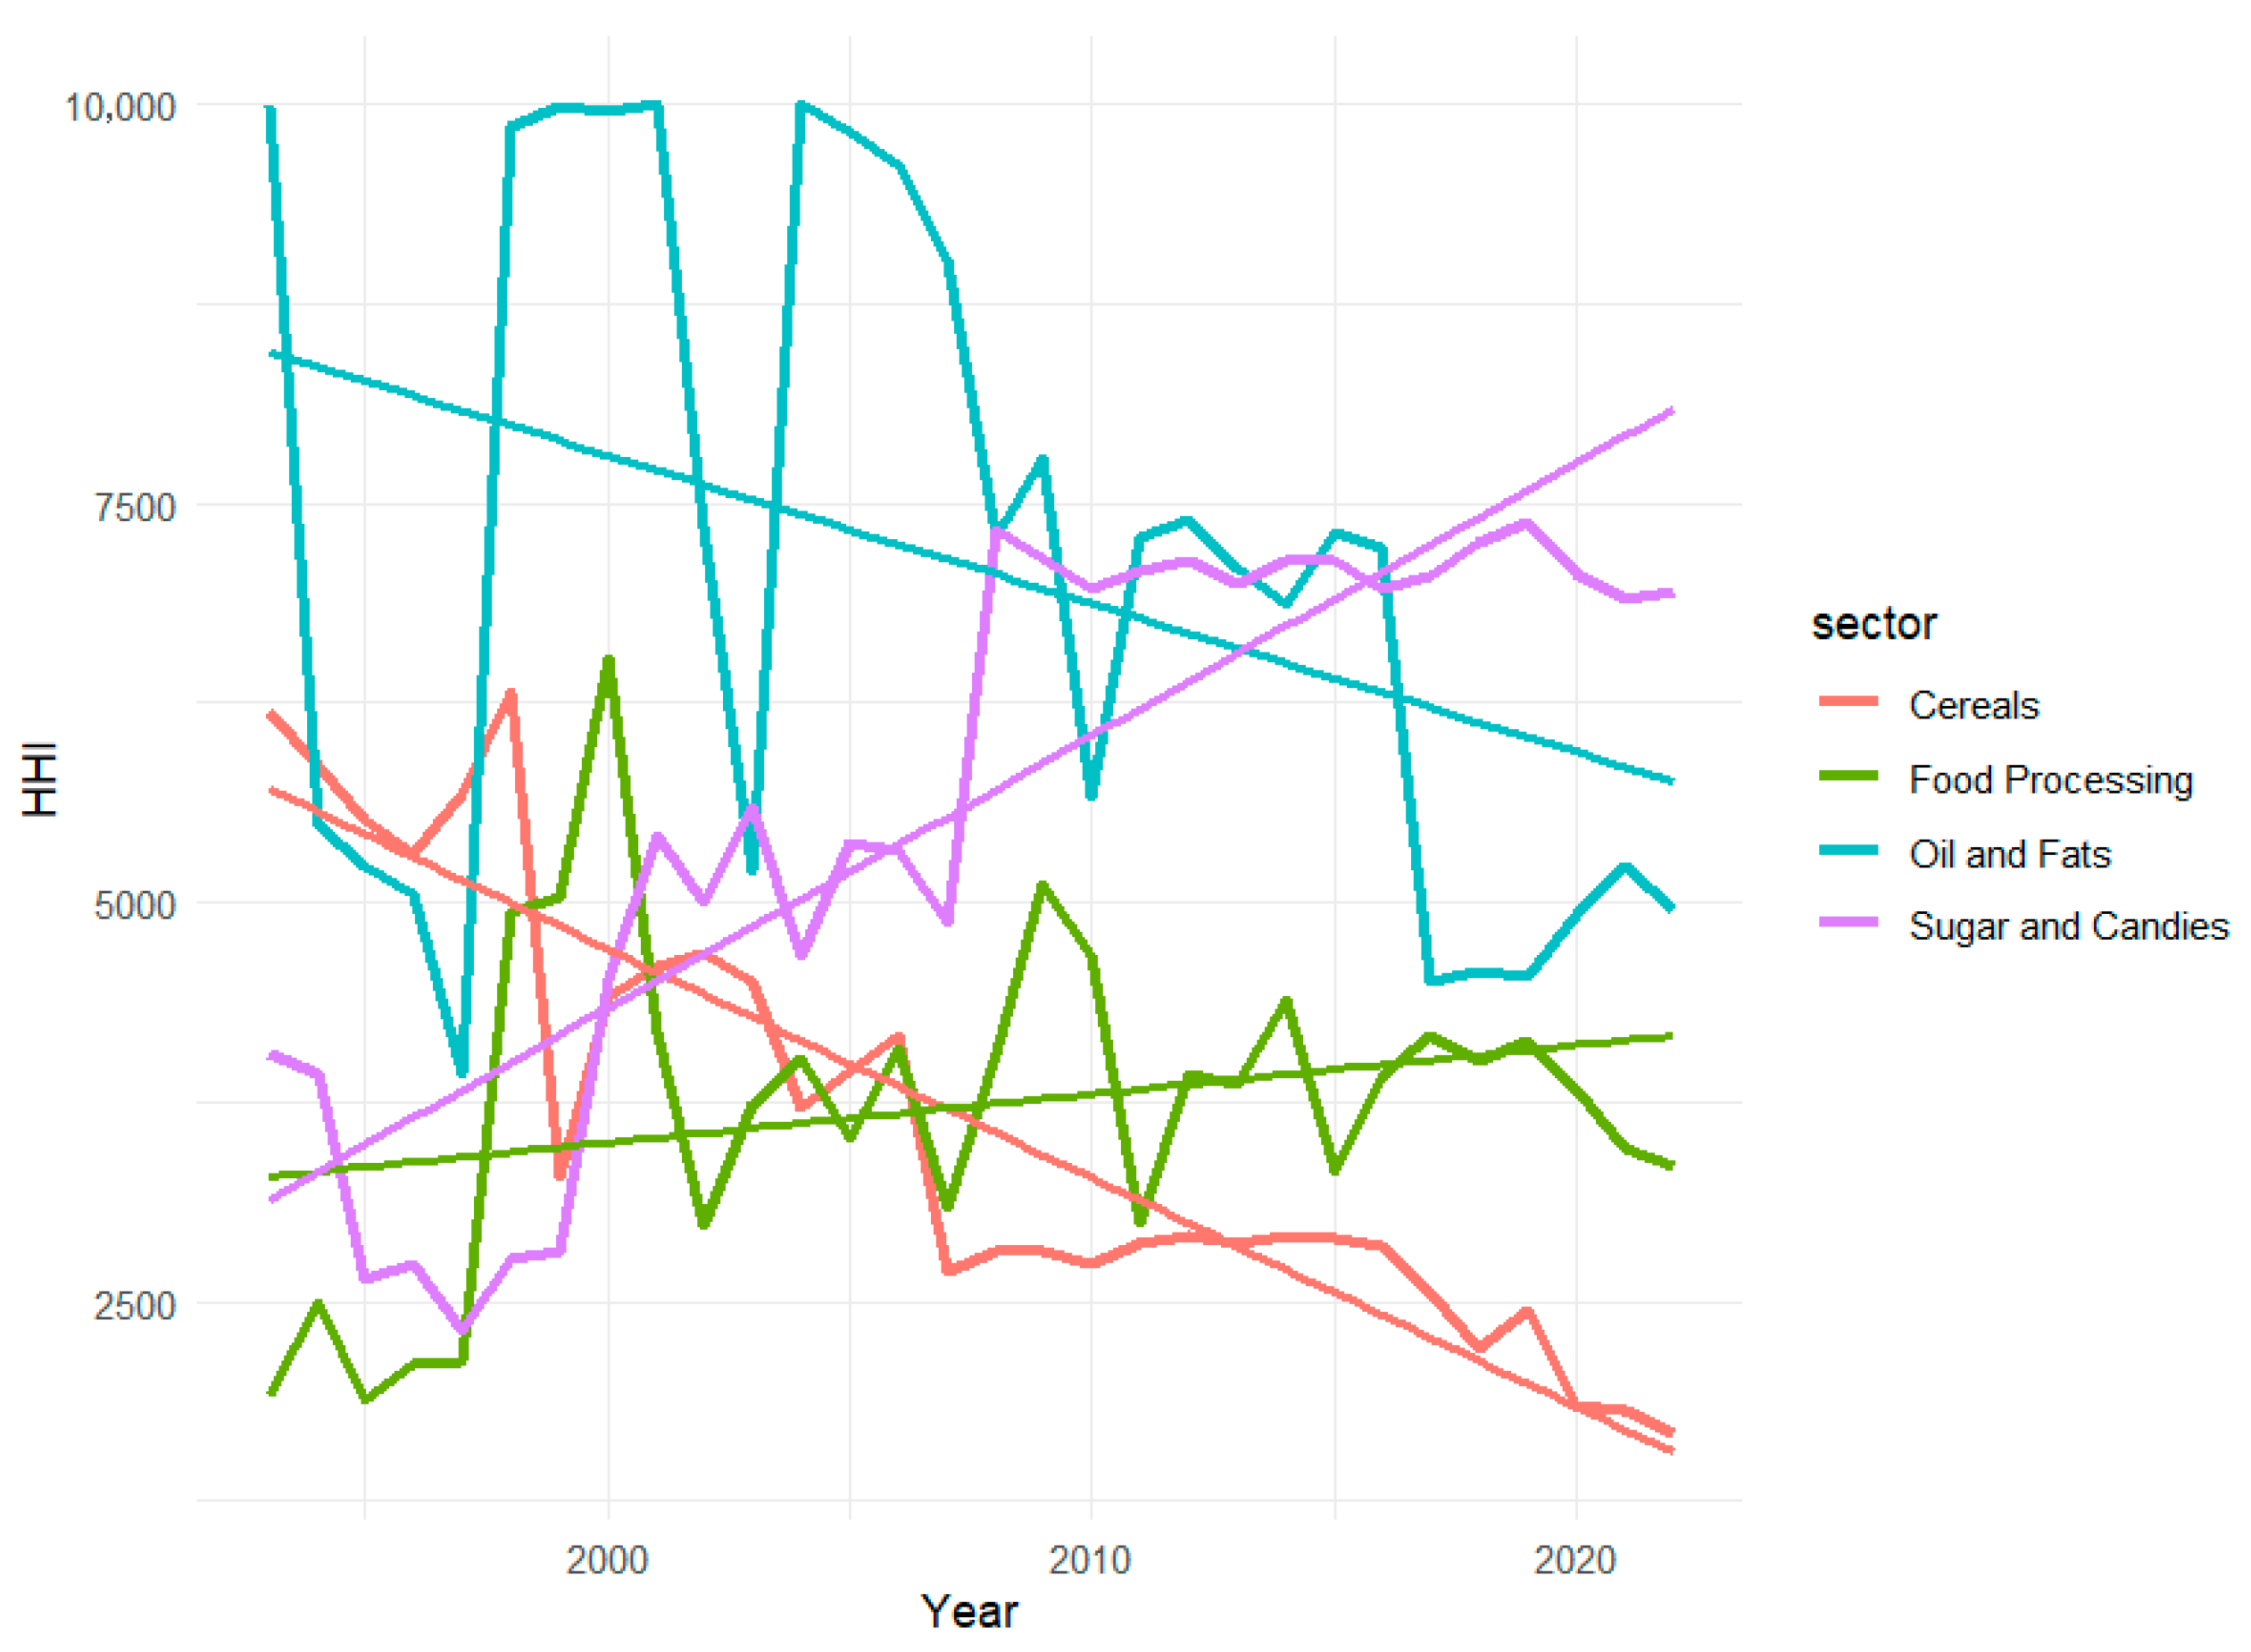
Panel B reports subsector-specific linear time trends, revealing substantial heterogeneity across subsectors. Cereals and oils and fats exhibit statistically significant negative trends, whereas sugar and confectionery show a strong positive and significant trend. In contrast, the coefficient for food processing is not statistically significant, suggesting no clear trend in that subsector.
All models are estimated using robust standard errors (HC1), and statistical significance is assessed at conventional levels.
As shown in
Figure 3, the overall trend is not statistically significant. This suggests that, on average, corporate concentration did not exhibit a systematic upward trajectory across the Hungarian food industry during the period under consideration.
However, the sector-specific estimates reveal notable heterogeneity. Concentration declined significantly in the cereals subsector and in oils and fats, whereas a statistically significant upward trend is observed in sugar and confectionery. The food processing subsector does not display a statistically meaningful linear trend.
These findings indicate that structural changes in market concentration have not followed a uniform pattern across the industry. Rather than experiencing a generalized increase in concentration, subsectors appear to have undergone differentiated consolidation dynamics.
Accordingly, Hypothesis 1 is not supported at the aggregate industry level but receives partial support in the case of sugar and confectionery, where concentration increased significantly over time.
4.4. Wage Structure and Earnings Trends
The figures presented in this section depict sector-level average gross monthly earnings. Each observation represents the average earnings within a given subsector and year over the period 1993–2022. The horizontal axis corresponds to calendar years, and the label “Year (CC)” has been simplified to “Year” for clarity. The plotted values are constructed using aggregated subsector-level data.
The analysis is based on a panel data framework, where subsectors (j) constitute the cross-sectional dimension and years (t) the time dimension. The models are estimated using fixed-effects panel regressions rather than simple OLS.
A trend analysis of gross monthly income over time shows non-linear and fluctuating patterns across all four sectors. Nominal earnings have remained broadly stable, but short-term fluctuations are frequent, indicating that income dynamics are heavily influenced by bonuses and irregular payments rather than by sustained wage growth. The absence of a clear upward trend in any of the sectors suggests that productivity gains or market consolidation have not translated into a sustained increase in the earnings of the workforce. Instead, wage volatility seems to be a defining characteristic of employment in these sectors, in line with a wage structure that favours flexibility over stability.
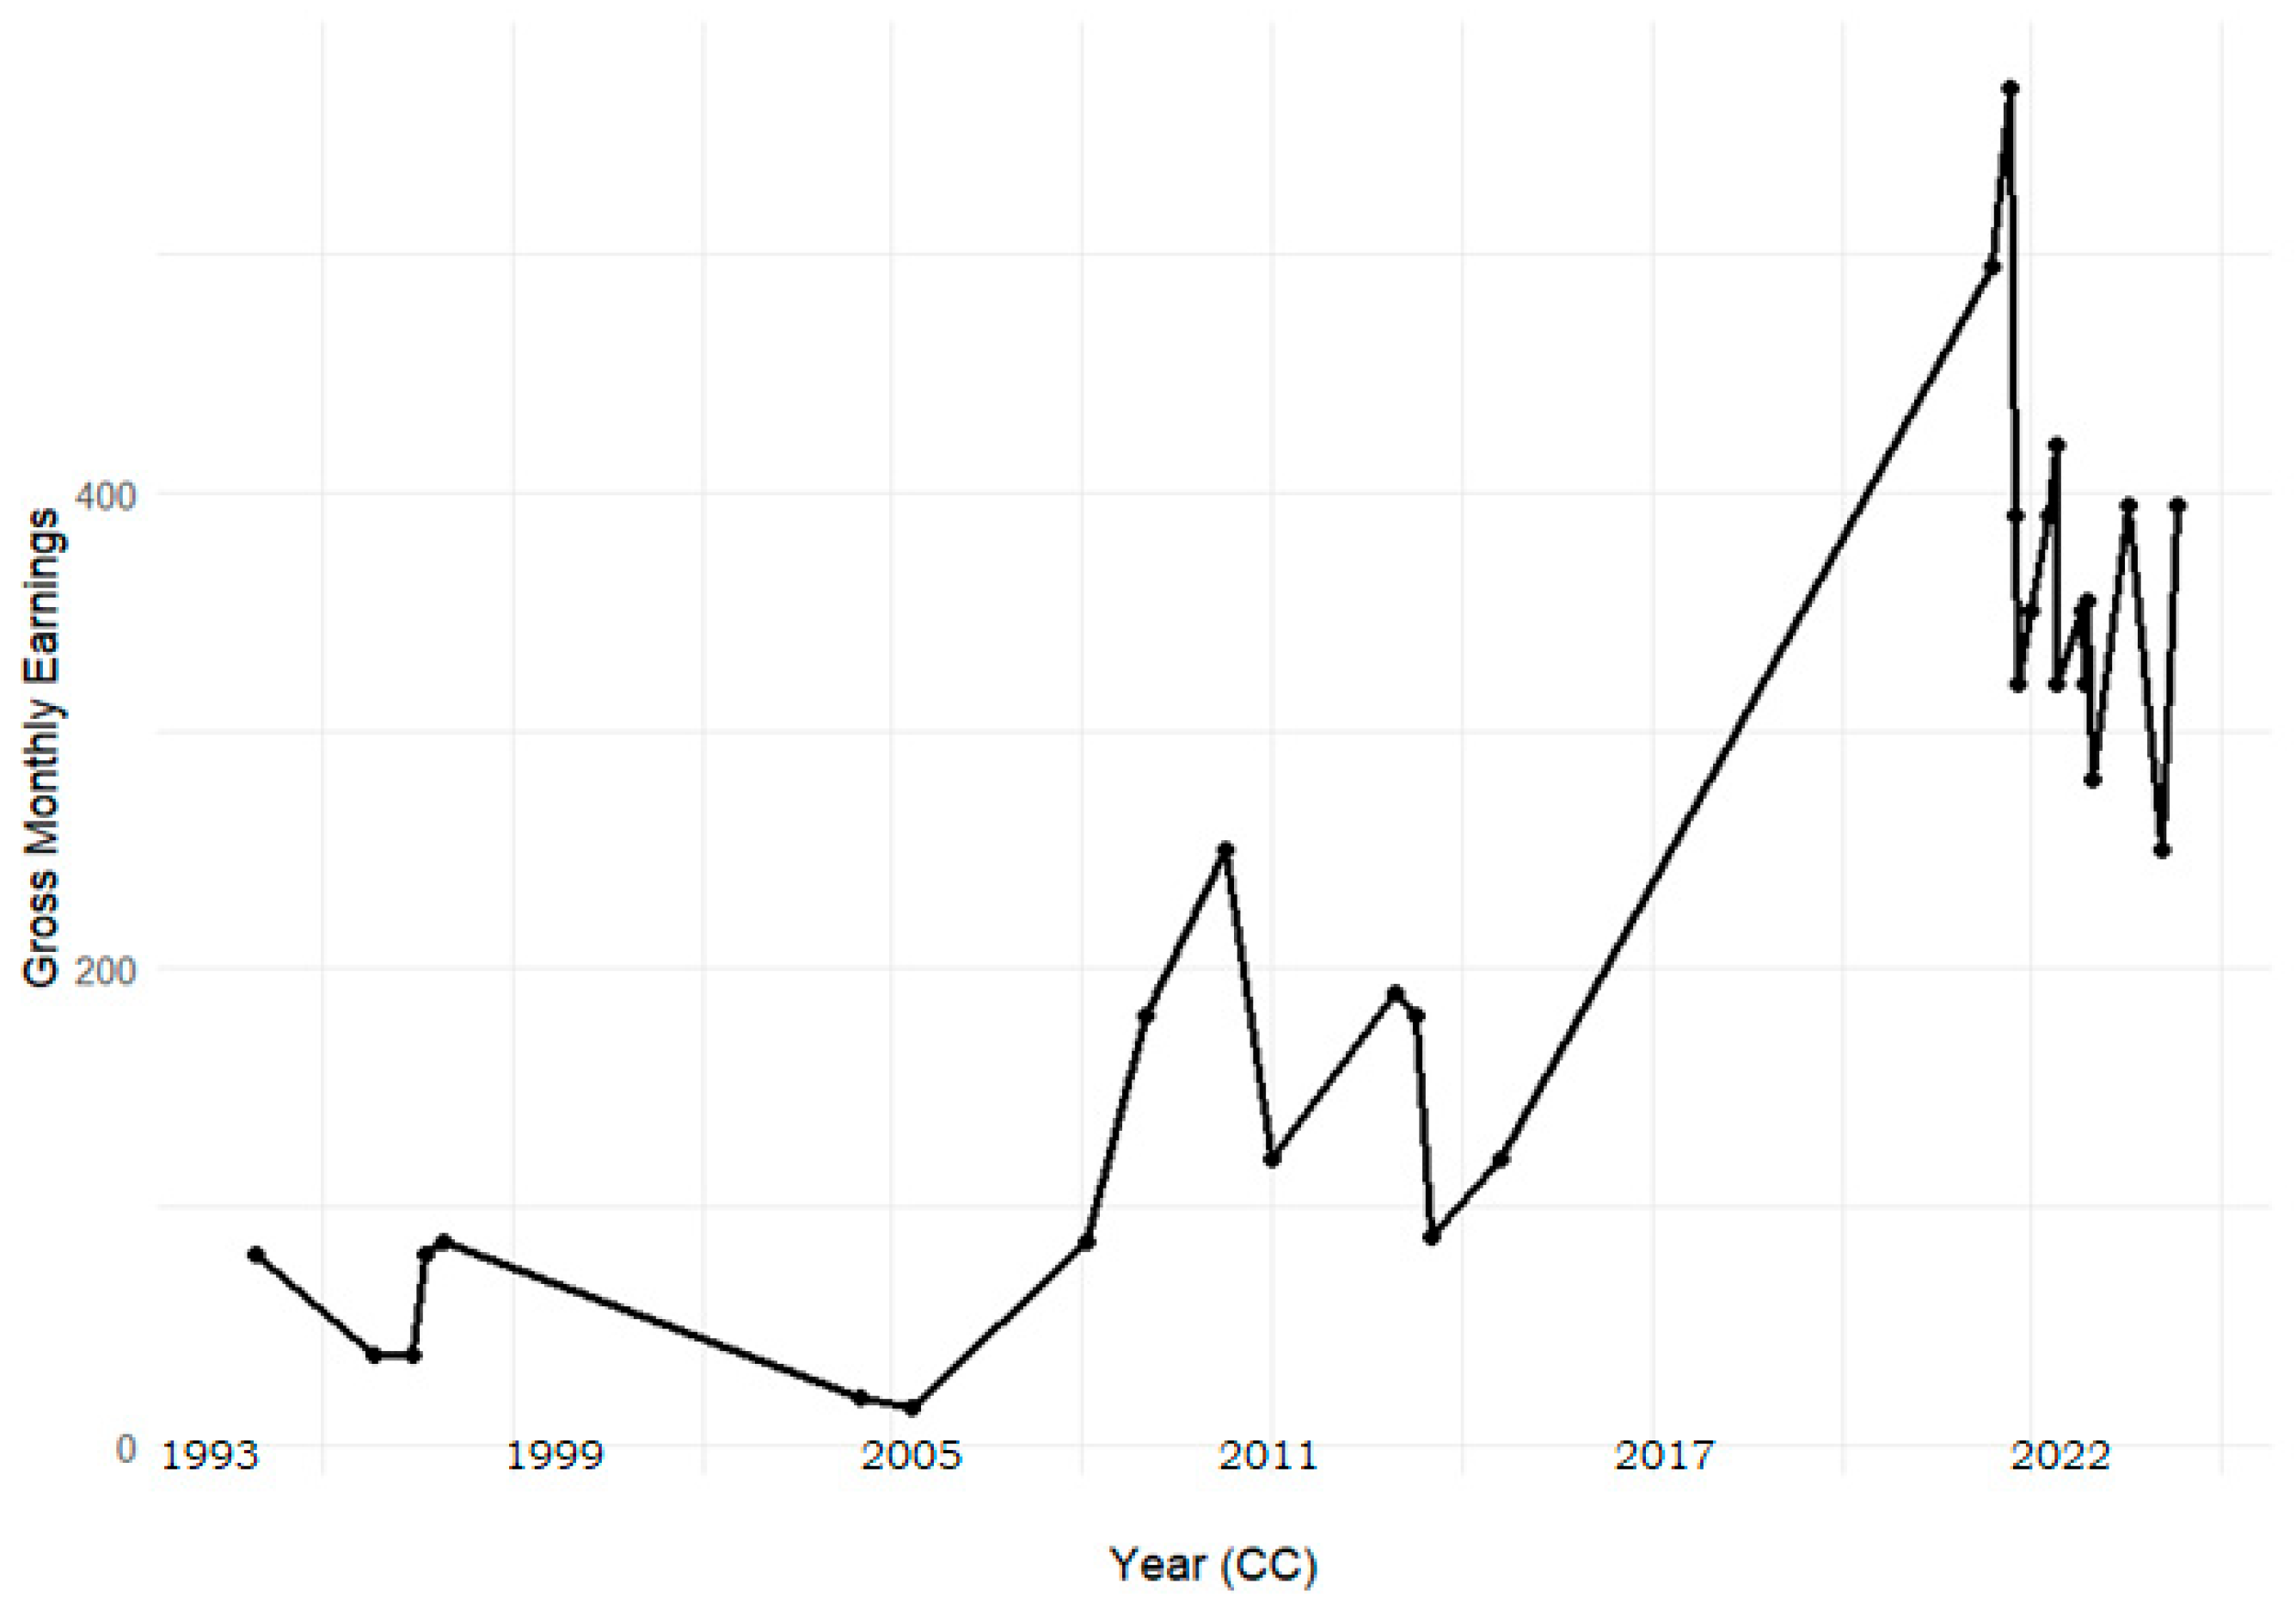
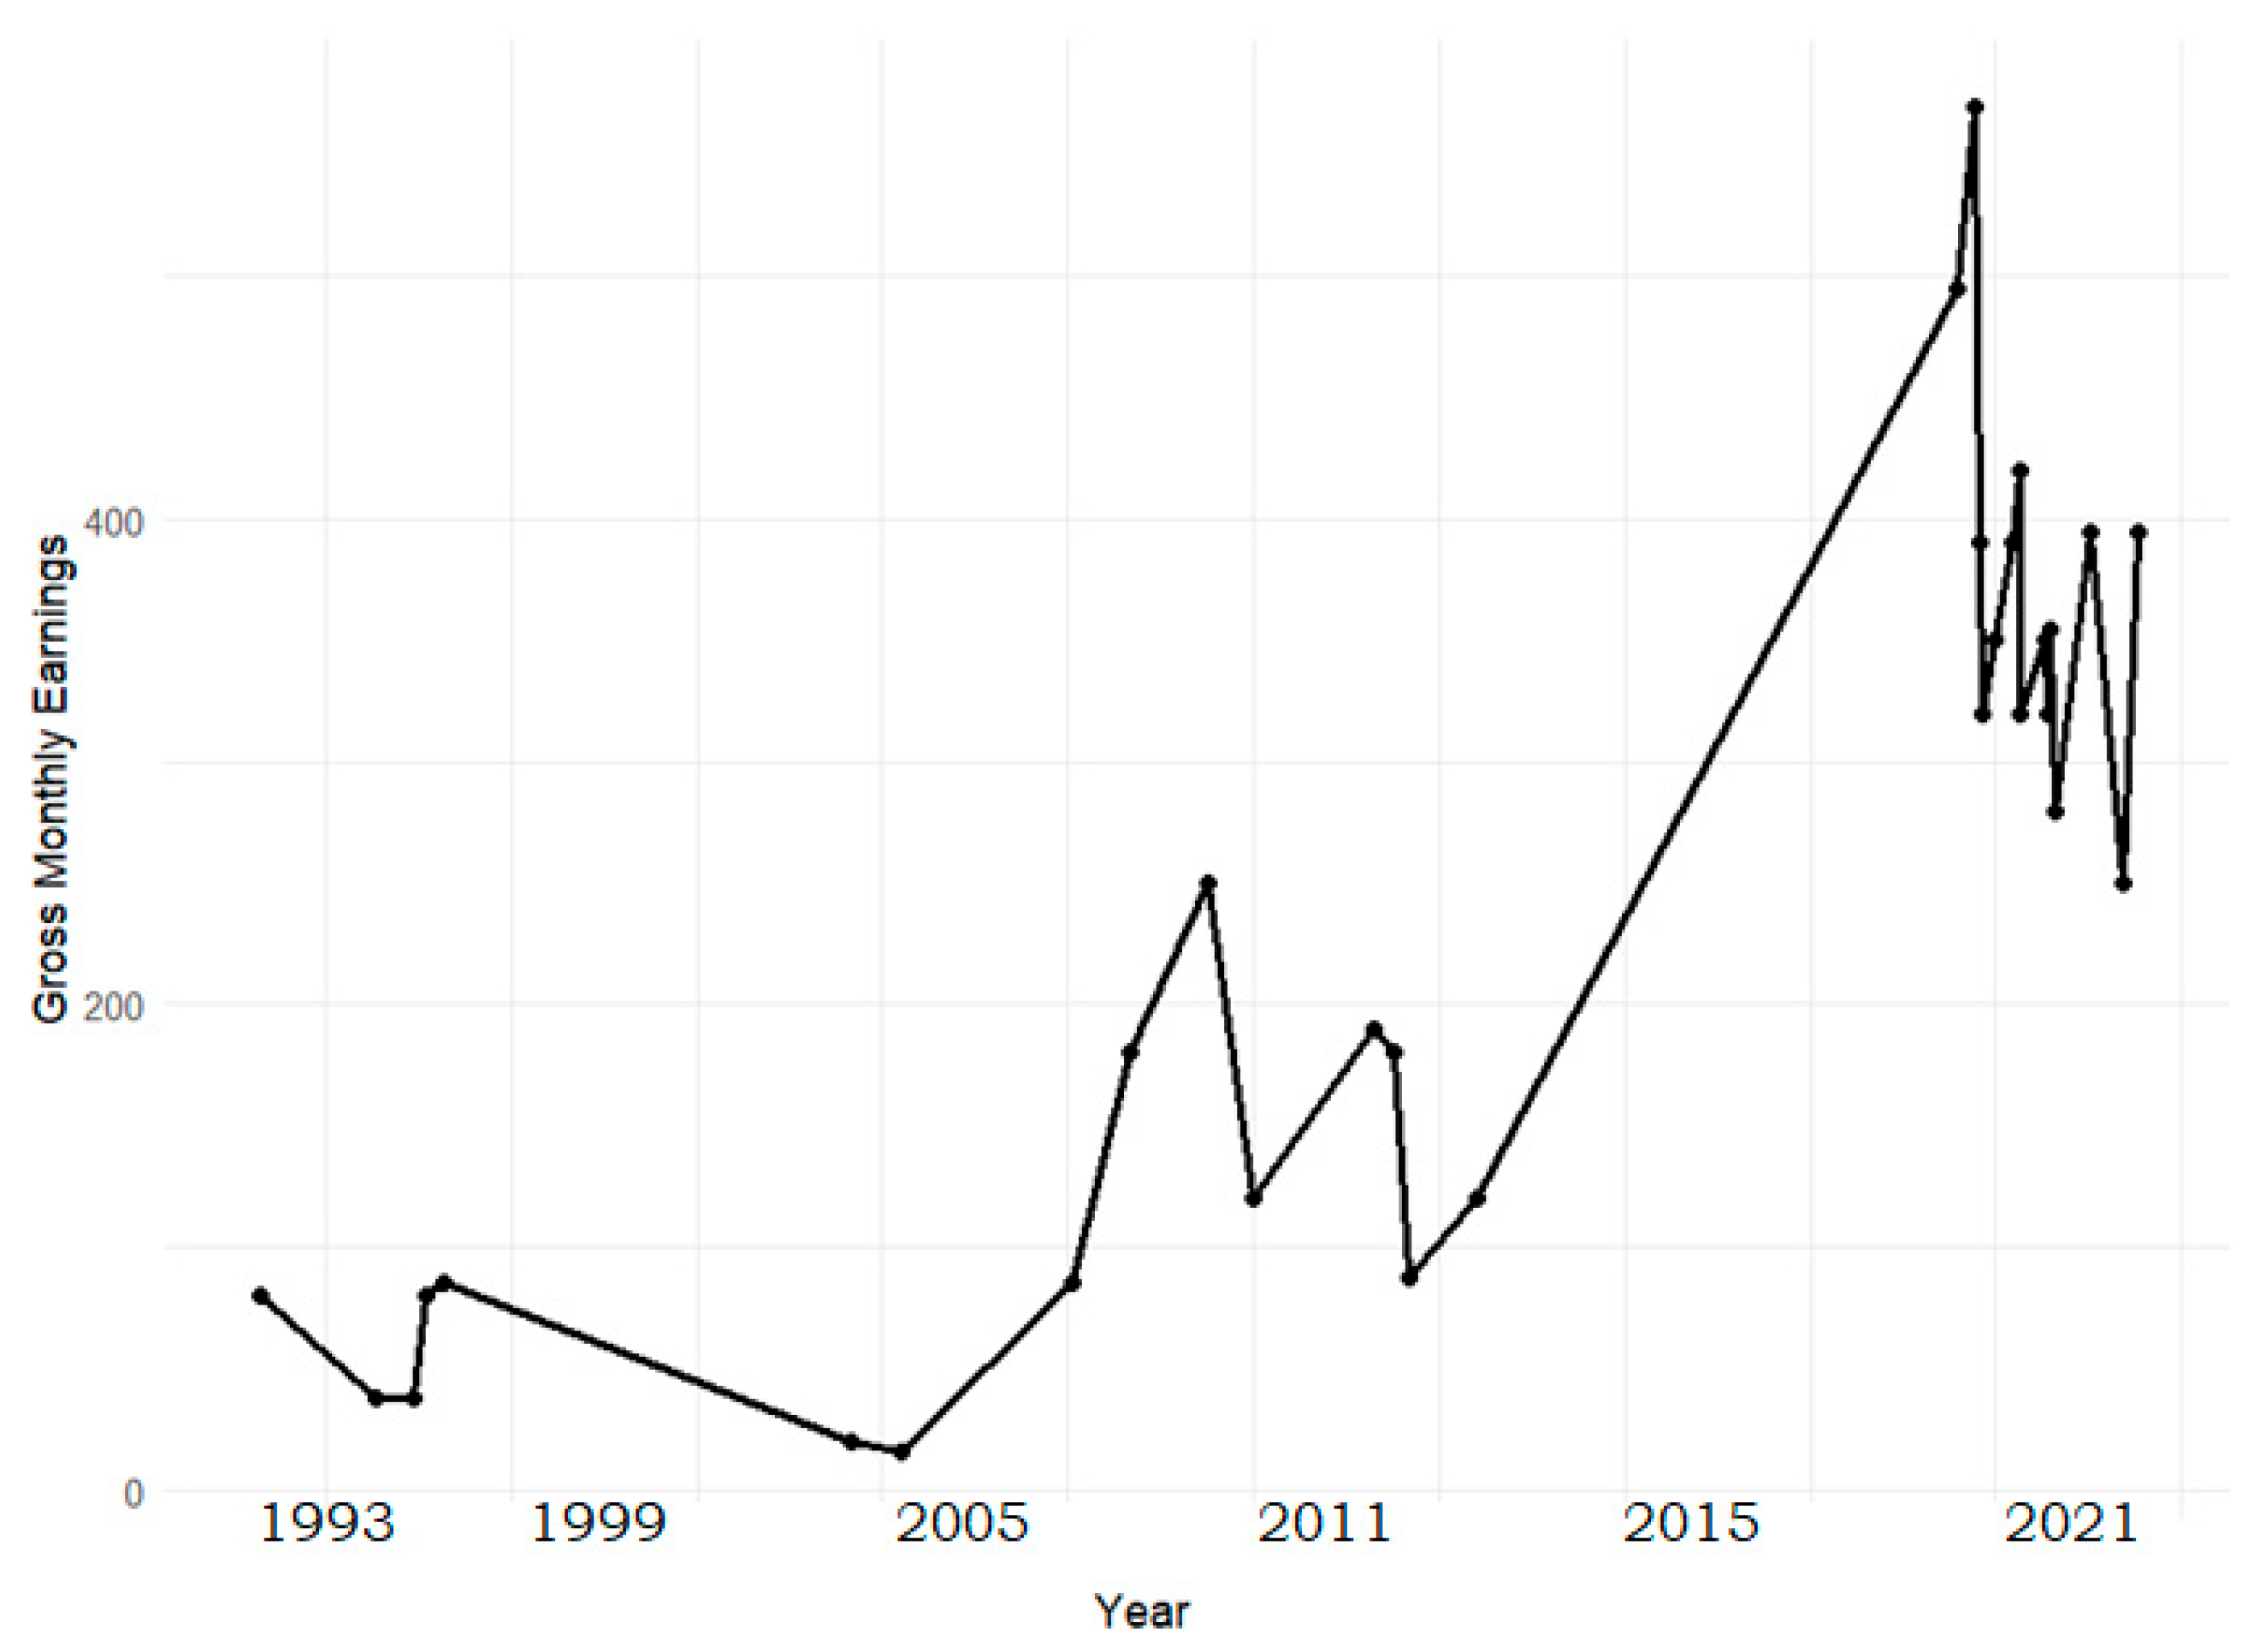
As shown in
Figure 4 the evolution of gross monthly earnings in the sugar and confectionery subsector exhibits a pronounced upward trend in the later years of the sample period, accompanied by substantial short-term fluctuations. While earnings increase markedly at certain points, the presence of sharp declines and volatility suggests that income dynamics in this subsector are highly sensitive to irregular payments and variable compensation components. This pattern is consistent with a compensation structure in which bonuses and supplementary payments play a significant role.
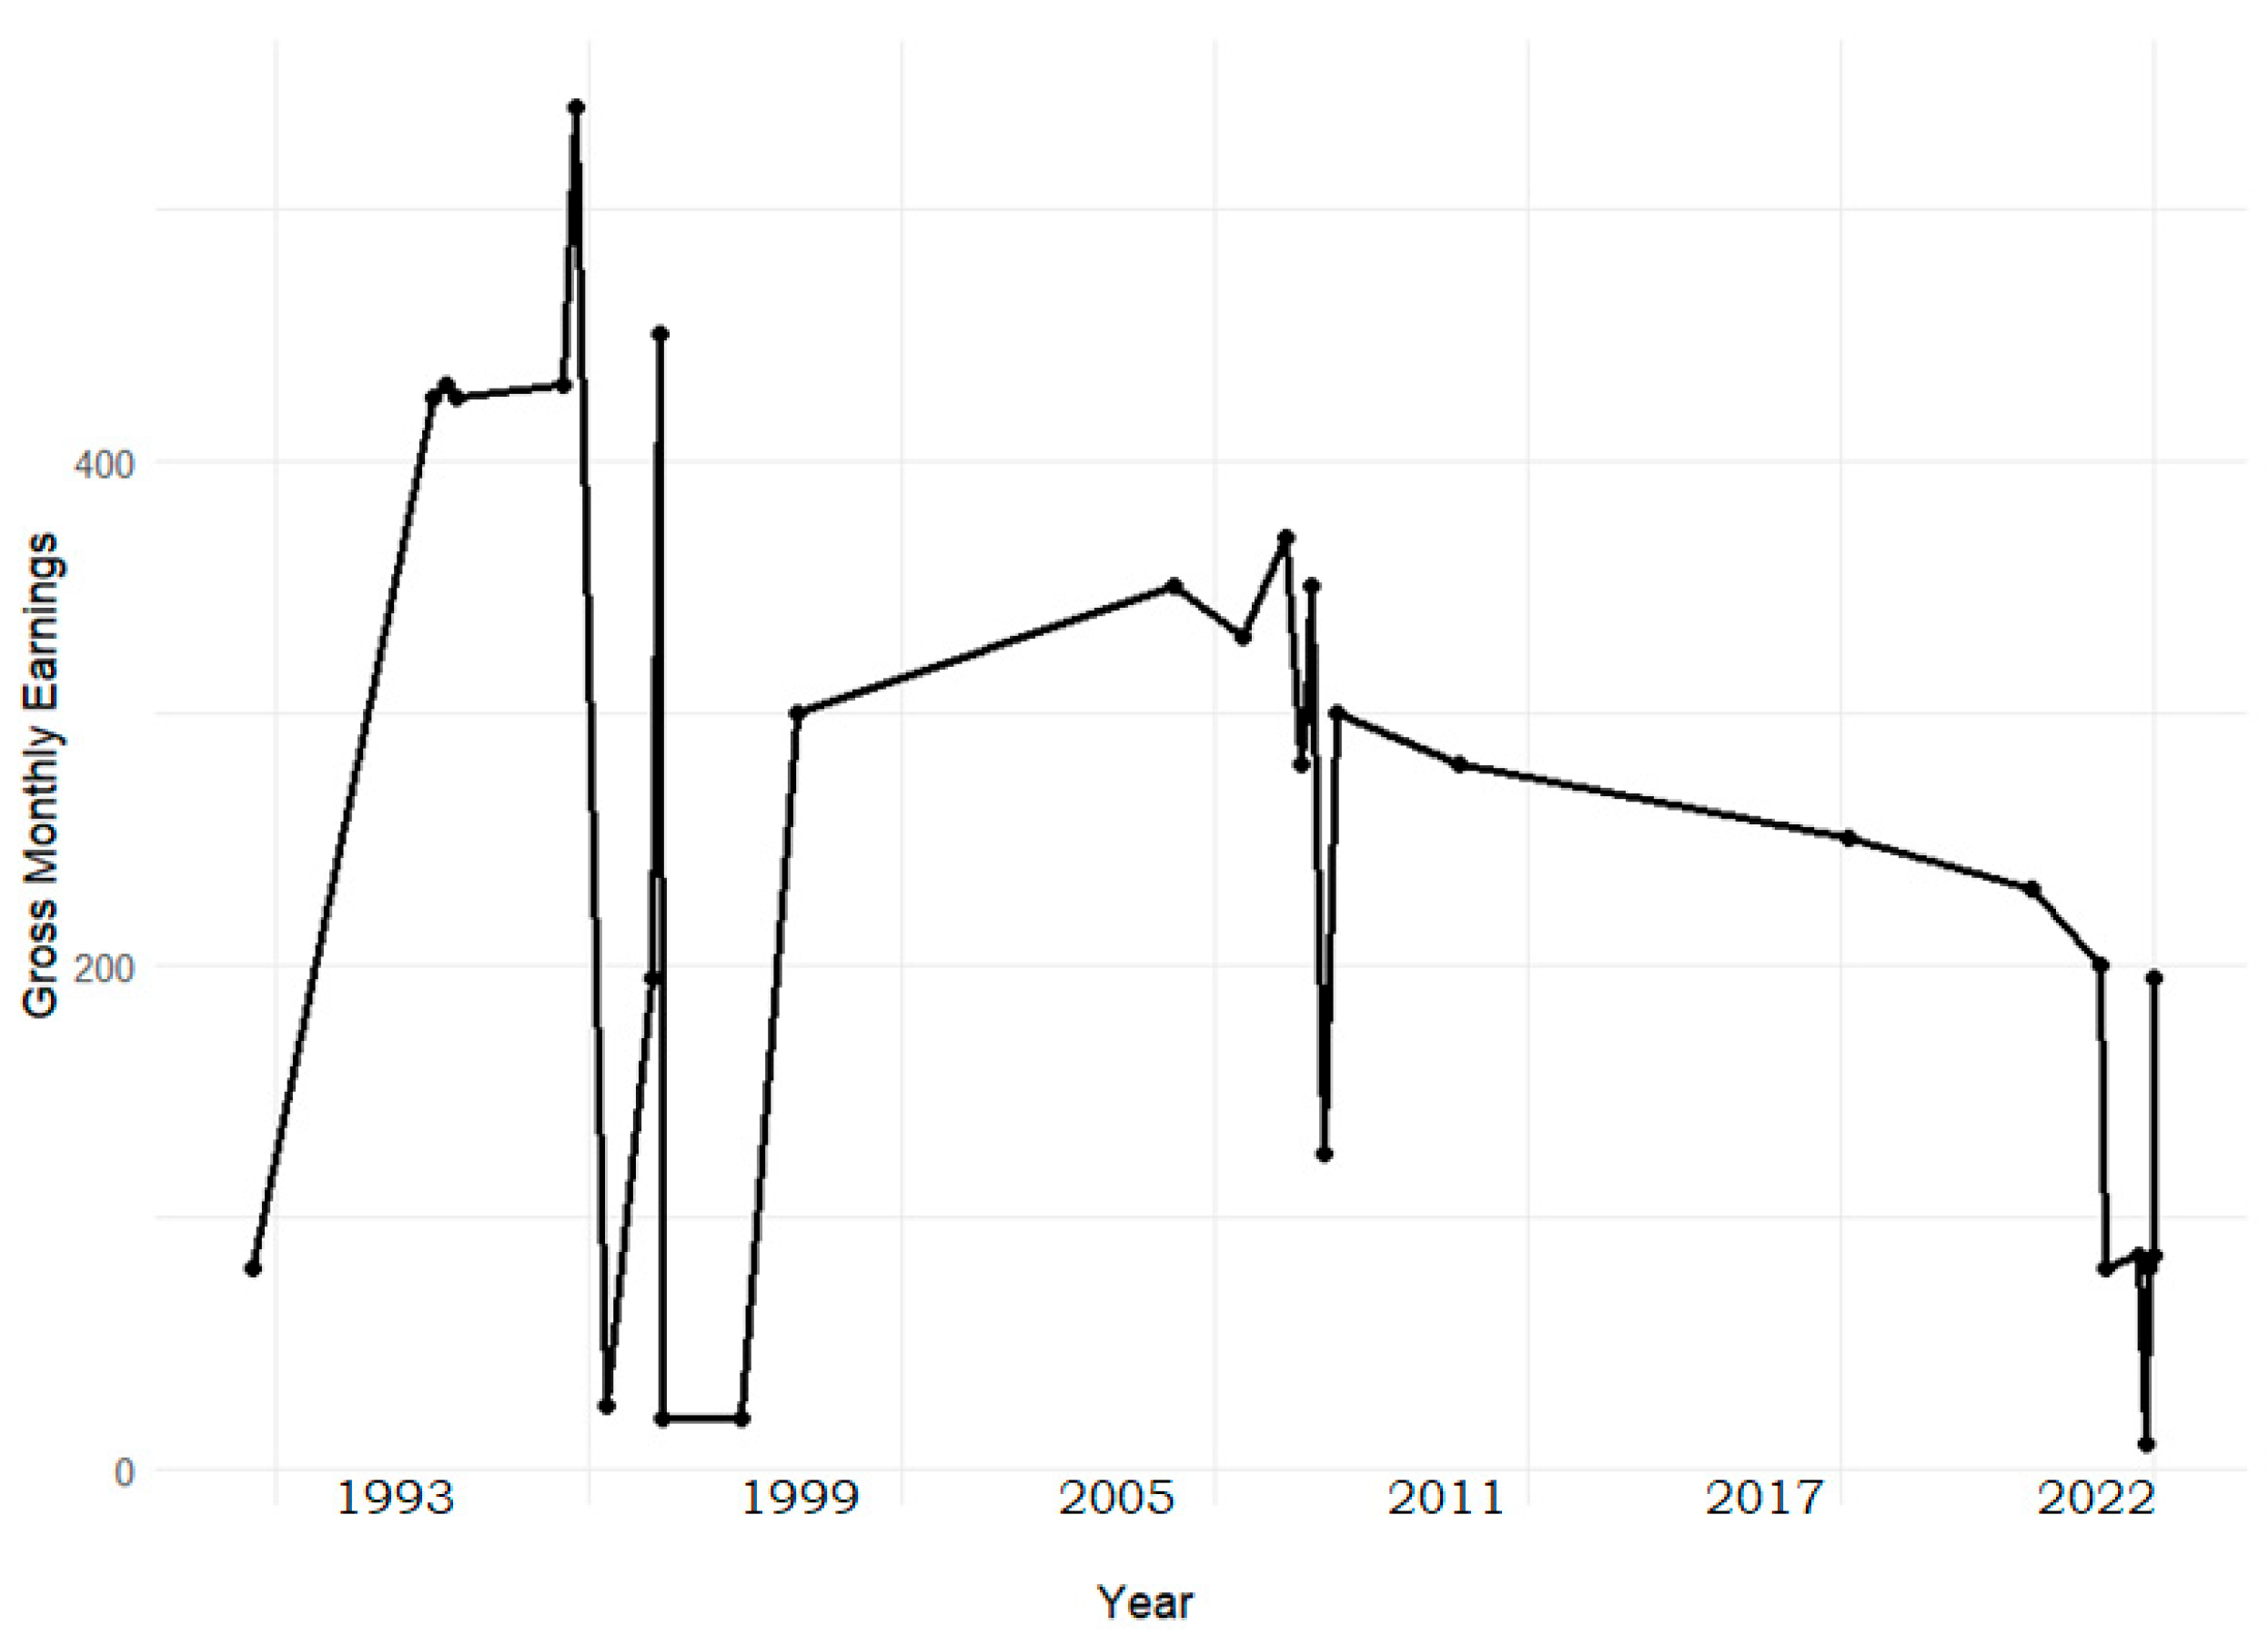
As shown in
Figure 5, earnings in the food processing subsector display considerable volatility over time, with no clear long-term trend. Periods of rapid increases are followed by abrupt declines, indicating substantial instability in income levels. This pattern suggests that earnings are influenced by cyclical or short-term factors rather than sustained wage growth, potentially reflecting fluctuations in working hours, bonuses, or firm-level performance.
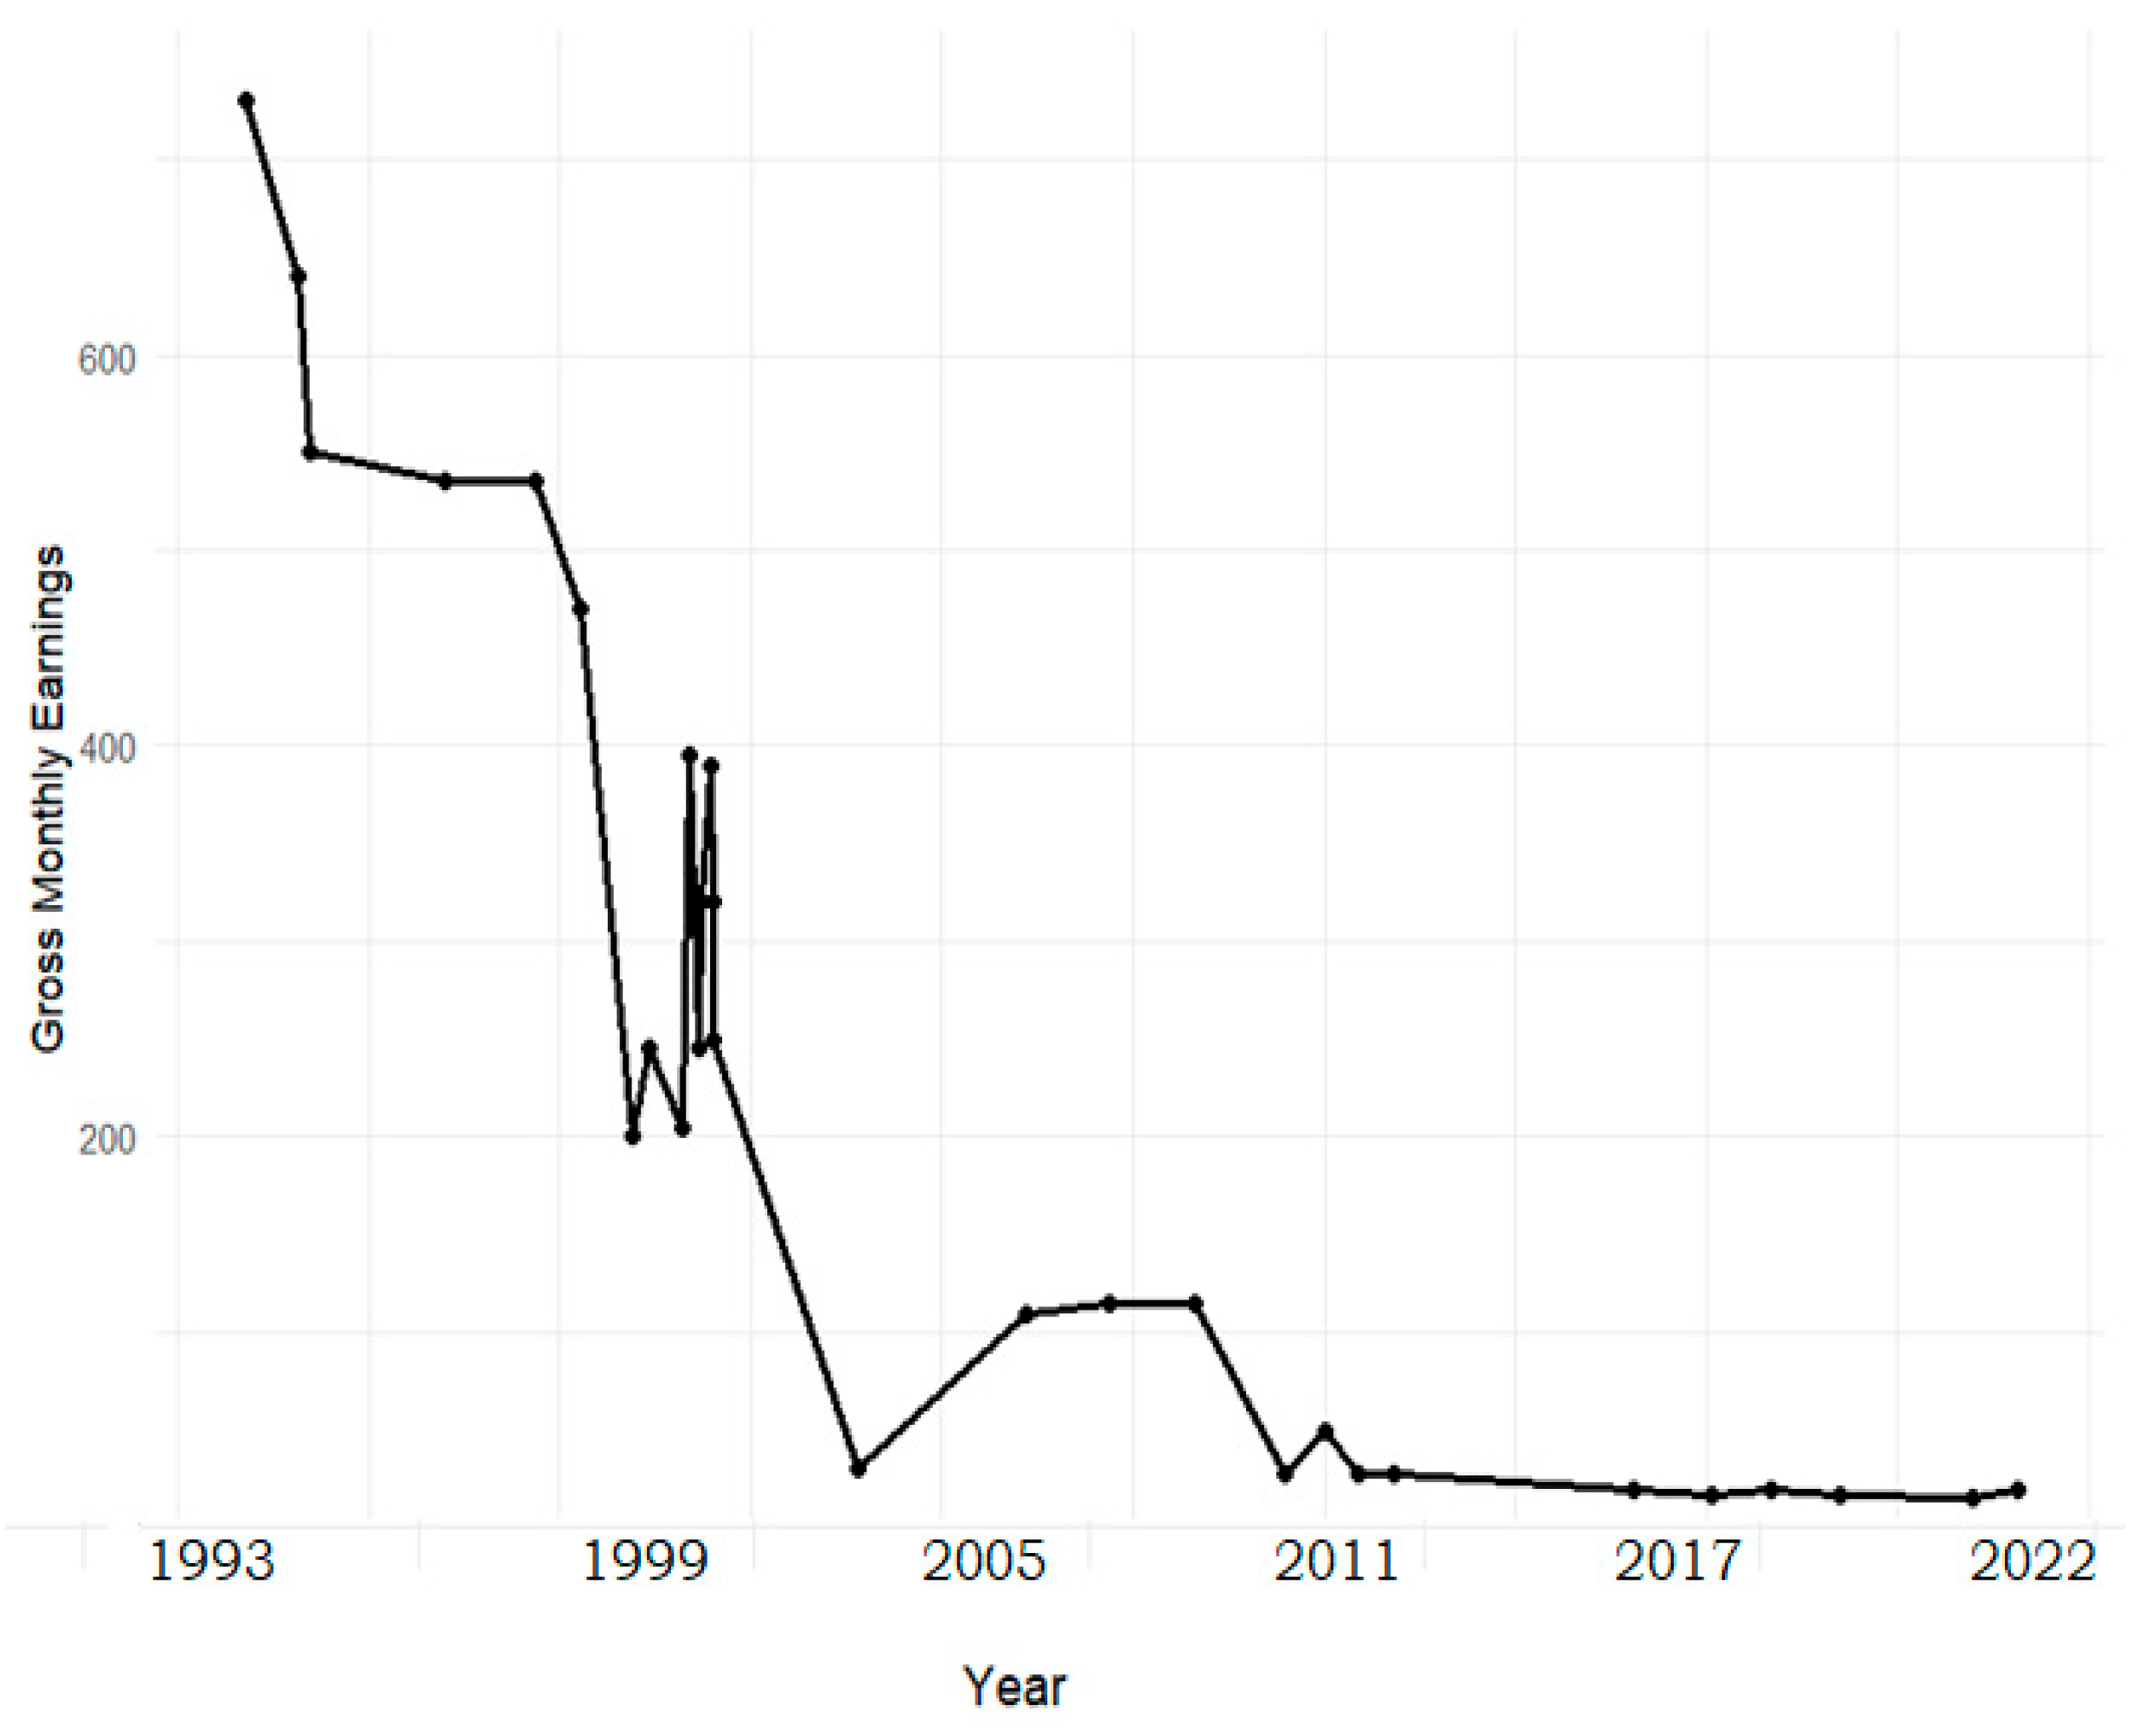
As shown in
Figure 6, The oils and fats subsector shows an initial period of relatively high earnings followed by a gradual decline over time, interspersed with episodes of sharp variation. Although earnings appear to stabilize at lower levels in later periods, the observed fluctuations indicate persistent heterogeneity in compensation. This may reflect structural changes in the subsector, including shifts in production, employment composition, or compensation practices.
The cereals and cereal products subsector is characterized by a clear downward trend in gross monthly earnings over the sample period. This decline is accompanied by periods of short-term variability, particularly in the earlier years. In later periods, earnings stabilize at relatively low levels, suggesting a compression of income and potentially reflecting changes in labour demand, productivity, or wage-setting mechanisms within the subsector.
As shown in
Figure 7, the trend analysis of gross monthly earnings reveals pronounced volatility and non-linear dynamics across all four subsectors. While the data are plotted in chronological order to reflect year-to-year variation, the observed patterns should not be interpreted as smooth or continuous trends. Instead, the figures highlight substantial short-term fluctuations, suggesting that earnings are primarily driven by variable compensation components such as bonuses and irregular payments, rather than sustained increases in base wages.
The absence of a consistent upward trajectory indicates that structural changes in the industry, including rising corporate concentration, have not translated into stable long-term wage growth. Rather, the evidence points to a compensation structure characterized by flexibility and adjustment mechanisms, where firms rely on performance-related pay and variable compensation to adapt to changing conditions.
To further examine the determinants of earnings, gross monthly income is regressed separately for each subsector on base hourly wages, regular bonuses, and non-regular bonuses. These specifications are estimated using ordinary least squares (OLS) models. This empirical approach provides insight into how different components of compensation contribute to overall earnings and reflects the wage and earnings dimension of the conceptual framework.
4.4.1. Sugar and Candies
In the sugar and candies sector, regular bonuses are the dominant determinant of earnings, while base wages play no statistically meaningful role. This indicates a compensation regime in which firms use bonuses to reward labour without committing to permanent wage increases. The negative effect of non-regular bonuses suggests income volatility, reflecting fluctuating workloads and irregular working hours (
Table 6).
The regression results indicate that regular bonuses are the primary determinant of gross monthly earnings in the sugar and candies industry. The coefficient implies that increases in regular bonuses translate almost one-to-one into higher monthly earnings. In contrast, the base hourly wage has no statistically significant effect, suggesting that wages are relatively rigid or play a limited role in determining total compensation.
The negative and statistically significant coefficient for non-regular bonuses suggests that reliance on irregular payments may introduce income instability, possibly reflecting fluctuating workloads or performance-based compensation. The exceptionally high R2 value indicates that earnings are almost entirely explained by the compensation structure, underscoring the dominance of firm-level pay policies.
4.4.2. Food Processing
Food processing shows a highly standardized compensation structure. Earnings are almost entirely dependent on regular bonuses, with basic salaries being statistically insignificant. This indicates strong coordination between employers and wage-setting power, which is typical of highly concentrated sectors. Workers’ earnings are therefore closely linked to company-defined bonus schemes rather than to wage increases negotiated by the employer. In the food processing sector, regular bonuses are by far the dominant factor in the formation of income, with a coefficient that exceeds unity. This result suggests that companies rely heavily on structured bonus schemes to reward employees, which may be linked to output targets or the company’s profitability. Neither basic salaries nor irregular bonuses have a significant impact on earnings, which indicates a highly standardized compensation system. This structure is consistent with concentrated industries where firms exercise strong control over wage setting and restrict the bargaining power of workers (
Table 7).
4.4.3. Oils and Fats
The oil and fats sector shows a negative correlation between basic wages and profits, which points to a substitution effect. Higher wages are compensated by lower bonuses and working hours, indicating that firms are tightly controlling total labor costs. This model is in line with increased workload and flexible scheduling, which reinforces the role of company concentration in changing working time patterns. A characteristic feature of this sector is a negative and significant coefficient for basic hourly wages. This indicates a substitution effect, whereby the increase in hourly wages is offset by a reduction in the premium or working time. This model reflects the strong control exercised by the employer over the overall cost of labour and supports the emphasis of the conceptual model on work intensity and flexibility. Regular bonuses remain strongly positive and substantial, reinforcing the centrality of the variable remuneration mechanism (
Table 8).
4.4.4. Cereals
Unlike in other subsectors, the basic wage in the cereals sector remains a major determinant of earnings, which suggests that there is some wage protection, possibly due to stronger regulation or to historical collective bargaining institutions. However, the continued negative impact of irregular bonuses points to continued income volatility and uneven working hours. Unlike in other sectors, the cereal sector has a significant impact on earnings in the form of both basic salaries and periodic bonuses. This suggests relatively stronger wage-setting mechanisms, possibly as a result of regulatory supervision or partial unionization. However, the negative impact of irregular bonuses again highlights income volatility.
4.5. Corporate Concentration and Wage Outcomes (H2)
To evaluate Hypothesis 2, two-way fixed-effects panel regressions are estimated, controlling for both sector and year effects. This specification accounts for time-invariant sectoral heterogeneity and common macroeconomic shocks across periods.
Table 9 reports the estimated association between the Herfindahl–Hirschman Index (HHI) and wage-related outcomes.
The results indicate a statistically significant negative association between corporate concentration and both base hourly wages and gross monthly earnings. The estimated coefficients suggest that higher levels of concentration are correlated with lower wage outcomes, even after controlling for sector-specific and time-specific fixed effects.
Given the log-linear specification, the magnitude of the coefficient implies that a 1000-point increase in HHI is associated with approximately a 10.6 percent decrease in base wages. A similar negative relationship is observed for gross monthly earnings.
While these findings are consistent with theoretical models of labour market concentration, they should be interpreted as conditional associations rather than definitive causal effects. The results suggest that higher concentration levels coincide with weaker wage performance across subsectors.
Accordingly, Hypothesis 2 receives empirical support in terms of the observed negative relationship between corporate concentration and wage outcomes.
4.6. Corporate Concentration and Non-Wage Working Conditions (H3)
Hypothesis 3 examines whether higher levels of corporate concentration are associated with changes in non-wage working conditions. To test this hypothesis, panel regressions are estimated using overtime hours and paid holidays as dependent variables, with the Herfindahl–Hirschman Index (HHI) as the key explanatory variable.
The results indicate a statistically significant positive association between concentration and overtime hours. The estimated coefficient suggests that higher levels of HHI are correlated with increased labour utilisation within subsectors.
In contrast, a statistically significant negative relationship is observed between concentration and paid holidays. This finding implies that higher concentration levels are associated with fewer days of paid leave.
Taken together, the results suggest that greater corporate concentration coincides with changes in non-wage dimensions of employment. While the estimates do not establish causality, they are consistent with the hypothesis that labour conditions vary systematically with market concentration levels.
Accordingly, Hypothesis 3 receives empirical support in terms of the observed associations between concentration, overtime intensity, and paid leave provision.
4.7. Corporate Concentration and Part-Time Employment (H4)
Hypothesis 4 evaluates whether higher levels of corporate concentration are associated with changes in non-standard employment arrangements, measured as the share of part-time employees within each subsector. A two-way fixed-effects panel regression model is estimated, controlling for sector and year effects.
The results indicate a statistically significant positive association between corporate concentration and the share of part-time employment. The estimated coefficient suggests that higher HHI levels are correlated with a greater prevalence of part-time work across subsectors. While the magnitude of the coefficient is modest in absolute terms, the relationship remains statistically robust. These findings suggest that variations in market concentration coincide with observable differences in employment structure.
It is important to note that the regression identifies conditional associations rather than causal effects. Nevertheless, the direction and statistical significance of the estimates provide empirical support for Hypothesis 4. However, part-time employment is also considered as a potential channel through which corporate concentration may affect broader labour market outcomes, a mechanism that is further explored in the combined specification.
4.8. Descriptive Analysis of Earnings Composition (Base Wage vs. Bonuses)
Descriptive statistics reveal a highly unequal and structurally unbalanced composition of income in the Hungarian food industry, with a clear distinction between fixed remuneration (basic hourly wage) and variable remuneration (regular and irregular bonuses).
4.8.1. Base Hourly Wages (Fixed Component)
Basic hourly wages are the most stable component of earnings, with a mean of around 3.59 and a median of 3.62, suggesting a relatively symmetric distribution around the centre of the trend. However, the wide range—from 0.92 to 30.00—indicates considerable diversity between sub-sectors and time periods. Despite these differences, the basic wage seems relatively depressed compared to other income components. The small difference between the mean and median indicates a limited skewness, which means that the majority of observations are clustered in a narrow range. This supports the view that wages are institutionally capped and less responsive to market fluctuations, which is probably reflected in formal wage-setting mechanisms or sectoral agreements. Graphical evidence supports this interpretation: the basic wage shows only slight and irregular changes over time, with no clear upward trend. This indicates that wage growth was structurally limited, even in the context of changing market conditions.
4.8.2. Regular Bonuses (Predictable Variable Pay)
Periodic bonuses, defined as regular and predictable payments, show a higher degree of variation than basic salaries. With an average of about 197.9 and a median of 167.5, the distribution is slightly skewed to the right, suggesting that higher bonuses are found in certain sectors or periods. This range—between 15.07 and 575.00—shows that regular bonuses can be a significant contributor to earnings, although their presence is not uniform across the data set, as evidenced by the high number of missing observations. Compared to base salaries, regular bonuses show more pronounced fluctuations over time, indicating that they are used by companies as a flexible adjustment mechanism. However, their relatively structured nature means that they are still partly embedded in formal pay schemes, such as performance-based incentive schemes and contractual bonuses.
4.8.3. Non-Regular Bonuses (Irregular and Discretionary Pay)
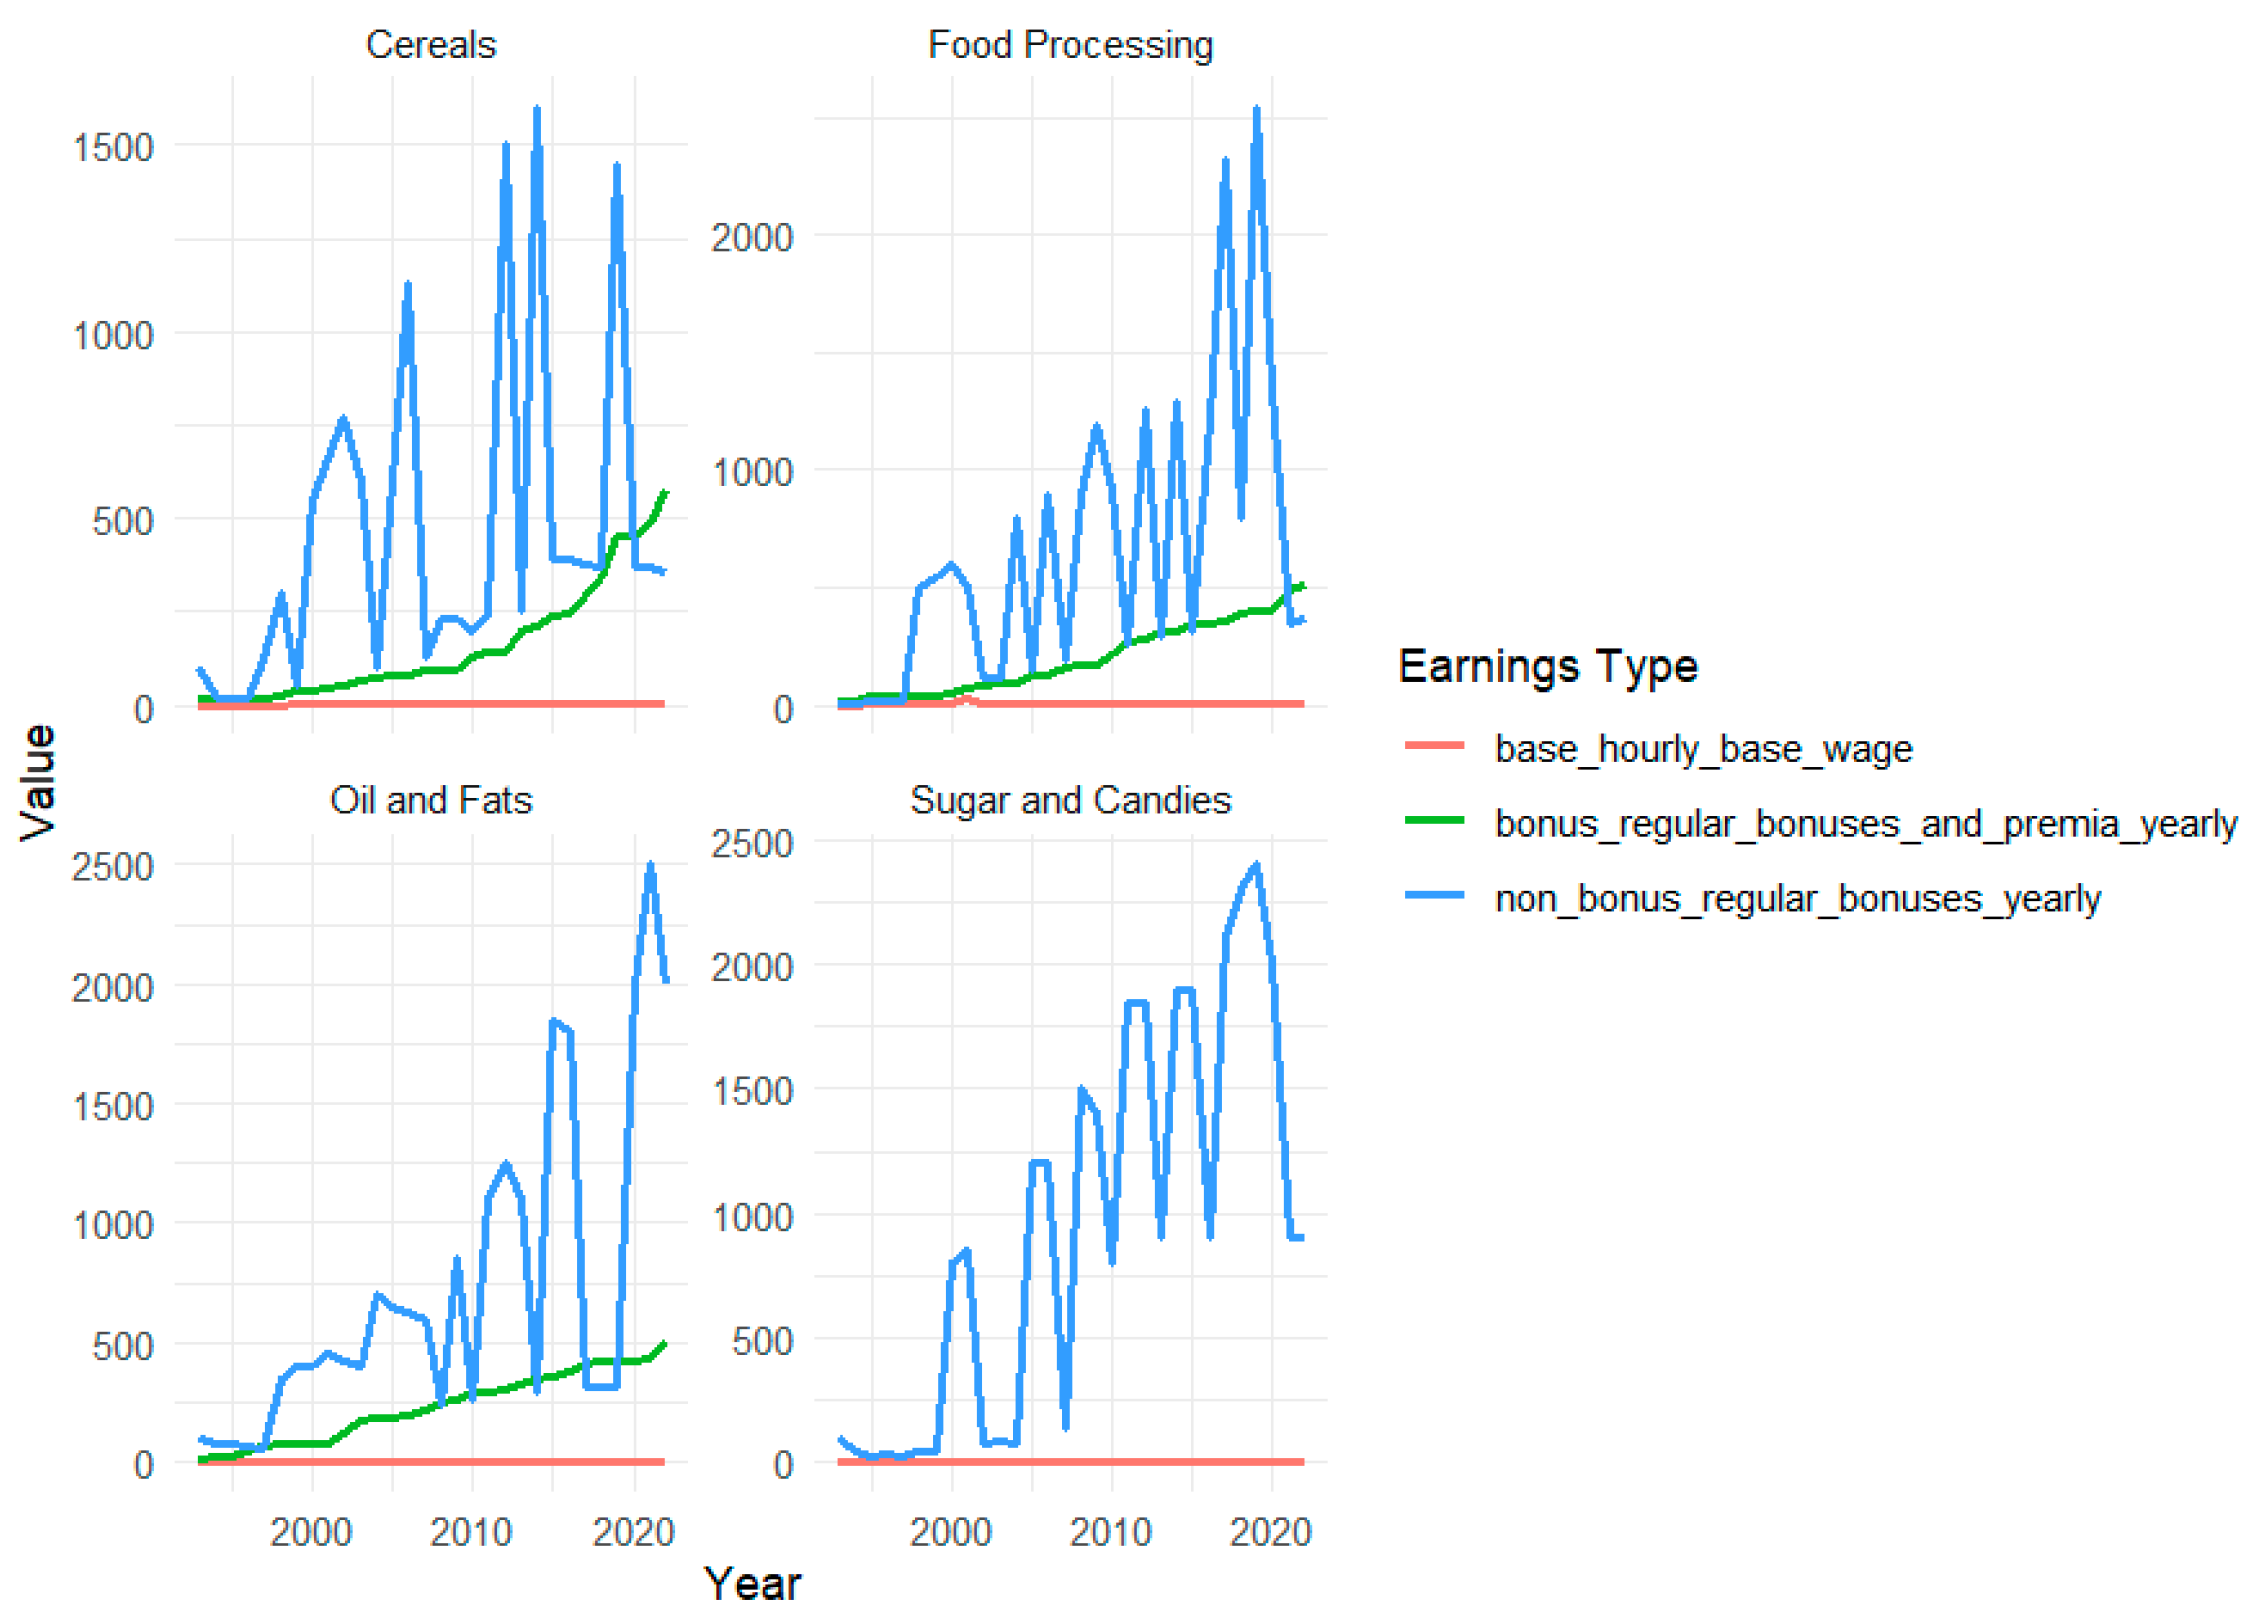
As shown in
Figure 8, non-regular bonuses are the most variable and predominant component of variable remuneration. With an average of approximately 693.6 and a median of 400.0, this category shows a highly skewed distribution, with extreme values as high as 2540.0. The large gap between the median and the maximum level indicates the existence of significant outliers, which reflect irregular and discretionary payments that may significantly increase earnings in some years or sectors. This high variation underlines the unpredictable nature of irregular bonuses, which are not bound by fixed timetables or formal agreements. The graphical trends show sharp fluctuations over time, confirming that irregular bonuses are highly sensitive to decisions made at the firm level and to market conditions. This suggests that companies are increasingly relying on discretionary payments to adjust labour costs rather than on changes in basic salaries.
4.9. Combined Model and Mediation Effects
Before presenting the combined specification, it is important to clarify the modelling strategy. The baseline models reported in
Table 10,
Table 11 and
Table 12 are intentionally estimated separately to capture the total (reduced-form) association between corporate concentration and each labour market outcome. Estimating a fully combined model including all variables simultaneously may introduce a “bad control” problem, as several working-condition variables (e.g., overtime, part-time employment, and supplementary compensation) are themselves outcomes of corporate concentration and therefore lie on the causal pathway. Conditioning on these variables would absorb part of the effect of concentration and potentially bias the estimated coefficient downward.
To further examine the relationship between corporate concentration and earnings, an extended two-way fixed-effects specification is estimated in which working condition variables are included alongside the Herfindahl–Hirschman Index (HHI). This approach allows for an assessment of whether the association between concentration and earnings remains statistically significant after accounting for overtime, part-time employment, and supplementary compensation components.
The results indicate that once working condition variables are incorporated into the model, the coefficient on HHI becomes statistically insignificant. The loss of statistical significance of the HHI coefficient in the combined model should therefore not be interpreted as evidence against the existence of an effect. Rather, it suggests that the relationship between corporate concentration and earnings operates indirectly through adjustments in working-time arrangements and employment structure. This result is consistent with a mediation mechanism, where concentration affects intermediate labour market variables, which in turn shape overall earnings. Accordingly, the combined specification is used as a complementary analysis to explore potential channels, rather than as a substitute for the baseline models.
In contrast, supplementary compensation remains positively and significantly associated with gross monthly earnings. These findings suggest that the previously observed association between concentration and earnings may reflect the role of compensation structure and employment characteristics. However, given the observational nature of the analysis, the estimates should be interpreted as conditional associations rather than evidence of a formal causal mediation mechanism.
Overall, the combined specification underscores the importance of compensation composition in explaining earnings variation across subsectors. While concentration exhibits a statistically significant association with wages in baseline models, this relationship appears sensitive to the inclusion of employment structure variables.
Overall, the empirical findings indicate that corporate concentration has not followed a uniform upward trajectory across subsectors. The results reveal statistically significant associations between concentration and wage outcomes, as well as systematic relationships with non-wage working conditions and part-time employment.
The relatively high R2 values observed in the regression models may raise concerns regarding potential spurious correlations driven by common trends. However, several factors mitigate this risk. First, panel unit root tests indicate that the key variables are stationary in levels. Second, the inclusion of time fixed effects controls for common macroeconomic trends affecting all subsectors. Third, the consistency of results across alternative model specifications suggests that the estimated relationships reflect meaningful economic associations rather than purely statistical artefacts.
Higher levels of concentration are associated with lower wages, increased overtime intensity, fewer paid holidays, and a greater prevalence of part-time employment. Although causal effects cannot be established, the observed patterns highlight meaningful differences in labour market outcomes across subsectors characterized by varying degrees of market concentration.
Empirical results show that mergers have a significant but complex impact on labour market outcomes in the Hungarian food industry. Overall, H1a is supported by the fact that higher concentration (HHI) is correlated with lower base hourly wages. This relationship becomes statistically significant when robust standard errors are applied, suggesting that firms in concentrated markets may be able to lock in fixed wages. In the cases of H1b and H1c, evidence points to a change in the compensation structure rather than a simple salary reduction. Regular bonuses do not increase with concentration, whereas irregular (unregular) bonuses seem to play a bigger role. This suggests that companies rely more on flexible and discretionary payments, which supports the idea that mergers lead to less stable and more performance-based remuneration. H1d support is partially supported. While the basic wage is falling, total gross monthly earnings are not clearly falling, as bonuses compensate for lower fixed salaries. As a result, total revenues remain relatively stable in nominal terms, but revenues become more variable and unpredictable. Other results reinforce these findings. Higher concentrations are associated with more overtime and a higher proportion of part-time work, implying greater work intensity and more flexible (and potentially less safe) working arrangements. In short, corporate consolidation does not merely lower wages; it reshapes the wage structure by reducing fixed wages, increasing the reliance on variable compensation, and promoting more flexible work patterns.
6. Conclusions
This study provides long-term empirical evidence on the relationship between corporate concentration and labour market outcomes in Hungary’s food manufacturing industry between 1993 and 2022. Using industry-level panel data and two-way fixed-effects models, the analysis demonstrates that higher levels of product market concentration are systematically associated with lower base wages, greater overtime intensity, reduced paid leave, and a higher prevalence of part-time employment.
The panel regression results provide direct quantitative evidence that higher levels of corporate concentration are associated with lower base wages, reduced earnings, intensified overtime, fewer paid holidays, and a greater reliance on part-time employment. Importantly, the combined model suggests that the wage effects of concentration operate partly through structural adjustments in working conditions and compensation composition. These findings reinforce the interpretation that corporate concentration in Hungary’s food industry reshapes labour relations not only through direct wage suppression but also through institutional and organizational restructuring of employment conditions.
Importantly, the findings indicate that corporate concentration does not necessarily reduce nominal earnings outright. Instead, it reshapes the structure of compensation. The weakening role of base wages and the increasing reliance on regular bonuses suggest a transformation in income determination mechanisms, with greater managerial discretion over compensation components.
The combined model further indicates that the association between concentration and earnings operates partly through adjustments in working-time arrangements and employment composition. These results are consistent with monopsony-based interpretations of employer market power in concentrated industries.
From a policy perspective, the findings underscore the importance of integrating labour market considerations into competition policy assessments. In sectors characterized by high concentration, regulatory frameworks should account not only for price effects but also for wage dynamics, employment structures, and non-wage working conditions. Strengthening collective bargaining institutions and reinforcing the protection of non-wage employment rights may help mitigate the labour market consequences of rising corporate concentration.
Overall, the Hungarian case illustrates how product market concentration can extend beyond pricing power and influence the internal architecture of employment relations in transition economies.
7. Limitations and Future Research
This study has several limitations. First, the available dataset covers the period up to 2022, reflecting the standard time lag in the availability of harmonised industry-level data. While extending the analysis to include more recent years may be desirable in future research, the current time span already provides a sufficiently long-term perspective to capture structural trends. Additionally, the initial objective was to begin the analysis in the late socialist period (1980s); however, pre-transition data were not sufficiently harmonised with post-transition statistical classifications to ensure consistent longitudinal comparison.
The analysis does not directly assess the stationarity of the variables. However, because fixed-effects panel models were used and the focus was on conditional associations instead of long-run equilibrium relationships, the estimates should be taken with a grain of salt. Non-stationarity and common trends may influence coefficient magnitudes, and subsequent research could remedy this by employing formal panel unit root and cointegration tests.
Second, the analysis is based on industry-level data rather than firm-level or individual-level microdata. Although this approach captures structural patterns of concentration, it limits the ability to examine heterogeneity in income, working hours, and contractual arrangements. Third, working-time dynamics are inferred indirectly through compensation structures and are not directly modelled within the regression framework. Finally, the findings are specific to Hungary’s food industry and may not be fully generalisable to other sectors or institutional contexts.
The study’s conclusions are especially pertinent to Hungary’s institutional framework, where collective bargaining and labour market regulation are still comparatively inadequate by Western European standards. Growing corporate concentration may have more noticeable effects on non-wage working conditions and wage structures in these situations. This implies that labour market policies that strengthen worker protections and institutional bargaining frameworks should be implemented in addition to competition policy in Hungary and other transition economies.
These limitations suggest several directions for future research. Further work could explore sectoral heterogeneity within Hungary by analysing less concentrated food subsectors. Comparing highly concentrated and less concentrated industries would provide deeper insight into the relationship between concentration and labour market outcomes. In addition, the use of firm-level or matched employer–employee microdata would allow for more precise identification of the microeconomic mechanisms linking concentration to wages, working hours, and employment security, including intra-firm wage dispersion and contractual heterogeneity.
Future research could also incorporate data from the late socialist period to provide a longer historical perspective and enable comparison between pre- and post-transition labour market structures. Cross-country comparative studies could examine whether the patterns observed in Hungary are characteristic of other post-transition economies in Central and Eastern Europe, and also whether they differ from those in Western European institutional contexts.
Complementary qualitative and quantitative studies focusing on workplace governance, managerial decision-making, and collective bargaining practices would further enhance understanding of how corporate concentration restructures employment relations in practice. Such analyses would help clarify the role of institutional environments in shaping the labour market effects of corporate concentration.