1. Introduction
Energy efficiency has been recognized as a central pillar of the global low-carbon transition and is sometimes referred to as the “first fuel” in climate and energy security policies. In the International Energy Agency’s net-zero routes, enhancements in energy efficiency provide a significant portion of the necessary emission reduction (
IEA, 2019). This priority is further supported by global policy initiatives, such as the Paris Agreement, Green New Deal in the United States (US), the European Green Deal and the Green Agenda for the Western Balkans (WB-6) (
United Nations, 2015;
European Commission, 2020,
2024;
U.S. House of Representatives, 2019).
Within the European Union (EU), the European Green Deal aims for climate neutrality by 2050 and specifically demands faster improvements in energy efficiency across buildings, industry, and transport, emphasizing “energy efficiency first” and extensive restoration of the existing building stock (
European Commission, 2024). The EU’s priorities have been expanded to its neighborhood, including the Western Balkans, via the Green Agenda for the Western Balkans and associated Energy Community commitments. As part of the long European integration process that WB-6 began in 2003 and in accordance with the Stabilization Association Agreement (SAA), WB6 countries are required to transpose, or adopt if full transposition is not practicable, the European Union acquis (
European Union, n.d.). Improving energy efficiency and converging with EU standards are critical for the Western Balkans in aligning economic, technological, and regulatory frameworks to enable deeper European integration and sustainable development. The priorities set in the Green Agenda for the Western Balkans explicitly define energy efficiency as essential for sustainable growth and social welfare (
European Commission, 2020).
Despite this policy focus, significant cross-country disparities in energy performance exist across Europe. The six Western Balkan economies have energy intensity levels that are nearly three times greater than the EU average, indicating an aged energy system, inefficient industrial and building stock, and a slower adoption of new technologies. Even within the EU-27, there is significant variation in energy efficiency outcomes due to varied historical fuel mixes, sectoral structures, and policy initiatives (
IEA, 2008;
Serreqi & Shahini, 2025).
While the promotion of energy efficiency is widely supported, it must be acknowledged that improving efficiency entails substantial costs and significant credit needs. The ongoing legal modifications resulting from these strategic documents and action plans necessitate adjustments in production processes and consumption behavior by various agents, including individuals, firms, and institutions. In mature financial systems, facilitating access to credit at reduced costs, enhanced information availability and robust monitoring mechanisms promote financing for the research and development of innovative products that advance energy-efficient technologies (
Lin et al., 2015;
Moshirian et al., 2021). These financial markets mitigate the uncertainty associated with investments overall and, more specifically, in energy efficiency investments by facilitating the creation of risk management instruments. A sophisticated financial sector denotes a diverse framework of specialized financial institutions that cater to various requirements and enhance capital allocation, risk distribution and management, and information dissemination (
Adom et al., 2023;
Chen et al., 2019;
Hsu et al., 2014). On the other hand, if financial development primarily drives the expansion of energy and carbon-intensive sectors, economies may be locked onto high-emission pathways. Emerging and mature economies have shown the energy-raising and energy-saving effects of financial development, as well as non-linear relationships that vary depending on finance structure, regulatory frameworks, and stage of economic development (
S.-C. Chang, 2015;
Ma & Fu, 2020;
Çoban & Topcu, 2013;
Xie et al., 2022).
Another issue is figuring out how energy efficiency is measured. Common single-factor metrics, such as energy intensity (energy consumption per unit of GDP), fail to capture the combined contribution of numerous inputs and outputs, such as capital, labor, desirable output, and emissions (
Patterson, 1996;
Ang, 2006). In response, a growing body of work has used non-parametric approaches such as Data Envelopment Analysis (DEA) to develop total factor energy efficiency (TFEE) indicators that assess how close each country is to a best-practice frontier based on its input–output mix (
Berndt, 1978;
Hu & Wang, 2006;
Charnes et al., 1994). DEA-based TFEE measurements have been applied to the Organization for Economic Co-operation and Development (OECD) and EU member states, indicating continuous differences between the top performers and the bottom performers while also documenting the influence of structural change, technical innovation, and environmental legislation in driving efficiency trajectories (
Ziolo et al., 2020).
This article contributes to these discussions by employing an applied empirical investigation via a two-stage methodology. First, it generates DEA-based total factor energy efficiency indicators for 33 European and Western Balkan economies (EU-27 plus WB-6) from 2006 to 2021, utilizing an empirical established window analytic methodology to capture short- and medium-term changes. The TFEE indicators consider primary energy use, capital and labor as inputs, GDP as a desirable outcome, and carbon dioxide (CO
2) emissions as an undesirable output. This provides a more comprehensive view of energy environment performance than single-ratio metrics. The novelity of this stage is the inclusion of Kosovo
1 to conclude the analysis with the full set of EU-27 and WB-6 countries. To our knowledge, this is the first study to provide a consistent TFEE frontier for all six Western Balkan economies.
Second, and most importantly, this paper examines how various aspects of financial development are linked to TFEE once unobserved country heterogeneity and common time shocks are controlled for. By employing a fixed-effects Tobit, this analysis relates latent TFEE with conventional financial development variables (domestic credit to the private sector), foreign direct investment (FDI), and financial composite indexes that define the framework of the financial system while permitting a non-linear impact on economic development via a GDP per capita variable. While similar Tobit frameworks have been implemented for samples of EU member states, this represents the first case, to our knowledge, of estimating such a model for Western Balkan countries within a unified EU–WB context. This extension is both methodological and substantive as it integrates the Western Balkans into the finance–energy efficiency discourse and offers policy-relevant evidence regarding the effectiveness of current financial architectures in the region in facilitating the transition mandated by the European Green Deal and the Green Agenda for the Western Balkans.
2. Literature Review
The earliest studies linking financial development with the energy market examine the relationship between financial indicators and energy consumption. Numerous papers, using different methodologies and covering various economies, have found that financial development stimulates the overall demand for energy in an economy (
Ma & Fu, 2020;
Al-Mulali & Lee, 2013;
Islam et al., 2013;
Mahalik et al., 2017;
Sadorsky, 2010;
Shahbaz & Lean, 2012). The literature analyzes the business expansion mechanism by which financial development affects energy demand.
Grechyna (
2018) and
C. Arellano et al. (
2012) demonstrate that reduced borrowing costs and enhanced credit availability promote capital deepening, the expansion of production lines, and scaling at the firm level. Expansions that are typically energy-intensive correlate with increased overall energy demand. In economies with advanced financial markets, households encounter reduced credit constraints and lower financing costs, leading to increased purchases of energy-intensive durable goods and, consequently, higher overall energy consumption (
S.-C. Chang, 2015).
A complementary body of research emphasizes an opposing efficiency mechanism. Decreases in financing costs can expedite technological advancement and the spread of energy-efficient capital, thus reducing overall energy consumption. Access to efficient financial markets and affordable credit promotes investments by firms in energy-efficient machinery and production processes (
Maskus et al., 2012;
Assi et al., 2020;
Farhani & Solarin, 2017;
Rafindadi & Mika’ilu, 2019). Contemporary literature has shifted attention toward identifying the non-linear relationships between financial development and energy consumption. Research indicates a strong correlation between the finance–energy efficiency nexus and the economic development stages of countries. Previous time-series analyses utilizing linear specifications typically indicate straightforward proportional relationships. Recent studies utilizing panel datasets, semiparametric (
S. Yue et al., 2019), and spatial econometric methods (
Yu et al., 2022) reveal intricate dynamics that linear models often overlook.
In economies characterized by underdeveloped financial systems, the expansion of credit frequently supports scale-intensive industrial sectors, thereby increasing energy demand, in line with cross-country findings reported by
Ma and Fu (
2020). When financial development surpasses specific efficiency thresholds, capital is increasingly allocated to energy-efficient firms and technologies, facilitating the emergence of finance’s constraining or demand-reducing effects (
Y. Wang & Gong, 2020). Evidence from the European Union further substantiates these heterogeneous dynamics (
Çoban & Topcu, 2013). Additionally, recent nonlinear and dynamic models illustrate state-dependent effects of financial development on energy consumption in emerging economies (
Adom et al., 2023;
Hsu et al., 2014;
Xie et al., 2022).
Nonetheless, the empirical literature, although being limited, indicates a more intricate relationship between financial development and energy efficiency. Employing energy intensity as an indicator of efficiency,
Pan et al. (
2019) demonstrate that financial progress reduces energy intensity in the long term via a structural vector autoregression (SVAR) framework. In a similar work,
Chen et al. (
2019) utilize data from 98 economies to demonstrate that financial growth, as indicated by bank credit to the private sector, reduces long-term energy intensity, employing a two-way fixed-effects model.
Other authors demonstrate that the relationship is positive yet unstable, reliant upon a country’s level of financial growth and several contextual elements (
Atta Mills et al., 2021;
Yao et al., 2021).
Atta Mills et al. (
2021) assess intertemporal energy efficiency for 58 Belt and Road economies via a dynamic DEA model, with energy stock regarded as a carry-over variable. They subsequently analyze the non-linear impacts of financial development, represented by the International Monetary Fund Financial Development Index, utilizing Estimated Generalized Least Squares (EGLS) and Tobit panel regressions, and conducting projection analysis. Their findings reveal a low average efficiency of roughly 0.44, with only seven DEA-efficient nations, and a deterioration post-2013. Financial development exerts a beneficial impact at lower levels of advancement but becomes negligible upon surpassing elevated thresholds. A recent literature analysis affirms the variability of these impacts and highlights the conditional characteristics of the finance–energy efficiency relationship (
Fan et al., 2025).
Ziaei (
2015) utilizes a panel Vector Autoregressive (PVAR) analysis for 13 European and 12 East Asia–Oceania countries from 1989 to 2011, demonstrating that financial shocks affect energy consumption in an asymmetric manner. Equity market shocks increase energy consumption over extended periods in East Asia–Oceania, whereas in Europe, energy-use shocks have a more pronounced impact on stock returns, and credit market shocks are comparatively weak. The findings indicate that, when analyzed in terms of energy intensity, market-driven financial deepening may lead to increased energy intensity due to finance promoting investment booms. In contrast, in more developed financial systems, the relationship between finance and energy is less pronounced, with energy-to-finance feedback prevailing. This pattern underscores that the finance–energy intensity relationship is contingent upon the measurement of financial development (equity markets versus credit markets) and the developmental stages of countries.
A study conducted by
Hübler and Keller (
2009), which analyzed panel data from 60 developing countries between 1975 and 2004, concludes that the frequently cited ordinary least squares (OLS) finding indicating that FDI inflows decrease energy intensity is predominantly spurious when considering broader determinants and conducting robustness checks. Aggregate FDI does not consistently lead to a reduction in energy intensity, while foreign development aid correlates with enhancements in energy efficiency. This evidence suggests that the characteristics and circumstances of external finance may play a more significant role in decreasing energy intensity than the total amount of foreign direct investment (FDI).
Empirical research indicates that financial development may lead to decreased energy intensity, thus enhancing overall energy efficiency.
Adom et al. (
2019) analyze the relationship in Ghana using a dynamic OLS framework, concluding that more developed financial systems significantly reduce energy intensity following thorough robustness checks. Their findings indicate that energy prices, trade openness, and industrial structure serve as significant complementary determinants. The authors contend that the finance–intensity relationship is complex yet significantly relevant to policy. They highlight that financial development can facilitate macro-level enhancements in energy efficiency and advocate for the creation of specialized green financing institutions, such as a Green Bank, to direct capital towards energy-efficient technologies.
Shahbaz et al. (
2015) analyze Portuguese data from 1971 to 2011 to identify a long-run cointegrated relationship among CO
2 emissions, energy intensity, economic growth, and financial development. Their methodology includes Zivot–Andrews unit-root tests, autoregressive distributed lag (ARDL) bounds testing, and vector error correction model (VECM)-based Granger causality analysis. The findings suggest that economic growth and energy intensity contribute to increased CO
2 emissions, while financial development has a mitigating effect on CO
2 levels, aligning with a financing mechanism that promotes cleaner technologies. Causality tests indicate a reciprocal relationship between energy intensity and CO
2 emissions, alongside a unidirectional influence from economic growth and financial development to CO
2 emissions. According to the authors, financial development can also play its role in improving the environmental quality by encouraging investment in energy-efficient technology to enhance domestic production and save the environment from degradation. In support of this evidence,
Chen et al. (
2019) employed a two-way fixed-effects framework analyzing 21 OECD and 77 non-OECD countries from 1990 to 2014. Their findings indicate that financial development reduces energy intensity predominantly in non-OECD economies, whereas the impact is constrained in OECD contexts, aligning with the characteristics of established financial systems. In developing economies, a U-shaped relationship between finance and intensity is identified, indicating that initial financial deepening may decrease intensity. However, benefits may diminish or reverse after certain thresholds, with technological advancement and innovation serving as critical transmission mechanisms. These findings suggest that enhancing and strategically allocating finance can be utilized to reduce emissions and energy intensity through investments in energy efficiency, while policymakers navigate the trade-offs between growth and environmental concerns (
Shahbaz et al., 2015;
Chen et al., 2019).
Canh et al. (
2020) analyze a global panel of 81 economies from 1997 to 2013, employing multidimensional indicators of financial development that assess depth, access, and efficiency for both institutions and markets. Their findings indicate that the finance–energy intensity nexus is specific to particular domains and contingent upon income levels. In terms of production, overall financial activity tends to elevate energy intensity, unless enhanced efficiency within financial institutions counteracts this effect. Financial depth and access generally lead to a reduction in energy intensity on the consumption side, while financial efficiency may increase it. Over the long term, financial institutions tend to elevate consumption intensity, whereas financial markets exert a downward pull on it. The authors document significant heterogeneity across income groups; for instance, finance diminishes production intensity in high-income economies while enhancing it in upper-middle-income economies. The development of specific finance components, in combination with a country’s income level, significantly influences the potential for policy interventions aimed at enhancing energy efficiency.
Ziolo et al. (
2020) analyze 37 OECD economies from 2000 to 2018 using DEA-based total factor energy efficiency indicators and second-stage regressions. Their findings indicate a modest upward trend in TFEE, alongside persistent cross-country disparities, with more developed OECD members achieving higher average scores. The results regarding the finance–energy efficiency nexus reveal mixed effects of sustainable financial development proxies. Research and development and health expenditures exhibit a positive association with TFEE, the composite index of financial institutions shows a negative association with TFEE, while FDI is not statistically significant. On the other hand, higher TFEE is demonstrated to support sustainable financial development over the long term and is linked to reduced CO
2 emissions. The structure and orientation of finance are significant. Innovation-oriented spending correlates with enhanced energy efficiency, while broad institutional depth alone does not ensure efficiency improvements according to this study.
The literature exhibits geographical differences. Empirical evidence connecting financial development and energy efficiency in EU member states is limited, with a notable absence of studies specifically addressing the Western Balkans. This gap emphasizes the necessity for systematic analyses of the interaction between financial development and energy efficiency in both advanced and emerging European economies, underscoring the originality and significance of research aimed at addressing this deficiency.
A fundamental initial step in assessing energy efficiency performance and its determinants is to define the term “energy efficiency” (
Patterson, 1996;
Ang, 2006). Previous contributions indicate that no singular definition prevails in the literature. A commonly accepted perspective defines energy efficiency as the ratio of useful energy services derived to the quantity of energy spent.
The EU Directive 2006/32/EC (
2006) on energy end-use efficiency and energy services employs a comprehensive approach, defining energy efficiency as the ratio of performance, service, commodities, or energy output to the energy input utilized. These alternate formulations emphasize various aspects of the input–output connection, resulting in disparate empirical indicators that might produce divergent evaluations of energy efficiency trends and varied policy implications (
Berndt, 1978). The literature framework for quantifying and comparing energy efficiency performance across countries and sectors is extensive. In literature reviews, the following two indicators emerge as the most used: energy intensity and total factor energy efficiency (TFEE). Energy intensity is defined as total energy consumption per unit of GDP. The inverse of energy intensity serves only as an approximate indicator of efficiency since it is simultaneously influenced by economic structure, climate, and behavioral factors.
TFEE was introduced in 2006 by
Hu and Wang (
2006). By recognizing that energy does not generate output independently but operates jointly with labor and capital, they constructed the TFEE index, which integrates multiple production inputs into a unified efficiency framework by employing data envelopment analysis (
Charnes et al., 1978;
Charnes et al., 1994;
Cooper et al., 2000). DEA is a linear non-parametric frontier approach used to evaluate the relative efficiency of a set of different entities called decision-making units (DMU) that use different inputs to produce desirable and sometimes non-desirable output (
Charnes et al., 1994). This method has recently gained popularity in efficiency analysis in general (
P. Yue, 1992;
Asmild et al., 2004;
S. Wang et al., 2018) and in energy efficiency in particular (
Zahirović et al., 2025;
Yan et al., 2021;
Cheng et al., 2020;
Zhou & Ang, 2008;
Mardani et al., 2017;
X.-P. Zhang et al., 2011).
5. Discussions
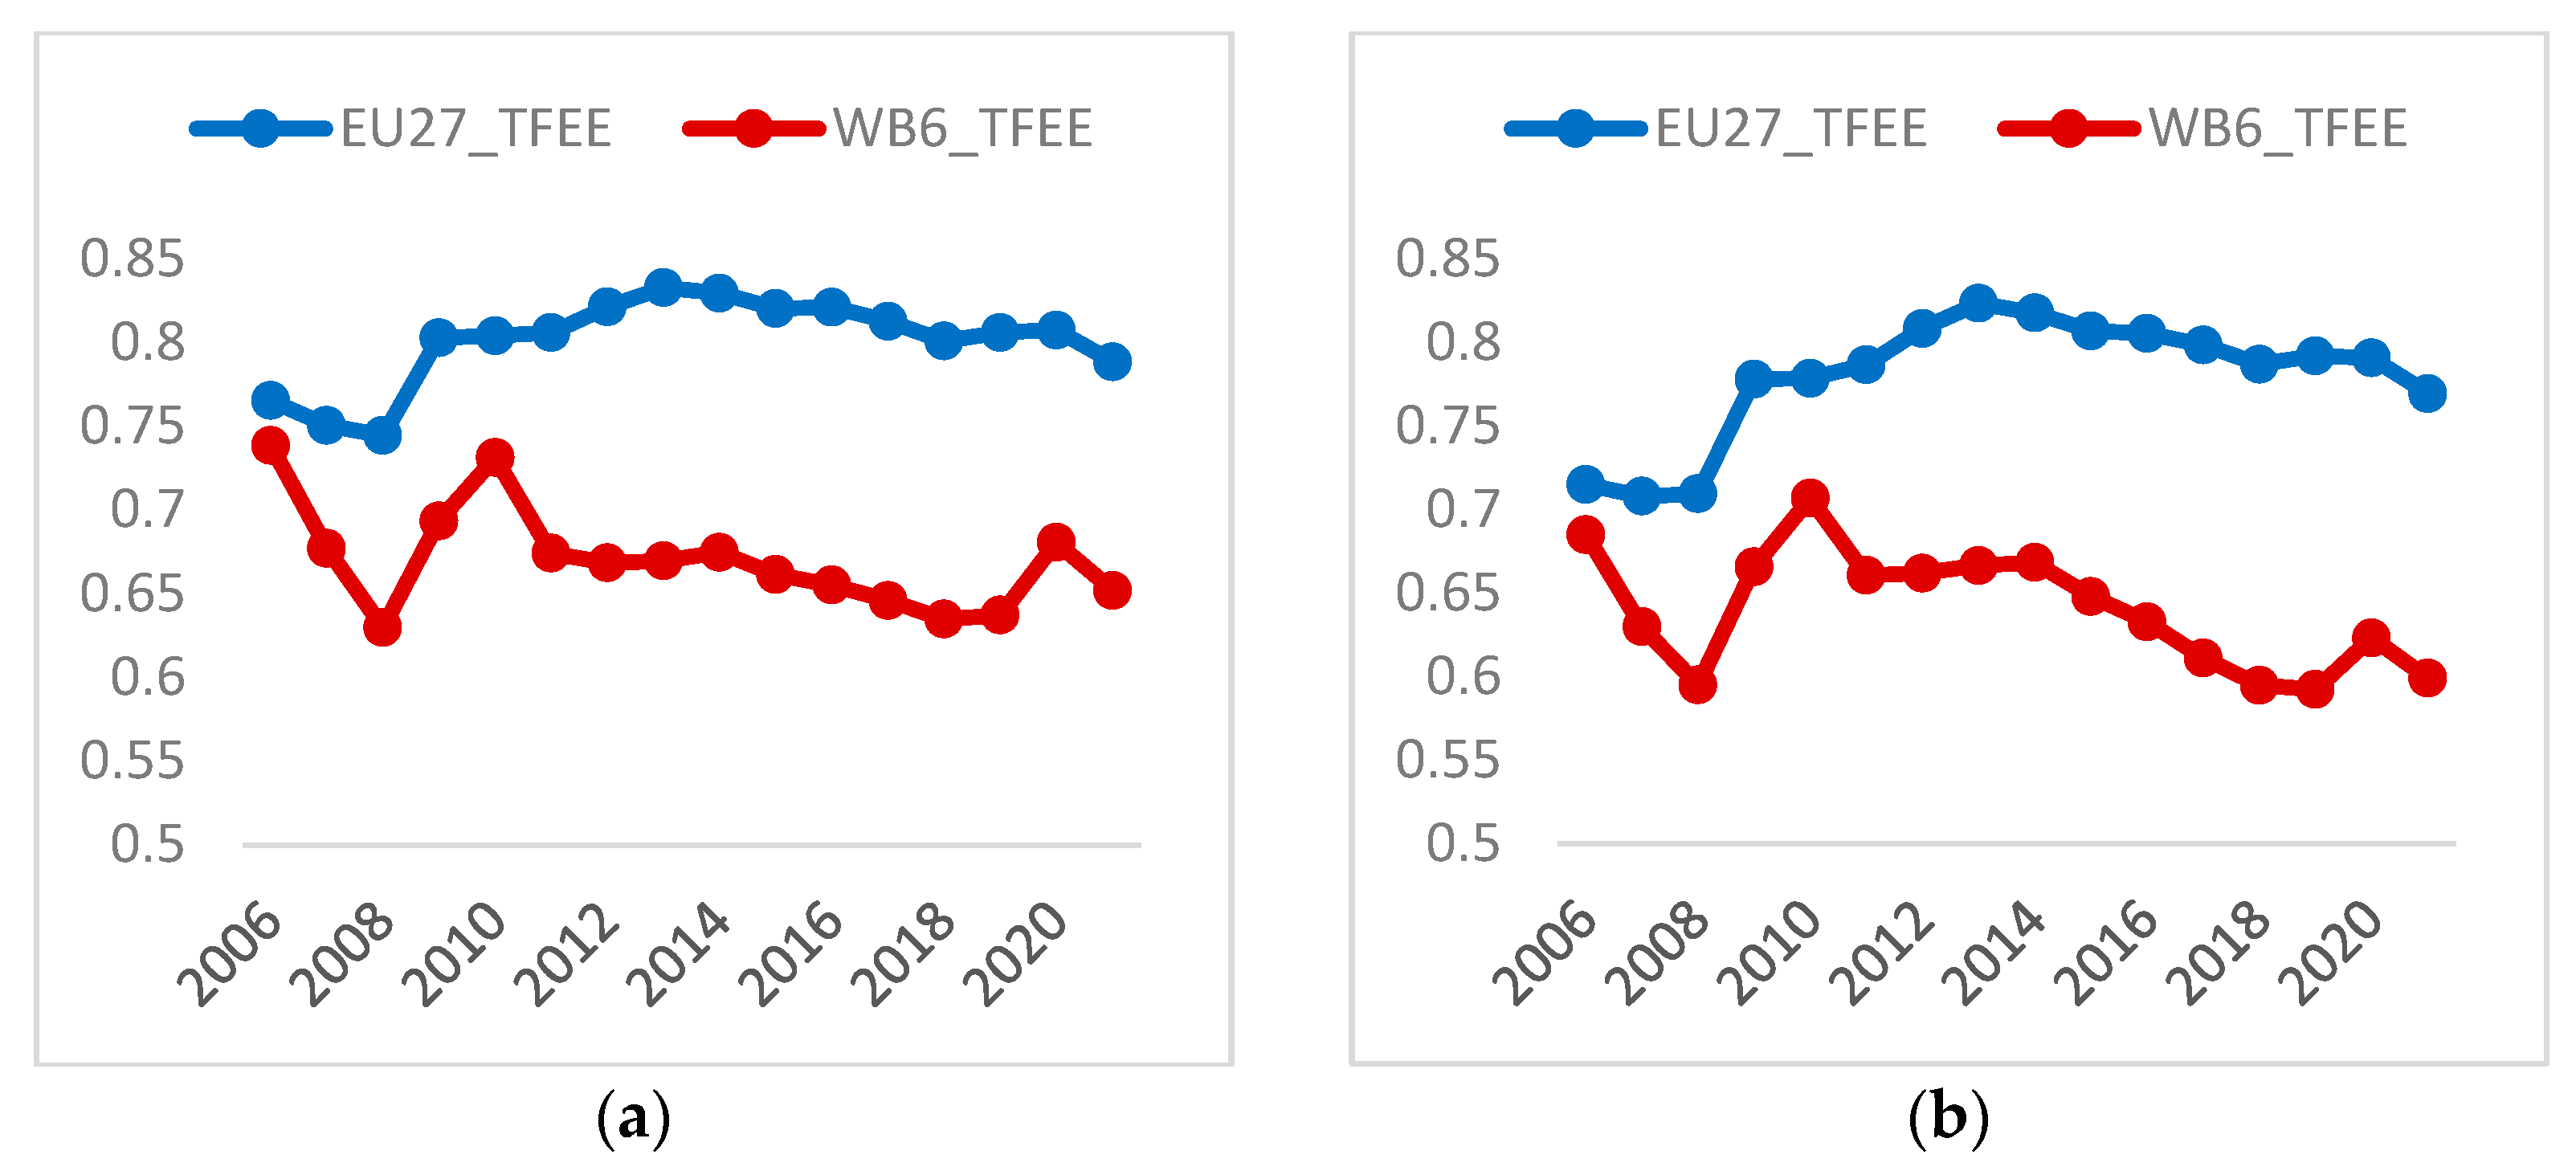
The DEA-derived total factor energy efficiency indicators for both the five-year and ten-year periods indicate that, on average, the 33 European and Western Balkan economies function relatively highly, yet they are still some distance away from the best performance. The cross-sectional mean of TFEE varies between 0.75 and 0.80 from 2006 to 2021, exhibiting a minor enhancement until the early 2010s, followed by a slight stabilization or decrease thereafter. The minimum average efficiency occurred between 2007 and 2008, coinciding with the global financial crisis, after which the mean TFEE recuperates and stabilizes at marginally elevated levels. This trend aligns with recent findings for EU member states, where dynamic DEA analyses reveal incremental advancements in energy efficiency and eco-efficiency until approximately 2010–2012, succeeded by a deceleration in progress (
Zahirović et al., 2025;
Vlahinić-Dizdarević & Šegota, 2012;
Borozan, 2018;
M.-C. Chang, 2020;
Vlahinić Lenz et al., 2018).
High-income EU countries often possess capital and knowledge-intensive production frameworks, characterized by more efficient industrial machinery and infrastructure (
Borozan, 2018). Core EU members have been prompt and comparatively stringent in the implementation of EU energy efficiency directives, construction regulations, and industry standards (
European Commission, 2025;
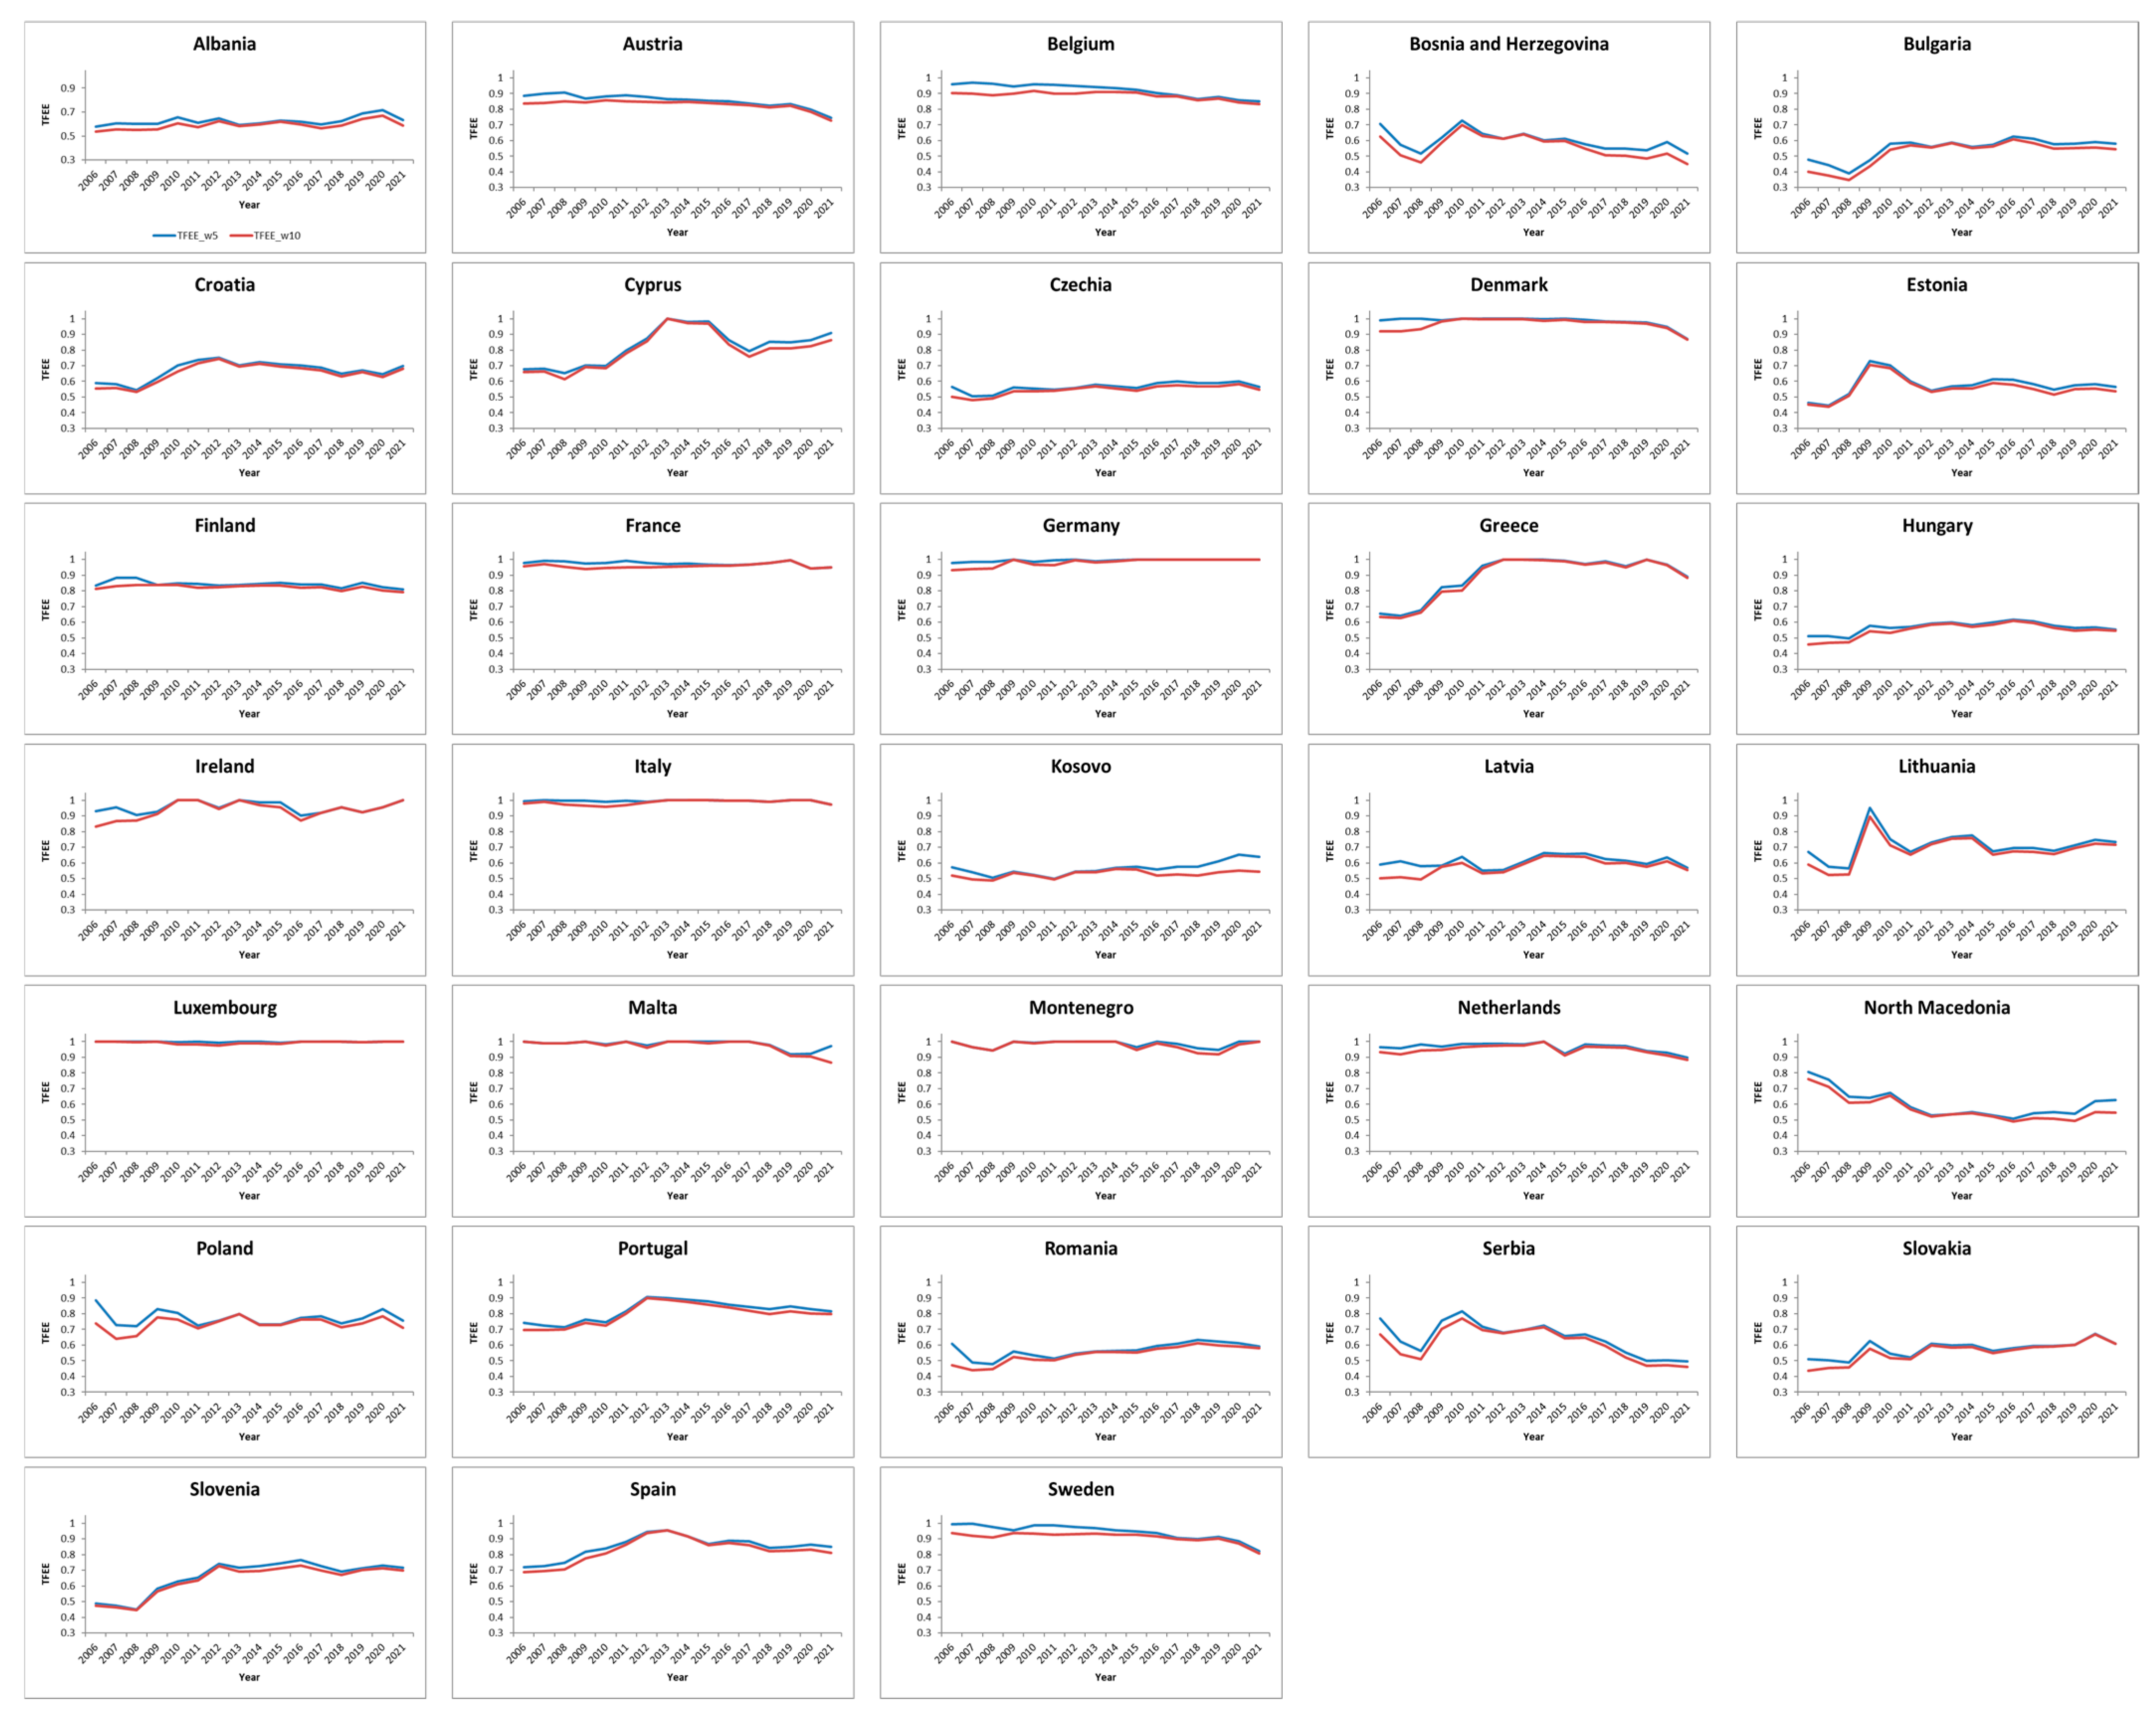
Altmann et al., 2010). Denmark is frequently seen as a frontrunner in energy efficiency policy, integrating established building standards, proactive district heating initiatives, and incentives for industrial efficiency investments. Such policy frameworks increase the expense associated with energy waste and promote the use of efficient technology. Final energy consumption trends vary across Member States. Countries like Luxembourg, the Netherlands, and Finland have shown significant decreases in final energy use, while others, including Croatia, and Portugal, have observed rises since 2019. The most significant savings have occurred in the residential sector, succeeded by industry and services, primarily due to enhancements in building energy efficiency (
European Commission, 2025). Italy and Luxembourg, among others, established more ambitious energy-saving objectives in their National Energy Efficiency Action Plans (NEEAPs), while CEE countries such as Czech Republic seem to fall short, especially regarding the comprehensiveness, transparency, and clarity of their declared intended initiatives in framework of their energy efficiency policies (
Altmann et al., 2010).
Denmark and Germany have swiftly expanded their wind and solar capacity as components of their energy transitions (
Agora Energiewende, n.d.;
Umweltbundesamt, 2025). By the early 2020s, renewable energy sources accounted for over fifty percent of electricity in Germany and a comparably high proportion in Denmark, while the European Union collectively derived about seventy-five percent of its power from renewables and nuclear energy (
Eurostat, n.d.-a,
n.d.-b,
n.d.-c). This transition to low-carbon, capital-intensive generation and contemporary grid infrastructure diminishes CO
2 emissions per unit of electricity and frequently decreases technical losses, which, in a DEA framework, results in enhanced total factor energy efficiency.
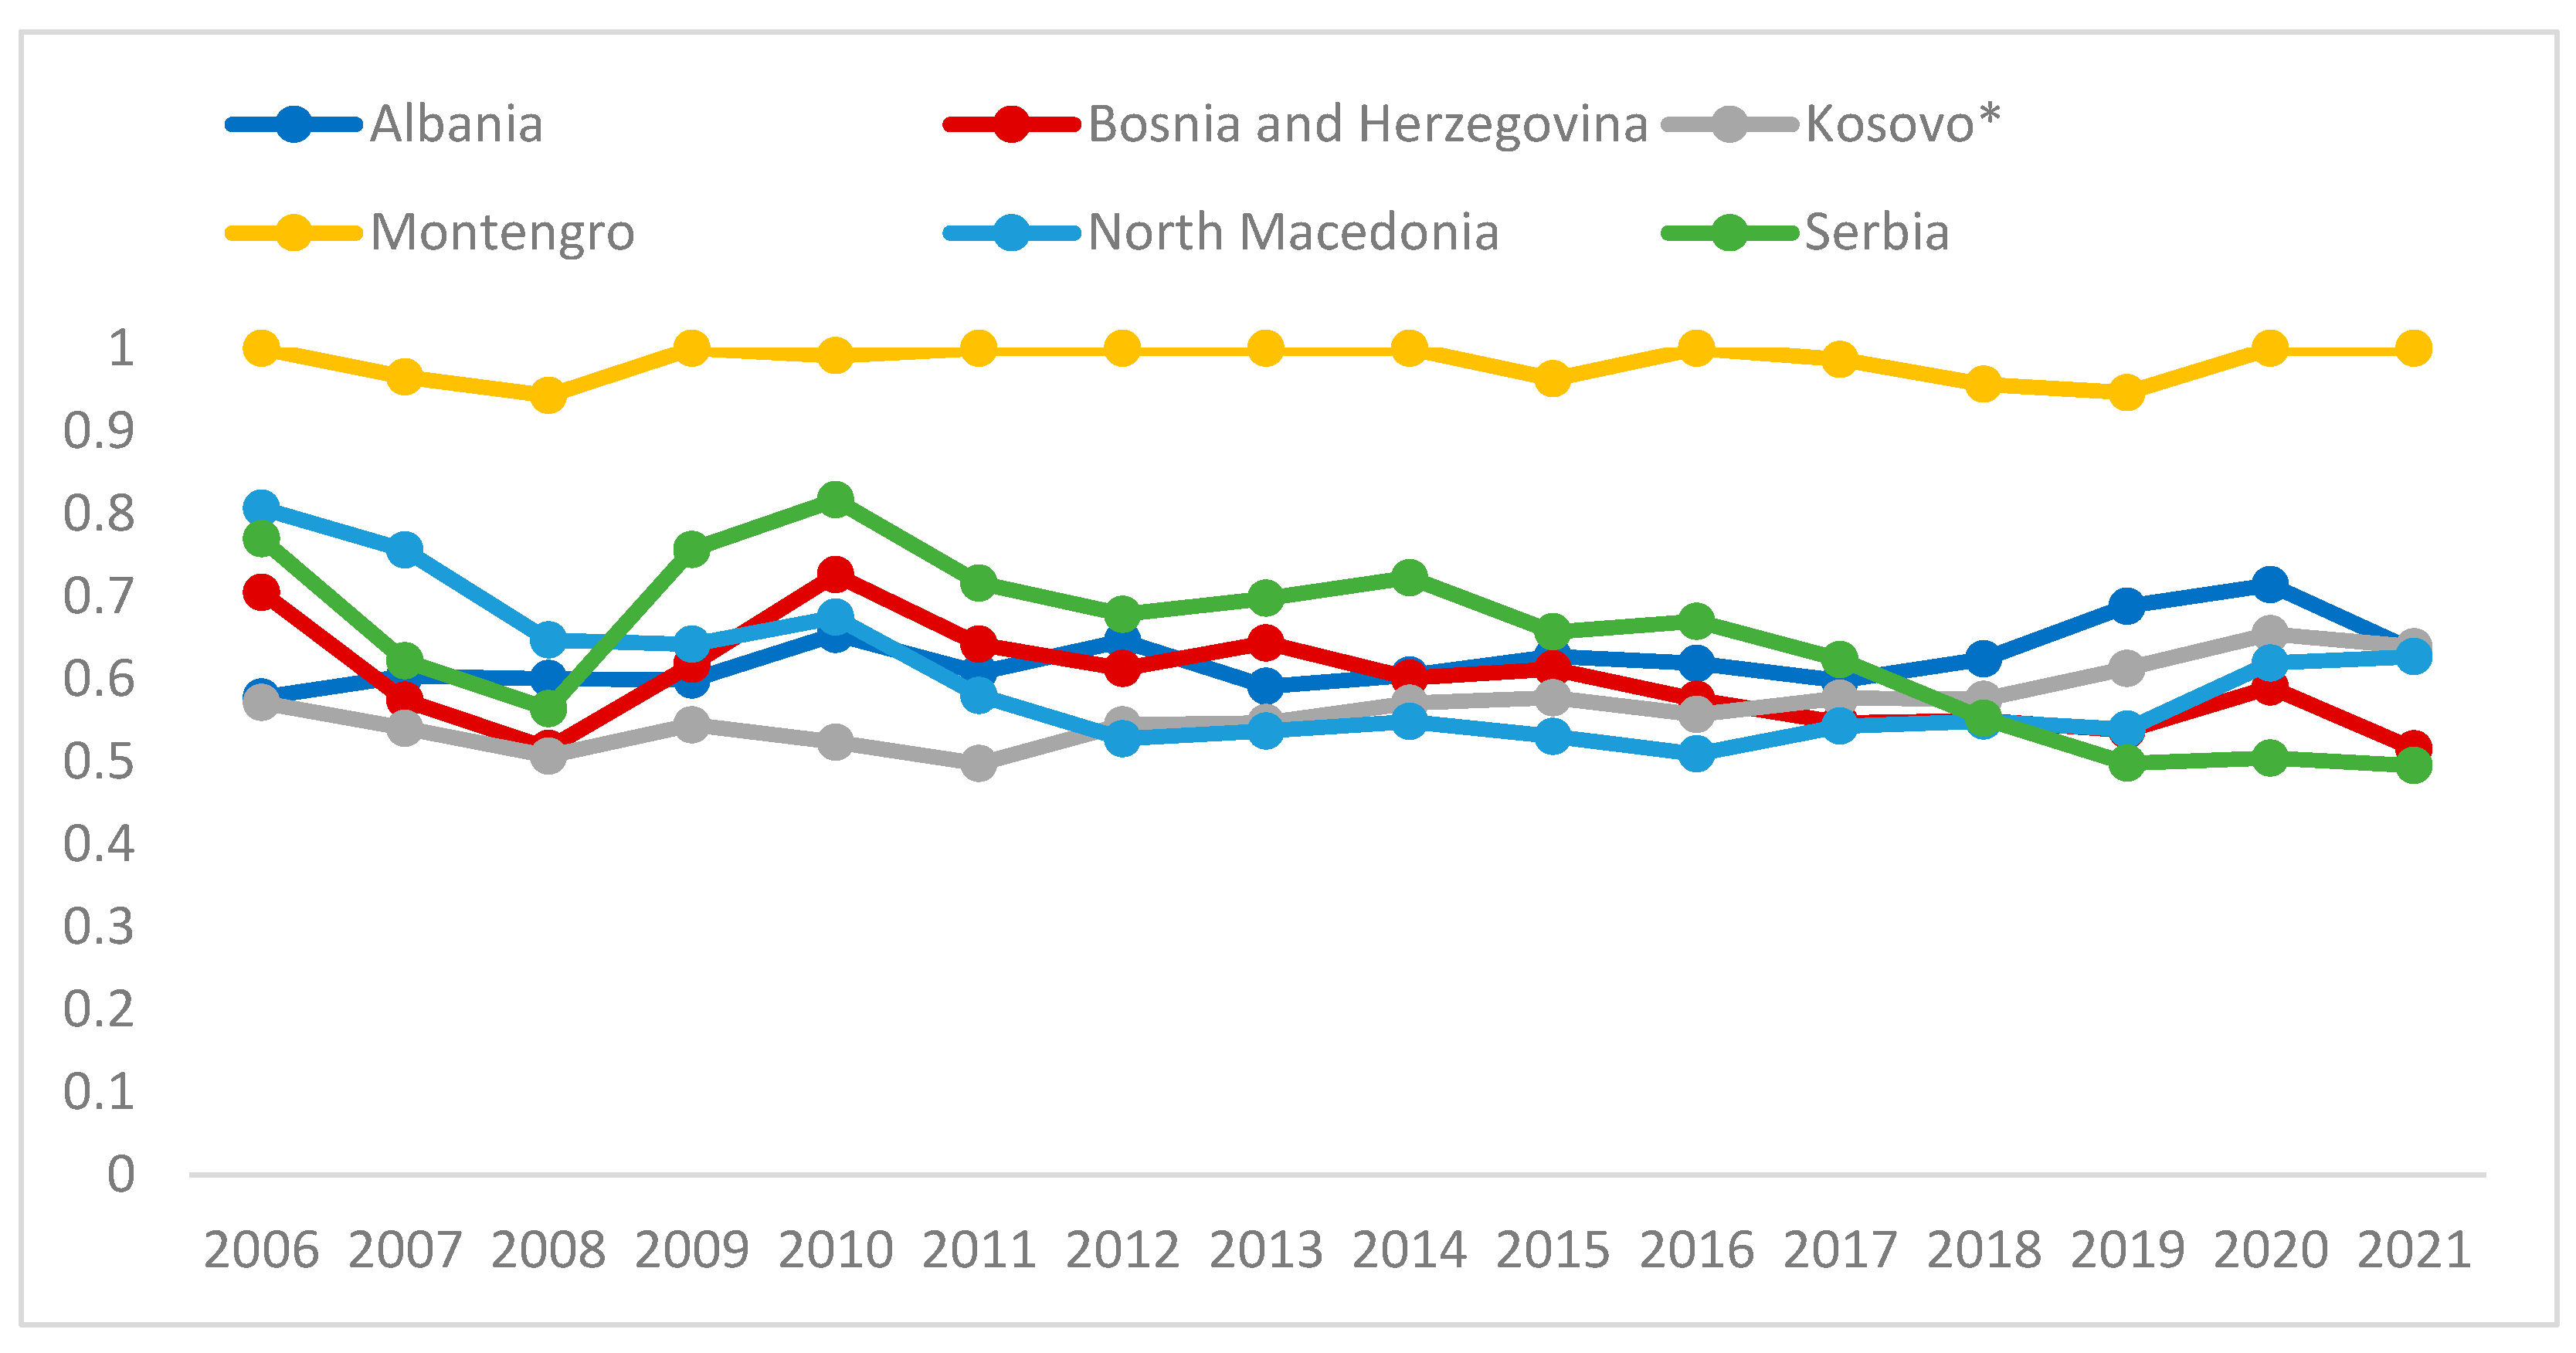
At the lower end of the TFEE distribution, DEA findings indicate that Bulgaria, Romania, Kosovo, Bosnia and Herzegovina, North Macedonia, Slovakia, Hungary, the Czech Republic, and, to a lesser degree, Serbia and Latvia exhibit average TFEE values within the 0.50–0.65 range, contingent upon the window length. These post-socialist EU nations and Western Balkan economies inherited an industrial framework focused on heavy, energy-intensive sectors, with district heating systems and building inventories that were not constructed according to contemporary energy efficiency standards (
Popov, 2023;
Tian et al., 2024). CEE economies exhibit higher energy consumption relative to their economic production and living standards compared to Western Europe, with this inefficiency directly associated with increased energy poverty, deteriorating air quality and diminished industrial competitiveness (
Popov, 2023).
Reports from the Energy Community and papers indicate that the Western Balkans exhibit minor advancement in the transposition and enforcement of energy efficiency legislation, characterized by fragmented institutional responsibilities and constrained capability within local authorities (
Serreqi & Shahini, 2025;
United Nations Development Programme, 2024;
World Bank, 2018;
Knez et al., 2022;
Pijalović & Kapo, 2017;
Frey, 2024). Lower-performing countries (e.g., Kosovo, Bosnia and Herzegovina) rely heavily on domestic lignite, which is extremely carbon-intensive and often burned in old plants with low thermal efficiency (
Eurostat, n.d.-a,
n.d.-b,
n.d.-c). In contrast, Albania and Montenegro, which have substantial hydropower resources, tend to appear relatively more efficient in TFEE terms than their income level alone would suggest. Hydropower allows them to generate electricity with relatively low CO
2 emissions, and in Albania’s case, energy intensity has fallen significantly over time as the economy has shifted away from heavy industry (
Ministry of Infrastructure and Energy, 2021). Beyond the role of a relatively “cleaner” electricity mix, Montenegro’s economic structure is characterized by a comparatively small industrial base. The share of industry (including construction), typically among the most energy-intensive sectors, is markedly lower (only 13%) compared to 20–24% in neighboring countries, according to
World Bank (
n.d.-a,
n.d.-b). Montenegro also appears to benefit from comparatively stronger societal and business awareness of environmental and energy issues. This may translate into greater acceptance of efficiency-oriented measures, as well as a business environment that is more receptive to adopting energy-efficient technologies and operational practices. Over time, such behavioral and organizational factors can complement structural conditions and contribute to performance closer to the efficient frontier (
Serreqi & Shahini, 2025). Our results are consistent with those of the authors, which has evaluated TFEE using Data Envelopment Analysis for EU-27 countries and WB countries without Kosovo (
Zahirović et al., 2025).
Our findings on the contribution of the financial development variable show that domestic credit and the development of the financial market and institutions negatively impact energy effieicncy. The results for
and
indicate that more developed financial systems do not necessarily correlate with higher total factor energy efficiency; rather, they seem to be associated with increased energy consumption relative to output. A substantial body of empirical literature indicates that more developed financial systems frequently increase energy consumption and CO
2 emissions, particularly when financial deepening predominantly supports conventional, energy-intensive industries instead of targeted green investments (
Çoban & Topcu, 2013;
Sadorsky, 2010;
Ziaei, 2015;
Shahbaz et al., 2015;
Batóg & Pluskota, 2023;
Bayar et al., 2021). Research on emerging and middle-income nations typically indicates that advancements in financial and stock market sectors elevate energy consumption and emissions (
Sadorsky, 2010;
Hübler & Keller, 2009).
The foreign direct investment coefficient is marginally positive although statistically insignificant. This aligns closely with the extensive literature. Certain studies indicate that foreign direct investment can enhance energy efficiency in some countries by introducing cleaner technologies and management techniques. Other countries direct their investments towards energy-intensive and lightly regulated sectors. In a fixed-effects framework, that heterogeneity dissipates into a statistically insignificant average effect.
Hübler and Keller (
2009) and
Ziolo et al. (
2020) additionally document a non-significant impact of FDI on TFEE for OECD nations.
Elevated health expenditure may indicate a more robust welfare state, superior institutions, and heightened political focus on well-being. This may be associated with more stringent environmental policies, more environmental awareness, and supplementary investments in clean technologies. In contrast to
Ziolo et al. (
2020), who report a positive correlation between health expenditure and total factor energy efficiency in OECD nations, our coefficient for our health expenditure proxy (h) is minimal and statistically insignificant in the fixed-effects Tobit model. This indicates that short-term variations in overall health expenditure do not result in consistent alterations in energy efficiency when accounting for financial development, income levels, and unobserved nation heterogeneity. One explanation is that health expenditure is a broad social policy aggregate, only weakly connected to energy use.
This pattern of relationship between energy efficiency and economic development closely resembles an energy efficiency variant of the Environmental Kuznets Curve (EKC) (
Ekins, 1997). During the initial and intermediate phases of development, growth is predominantly dependent on energy-intensive industrialization, infrastructure, and motorization; only at elevated income levels do advanced technologies, rigorous environmental policies, and a predominance of the service sector begin to enhance efficiency (
Wen et al., 2022). Evidence of the Environmental Kuznets Curve concerning CO
2 emissions and energy intensity in EU nations is prevalent, with numerous studies explicitly attributing the reduction in emissions at elevated income levels to enhanced energy efficiency and technological advancements (
Kolasa-Więcek et al., 2025;
Mohammed et al., 2024;
Ahmad, 2024;
López-Menéndez et al., 2014;
Jóźwik et al., 2021;
Simionescu, 2021). Although the estimated quadratic specification implies a turning point at a relatively high level of GDP per capita, this value lies in the far-right tail of the sample distribution. Accordingly, the “upturn” should be interpreted as relevant only for a limited number of very high-income countries. For the central range of observations, which represents the majority of the sample, the estimated marginal relationship between GDP per capita and TFEE is dominated by the declining segment.
6. Conclusions
This study analyzed the relationship between financial development and total factor energy efficiency across a panel of European and Western Balkan economies from 2006 to 2021. The analysis integrated a DEA–TFEE indicator, calculated using a window approach utilizing both desired (GDP) and undesirable (CO2 emissions) outputs, with a fixed-effects Tobit model that associates efficiency with several financial and macroeconomic parameters. This study enhances the existing literature regarding the influence of financial system structure on the energy efficiency trajectories of both established and emerging economies in Europe.
The DEA window approach results indicate that, on average, countries function at relatively high yet distinctly sub-frontier efficiency levels. The mean TFEE values for both the five-year and ten-year windows are observed to be within the range from 0.75 to 0.80. The cross-country distribution of TFEE across countries exhibits significant heterogeneity. Northern and Western European countries, specifically Luxembourg, Italy, Germany, Denmark, Sweden, the Netherlands, and France, consistently rank near or on the efficiency frontier in both window specifications. These economies exhibit high per-capita income and robust institutional quality, and they often utilize cleaner or more efficient power mixes alongside advanced energy technologies, contributing to elevated TFEE scores. Conversely, various economies in the Central, Eastern, and Western Balkans, such as Bulgaria, Romania, Bosnia and Herzegovina, Kosovo, and North Macedonia consistently fall short of the frontier. Within this group, there are notable exceptions like Albania and Montenegro, whose TFEE performance aligns more closely with that of high-performing EU members. This highlights the significance of country-specific policies and energy mixes over regional considerations alone.
In the fixed-effects Tobit model, traditional financial indicators such as domestic credit and foreign direct investment do not show a strong association with higher total factor efficiency (TFEE). Conversely, the structure and depth of the financial system, as measured by market-based finance and financial institution indexes, exhibit a significant negative relationship with latent efficiency. This indicates that, from 2006 to 2021, increasing and improved finance has predominantly directed credit and market funding towards sectors and activities that enhance output while failing to adequately account for energy and climate externalities. The relationship between GDP per capita and TFEE is non-linear. This suggests that higher income correlates with lower TFEE; however, this negative effect diminishes and ultimately reverses at elevated income levels, specifically around 79,000 constant 2015 US dollars. Importantly, this turning point lies in the upper tail of the sample distribution, implying that the potential reversal is relevant for only a limited number of very high-income countries, whereas for the majority of observations, the relationship is dominated by the declining segment. This pattern aligns with an “energy efficiency Kuznets” relationship. Catching-up economies typically industrialize and invest in energy-intensive industries, whereas wealthier nations, benefitting from stricter regulations, advanced technologies, and heightened environmental preferences, are more capable of enhancing energy efficiency as their incomes increase.
From a policy perspective, these findings have numerous repercussions. To close the efficiency gap between high-performing EU members and underperforming Central, Eastern, and Western Balkan economies, it is essential to not just implement conventional energy efficiency initiatives but also to enhance the alignment of financial institutions with energy and climate goals. This necessitates the implementation of blended-finance instruments that direct both bank-based and market-based financing towards energy-efficient buildings, transportation, industry, and power systems. Secondly, the non-linear correlation between income and TFEE highlights the risk that catching-up economies in the Western Balkans and Eastern EU may experience lower efficiency unless green conditionality and targeted investment support are integrated into their developmental trajectory. The limited influence of FDI and typical credit expansion in explaining TFEE shows that the quality, sectoral distribution, and conditionality of capital flows are more significant than just their mere magnitude.