Article

The Monetary Value of Human Life Losses Associated with COVID-19 in Africa: A Human Capital Approach

by
Joses Muthuri Kirigia
1,* and
Germano Mwabu
2
1
African Sustainable Development Research Consortium (ASDRC), Nairobi P.O. Box 6994-00100, Kenya
2
Department of Economics and Development Studies, University of Nairobi, Nairobi P.O. Box 30197-00100, Kenya
*
Author to whom correspondence should be addressed.
Economies 2025, 13(8), 241; https://doi.org/10.3390/economies13080241 (registering DOI)
Submission received: 27 May 2025 / Revised: 5 July 2025 / Accepted: 9 July 2025 / Published: 16 August 2025
(This article belongs to the Special Issue Human Capital Development in Africa)

Abstract

Background: By 30 June 2021, the 54 African sovereign nations had reported 5,465,790 laboratory-confirmed COVID-19 cases (including 142,171 deaths). This study aimed to estimate the monetary value of human life losses, indirect and direct costs, and the potential cost reductions due to vaccinations for advocacy use by Ministries of Health in Africa. Methods: We employed both the human capital approach to value human lives lost and an abridged total cost-of-illness methodology to estimate the indirect and direct costs of COVID-19 across 54 African countries. The secondary data analyzed was from different sources. Results: The 142,171 human lives lost had an estimated discounted total monetary value of Int$6,684,101,196, i.e., Int$47,015 per life loss and Int$4.88 per person in the population. The estimated total cost of the actual reported 5,514,709 COVID-19 cases was Int$7,155,473,174, which comprised a total direct cost of Int$3,981,927,049 (55.6%) and an indirect cost of Int$3,173,546,125 (44.4%). We projected that vaccination of all the eligible people in the population would potentially save the African continent approximately Int$41,624,735,824. The average total saving per person is approximately Int$30.4. Conclusions: The COVID-19 pandemic resulted in substantial monetary value of human life losses and indirect and direct costs.

1. Background

The African continent, consisting of 54 sovereign countries and four territories (Mayotte, Réunion, Saint Helena, Western Sahara), has an estimated total population of 1.37 billion people (Worldometer, 2021) and a total gross domestic product (GDP) of International Dollars (Int$) 6.86 trillion in 2021 (International Monetary Fund (IMF), 2021). The African Union (AU) projects an economic growth of −0.8% (for 2021) due to Coronavirus Disease (COVID-19), compared to the initial projection of +3.4% for 2020 (African Union (AU), 2020).
As of 30 June 2021, the African continent (comprising 54 sovereign states and four territories) had 5,514,709 confirmed COVID-19 cases, comprising 4,824,876 recovered cases, 547,261 active cases, and 142,572 deaths (Worldometer, 2021). Of the latter, 142,171 deaths were reported by the 54 African sovereign nations, and the remaining 401 deaths (0.28%) by the territories of Saint Helena (0), Mayotte (174), Réunion (226), and Western Sahara (Worldometer, 2021). The study focuses on the 5,465,790 cases reported by the sovereign states and does not include the 48,919 cases reported by the four territories.
To mitigate the adverse socio-economic effects of COVID-19, the AU recommended that African governments should “boost investments that strengthen health systems to enable faster treatment [of infections] and containment” of the pandemic (p. 32) (African Union [AU], 2020). However, there is evidence that the performance of health-related systems in Africa, both before and during the pandemic, has been suboptimal. For instance, concerning (a) national health systems (NHSs), the Universal Health Service Coverage Index was below 50% in approximately 70% of countries (36 out of 54) (WHO, 2021a); (b) in the social determinants of health (SDH) systems, over 50% of the total population in 37 countries did not have basic sanitation services, drinking-water, and handwashing facilities at home (WHO, 2021b); (c) in the national health research systems (NHRSs), the average World Health Organization (WHO) African region NHRS barometer score on the capacity to produce and utilize research findings was below 60% in 2018 (Rusakaniko et al., 2019). The underperformance of especially NHSs has been attributed to underinvestment (Asante et al., 2020) and economic inefficiencies (Nabyonga-Orem et al., 2023). Therefore, there is a need to generate evidence for advocacy to increase investments and improve the efficiency of allocating and utilizing health development resources, continually enhancing the performance of health-related systems in Africa, especially during pandemics.
According to Rice (2000) and the World Health Organization (WHO, 2009, 2001), estimates of the money value of human life expressed in terms of foregone lifetime earnings are needed by health development policymakers for use in raising public health awareness and advocating with governments, private sector, and other stakeholders for increased and sustained investments in health-related systems for attainment of United Nations Sustainable Development Goal 3 (SDG3) on ensuring healthy lives and promoting well-being for all people (including those at risk of COVID-19 infection) at all ages (United Nations [UN], 2015). Since the ministers of finance and the private sector chief executive officers who control resources for addressing health determinants are not usually public health experts, they may not fully appreciate the adverse effects of non-fatal disability and premature mortality from COVID-19 on macroeconomic indicators, such as the GDP (WHO/AFRO, 2006). Therefore, Ministries of Health could utilize evidence of the monetary value of human lives and productivity losses in their advocacy and collaboration with other government sectors and stakeholders to prevent or reduce deaths and non-fatal disabilities.
Niewiadomski et al. (2025) conducted a systematic review of the evidence on productivity losses resulting from health problems associated with the COVID-19 pandemic, based on data from population-level studies. Out of 38 studies eligible for review, 79% used the Human Capital Approach. Of the 33 studies eligible for quantitative comparison, the authors found that the productivity losses ranged from 0 to 2.1% of gross domestic product. Hanly et al. (2022) applied the human capital approach to estimate premature mortality productivity costs (indirect costs) associated with COVID-19 across nine countries (Belgium, France, Germany, Italy, the Netherlands, Portugal, Spain, Sweden and Switzerland) in Europe. Similar studies are relatively limited on the African continent.
Thus, a rapid study was necessary to utilize the most recent secondary data to address three research questions. (a) What is the discounted monetary value of the cumulative number of human lives lost due to COVID-19 in Africa from the beginning of the pandemic till 30 June 2021? (b) What is the approximate magnitude of the direct health systems costs incurred in preventing and managing COVID-19 infections in Africa? (c) What is the approximate cost saving anticipated from COVID-19 vaccinations?
The specific study objectives were the following: (a) To estimate the discounted monetary value of the cumulative number of human life losses in Africa associated with COVID-19 as of 30 June 2021. (b) To estimate the indirect and direct costs associated with the actual reported COVID-19 infections in Africa. (c) To project potential savings or reductions in indirect and direct health system costs, assuming 100% of the target population in Africa is vaccinated against COVID-19.

2. Methods

This section outlines the methods employed to achieve the study objectives stated above.

2.1. Study Area and Population

As already stated, the analysis reported in this paper is on the 54 sovereign states of the African continent (See Supplementary Table S1). Therefore, the analysis focuses on Africa’s sovereign states, with 5,465,790 laboratory-confirmed COVID-19 cases (including 142,171 deaths) as of 30 June 2021 (Worldometer, 2021). Supplementary Table S2 summarizes the 4,794,317 recovered cases, 529,302 active cases, and 142,171 deaths from COVID-19 reported among sovereign states as of 30 June 2021 (Worldometer, 2021).

2.2. Study Design

We utilized a cross-sectional study design to collate administrative data on variables used in the analysis from secondary sources.

2.3. Conceptual Framework for Valuation of Human Life

2.3.1. Overview

As Drummond et al. (2015) explain, three approaches exist to assign monetary values to health outcomes, such as human life. First, the willingness to pay (WTP) (or contingent valuation) approach uses survey methods to reveal the maximum amount households (or individuals) would hypothetically be willing to pay for a program (or intervention) that could potentially reduce the probability of a loss of a statistical life (i.e., the life of an unknown person) (Mooney, 1977). Some strengths of the WTP approach, as highlighted by Mooney (1977) and Jones-Lee (1982, 1985), include its ability to value non-economic aspects of the intervention (e.g., the intrinsic pleasure of being alive or disease-free) and its incorporation of consumer preferences. On the other hand, the approach’s main weaknesses are as follows: healthcare consumers (patients) may not be rational and sovereign decision-makers, assume that individual preferences are static, WTP is a function of income and wealth only, and may be prone to response bias (Jones-Lee, 1982; Mooney, 1977). Moreover, applying the WTP approach was impossible due to the ongoing community circulation of various COVID-19 variants and the challenges of obtaining telephone numbers to administer WTP questionnaires remotely.
The second approach is the implied values (or revealed preferences) method (IVA). The IVA is based on the values placed on preventing loss of life by past individuals or political decision-makers (Mooney, 1977). One strength of IVA is that it relies on actual, implied life values in various health-related policy contexts. A politically designated person (e.g., a Member of Parliament) provides the values, and the information is readily available in public sector documents (Mooney, 1977). However, the weaknesses of IVA include the following: decisions to invest in specific health projects are not determined by popular vote and might thus suffer from selection bias; similar lives may be valued differently depending on the public sector with which the person providing values is affiliated; the requirement values provided need to be consistent across the statistical lives being valued and cannot be met by such implicit and arbitrary valuations based on political processes and their outcomes (Mooney, 1977; Jones-Lee, 1982).
The third method is the human capital approach (HCA), which was first applied by Petty (1699) in the 17th Century and whose theoretical underpinning was developed much later by Fein (1958), Mushkin and Collings (1959), Weisbrod (1971), and Landefeld and Seskin (1982). HCA values life in terms of the present value of future output lost (as proxied by potential earnings lost) due to premature mortality from any cause, e.g., malaria (Chima et al., 2003), non-communicable diseases (Kankeu et al., 2013), and COVID-19 (Musango et al., 2024). The method’s strengths include ease of understanding by policymakers, the use of objective data on earnings, and the routine collection of data on morbidity and mortality (Mooney, 1977). However, according to Mooney (1977), the weaknesses of HCA include its focus on the livelihoods that people obtain from good health rather than the benefits of health per se, disregard for current preferences of potential beneficiaries, attachment of greater weight to the lives of the wealthy, and discrimination against those not in the labor market, e.g., homemakers, the retired, the unemployed, the severely handicapped, and children below the minimum work-age limit. In the study reported in this paper, the HCA was applied due to its strengths, the unfeasibility of collecting primary data due to the global COVID-19 pandemic at the time, and the availability of secondary data on GDP per capita, current health expenditure per capita, average life expectancy, and the number of COVID-19 deaths for all countries in Africa.

2.3.2. An HCA Model for Estimating the Discounted Monetary Value of Human Life Losses Associated with COVID-19

In line with the WHO guidelines on the measurement of the economic impact of disease and injuries (WHO, 2009) and recent empirical COVID-19 studies (Musango et al., 2024), the current study estimated the monetary value of discounted aggregate flows of the current and future consumption of non-health goods and services foregone due to premature mortality (at 16 age groups) attributed to COVID-19. The current study used non-health GDP per capita in the estimations of the value of each statistical human life lost to COVID-19 in Africa. The non-health GDP per capita is the difference between GDP per capita and current health expenditure per capita for each sovereign state. According to Grossman (2000), an individual derives utility (happiness) from health, rather than from the consumption of healthcare. Thus, the demand for healthcare and other health inputs is derived from the basic demand for health.
The African continent’s total monetary value (TMVAfrica) of human life losses associated with COVID-19 is the sum of each of the 54 countries’ total monetary value (TMVj=1,...,54) (Kankeu et al., 2013; Weisbrod, 1971). Formulaically, the value is the following:
T M V A f r i c a = i = 1 i = 54 T M V j = 1 , . . . , 54
Further, each of the jth country’s TMV of human life losses from COVID-19 was estimated using the following formula (Kankeu et al., 2013; Musango et al., 2024):
T M V j = i = 1 i = 16 M V i = 1 , , 16
where,
i = 1 i = 16 ( . ) is the sum of discounted monetary values of human losses from COVID-19 in age groups 1 = 0–4 years, 2 = 5–9 years, 3 = 10–14, 4 = 15–19 years, 5 = 20–24 years, 6 = 25–29 years, 7 = 30–34 years, 8 = 35–39 years, 9 = 40–44 years, 10 = 45–49 years, 11 = 50–54 years, 12 = 55–59 years, 13 = 60–64 years, 14 = 65–69 years, 15 = 70–74 years, and 16 = 75 years and older; and MVi is the monetary value of a life lost for the ith age group. Only South Africa and Tunisia reported COVID-19 deaths in the 16 age groups. The breakdown of deaths associated with COVID-19 by the 16 age groups was unavailable for 52 countries. Since the COVID-19 deaths age breakdown was not available for other African countries, the age distribution for the two countries was used to break down the deaths sustained in the remaining 52 countries.
The discounted MVi per age group was estimated using the following equation (Kankeu et al., 2013; Musango et al., 2024):
M V i = t = 1 t = n 1 / 1 + r t × G D P P C j C E H P C j × A L E j A A D i × T C O V D j × P i
where t = 1 t = n ( . ) is the summation from the first year of life lost (t = 1) to the last year of life lost (t = n) per death in an age group; r is the discount rate, i.e., 3% in the current study; GDPPCj is the GDP per capita for the jth country in 2021; CEHPCj is the current expenditure on health per capita in the jth country in 2021; ALEj is the national average life expectancy in country j; AADi is the average age at the onset of death in ith age group; TCOVDj is the total number of human lives lost from COVID-19 in the jth country as of 30 June 2021; and Pi is the proportion of COVID-19 deaths borne by age group i. The base year for the calculations was 2021.

2.3.3. Data and Data Sources

The monetary value of human life losses associated with COVID-19 in 54 African countries was calculated using eight data types. First, the discount rates of 3%, 5%, and 10% are commonly used in health-related studies, such as those by Musango et al. (2024), Haacker et al. (2020), Attema et al. (2018), and Edejer et al. (2003). Second, the data on the cumulative number of human lives lost from COVID-19 per country in Africa as of June 30, 2021, from the Worldometer Coronavirus Disease (COVID-19) Pandemic Database (Worldometer, 2021) (See Supplementary Table S2).
Third, the per capita GDP (GDPPC) in 2021 International Dollars or purchasing power parity (PPP) per country from the IMF World Economic Outlook Database (See Supplementary Table S3) (International Monetary Fund [IMF], 2021). Fourth, the current expenditure on health per capita in 2021 International Dollars was projected using information from the WHO Global Health Expenditure Database (See Supplementary Table S4) (WHO, 2019a).
Fifth, the distribution of COVID-19-associated deaths across 16 age groups was unavailable for all 54 countries. It was only available for South Africa (Statista, 2021a) and Tunisia (Statista, 2021b). As explained in Section 2.3.2, the age distribution for the two countries was used to break down COVID-19 deaths in other African countries. Therefore, using the age structure of COVID-19 deaths in South Africa and Tunisia to break down deaths sustained in the remaining 52 African countries assumes that the distribution in these two countries reflects their general population distribution.
Table 1, column 2 presents South Africa’s age distribution of COVID-19 deaths (Statista, 2021a). The 16 age-group proportions for South Africa were applied to Angola, Botswana, Burundi, Comoros, Democratic Republic of the Congo, Eswatini, Kenya, Lesotho, Madagascar, Malawi, Mauritius, Mozambique, Namibia, Rwanda, Seychelles, South Africa, South Sudan, Tanzania, Uganda, Zambia, Zimbabwe, i.e., the East African Community [EAC] and Southern African Development Community [SADC] countries.
On the other hand, the COVID-19 deaths age group distribution for Tunisia is displayed in Table 1, column 3 (Statista, 2021b). These proportions were applied to member countries of the Arab Maghreb Union [AMU] (Algeria, Libya, Mauritania, Morocco, Tunisia), the Central African Economic and Monetary Community [CEMAC] (Cameroon, Chad, the Central African Republic, Equatorial Guinea, Gabon, the Republic of Congo, Sao Tome and Principe), and the Economic Community of West African States [ECOWAS] (Benin, Burkina Faso, Cabo Verde, Cote d’Ivoire, The Gambia, Ghana, Guinea, Guinea-Bissau, Liberia, Mali, Niger, Nigeria, Senegal, Sierra Leone, Togo). Although Angola and the DRC are members of both CEMAC and SADC, Burundi and Rwanda are members of both EAC and CEMAC. The age distribution for South Africa was applied to these four countries.
Sixth, the average life expectancy (ALE) for each country was extracted from the Worldometer Database (See Supplementary Table S5) (Worldometer, 2021). The world’s highest average life expectancy at birth, 88 years for females in Hong Kong, was used in the sensitivity analysis from the same database.

2.3.4. Data Analysis

Equations (1)–(3) were estimated using Microsoft Excel software (Microsoft Corporation, New York, NY, USA), and the analysis involved 12 steps.
Step 1: Equations (2) and (3), presented in Section 2.3.2, were constructed into 54 Excel sheets (i.e., one sheet per country) to calculate the MVi per ith age group. The summation operation derives the jth country’s TMV of human life losses from COVID-19.
Step 2: Equation (1) was incorporated into a separate Excel sheet to derive the TMVAfrica of human life losses associated with COVID-19, i.e., to calculate the total monetary value for each of the 54 countries.
Step 3: In each country, the number of COVID-19 deaths per age group is equal to the total number of deaths from COVID-19 multiplied by the respective age group proportion (see Supplementary Table S6). For example, Algeria had lost 3708 lives to COVID-19 by 30 June 2021, and the proportion of these deaths in the 45–49-year age group was 0.0105128569399062 (1.051%). Thus, the number of deaths borne by the 45–49-year-olds equals 39, i.e., 3708 times 0.0105128569399062.
Step 4: Since the latest current expenditure on health per capita (CEHPC) available at the time in the WHO Global Health Expenditure Database was for 2018 (at the time of the analysis), it was necessary to forecast each country’s CEHPC for 2021 using existing 2017 and 2018 data (see Supplementary Table S4). The CEHPC growth rate between the years 2017 (CEHPC2017) and 2018 (CEHPC2018) equals [(CEHPC2018 − CEHPC2017)/CEHPC2017]. For example, Algeria’s CEHPC in 2017 was Int$970.26824951, and its CEHPC in 2018 was Int$962.71936035. The growth rate between 2017 and 2018 equals −0.00778020837414019, i.e., [(962.71936035 − 970.26824951)/970.26824951]. Thus, the projections across the years 2019 to 2021 assume that the growth rate between 2017 and 2018 will be sustained, i.e., it will remain constant.
Step 5: The non-health GDP per capita (NHGDPPCj) for each of the 54 countries was calculated by subtracting the respective CEHPC from GDPPC (see Supplementary Table S4). For instance, since Algeria’s GDP per capita was Int$11,435 and CEHPC was Int$940 in 2021, the non-health GDP per capita equals Int$10,495, i.e., 11,435 minus 940.
Step 6: The average age at onset of death (AADi) for each of the first 15 age groups in Table 2 was calculated as a simple average, e.g., the AAD for 0–4-year-olds equals 2 years, which is (0 + 4)/2. We assumed an AAD of 75 years for those 75 years and older. There was no individual country-specific data on the number of deaths at each age that could have shown variations across countries. Therefore, the mid/average age for each of the 16 age groups was used to construct the average age at death.
Step 7: The undiscounted years of life lost (UDYLL) for each age group was estimated as the difference between the respective country’s ALE and the group’s AADi. For example, given that the ALE for Algeria was 77.5 years and the AAD for the 45–49 age group was 47 years, UDYLL = 77.5 − 47 = 30.5 years.
Step 8: The UDYLLs estimated in Step 7 were discounted (at a rate of 3%) because people prefer health (or monetary) benefits today rather than in the future. Drummond et al. (2015) explained that people might have a positive rate of time preference because they have a short-term view of life, uncertainties regarding the future, and positive economic growth. The discounted year of life (DYLL) was calculated by multiplying each UDYLL by the corresponding discount factor. For example, the discount factor for the first YLL = 1/(1 + r)t = 1/(1 + 0.03)1 = 0.970874. The discount factor for the thirty-first YLL = 1/(1 + r)t = 1/(1 + 0.03)31 = 0.399987. The summation of discount factors from the first YLL to the thirty-first YLL (see Step 7) in Algeria yields 20 discounted YLL (DYLL).
Step 9: The discounted monetary value (MVi) per ith age group is the product of DYLL, NHGDPPCj, and the number of COVID-19 deaths per age group (TCOVDj). The calculation can be illustrated using the age group 44–49 years in Algeria, where DYLL44–49 = 20 years (from Step 8), NHGDPPC = $10,495 (see Step 5), and TCOVD44-49 = 39 deaths (see Step 3). The MV for 44–49-year-olds = DYLL44–49 × NHGPP × TCOVD44–49 = 20 × 10,495 × 39 = Int$8,186,100. The monetary values for the remaining 15 age groups were calculated similarly, applying Equation (3).
Step 10: Applied Equation (2) to sum up the monetary values of human lives lost in the 16 age groups to yield the TMV for each country.
Step 11: Equation (3) was used to sum up the TMVs across the 54 countries to derive the total continental loss.
Step 12: Sensitivity analysis. In the baseline model used to estimate each country’s TMV, we assumed (a) a 3% discount rate and (b) each country’s ALE. There is no consensus in the published literature regarding the two variables; thus, uncertainty exists. In such a situation, it is standard practice in epidemiology (Thabane et al., 2013) and health economics (Drummond et al., 2015) to rerun the model with different variable values to assess the robustness and credibility of the result(s), e.g., the TMV in our case. Therefore, as conducted in past health economics studies in Africa and elsewhere, we re-estimated the economic model using 3%, 5%, and 10% discount rates, while holding other variables, such as the number of COVID-19 deaths per country, per capita GDP, and CEHPC, constant. Furthermore, in line with past practice, the economic model was rerun three times using each country’s ALE (See Supplementary Table S5); the highest ALE in Africa was 77.5 years, and the world’s highest ALE was 88 years among females in Hong Kong (Worldometer, 2021).

2.4. Conceptual Framework for Estimating the Cost of COVID-19 in Africa

The total economic cost of COVID-19 (TCCOVID-19) encompasses total indirect costs ( T I C C O V I D - 19 ), total direct costs ( T D C C O V I D - 19 ), and psychic/intangible costs ( T P C C O V I D - 19 ), i.e.,
T C C O V I D - 19 = T I C C O V I D - 19 + T D C C O V I D - 19 + T P C C O V I D - 19

2.4.1. Total Indirect Cost Algorithm

T I C C O V I D - 19 = V P Y L L C O V I D - 19 + V P T L N F L + V F T L
where V P Y L L C O V I D - 19 is the value of potentially productive YLL due to premature death from COVID-19 among those within the working-age bracket (i.e., 15–64 years) in country j; V P T L N F L is the value of productive time lost among non-fatal COVID-19 cases in a specific working-age bracket; V F T L is the value of work time lost among all family members (and friends) of working-age accompanying and/or visiting patients.
V P Y L L C O V I D - 19 = T M V 15 64 × L F P R
where T M V 15 64 is the jth country’s total monetary value of YLL in 15–64 age bracket (see Section 2.3.2); LFPR is the proportion of jth country’s working-age population that actively engages in the labor market, either by working or looking for work (see Supplementary Table S7) (World Bank, 2021). In principle, the workforce participation rates in the ten age groups within the 15–64-year productive bracket would be expected to vary. In addition, there is evidence that those aged 50 years and above are more incapacitated by COVID-19 infections than those in younger age groups (15–49 years). However, due to the unavailability of disaggregated data on LFPR by the ten age groups between 15 and 64 years, we assumed that the LFPR does not vary by age.
V P T L N F L = N R C × N D D R × W D + N A C × N D D A × W D
where,
N R C is the number of persons that recovered from COVID-19 infection in country j; N D D R is the number of disability days per recovered person, i.e., from the time one tested positive to the time one tested negative for COVID-19; W D is the wage per day, which is assumed to be equal to jth country GPDPC divided by the number of working days per year; N A C is the number of active COVID-19 cases; N D D A is the number of disability days per active COVID-19 case.
V F T L = N V × N A P × N V D × W D
where,
N V is the number of COVID-19 laboratory-diagnosed cases in country j; N A P is the average number of working-age family members and friends accompanying and visiting COVID-19 patients; N V D is the average number of days visited by a family/friend per COVID-19 patient. Unfortunately, in the study reported in this paper, it was not feasible to estimate both the productive time lost among non-fatal working-age COVID-19 cases and the accompanying/visiting family members and friends ( V P T L N F L and V F T L ) because of research resource constraints and community spread of infections.
In the current study, T I C C O V I D - 19 of a country j is assumed to be equal to the V P Y L L C O V I D - 19 , i.e., the total value of potentially productive YLL due to premature death from COVID-19 among those within the working-age bracket (i.e., 15–64 years). Therefore, the average indirect cost per COVID-19 death in country j A T I C j was estimated using the following formula:
A T I C j = V P Y L L C O V I D - 19 / T C O V D j
where,
V P Y L L C O V I D - 19 , as previously defined, is the value of potentially productive YLL due to premature death from COVID-19 among those within the working-age bracket (i.e., 15–64 years) in country j; T C O V D j is the total number of COVID-19-associated deaths within the 15–64-year age bracket in country j. For example, in Algeria, V P Y L L C O V I D - 19 equals Int$ 50,625,695 and T C O V D j equals 684. Thus, A T I C 15 64 = 50,625,695 / 684 = 74,040.2 .

2.4.2. Total Direct Cost Algorithm

In the context of COVID-19, the total direct cost of COVID-19 ( T D C C O V I D - 19 ) has three components. First, the monetary value of quantities of inputs (resources) borne by the government and private sector organising and operating national health system services related to prevention (personal hygiene—handwashing, sanitizing, washing potentially contaminated clothes), wearing facial masks, physical distancing, health education (information, education, communication), diagnosis, contact tracing, isolation/quarantine, community-based management (of mild and moderate cases), hospital management and rehabilitation of severe cases, and transport of persons with COVID-19 symptoms to testing and treatment centers, and transport of accompanying family persons ( T N H S C C O V I D - 19 ).
Second, the monetary value of quantities of inputs borne by other sectors involved in combating the community spread of COVID-19 infections ( T O S C C O V I D - 19 ). For example, inputs incurred by Ministries of Water and Sanitation in availing potable water; inputs incurred by the Ministries of Interior Security in policing implementation of COVID-19-related public health regulations, such as the mandatory wearing of facial masks, physical distancing, policing of travel bans, policing of operating hours of restaurants, policing of seat spacing and disinfecting in public transport vehicles; and Ministries of Transport role in issuance and implementation of COVID-19-related public health regulations related to all modes of transport internally and external entry and exit points.
Third, the direct out-of-pocket payments (OOPs) incurred by households related to payments for preventive inputs (e.g., facial masks, hand sanitizers, soap, water, hand towels); transportation of COVID-19 patients and accompanying family members (or friends) to testing and isolation/treatment centers; COVID-19 diagnostic tests; health workers consultation services; medicines for COVID-19-positive persons at health system institutions and community/home setting; COVID-19 vaccine; and informal payments to access vaccines ( T O O P S C O V I D - 19 ) (Onwujekwe et al., 2023).
Algebraically, we have the following:
T D C C O V I D - 19 = T N H S C C O V I D - 19 + T O S C C O V I D - 19 + T O O P S C O V I D - 19
Under ideal COVID-19-free conditions, estimating equation nine would have entailed conducting detailed costing surveys at the household (community level) and COVID-19 testing (diagnostic) and treatment centers to collect primary data on quantities and prices of various inputs. However, due to the ongoing community circulation of COVID-19 (at the time of the study) and a limited research budget compared to the expected considerable cost of conducting household and health-facility-based surveys in all African countries, it was not feasible to collect primary data.
Therefore, in the absence of primary cost data, researchers estimated the total direct cost associated with prevention, diagnosis, contact tracing, isolation/quarantine, management, and rehabilitation of COVID-19 ( T D C C O V I D - 19 ) through the multiplication of the total number of reported COVID-19 cases per country ( T C O V I D C A S E S j ) by the total current expenditure on health per capita per country ( C E H P C j ). According to the Organisation for Economic Co-operation and Development [OECD] (2000), the CEHPC includes expenditures on personal health care services and goods (services of curative care, services of rehabilitative care, services of long-term nursing care, ancillary services to health care, medical goods dispensed to out-patients), prevention and public health services (health promotion, epidemiological surveillance, blood-bank operation, public health service laboratories, and population planning services), and health administration and health insurance (includes activities performed by private insurers and national and local authorities plus social security funds).
Algebraically, we have the following:
T D C C O V I D - 19 = T C O V I D C A S E S j × C E H P C j
For illustration, in Algeria, T C O V I D C A S E S A l g e r i a equals 139,229 total cases reported as of 30 June 2021, and C E H P C A l g e r i a equals Int$940 in 2021. Thus,
T D C A l g e r i a = 139229 × 940 = I n t $ 130,934,190 .
The estimation of Equation (10) is based on three assumptions:
  • CEHPC is a good proxy for the value of all health-related systems inputs used in prevention (including policing of travel bans), diagnosis, contact tracing, isolation/quarantine, management, and rehabilitation of COVID-19 cases;
  • CEHPC is efficiently utilized in each country to manage COVID cases, ensuring no wastage in the allocation and use of resources;
  • All COVID-19 patients have an equal quantity (and value) of resources spent on them, irrespective of whether the cases are asymptomatic, mild, moderate, severe, or critical.
Our estimation of total direct cost using Equation (10) has two shortcomings: (a). Capital formation of healthcare provider institutions was not included due to the unavailability of data per country in the WHO Global Health Expenditure Database (WHO, 2019a). (b). The equation does not include the COVID-19 laboratory test cost among negative cases. If the data on the average cost per COVID-19 test ( A L T E S T C j ) were available in the jth country, the total laboratory test cost for negative cases would have been equal to T C O V I D N E G j × A L T E S T C j , where T C O V I D N E G j is the total number of cases that tested negative for COVID-19 per country, i.e., the total number of cases tested for COVID per jth country minus the total number of cases that tested positive.

2.4.3. Total Intangible Cost Algorithm

The intangible cost refers to the adverse effect on social welfare (mental health and psychosocial wellbeing) of those who test positive for COVID-19 and their loved ones (Geirdal et al., 2021). How? First, people who test positive for COVID-19 are expected to self-isolate to minimize the risk of spreading the infection to family, friends, workmates, and the public. According to Cesare (2020), such people may experience shame and guilt about the possibility of transmitting the infection to others.
Second, people with moderate to severe COVID-19 disease may be quarantined (confined) in treatment centers where family and friends are not allowed to visit them. As a result, according to Dubey et al. (2020), this group of patients may experience loneliness, anxiety, depression, and increased substance dependence.
Third, studies have revealed that people who test positive for COVID-19 (Bhanot et al., 2021; Gronholm et al., 2021) and healthcare providers experience some form of stigma and hence, avoidance by communities for fear of infection (Mostafa et al., 2020). Fourth, according to Cabarkapa et al. (2020), family, friends and workmates may experience psychological stress witnessing the pain and suffering and ensuing decrease in the health of those infected by COVID.
The abovementioned psychosocial consequences of COVID-19 on patients, family and healthcare providers are somewhat difficult to measure and value monetarily. However, as demonstrated in the study on osteoarthritis by Cross et al. (2000), arthritis by Slothuus and Brooks (2000), malaria by Jimoh et al. (2007), and HIV/AIDS by Adekunjo et al. (2020), decrements in health status due to various forms of pain and suffering can potentially be measured using the willingness-to-pay (contingent valuation) (WTP) approach. In the context of COVID-19, the WTP approach has been applied in the valuation of the installation of an early warning system for infectious diseases (Himmler et al., 2022), and COVID-19 vaccine (Cerda & García, 2021) in Europe, WTP per DALY saved through early implementation of movement restriction policies (MRPs) (Zhao et al., 2021) and COVID-19 vaccine demand (Lin et al., 2020) in China, WTP for prospective COVID-19 vaccine in Nigeria (Ilesanmi et al., 2021), and WTP for a hypothetical COVID-19 Vaccine in Italy, Spain, UK, and USA by Catma and Varol (2021) and Costa-Font et al. (2021).
Therefore, erosion in health status is associated with increased anxiety, depression, insomnia, loneliness, self-harm, and stigma/discrimination, and substance abuse (Kumar & Nayar, 2021) associated with COVID-19 infection can be quantified and valued through the WTP approach. It would involve using survey methods, presenting respondents with hypothetical scenarios to reveal the maximum they would be willing to pay for a COVID-19 intervention that reduces the probability of experiencing negative psychosocial consequences of COVID-19 infection.
The intangible cost of COVID-19 can be derived using the following formula:
T I C C O V I D - 19 = T C O V I D C A S E S j × A W T P j
where,
T C O V I D C A S E S j , as previously defined, is the total number of reported COVID-19 cases per jth country and A W T P j is the average amount of money a person would be willing to pay to finance an intervention to prevent COVID-19 infection and, hence, avert the associated negative psychosocial consequences. Given the limited budget and scope of the current study, it was not feasible to conduct a contingent valuation study to elicit willingness to pay for an intervention that would reduce the probability of COVID-19 infection and, hence, avert associated intangible consequences. It is worth clarifying that the WTP here would only be used for payment to avoid intangible welfare loss.

2.5. Estimation of Potential Savings Assuming a 100% Vaccine Target Population Coverage

Our study estimates the potential savings from COVID-19 vaccination, assuming 100% coverage, rather than the prevailing coverage levels in Africa, which are currently very low. The potential monetary savings associated with vaccination equal total direct cost savings plus indirect cost savings.

2.5.1. Expected Savings in Total Direct Costs Due to COVID-19 Vaccinations

The expected total direct cost savings per country due to vaccination with the Oxford–AstraZeneca vaccine were estimated in seven steps.
Step 1: The 2021 population estimates for each of the 54 African countries were obtained from Worldometer (2021).
Step 2: A search in the PubMed.com database for the Oxford–AstraZeneca vaccine effectiveness revealed an article by Voysey et al. (2021) that reported a pooled analysis of four randomized trials (Brazil, South Africa, and the UK) with 8597 participants receiving the ChaAdOx1 nCoV-19 (Oxford–AstraZeneca vaccine) and 8581 receiving a control vaccine or saline. The study found an “Overall vaccine efficacy more than 14 days after the second dose was 66.7% (95% CI 57.4–74.0), with 84 (1.0%) cases in the 8597 participants in the ChAdOx1 nCoV-19 group and 248 (2.9%) in the 8581 participants in the control group (p. 881)”.
Step 3: Use the evidence in Step 2 to estimate the COVID-19 infection risk without I R C o n t r o l and with Oxford–AstraZeneca I R A Z in the Voysey et al. (2021) pooled analysis of randomized trials in Brazil, South Africa, and the UK. The infection risk in a group equals the number of infected people divided by the group size (see Table 3).
Step 4: Estimate the number of people in the jth country that would be expected to contract COVID-19 without vaccination P o P I w i t h o u t . The number of people in each of the 54 African countries expected to contract COVID-19 without vaccination was obtained by multiplying the respective country’s population P o P j by the I R C o n t r o l of 0.02890106 (See Supplementary Table S8). In Algeria, for example, the number of people expected to contract COVID-19 without vaccination equals 44,634,463 persons times 0.02890106, i.e., P o P I w i t h o u t = P o P A l g e r i a × I R C o n t r o l = 44,634,463 × 0.02890106 = 1,289,983 .
Step 5: Estimate the number of people in the jth country that would be expected to contract COVID-19 with the Oxford–AstraZeneca vaccination P o P I w i t h . The number of people in each of the 54 African countries expected to contract COVID-19 with vaccination was obtained by multiplying the respective P o P j by I R A Z of 0.00977085 (See Supplementary Table S8). In Algeria, for instance, the number of people expected to contract COVID-19 with vaccination equals 44,634,463 persons times 0.00977085, i.e., P o P I w i t h = P o P A l g e r i a × I R A S = 44,634,463 × 0.00977085 = 436,117 .
Step 6: The number of infections averted, assuming 100% population coverage, equals the difference between the number of people expected to contract COVID-19 without and with vaccination, i.e., P o P I w i t h o u t P o P I w i t h . In the case of Algeria, the infections averted through 100% vaccination coverage with Oxford–AstraZeneca equals 853,867, which is 1,289,983 (from Step 4) minus 436,117 (from Step 5).
Step 7: The total direct cost savings expected by the jth country from vaccination equals the number of infections averted (from Step 6) multiplied by the total current health expenditure per capita. For instance, the expected savings in Algeria equal Int$802,996,067, i.e., 853,867 infections averted (from Step 6) times CEHPC of Int$940.423260222453.
Step 8: The total direct cost savings for Continental Africa were calculated by summing the savings for each country, as obtained in Step 7, across the 54 countries in the continent.

2.5.2. Expected Savings in Total Indirect Costs Due to COVID-19 Vaccination

We estimated the expected savings in total indirect costs resulting from COVID-19 vaccination in each of the 54 countries by following the eight steps below.
Step 1: A search in the PubMed.com database for COVID-19 vaccine effectiveness in reducing the risk of death revealed an article by Bernal et al. (2021), which attempted “To estimate the real-world effectiveness of the Pfizer-BioNTech BNT162b2 and Oxford–AstraZeneca ChAdOx1-S vaccines against confirmed COVID-19 symptoms, admissions to hospital, and deaths” (p. 1).
Step 2: Utilize the evidence in Step 1 to calculate the risk of COVID-19 resulting in death among the unvaccinated D R u n v a c c i n a t e d and those vaccinated with the Pfizer-BioNTech BNT162b2 D R P B . The risk of death in a group equals the number of deaths from COVID-19 in an age group divided by the total number of cases in the group (see Table 4).
Step 3: Estimate the number of people infected in the jth country expected to die from COVID-19 without vaccination P o P D w i t h o u t . The number of people in each of the 54 African countries expected to die from COVID-19 without vaccination was obtained by multiplying the respective country’s P o P I w i t h o u t by the D R u n v a c c i n a t e d of 0.131380546 (See Supplementary Table S9). In Algeria, for example, the number of COVID-19-positive people expected to die without vaccination equals 1,289,983 times 0.131380546, i.e., P o P D w i t h o u t = P o P I w i t h o u t × D R u n v a c c i n a t e d = 1,289,983 × 0.131380546 = 169,479 .
Step 4: Estimate the number of people in the jth country that would be expected to die from COVID-19 even though vaccinated with Pfizer-BioNTech BNT162b2 P o P D w i t h through the multiplication of the number of people expected to contract COVID-19, even after being vaccinated P o P I w i t h (from Step 5 of Section 2.5.1) by the probability of death in a vaccinated group D R P B of 0.068 (See Supplementary Table S9). In Algeria, for instance, the P o P I w i t h equals 436,117 persons times D R P B of 0.068, i.e., P o P D w i t h = P o P I w i t h × D R P B = 436,117 × 0.068 = 29,656 .
Step 5: The number of COVID-19-associated deaths prevented C O V I D - 19 D P r e v e n t e d across all age groups, assuming that 100% of the population’s vaccine coverage equals the difference between the number of people expected to die from COVID-19 without and with vaccination, i.e., P o P D w i t h o u t P o P D w i t h . In the Algeria example, the number of deaths in all age groups prevented through 100% vaccination coverage equals 139,823, i.e., 169,479 (from Step 3 in Section 2.5.2) minus 29,656 (from Step 5 in Section 2.5.2).
Step 6: The number of COVID-19 deaths prevented within the productive age group 15–64 years equals C O V I D - 19 D P r e v e n t e d times the proportion of deaths in that age group (i.e., 0.184401193351328). In Algeria, for instance, the projected total number of deaths prevented in the 15–64 age group equals 25,783.5, i.e., 139,823 (from Step 5 Section 2.5.2) times 0.184401193351328.
Step 7: The indirect cost savings expected by the jth country from deaths prevented by vaccination equals the number of deaths prevented in the age group 15–64 years C O V I D - 19 D P r e v e n t e d (from Step 6 in Section 2.5.2) times the average indirect cost per COVID-19 death in country j A T I C j (from Section 2.4.1 Equation (9)). For instance, the expected savings from COVID-19-associated deaths prevented in Algeria equals Int$1,909,014,416, i.e., 25,783.5 deaths prevented times the indirect cost per death from COVID-19 of Int$74,040.2. The indirect cost savings for the remaining 53 countries were estimated in a similar manner.
Step 8: Continental Africa indirect cost savings were obtained by summing the indirect cost savings for each country, as calculated in Step 7, across the 54 countries.

3. Results

3.1. Discounted Monetary Value of Human Life Losses Associated with COVID-19

Monetary Value of Human Life Losses at a 3% Discount Rate and National Life Expectancies at Birth

Table 5 shows that as of 30 June 2021, Africa had incurred 142,171 human life losses due to COVID-19, with an estimated discounted total monetary value (TMV) of Int$6,684,101,196. Twenty countries (37.04%) of all the 54 countries had TMV of less than Int$1 million; 16 (29.63%) countries had between Int$1 million and Int$10 million; and 18 (33.3%) countries had Int$11 million and above.
As depicted in Figure 1, the TMV varied widely from a minimum of Int$14,300 in the Central African Republic to a maximum of Int$3,739,829,800 in South Africa.
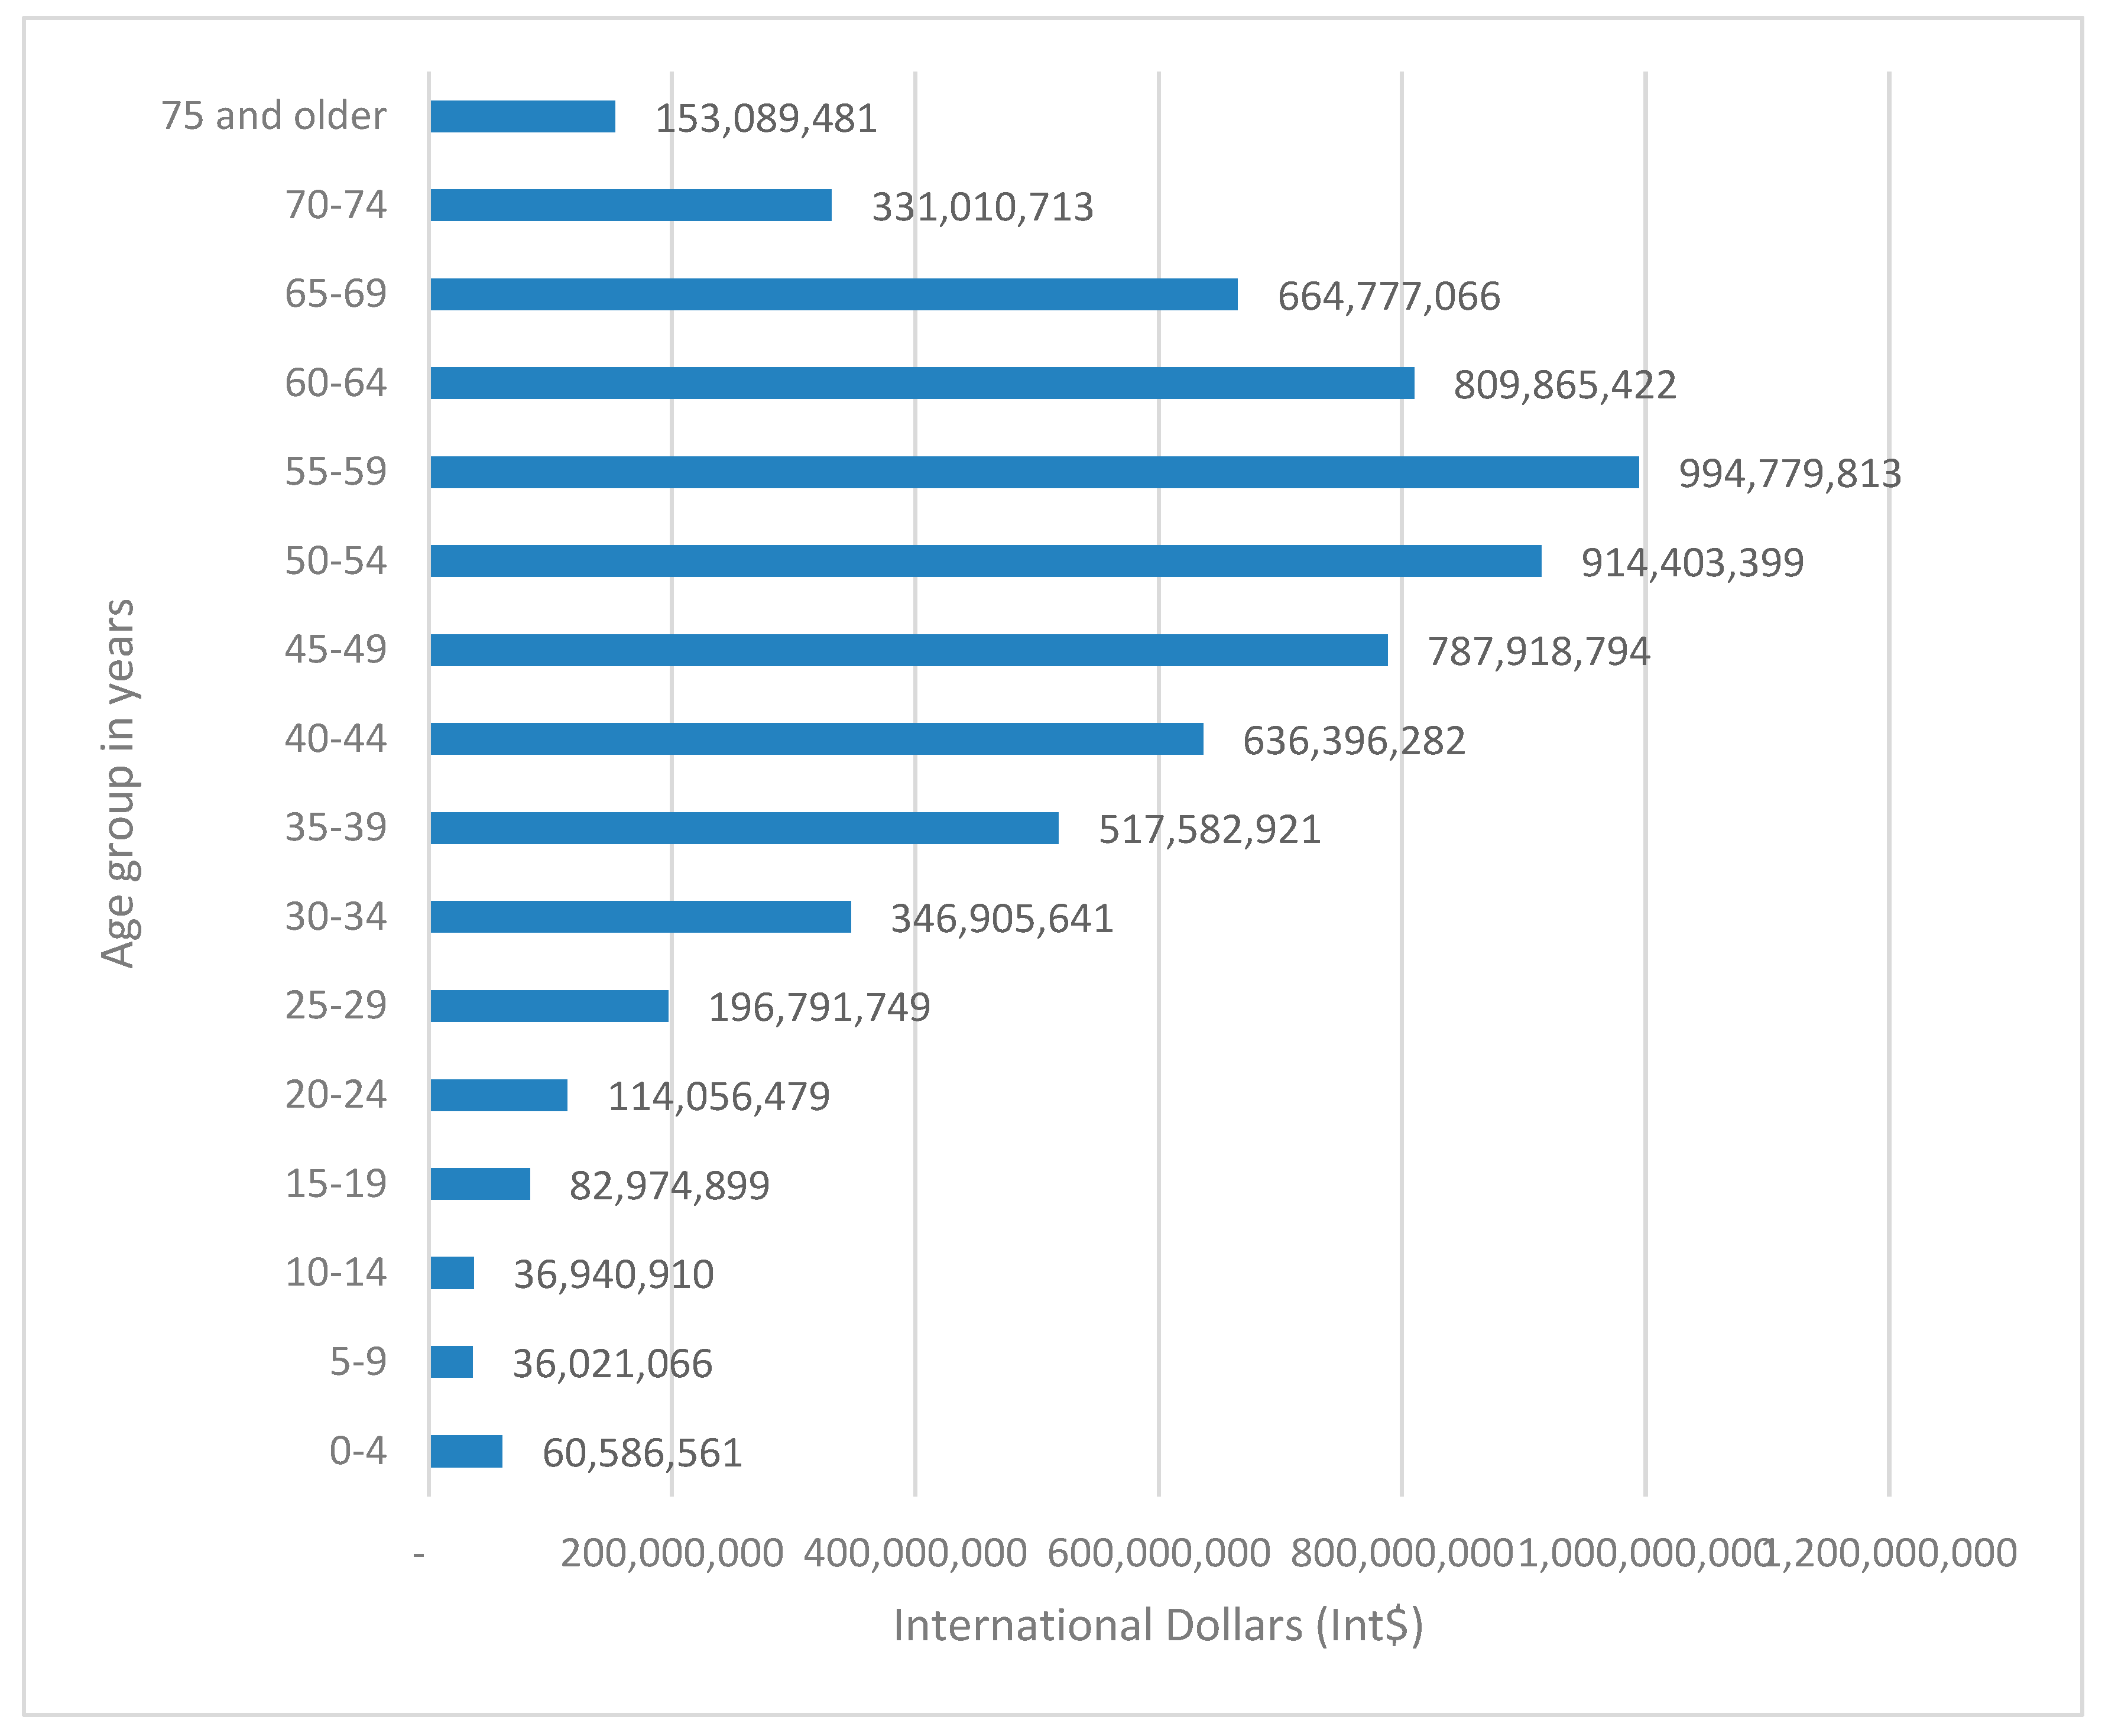
Figure 2 portrays the distribution of TMV across the 16 age groups. About Int$133,548,537 (2.0%) accrued to 0–14-year-olds; Int$4,591,809,977 (68.7%) to 15–59-year-olds; and Int$1,958,742,682 (29.3%) to 60-year-olds and above.
About Int$133,548,537 (2.0%) accrued to 0−14-year-olds; Int$4,591,809,977 (68.7%) to 15−59-year-olds; and Int$1,958,742,682 (29.3%) to 60-year-olds and above. Thus, most of the monetary value of lives lost to COVID-19 accrued to the most socioeconomically productive age bracket, i.e.,15–59-year-olds.
The average monetary value was Int$47,015 per human life lost, and the monetary value of human life lost per person in the population was Int$4.88. The average TMV per COVID-19 death varied widely from a minimum of Int$146 in the Central African Republic to a maximum of Int$248,766 in Seychelles.
The five countries with the highest average TMV per human life included Algeria with Int$72,671, Botswana with Int$127,615, Mauritius with Int$231,631, Seychelles with Int$248,766, and South Africa with Int$62,057.

3.2. Economic Cost of COVID-19 in Africa

As explained earlier in Section 2.4 of the methods, the estimates of the total economic cost of COVID-19 (TCCOVID-19) reported in this paper encompass only total indirect costs (TIC) and total direct costs (TDC).

3.2.1. Indirect Cost of COVID-19 in Africa

Table 6 presents the total and average indirect costs (productivity losses) incurred per country as of 30 June 2021, due to COVID-19.
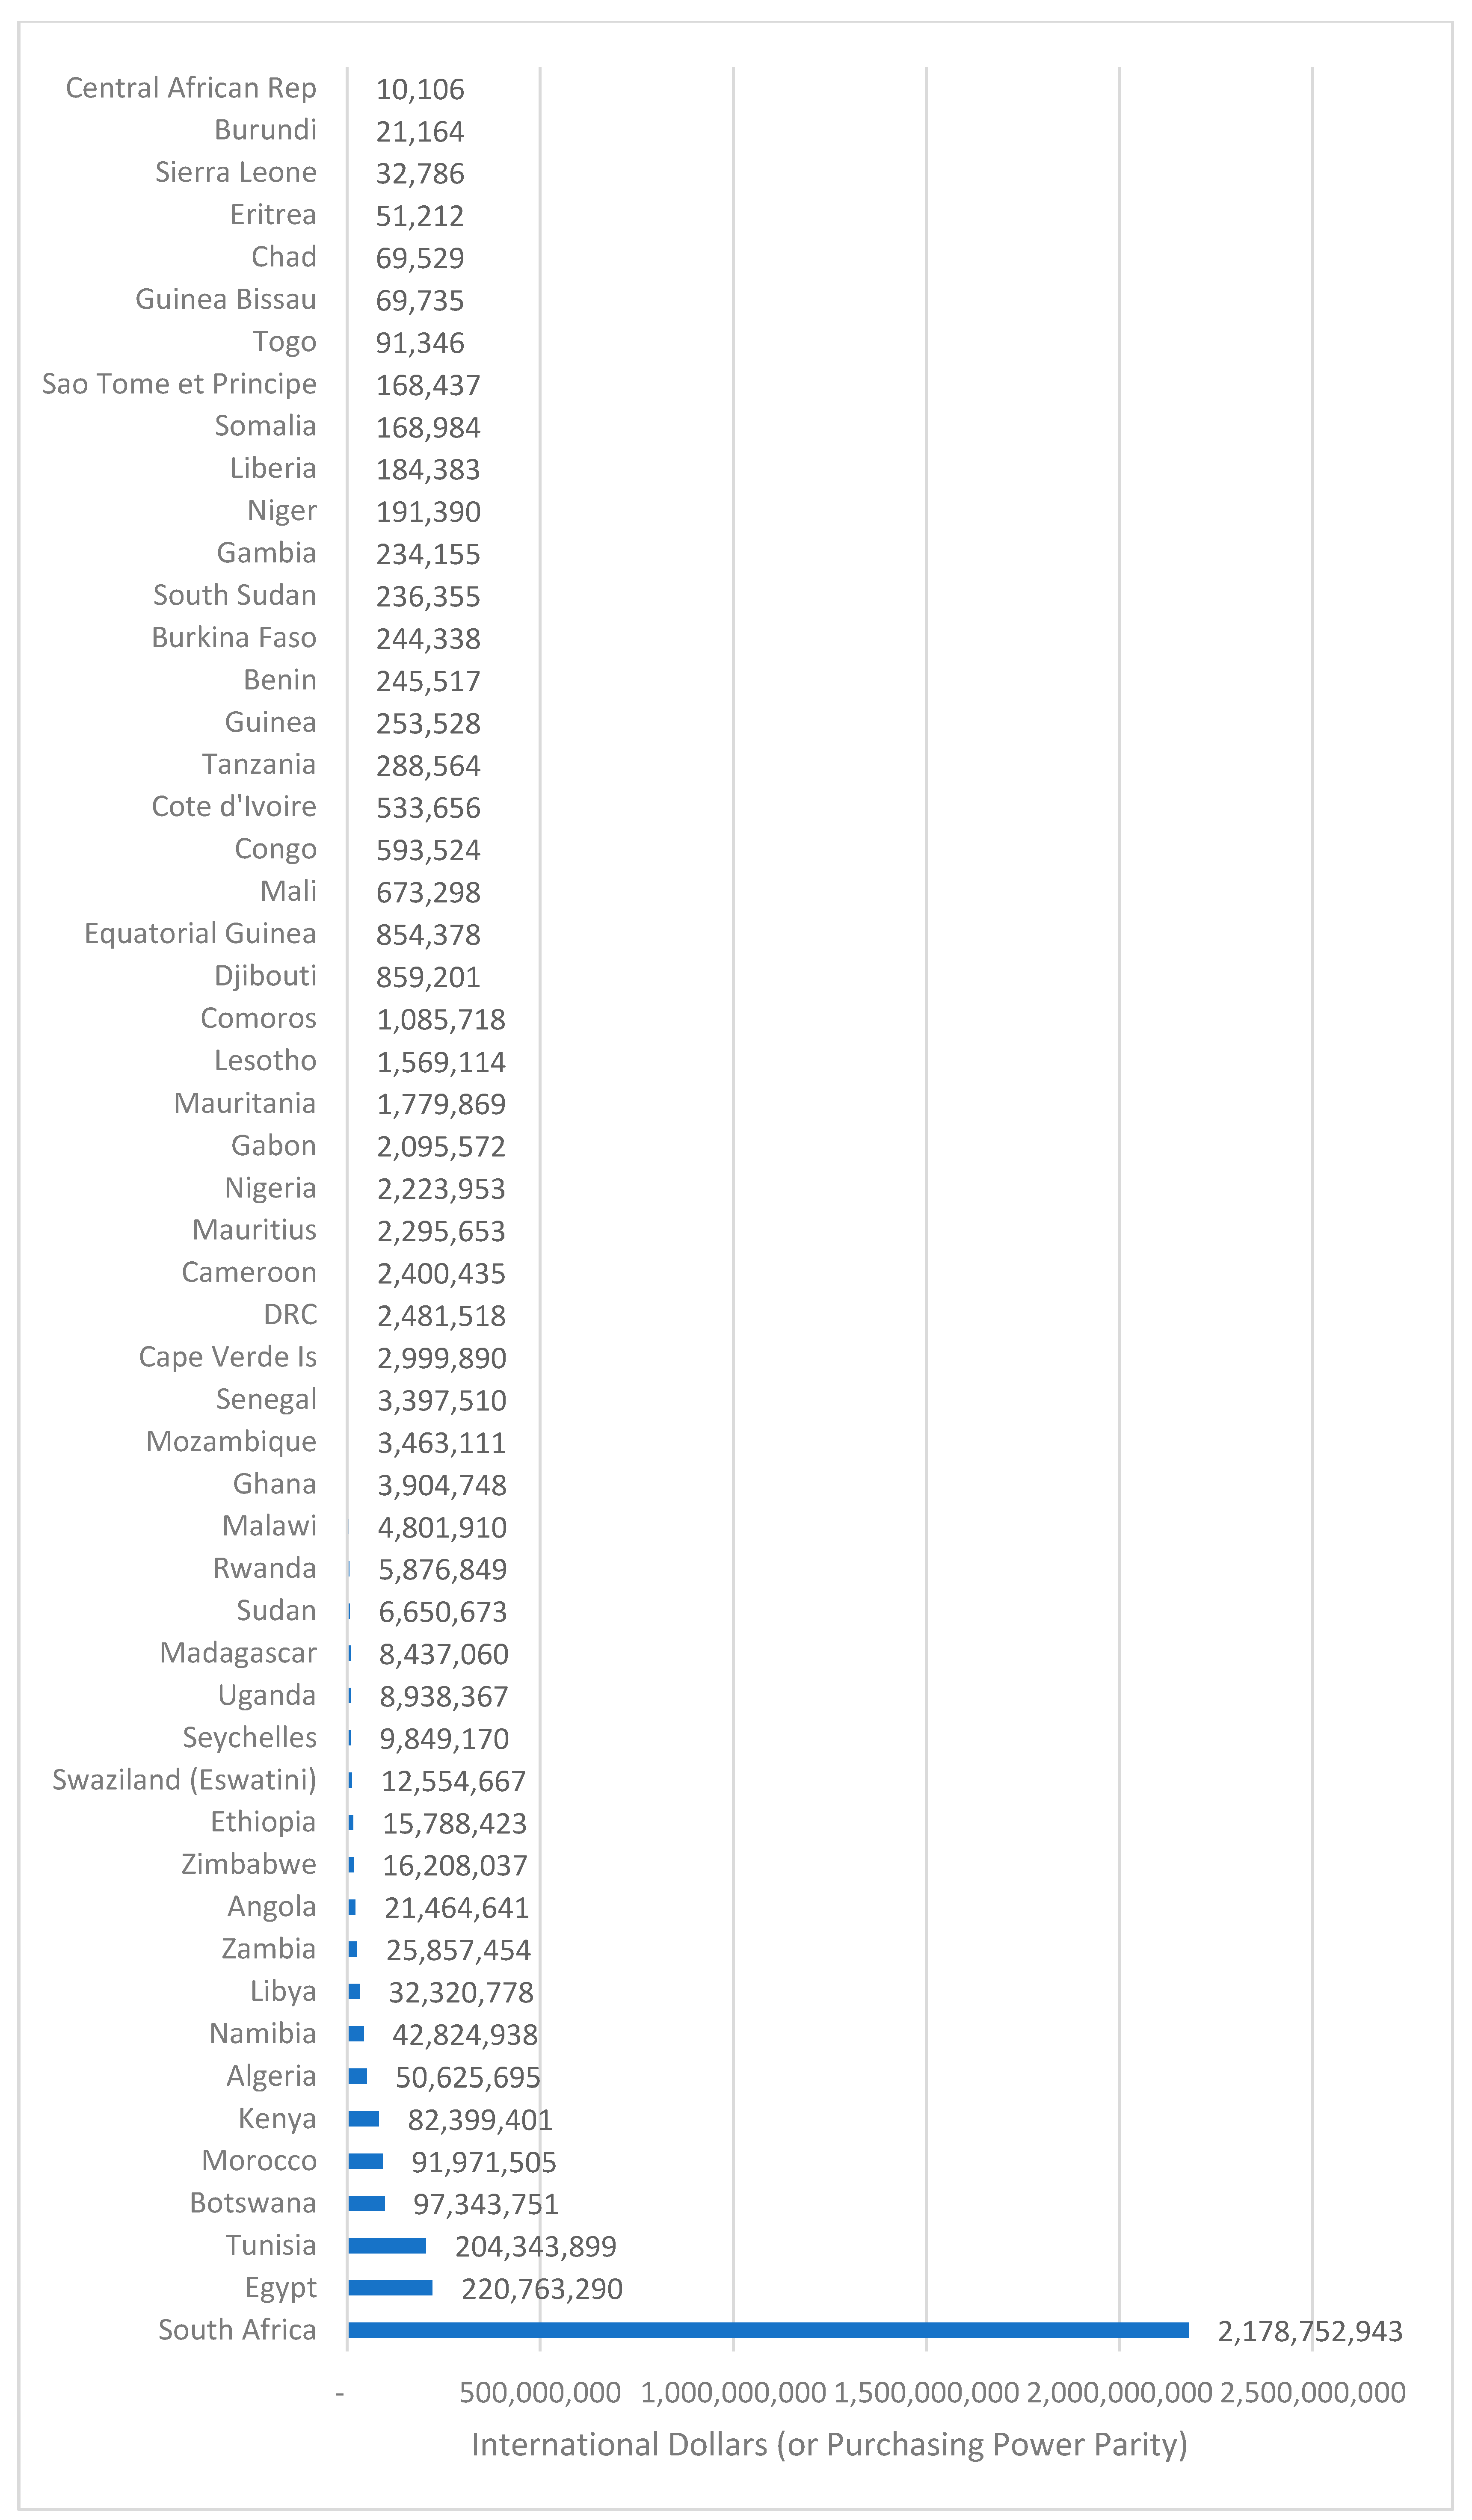
Approximately 54,210 of the persons who died of COVID-19 in Africa were aged 15–64 years. Those lives had a monetary value of Int$5.402 billion. Adjustment for labor force participation rate yielded a Continental total indirect cost of Int$3,173,546,125 and an average of Int$58,542 per life lost in the 15–64 years bracket. Twenty-two countries (40.7%) had a total indirect cost of less than Int$1 million; 18 countries (33.3%) had an indirect cost of Int$1 million to Int$10 million; and 14 countries (26.0%) had an indirect cost of Int$11 million and above. Figure 3 illustrates that the total indirect cost varied widely, ranging from Int$10,106 in the Central African Republic to a maximum of Int$2,178,752,943 in South Africa.
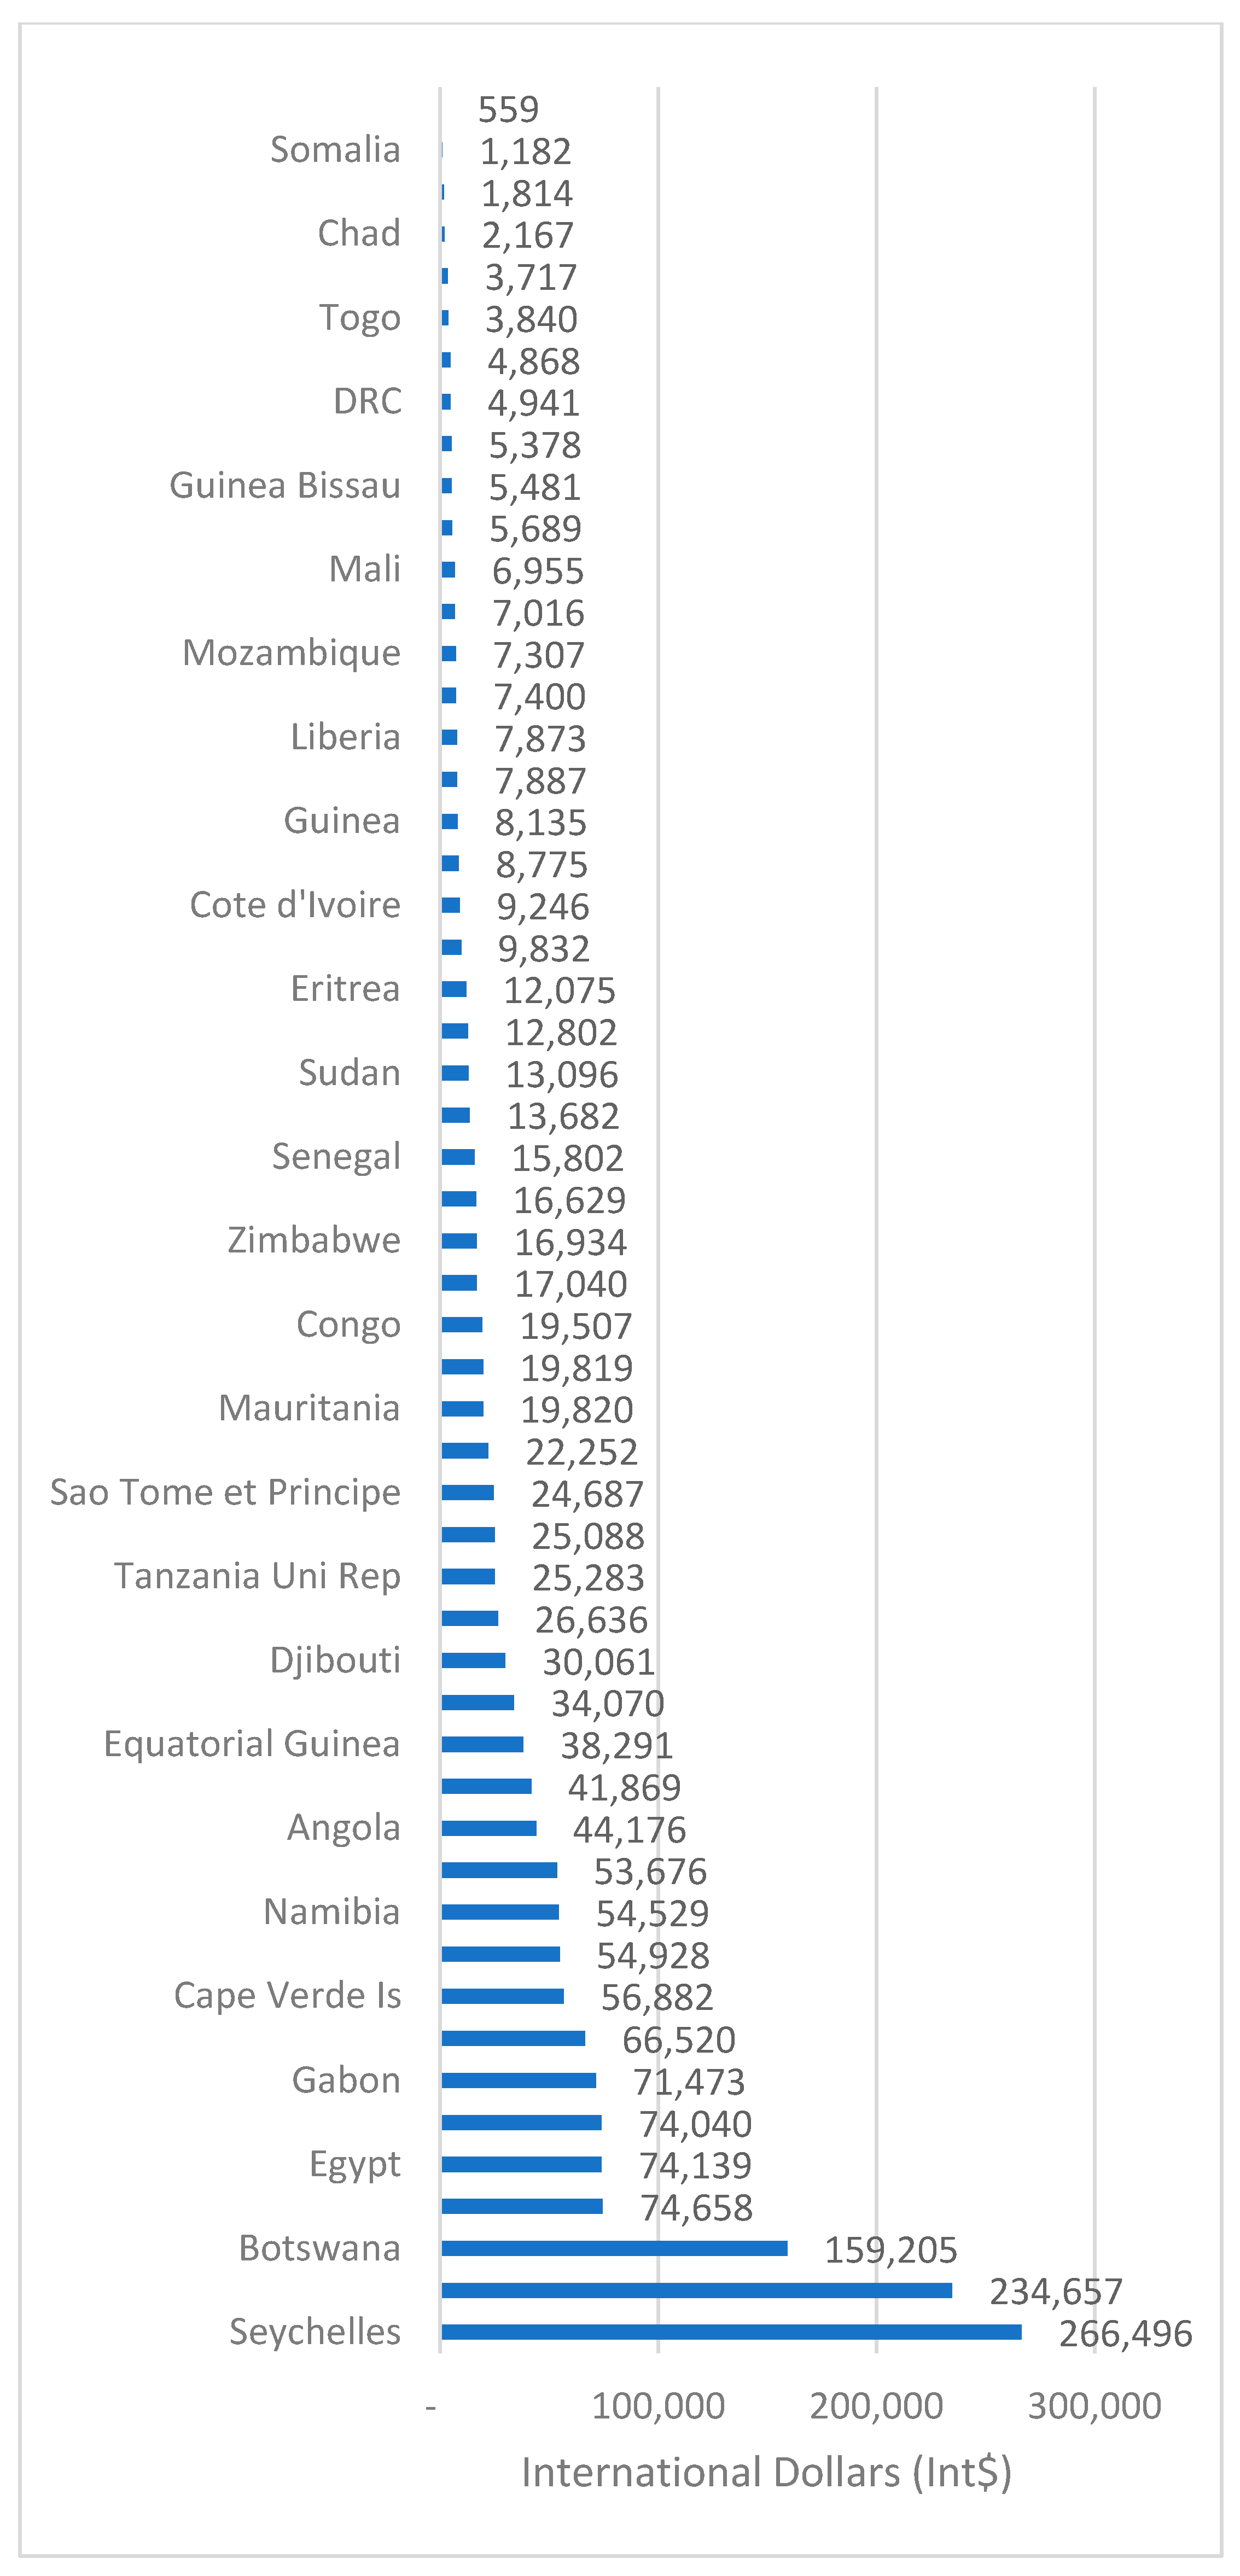
Figure 4 presents the average indirect cost of COVID-19 in Africa. The five countries with the highest average indirect cost per life lost were Seychelles, with Int$266,496; Mauritius, with Int$234,657; Botswana, with Int$159,205; Tunisia, with Int$74,658; and Egypt, with Int$74,139. The average indirect cost per COVID-19 death varied from a minimum of Int$559 in the Central African Republic to a maximum of Int$266,496 in Seychelles. One (1.9%) country had less than Int$1000 per life lost; 20 (37.0%) countries had between Int$1000 and Int$10,000; 11 (20.4%) countries had between Int$11,000 and Int$20,000; 6 (11.1%) countries had between Int$21,000 and Int$30,000; 16 (29.6%) countries had Int$31,000 and above.

3.2.2. Direct Cost of COVID-19 in Africa

As depicted in Table 7, the total direct health system cost of preventing and managing COVID-19 cases in Africa is estimated at Int$3,981,927,049. Five countries (Algeria, Egypt, Morocco, Tunisia, and South Africa) alone bore 86.7% (Int$3.45 billion) of the Continent’s total direct cost.
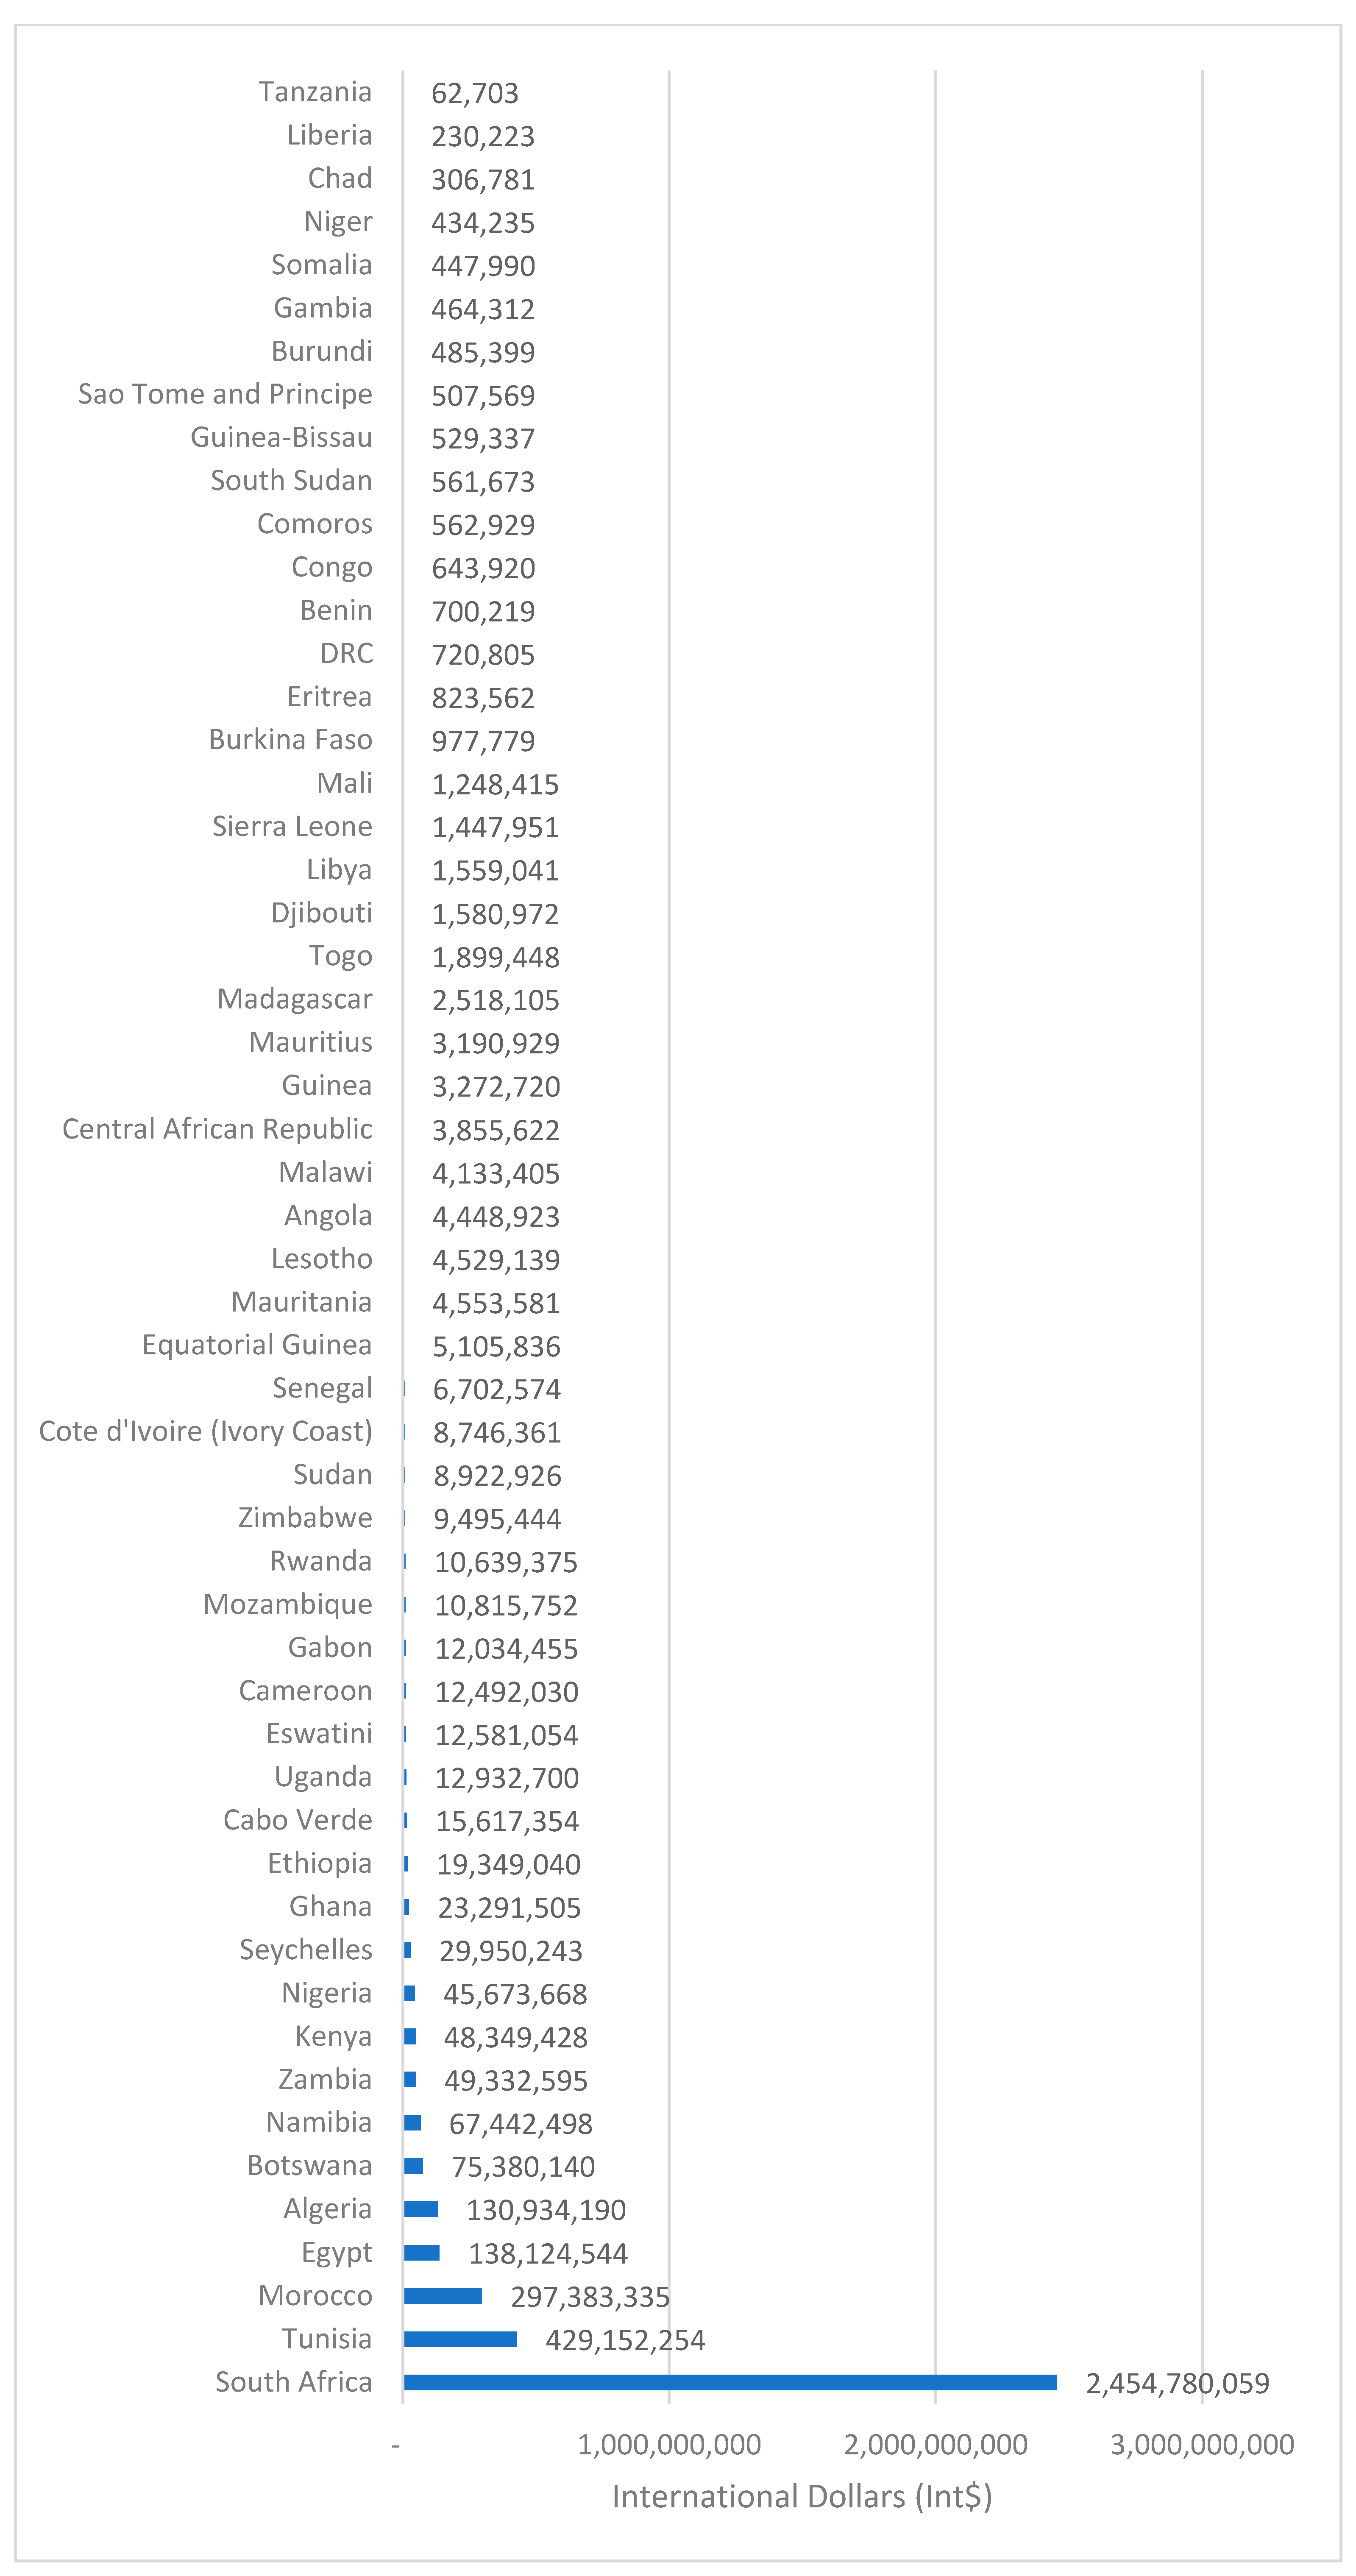
Figure 5 shows that the direct costs of preventing and managing COVID-19 infections vary widely from a minimum of Int$62,703 in Tanzania to a maximum of Int$2,454,780,059 in South Africa.
Sixteen (30%) of the countries had a total direct cost of under Int$1 million, 18 (33%) countries had between Int$1 million and Int$10 million, and the remaining 20 (37%) countries had a total direct cost of Int$11 million and above. The main direct cost drivers are the size of per capita current health expenditure, and the number of COVID-19 cases identified through laboratory testing per country. The latter depends on the proportion of the population tested and the number of those who are reported positive. There is evidence that the population coverage of COVID-19 testing is very low in most African countries. Therefore, the direct cost estimates reported in this paper could be underestimated.

3.2.3. Total Cost of COVID-19 in Africa

As depicted in Table 8, the total cost (direct plus indirect) associated with COVID-19 cases reported in Africa as of June 30, 2021, is approximately Int$7,155,473,174.
The five countries with the highest total cost of COVID-19 are South Africa, with Int$4.634 billion; Tunisia, with Int$633.5 million; Morocco, with Int$389.4 million; Egypt, with Int$358.9 million; and Algeria, with Int$181.6 million. Those five countries account for Int$6,196,831,716 (86.6%) of the Continental total cost of COVID-19.
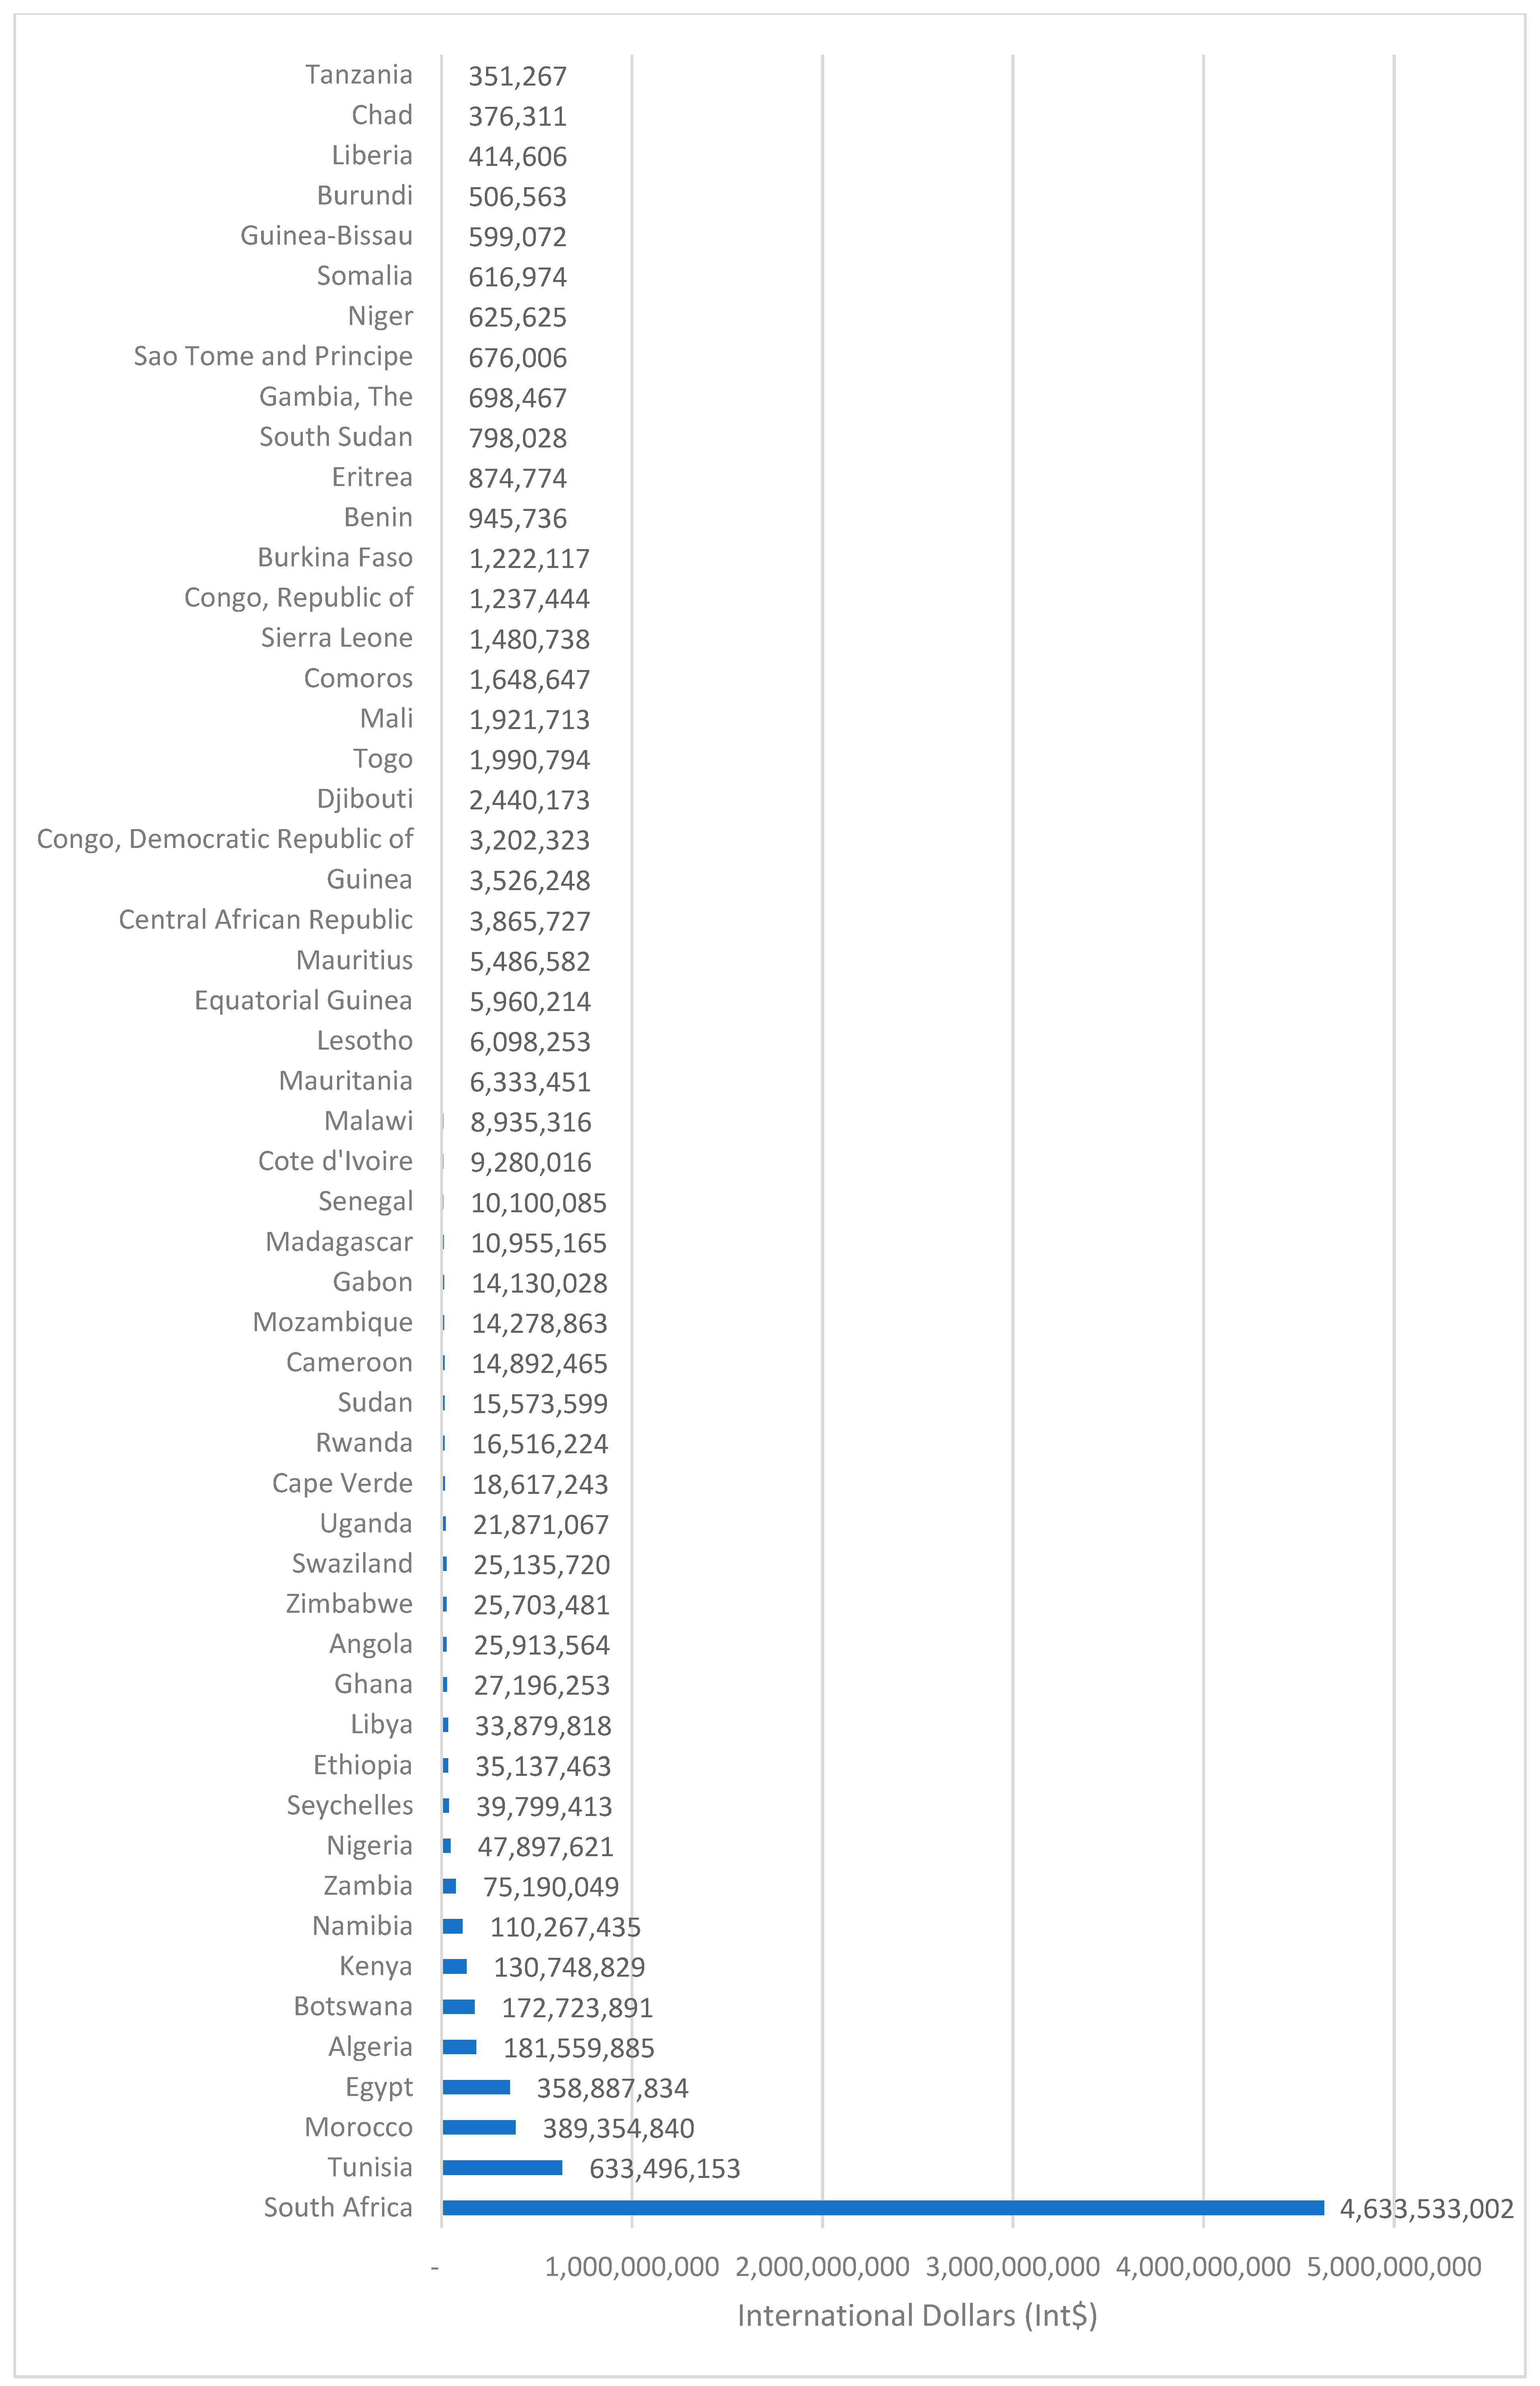
The total cost of COVID-19 was less than Int$1 million in 12 (22.2%) countries, between Int$1 million and Int$10 million in 17 (31.5%) countries, and over Int$11 million in 25 (46.3%) countries. As depicted in Figure 6, the estimated total cost of COVID-19 varies significantly across countries, ranging from a minimum of Int$351,267 in Tanzania to a maximum of Int$4,633,533,002 in South Africa.
The average total cost (ATC) per COVID-19 case is Int$1309, i.e., Int$7,155,473,174, divided by the total number of COVID-19 cases aged 15–64 years, which is 5,465,790. The top five countries with the highest average total cost per COVID-19 case were Mauritius, with an average of Int$2993; Seychelles, with an average of Int$2555; Botswana, with an average of Int$2479; South Africa, with an average of Int$2371; and Tunisia, with an average of Int$1530. As depicted in Figure 7, the average total cost varied widely from Int$41 in Somalia to Int$2993 in Mauritius. Seven (13%) countries had an ATC of less than Int$100 per case; 28 (52%) countries had between Int$100 and Int$500 per case; 10 (18%) countries had between Int$501 and Int$900 per case; nine (17%) countries had an ATC of Int$1000 and above per case.
On the other hand, the average total cost per person in the population is Int$5.22, i.e., Int$7,155,473,174 divided by the continental population of 1,370,493,279. As demonstrated in Figure 7, the total cost associated with COVID-19 per person in the population ranged from Int$0.01 in Tanzania to Int$402.21 in Seychelles.
Seychelles had Int$402.21, South Africa had Int$77.16, Botswana had Int$72.01, Tunisia had Int$53.05, and Namibia had Int$42.63 per person. The cost per person was less than Int$1 in 31 countries, between Int$1 and Int$9 in 15 countries, and Int$10 and above in eight countries.

3.3. Savings in Potential Direct and Indirect Costs of COVID-19 in Africa Expected from COVID-19 Vaccination

Section 3.3.1 reports the potential savings in direct costs of COVID-19 in Africa that can be expected from vaccination. Section 3.3.2 reports the potential savings in indirect costs associated with COVID-19 in Africa that are expected from vaccination. Section 3.3.3 reports on total savings in the projected direct plus indirect costs of COVID-19 in Africa expected from vaccination. The estimates in the three subsections use the projected number of COVID-19 cases, rather than the actual reported cases. A 100% vaccine coverage is assumed. Therefore, these are estimates of the most optimistic scenario.

3.3.1. Savings in Potential Direct Costs of COVID-19 in Africa Expected from COVID-19 Vaccination

The potential direct cost savings equals the difference between the direct cost without vaccine (among controls) and the direct cost with vaccine (among treatments). The direct cost of the control group equals the product of the country’s population and the infection risk in the control group, multiplied by the current health expenditure per capita. The vaccine group’s direct cost equals the product of the country’s population and the infection risk in the AZ vaccine group, multiplied by the current health expenditure per capita.
Table 9 compares the total direct cost without and with the COVID-19 Oxford–AstraZeneca vaccine per African country.
If the unit cost per COVID-19 case managed equals the respective country’s per capita current health expenditure, the continental total direct cost without vaccination is Int$9,459,720,500. Contrastingly, the total continental direct cost of the Oxford–AstraZeneca vaccination is estimated at Int$3,198,135,685.
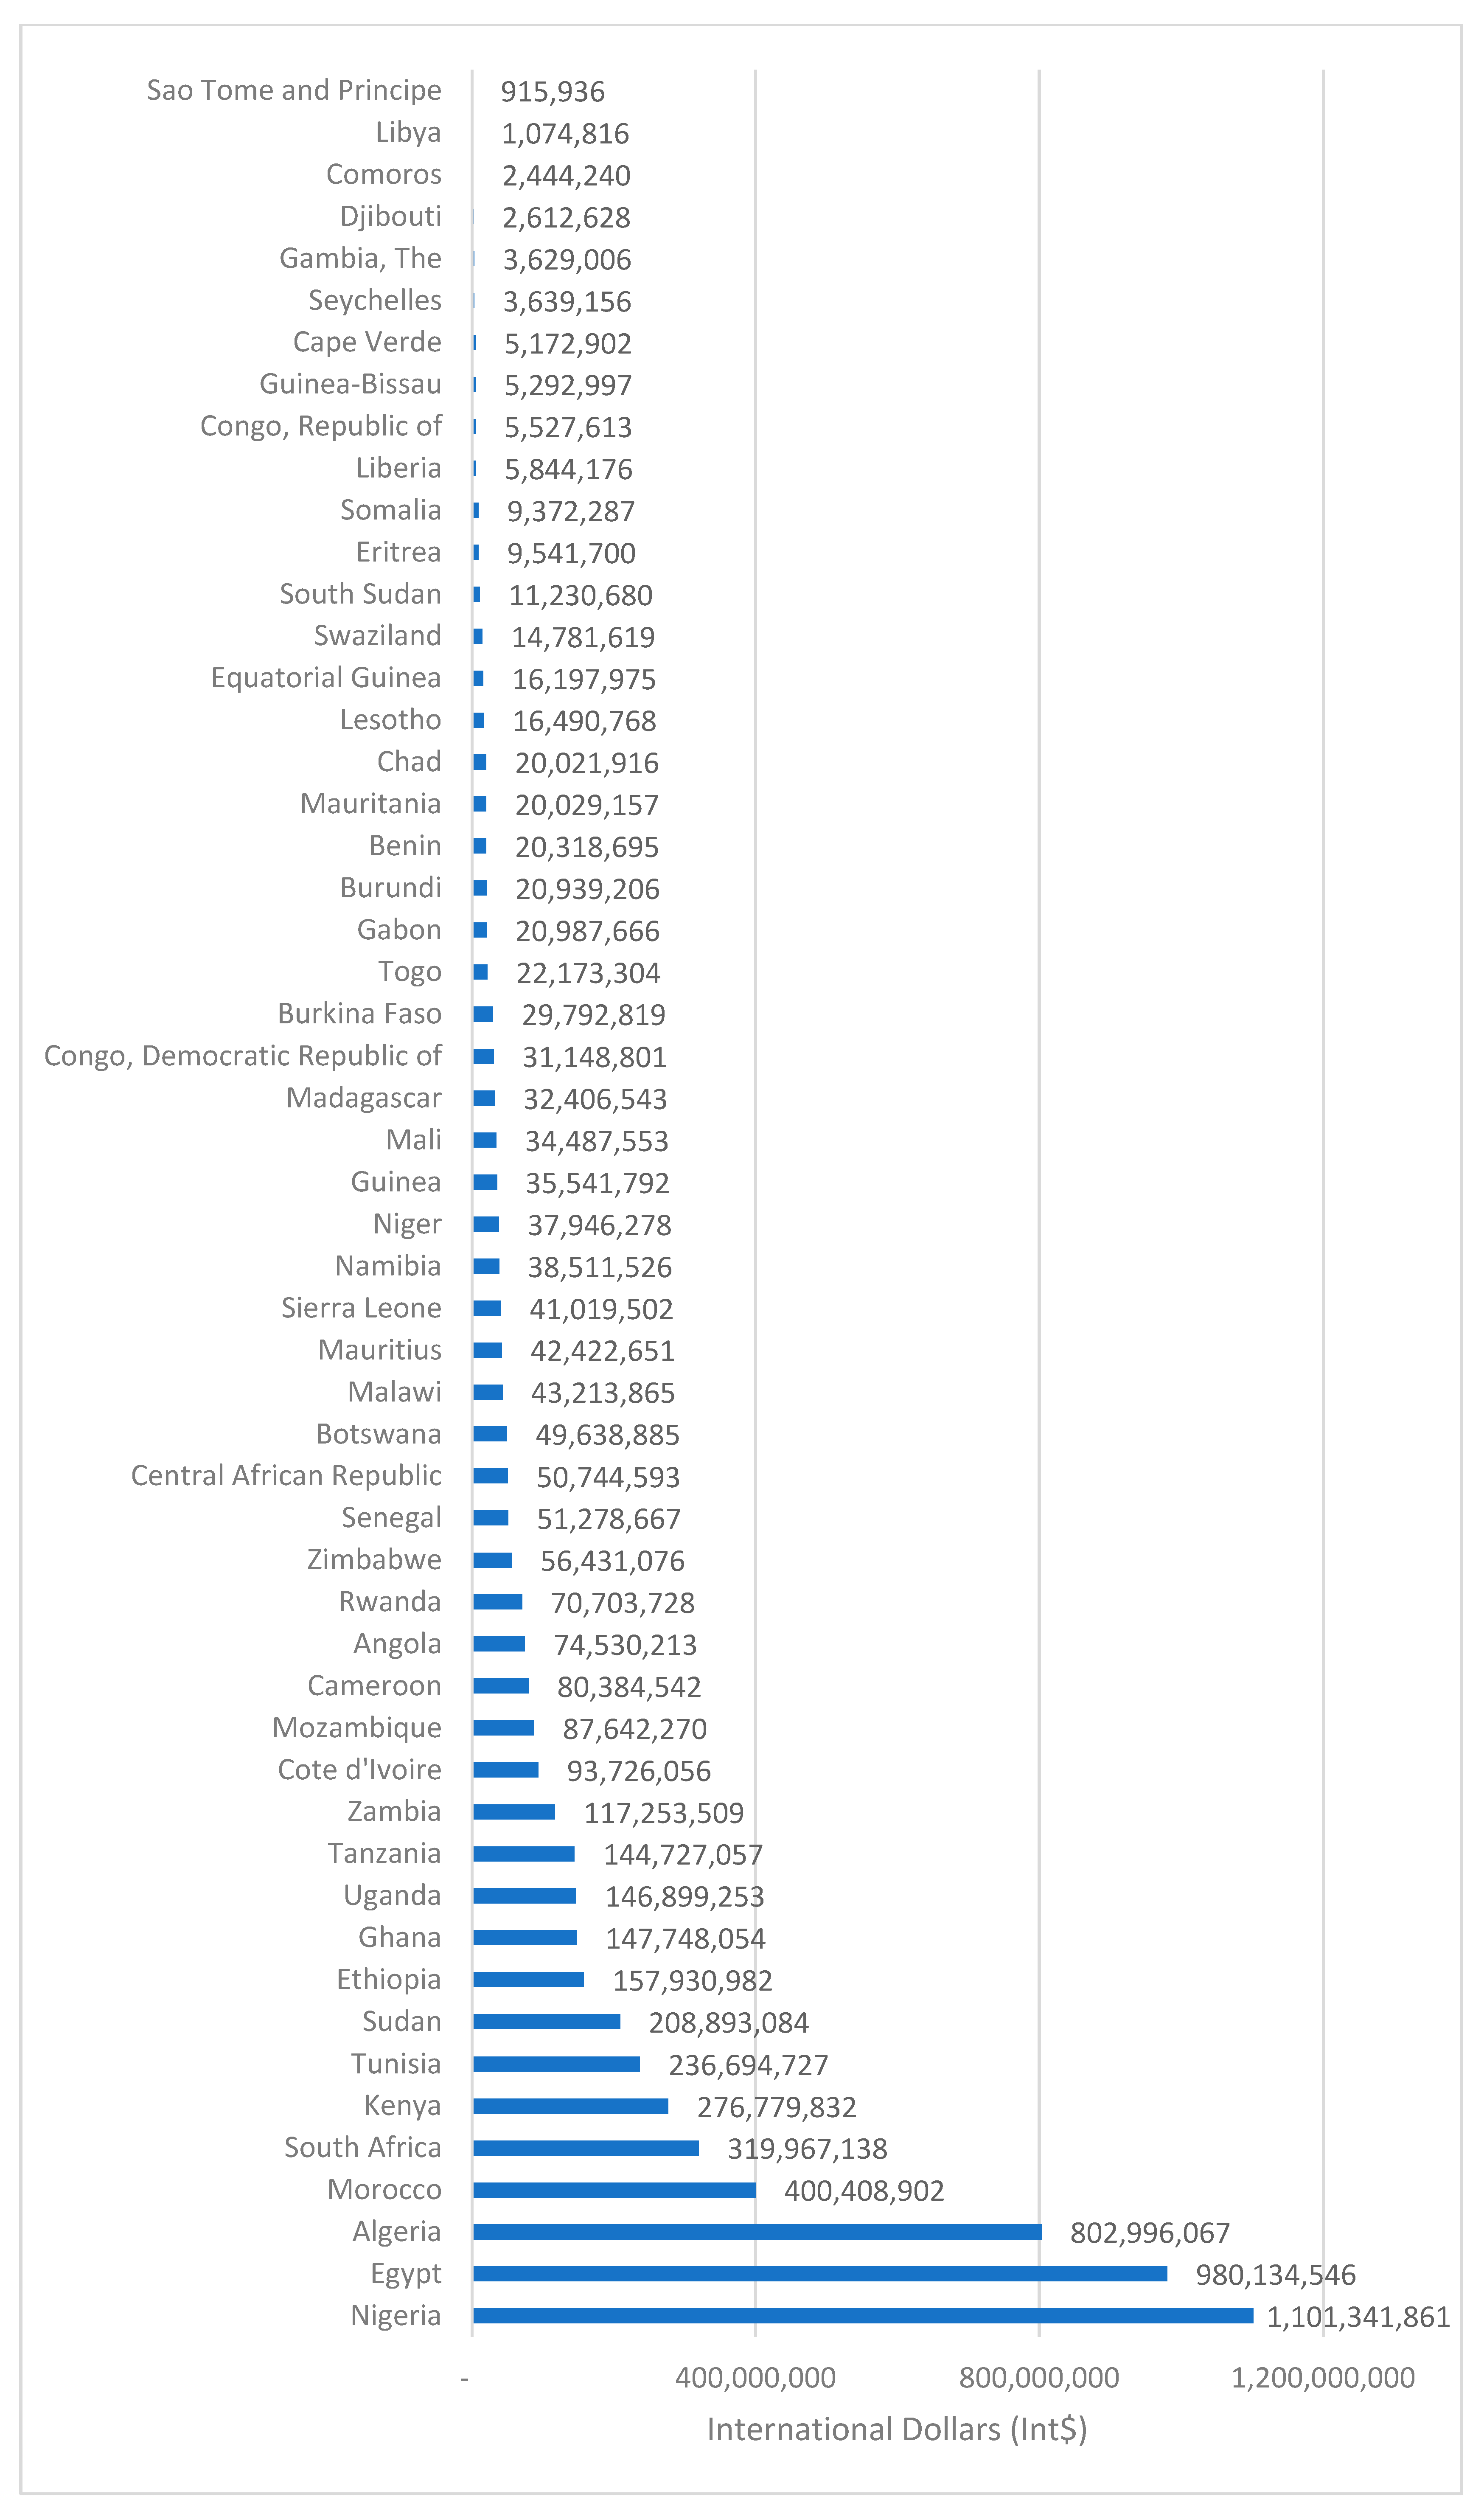
Figure 8 shows that COVID-19 vaccination could potentially save Africa at least Int$6,261,584,816 in direct health systems costs.
The direct cost savings due to the Oxford–AstraZeneca vaccine range from a minimum of Int$915,936 in São Tomé and Principe to a maximum of Int$1,101,341,861. About 12 (22.2%) countries are expected to make direct cost savings of less than Int$10 million; 21 (38.9%) countries between Int$10 million and Int$50 million; 8 (14.8%) countries between Int$51 million and Int$100 million; and 13 (24.1%) countries with savings of Int$101 million and above.

3.3.2. Savings in Potential Indirect Costs of COVID-19 in Africa Expected from COVID-19 Vaccination

Applying the risk of death reported by Bernal et al. (2021), it is estimated that 1,656,615 unvaccinated persons aged 15–64 years would die from COVID-19 compared to 289,880 deaths among those vaccinated. We estimate that the total indirect cost in Africa is Int$42,863,554,186 among unvaccinated persons aged 15–64 years and Int$7,500,403,177 among those vaccinated. Thus, the total indirect cost saving from vaccination is approximately Int$35,363,151,009 in Africa.
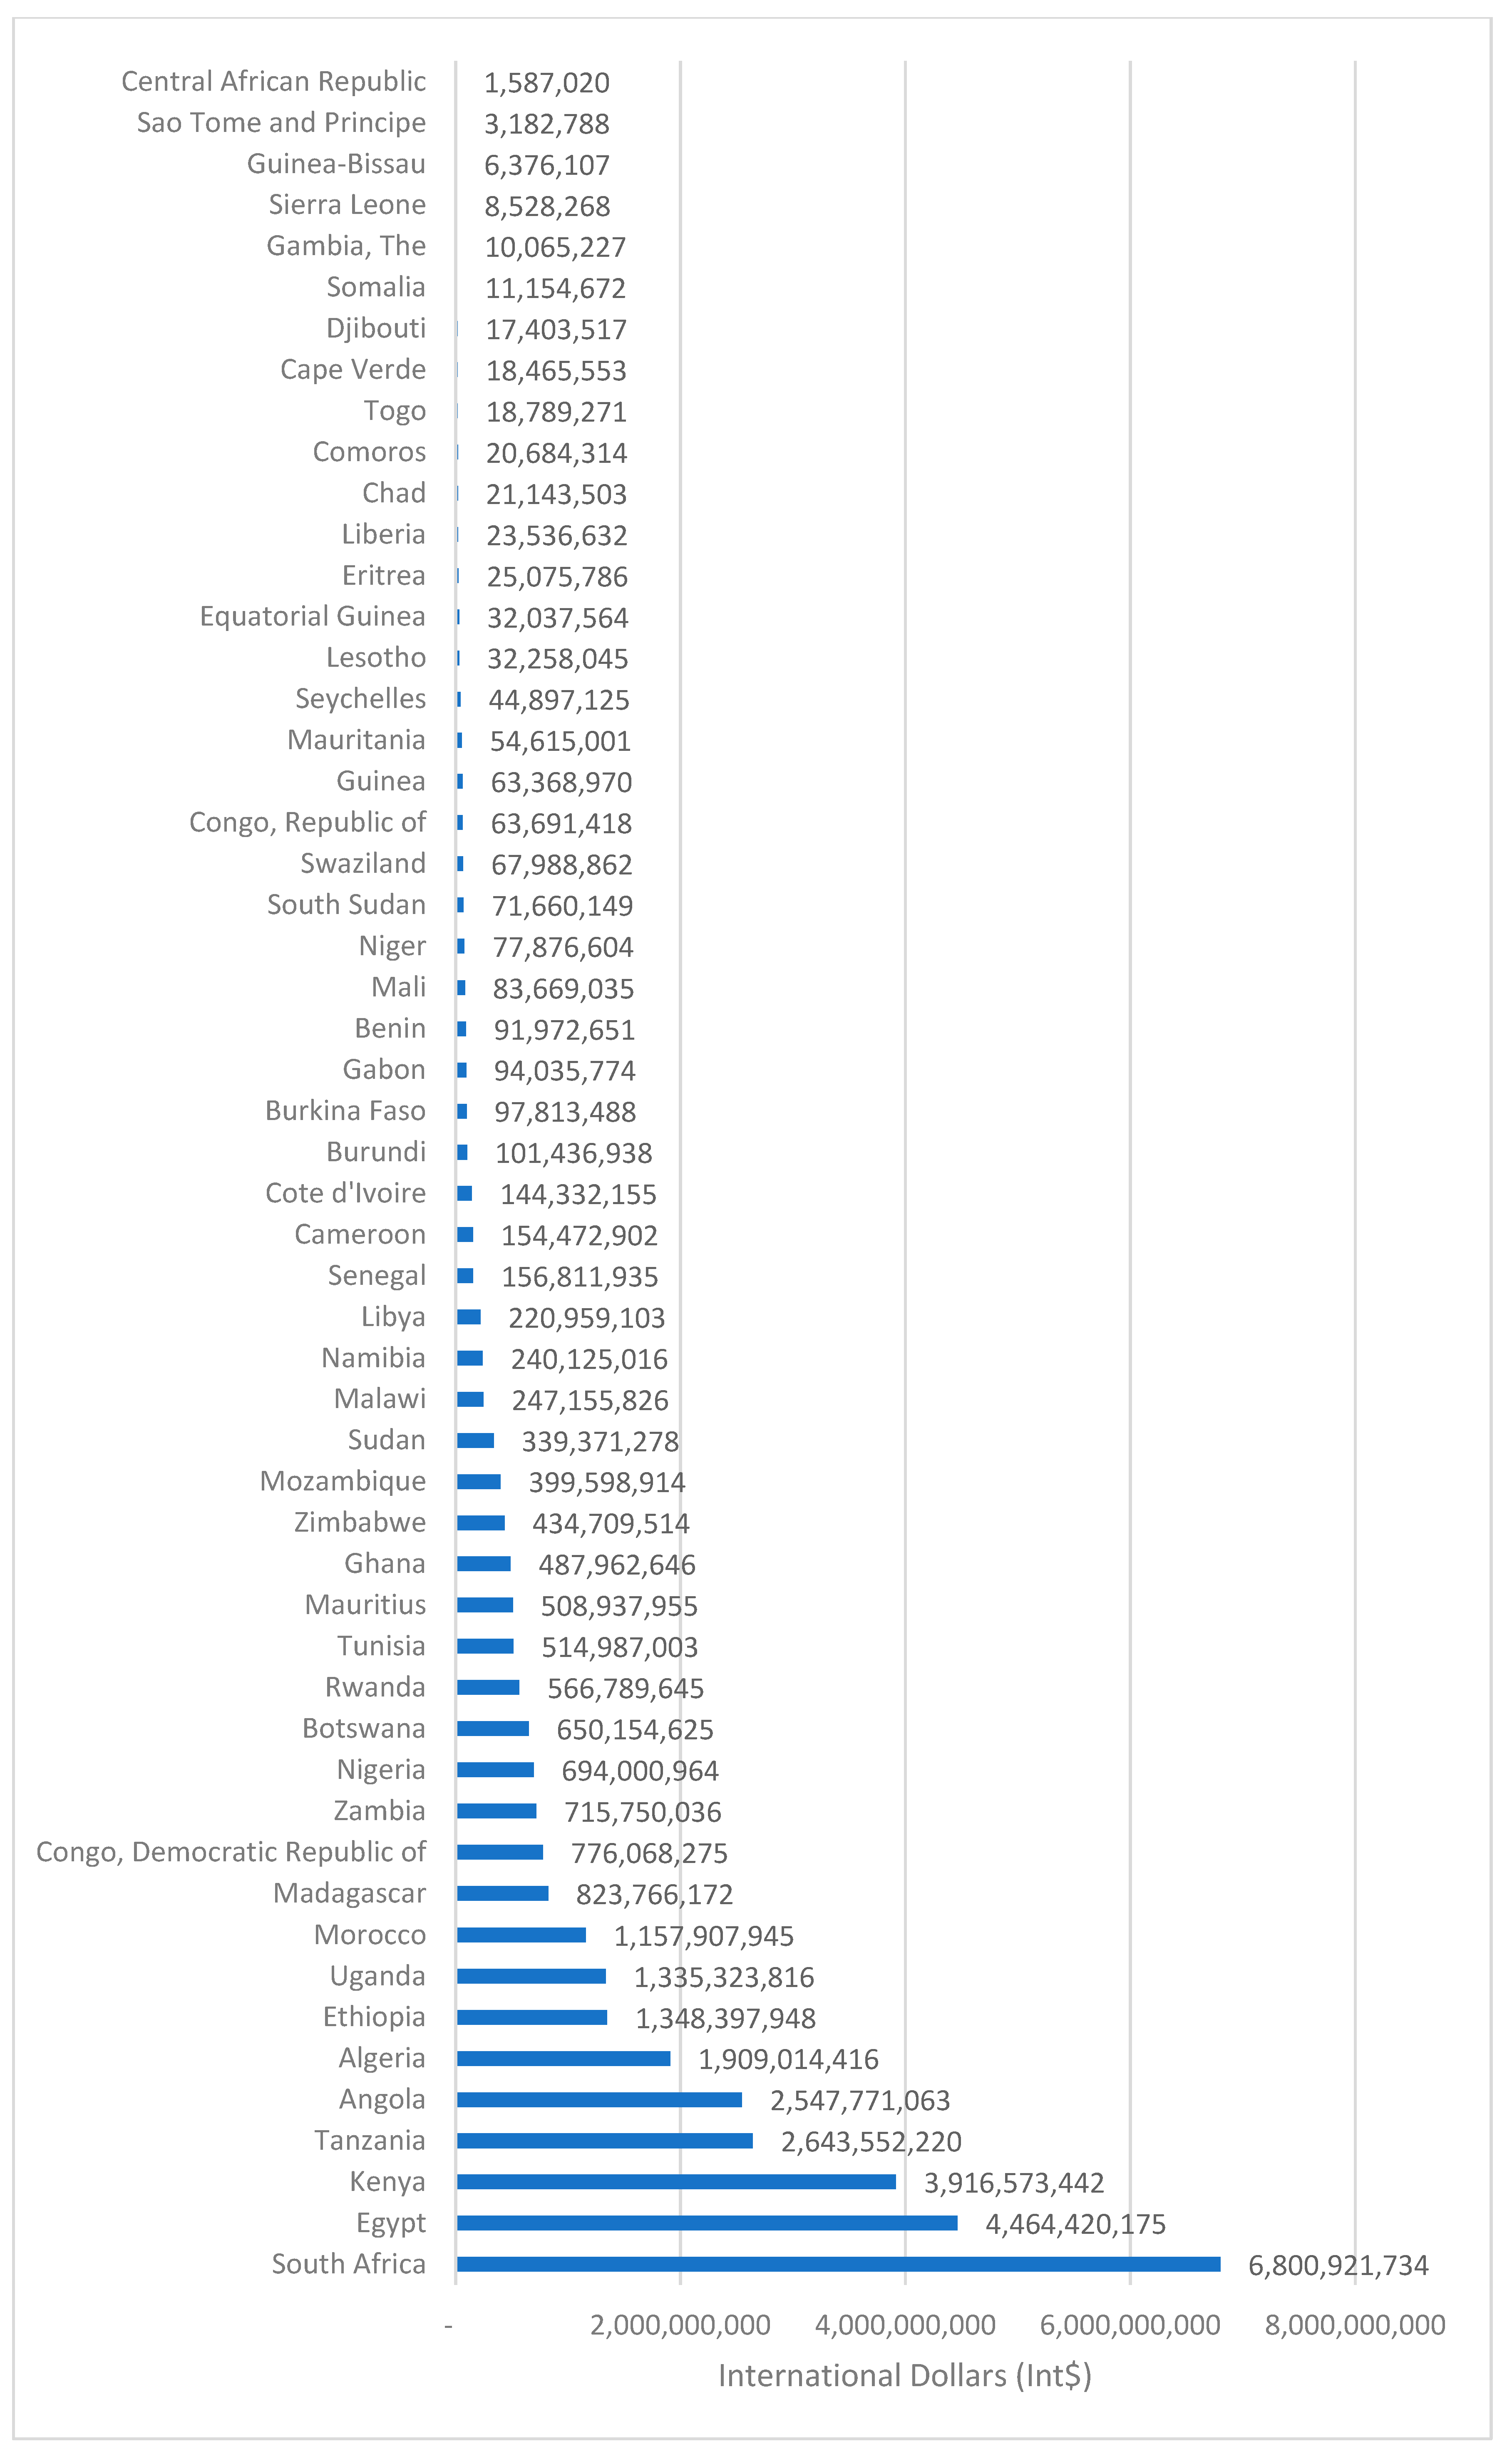
Figure 9 shows that the total indirect cost savings from the COVID-19 Oxford–AstraZeneca vaccination in Africa range from Int$1,587,020 in the Central African Republic to Int$6,800,921,734 in South Africa.
Four (7%) countries had indirect cost savings of less than Int$10 million; 12 (22%) countries had between Int$10 million and Int$50 million; 10 (19%) countries had between Int$50 million and Int$100 million; and 28 (52%) countries had savings of Int$101 million or more.

3.3.3. Savings in Potential Total Costs of COVID-19 in Africa Expected from COVID-19 Vaccination

It is estimated that the vaccination of 100% of the eligible population in Africa with the Oxford–AstraZeneca vaccine would potentially prevent 26.22 million COVID-19 infections and avert 4,293,234 deaths. Almost 32.4% of the latter would be among those aged 15–64.
As depicted in Table 10, vaccinating all eligible people would save the continent approximately Int$41,624,735,824. Out of these, Int$6.262 billion (15.0%) represents a direct cost savings, and Int$35.363 billion (85.0%) represents an indirect cost savings.
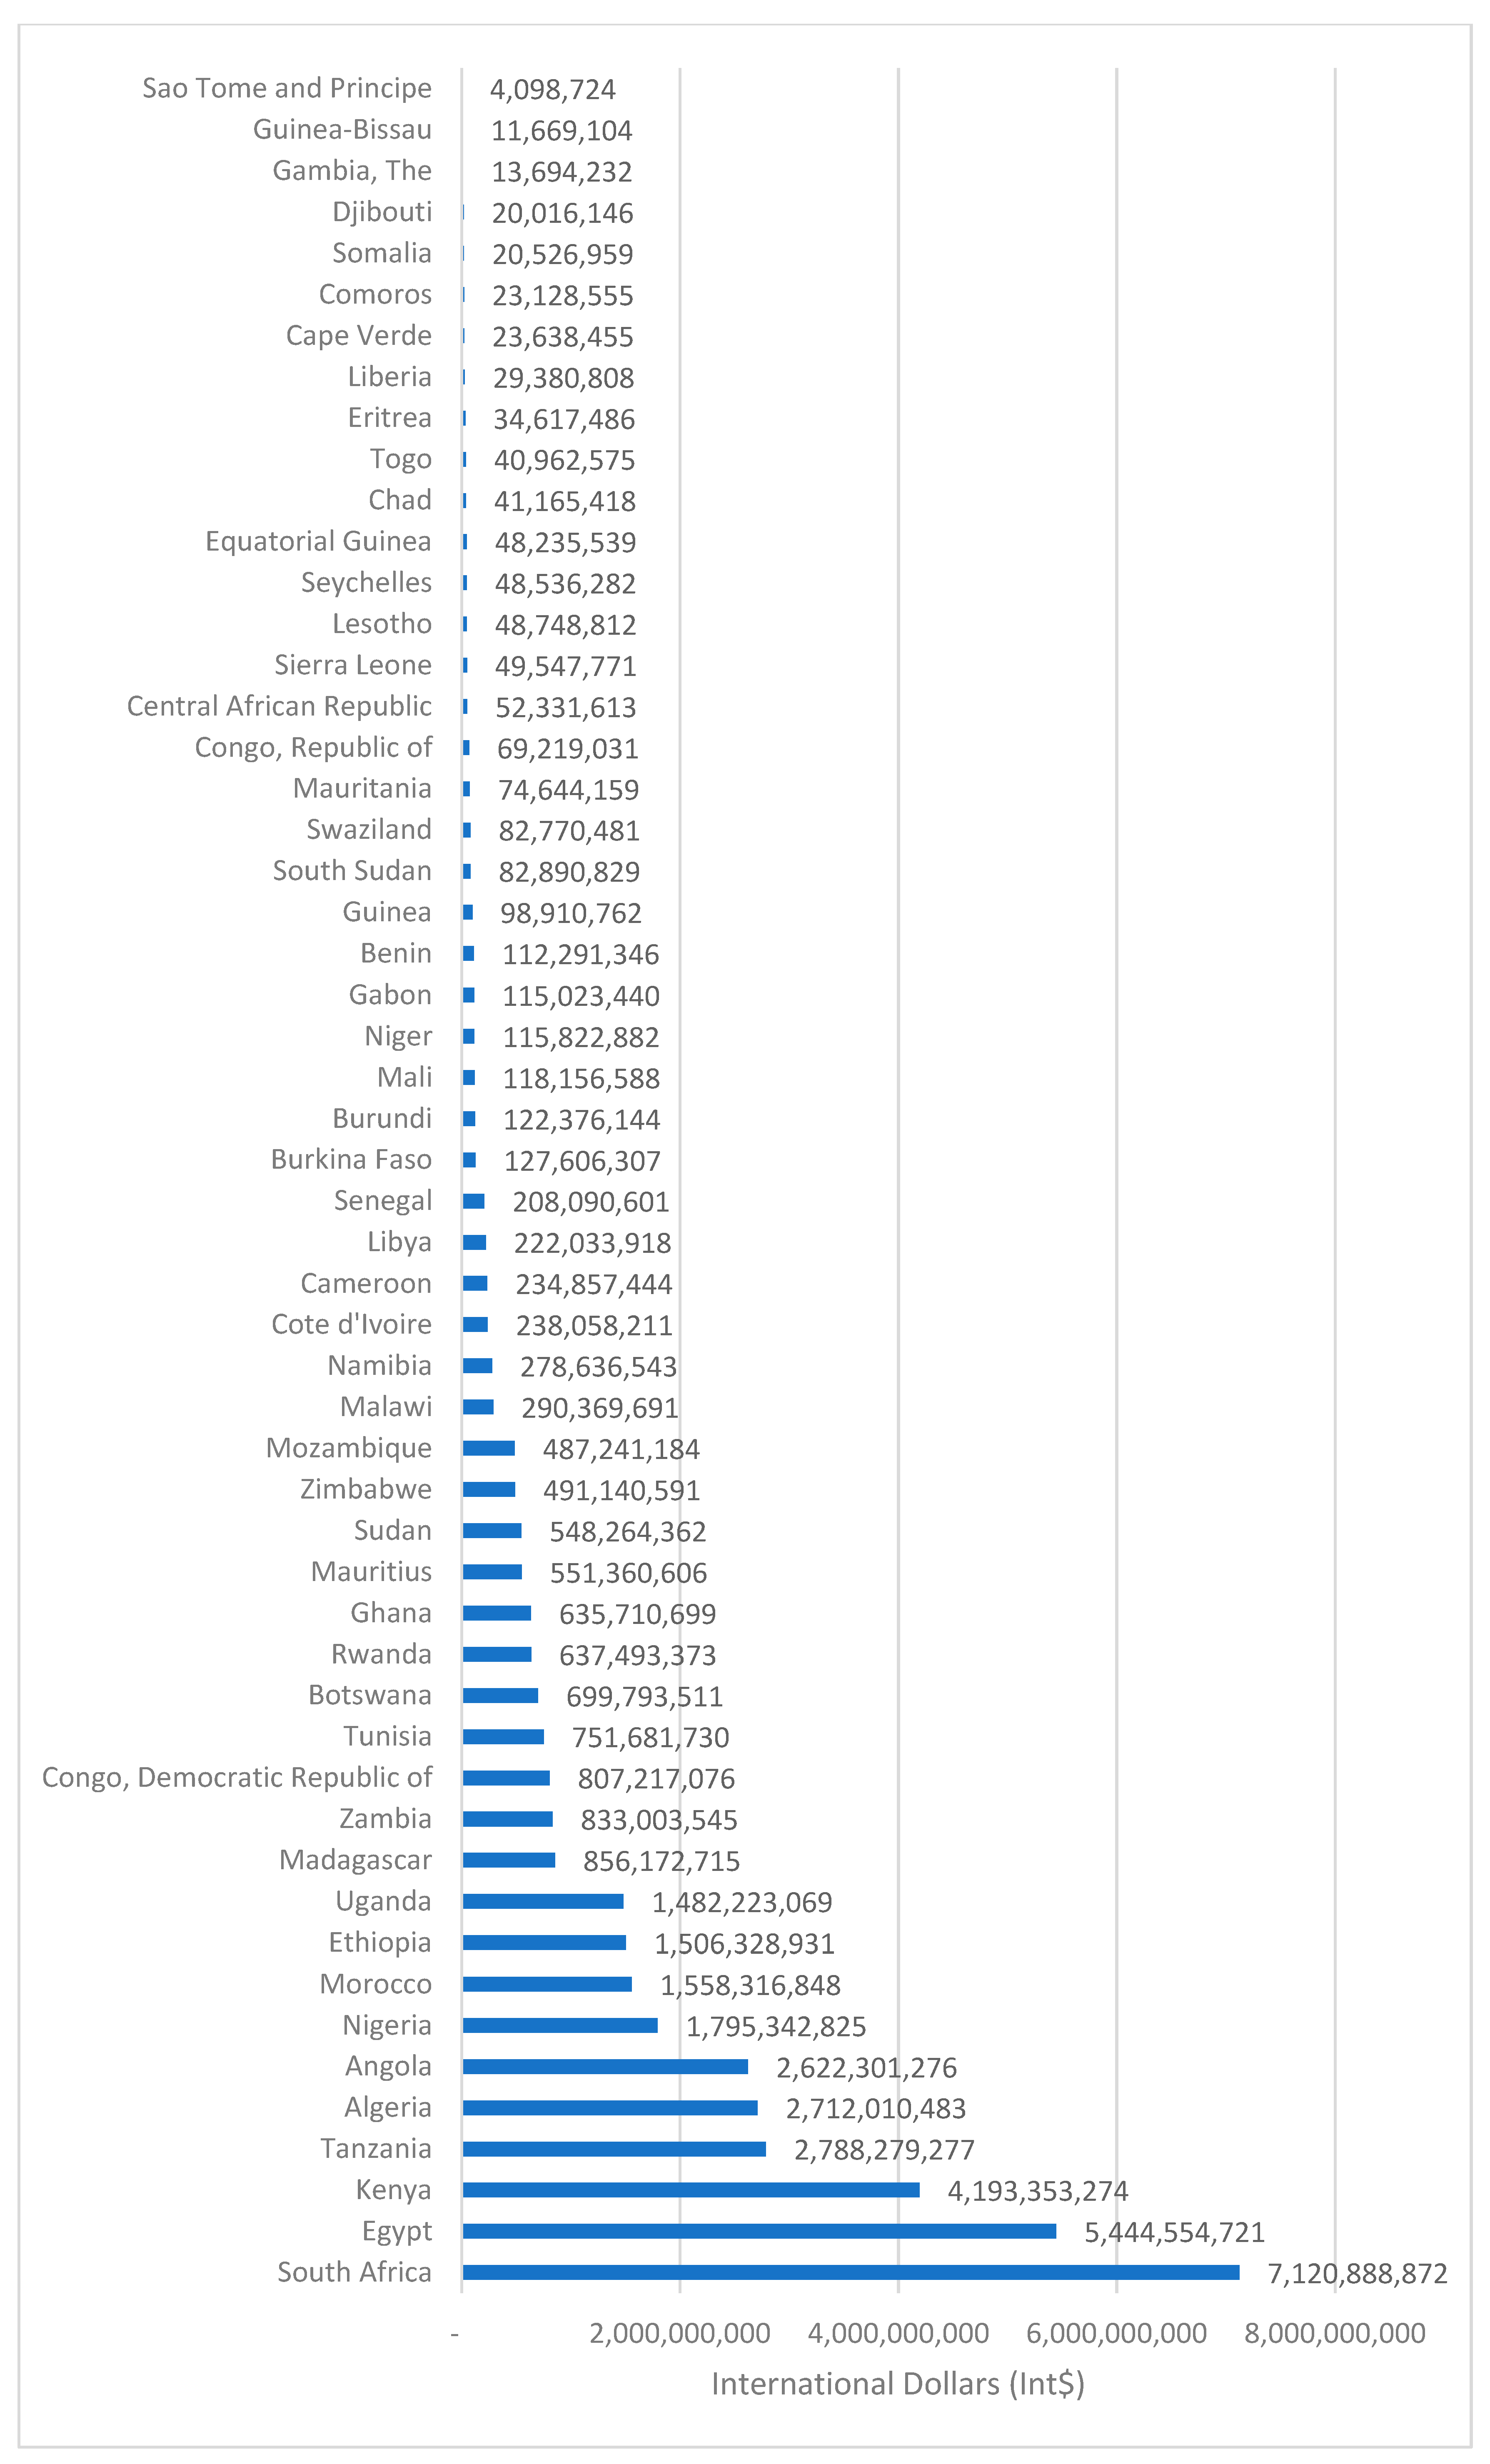
Figure 10 demonstrates that the total cost savings expected from the COVID-19 AstraZeneca vaccination vary from Int$4,098,724 in São Tomé and Principe to Int$7,120,888,872 in South Africa. Twenty-one (39%) countries had a total cost saving of below Int$100 million; 14 (26%) countries had between Int$100 million and Int$499 million; 9 (17%) countries had between Int$500 and Int$999 million; and 10 (18%) countries had Int$1 billion and above.
The longer the COVID-19 pandemic persists, the more people develop coping mechanisms that reduce disruptions to activities of daily living (including work), productivity losses, and hence expected savings. Additionally, as the COVID-19 mutation level continues to evolve and milder variants emerge, stability is likely to be achieved, where infection does not result in complete immobility and incapacity in those infected. All these considerations may influence the magnitudes of projected savings from vaccination.

3.4. Sensitivity Analysis

First, a re-run of the human capital model with a discount rate of 5% instead of 3%, holding all other variables (deaths, GDPPC, CEHPC, average life expectancy at birth) constant reduced the continental: (i) Total monetary value of reported lives lost to COVID-19 by Int$947,265,868 (14.17%), and the average monetary value per death from Int$47,015 to Int$40,352. (ii) Total productivity loss (total indirect cost) among 15–64-year-olds from Int$3,173,546,125 to Int$2,687,145,189, which is a Int$486,400,935 (15.3%) decrease. (iii) Reported cases total cost (total direct cost plus total indirect cost) from Int$7,155,473,174 to Int$6,669,072,238, which is a reduction of Int$486,400,935 (6.8%). (iv) Projected total savings from COVID-19 vaccination decreases by Int$ 5,340,467,285 (12.83%).
Second, a re-estimation of the economic model with a discount rate of 10% instead of 3%, holding all other variables (deaths, GDPPC, CEHPC, average life expectancy at birth) constant, reduced the following in Africa: (i) Total monetary value of reported lives lost to COVID-19 by Int$2,455,027,232 (36.73%), and the average monetary value per death from Int$47,015 to Int$29,746. (ii). Total productivity loss (total indirect cost) from Int$3,173,546,125 to Int$1,919,633,288, which is an Int$1,253,912,837 (39.5%) decrease. (iii) Reported case’s total cost (total direct cost plus total indirect cost) from Int$7,155,473,174 to Int$5,901,560,337, which is a reduction of Int$1,253,912,837 (17.5%). (iv) Projected total savings from COVID-19 vaccination decreases by Int$13,814,723,812 (33.2%).
Third, a re-calculation of the model with the world’s highest average life expectancy (ALE) of 88 years (in Hong Kong) instead of individual country’s national ALE, holding all other variable constant (deaths, GDPPC, CEHPC, discount rate at 3%), grew the following in Africa: (i) Total monetary value of reported lives lost to COVID-19 by Int$13,982,454,402 (209.2%); (ii) total productivity loss (total indirect cost) by Int$3,238,491,270 (102%), i.e., from Int$3,173,546,125 (with national ALE) to Int$6,412,037,395 (with world highest ALE); (iii) total cost of reported cases increased from Int$7,155,473,174 (with national ALE) to Int$10,393,964,444 (with the world’s highest ALE), representing a growth of Int$3,238,491,270 (45.3%). (iv) Total cost savings due to vaccination from Int$41,624,735,824 to Int$85,097,353,802, i.e., a 104.4% growth.
Fourth, a re-estimation of the model with Africa’s highest average life expectancy (ALE) of 77.5 years (in Algeria) instead of the individual country’s national ALE, holding all other variables constant (deaths, GDPPC, CEHPC, discount rate at 3%), augmented the following in Africa: (i) total monetary value of reported lives lost to COVID-19 by Int$6,074,005,112 (90.9%), i.e., from Int$6,684,101,196 (at national ALE) to Int$12,758,106,309 at Africa’s highest ALE. (ii) The total indirect cost grew from Int$3,173,546,125 (with national ALE) to Int$5,149,685,439 (with Africa’s highest ALE), representing an increase of Int$1,976,139,314 (62.3%). (iii) The total cost of reported cases increased from Int$7,155,473,174 (with national ALE) to Int$9,131,612,487 (with Africa’s highest ALE), which is a growth of Int$1,976,139,314 (27.6%). (iv) Projected total cost savings from COVID-19 vaccination increased from Int$41,624,735,824 to Int$69,119,995,455, which is an Int$27,495,259,631 (66.1%) increase.

4. Discussion

4.1. Key Findings

4.1.1. Value of Human Life Losses, Indirect Costs, and Direct Costs Associated with Actual Reported COVID-19 Cases

This study estimates the following:
(a)
The total discounted monetary value of human life losses associated with 142,171 COVID-19 deaths reported in Africa as of 30 June 2021 at Int$6,684,101,196.
(b)
The discounted monetary value per human life lost was Int$47,015, and the monetary value of human life lost per person in the population was Int$4.88.
(c)
Approximately 54,210 of 15–64-year-old persons reported dead from COVID-19 in Africa had a total indirect cost of Int$3,173,546,125 (i.e., after adjustment for labor participation rate), and an average of Int$58,542 per life lost (productivity losses).
(d)
As of 30 June 2021, the 5,514,709 COVID-19 cases reported in Africa had an estimated total direct cost (TDC) of Int$3,981,927,049. Dividing the estimated TDC by the total number of COVID-19 cases reported in Africa yields an average direct cost of Int$722.06 (US$289.53) per case managed.
(e)
The total cost (direct plus indirect) associated with the actual 5,514,709 COVID-19 cases reported in Africa as of 30 June 2021, was approximately Int$7,155,473,174. The average total cost per COVID-19 case was Int$1309 and Int$5.22 per person in the population.

4.1.2. Savings in Potential/Projected Total Costs of COVID-19 in Africa Expected from COVID-19 Vaccination Findings

(a)
How many people in the population would be infected with COVID-19 without and with vaccination? Utilizing the risk rates of infection from Voysey et al. (2021), it is projected that approximately 39,608,709 people would be infected by COVID-19 without vaccination (Control Group) compared to 13,390,885 people with vaccination (Treatment Group). Thus, 100% vaccination coverage of eligible persons would potentially avert an estimated 26,217,824 COVID-19 infections in Africa.
(b)
How many people in the population would die from COVID-19 without and with vaccination? Applying the risk of death reported by Bernal et al. (2021), it is estimated that 5,203,814 people would die without vaccination, vis-à-vis 910,580 deaths with vaccination.
(c)
How many deaths would be averted by COVID-19 vaccination? An estimated 4,293,234 deaths from COVID-19 would be prevented by vaccination, i.e., 5,203,814 minus 910,580.
(d)
How many averted COVID-19 deaths would be within the productive age bracket of 15–64 years? Applying the risk of death reported by Bernal et al. (2021), it is estimated that 1,656,615 people in the 15–64 years age bracket would die without vaccination compared to 289,880 with vaccination. Thus, 1,366,735 deaths in the 15–64-year age bracket would be saved with COVID-19 vaccination, i.e., 1,656,615 minus 289,880.
(e)
We estimate that vaccinating all eligible people in the population would save the African continent approximately Int$41,624,735,824 (i.e., equivalent to 0.61% of Africa’s total GDP in 2021). That total saving consists of Int$6.262 billion (15.0%) in direct cost savings and Int$35.363 billion (85.0%) in indirect cost savings.
(f)
The benefit–cost ratio of COVID-19 vaccination is 5.8, implying that Africa reaps $6 in return for every $1 spent on COVID-19 vaccination.
(g)
The average total saving per person in the population is approximately Int$30.4.

4.2. Comparison with Other Studies

4.2.1. A Comparison of Our Estimates with Results from Similar Studies

The average discounted monetary value per human life in Africa, at Int$47,015, was lower than in China, at Int$356,203, by a factor of 8, and in Spain, at Int$470,798, by a factor of 10 (Kirigia & Muthuri, 2020a, 2020b). The differences could be attributed to Africa’s significantly lower GDP per capita compared to that of China and Spain. Differences in demographic structures are also known to have had a significant role, according to Thorbecke (2022).

4.2.2. Comparison of Estimates from Direct and Indirect Cost Studies

In Africa, there is a paucity of research into direct and indirect costs associated with COVID-19. Barasa et al. (2021) estimated the direct unit cost for COVID-19 case management for patients at different stages (asymptomatic, mild/moderate, severe, and critical) in Kenya. These authors’ findings were as follows. First, managing asymptomatic COVID-19 at home costs US$226.71 per patient, whereas managing it at a hospital (and isolation) center costs US$764.16 per patient (Barasa et al., 2021). Second, managing mild to moderate COVID-19 at home-based care costs US$226.96, while hospital or isolation center care costs US$764.41 per patient (Barasa et al., 2021). Third, managing severe COVID-19 in the general hospital ward costs US$1494.38 per patient (Barasa et al., 2021). Fourth, managing critical COVID-19 cases in the hospital intensive care unit costs US$7194.07 per patient (Barasa et al., 2021).
Ismaila et al. (2021) estimated the cost of clinical management of COVID-19 infection by disease severity level and treatment setting in Ghana. The authors estimated the total direct cost of home management COVID-19 case at US$282; institutional care for a mild case at US$5707; institutional care for a moderate case at US$9952; institutional care for a severe case at US$20,305; and institutional care for a critical case at US$23,382 (Ismaila et al. (2021). The average total cost per COVID-19 case was US$11,925 (Ismaila et al., 2021). The estimates of unit costs in Ghana by Ismaila et al. (2021) are higher than those of Barasa et al. (2021) in Kenya because of the former calculated costs according to the Ministry of Health’s COVID-19 clinical management protocol.
Our study estimated that the average direct cost per case managed is Int$722.06 (US$289.53), which is roughly comparable to Barasa et al.’s (2021) unit cost of US$226 per asymptomatic and mildly to moderately ill COVID-19 patient managed using home-based care. However, our estimated direct cost per COVID-19 case-managed of US$289.53 is 3-fold, 3-fold, 5-fold, and 25-fold lower than Barasa et al.’s (2021) unit cost per asymptomatic, mild-to-moderate, severe, and critical COVID-19 disease case managed at hospital/isolation center, hospital general inpatient ward, and hospital intensive care unit, respectively.
Similarly, whereas our estimated direct cost per COVID-19 case of US$289.53 is comparable to Ismaila et al.’s (2021) total direct cost of home management per COVID-19 case of US$282, it is 41-fold lower than their average total direct cost per COVID-19 case of US$11,925. Comparison with the average total direct costs from Ghana and Kenya implies that our finding may be a gross underestimate and, thus, should be viewed as a lower limit.
Limitations of the Study
First, like other HCA studies, we used GDP per capita to monetarily value human life losses associated with the COVID-19 pandemic in Africa. GDP per capita suffers several limitations: (a) does not capture home non-marketed production; (b) does not reflect extant inequalities in wellbeing, income, and wealth; (c) omits negative externalities of economic production activities, e.g., environmental pollution, global warming, soil erosion, deforestation, inter-community fights over dwindling water resources (especially in arid and semi-arid areas), depletion of natural resources (and hence accompanying long-term wellbeing sustainability consequences); (d) not an accurate measure of societal happiness and quality of life (Stiglitz et al., 2010). Thus, our calculation yields the lower bound of the monetary value of a life lost to COVID-19.
Second, the standard HCA has some perceived shortcomings. One, Landefeld and Seskin (1982) posit that HCA “... is implicitly based upon the maximization of society’s present and future production” (p. 556). Thus, the approach assumes that the only reason society invests, for example, in preventing premature deaths from COVID-19 is to maximize economic production (or GDP). However, as Mooney (1977) argues, there are other reasons, e.g., human life (or health) has intrinsic value (valued for its own sake), society values the life (or health) of its members (productive or not), being alive enables individuals to enjoy leisure. Two, standard HCA attaches zero value for people without income, e.g., retired, children below legal working age, severely handicapped, and homemakers. Three, according to Landefeld and Seskin (1982) application of HCA entails “… choice of an appropriate social discount rate to convert future earnings into present values”, which is contentious (Claxton et al., 2011; Odum et al., 2020).
Third, the COVID-19 pandemic may have had broad adverse economic effects on labor markets, corporate investment, and other aspects of the macroeconomy (Campello et al., 2024; Eichenbaum et al., 2021). The economic policies (e.g., cash infusions) implemented by national governments may have contributed partly to mitigating economic losses (Cortes et al., 2022) and stemming the burden of non-fatal disability and fatalities associated with the pandemic. It was beyond the scope of the current study to estimate and incorporate additional costs related to economic policy interventions. The magnitude of additional costs would depend on the labor market effects and labor allocation effects.
Concerning labor market effects, the premature deaths from COVID-19 naturally reduce the labor supply. In an environment of reduced labor demand due to pandemic uncertainty (Campello et al., 2024), this results in lower output, revenues, and corporate investment. However, when fiscal and monetary policies support aggregate demand, it may lead to elevated inflation, as evidenced by the recent 2021 wave (Govindarajan et al., 2022). Elevated inflation is a direct economic cost, insofar as it reduces individuals’ real income. In this case, the cost is directly attributed to life losses, resulting in a mismatch between aggregate labor supply and aggregate demand.
Regarding labor allocation effects, the pandemic did not affect every African country equally; thus, its impact on labor supply is inherently heterogeneous. In theory, the potential adverse effects of COVID-19 on labor supply could be mitigated by increased labor mobility, which would suggest migratory patterns from countries (or local geographical regions) with relatively low labor shortages to those with relatively high labor shortages. However, the COVID-19-related restrictions, compounded by a growing wave of anti-immigration sentiment, may have prevented the ideal labor relocation (Funke et al., 2023).
Fourth, our study utilized the number of COVID-19 cases and deaths reported by individual African countries in estimating the discounted monetary value of human life losses associated with COVID-19 (Section 3.1) and the economic cost of COVID-19 in Africa (Section 3.2). These statistics are likely to be grossly underestimated due to the inadequacy of national health information systems (WHO/AFRO, 2012); 6% completeness of cause-of-death primary data in the WHO African Region (compared to 97% in the European Region and 94% in the Region of the Americas) (WHO, 2019b); and a 52% gap in International Health Regulations core capacities (WHO, 2020, 2021c).
Msemburi et al. (2023) estimated that between January 2020 and December 2021, the total COVID-19 death toll in the African Region was eight-fold higher than the officially reported number of COVID-19-related deaths. Thus, by relying on the cumulative number of COVID-19-related deaths reported by national governments, we may have underestimated the total monetary value of human life losses (in Section 3.1) and the associated indirect costs (in Section 3.1) by almost eight-fold. We chose to use the official national COVID-19-related deaths reported by individual WHO Member States, rather than the WHO excess mortality estimates published by Msemburi et al., to increase the likelihood of uptake of the study’s results in public health advocacy by Ministries of Health on the continent.
However, as explained in Section 3.3, to mitigate the underestimation of expected benefits from COVID-19 vaccination, the estimates of savings in potential direct and indirect costs of COVID-19 in Africa from COVID-19 vaccination that are reported in sub-Section 3.3 use the projected number of COVID-19 cases and not the actual reported cases (see Supplementary Tables S8 and S9).
Fifth, due to the availability of pertinent epidemiological evidence on the Oxford–AstraZeneca COVID-19 vaccine from randomized trials in Brazil, South Africa, and the UK, the estimations of “Savings in Potential Direct and Indirect Costs of COVID-19 in Africa Expected from COVID-19 Vaccination” reported in Section 3.3 assumed only Oxford–AstraZeneca and Pfizer vaccinations in Africa. Similar published epidemiological information for Moderna vaccine was not available at the time of our study. We acknowledge that, at the time, there was a significant international effort also to make the Moderna vaccine available to certain countries in Africa. Since different vaccines have varying success rates (efficacy) and expense levels, we are uncertain how much our cost savings estimates would have changed if pertinent epidemiological evidence were available at the time of our study and the international push to supply significant quantities of Moderna vaccine to Africa had been more successful.
Sixth, our estimates of indirect and direct costs of COVID-19 were derived using a cost-of-illness (COI) approach. We concur with Shiell et al. (1987) that COI estimates, such as those reported in this paper, are purely for raising public awareness of the economic burden of a public health problem and should not be used as a guide for decision-making regarding the prevention, diagnosis, and treatment of, for example, COVID-19. Setting COVID-19 control priorities requires evidence of the costs and consequences of alternative preventive, diagnostic, treatment, and rehabilitative interventions (Drummond et al., 2015).
Seventh, this study utilized current health expenditure (CHE) for each of the 54 African countries as a proxy for the direct health system costs associated with each COVID-19 case. The average cost of institutional management of a COVID-19 case in Ghana, at US$11,925, was 153 times the country’s per capita CHE of Int$78. Kenya’s total institutional cost per COVID-19 patient was US$3151, 36-fold the country’s per capita CHE. Therefore, there is a high likelihood that by using CHE per capita, we underestimated the value of health systems (and other intersectoral) resources used to prevent, diagnose, treat (manage), and rehabilitate COVID-19 cases.
Suggestions for Further Economic Research
In our view, there is a need for further economic studies in Africa for the following:
(1)
Undertake a sub-national analysis of the monetary value of human life losses, direct health system costs, indirect costs, and potential savings from COVID-19 vaccination using an adapted version of the analytical framework developed in the current study.
(2)
Conduct simulations assuming different COVID-19 infection and death rates in countries as the pandemic evolves.
(3)
Collect primary data to allow valuation of human life loss risk reductions associated with COVID-19 using the willingness-to-pay approach (Robinson et al., 2019).
(4)
Use cost-effectiveness analysis, cost-utility analysis, and cost-benefit analysis of mass vaccination against COVID-19 to guide decision-making concerning the choice between the three vaccines, i.e., Pfizer-BioNTech, Moderna, and Oxford–AstraZeneca. An example of such a study is the economic evaluation for mass vaccination against COVID-19 in Taiwan by Wang et al. (2021).
(5)
Compute the cost of public health interventions required to (i) prevent the spread of COVID-19, (ii) cover the cost of COVID-19 testing, and (iii) the cost of clinical management of COVID-19 by severity per country. Ismaila et al. (2021) and Barasa et al. (2021) are examples of studies that attempted to estimate unit costs of COVID-19 infection management by level of severity in Ghana and Kenya, respectively.
(6)
Calculate and compare the economic welfare loss due to the COVID-19 pandemic relative to a counterfactual scenario. Possible scenarios could include an economy without a pandemic (baseline); an economy with a pandemic but no government response, i.e., a passive government that adopts a laissez-faire approach; an economy with a pandemic but with a government implementing economic policies to mitigate the effects of a pandemic (Benmelech & Tzur-Ilan, 2020; Cortes et al., 2022).

5. Conclusions

Despite the limitations, the estimates reported in this paper demonstrate that COVID-19-associated mortality imposed a sizable economic burden on countries in continental Africa. The pandemic did not affect every country equally; thus, the estimated monetary value of human lives lost, the direct and indirect costs, and the savings in potential direct and indirect costs of COVID-19 in Africa, expected from COVID-19 vaccination, are inherently heterogeneous.
This study projected that 100% coverage with the COVID-19 vaccine could potentially save the continent a total of Int$41.6 billion (i.e., equivalent to 0.61% of Africa’s total GDP in 2021). The benefit–cost ratio of COVID-19 vaccination is 5.8, implying that Africa reaps $6 in return for every $1 spent on COVID-19 vaccination.
A significant number of COVID-19-related deaths and the associated economic losses could have been averted if (a) the countries had fully implemented the IHR core capacities to enhance effectiveness and efficiency of national pandemic prevention, preparedness and response; (b) there was efficient cross-border collaboration in implementing coordinated/synchronized public policy measures for pandemic prevention, preparedness, and response; (c) there was more effective coordinated global solidarity and collaboration to bolster global health architecture aimed at assuring equitable and timely production, distribution, and access to effective vaccines and other related public health commodities (therapeutics and diagnostics) to combat pandemics that have “public bad” attributes of non-excludability (impossible or challenging to prevent individuals from getting infected) and non-rivalrous (infection of one person does not deplete chances of other persons getting infected).
Once again, we caution readers that the economic burden of COVID-19 evidence presented in this paper is intended for advocacy purposes, aiming to raise public awareness and increase investments in health-related systems for effective preparedness and response to public health emergencies. It is not a guide for decision-making regarding the prevention, diagnosis, and treatment of COVID-19. Setting COVID-19 control priorities requires evidence of the costs and consequences of alternative preventive, diagnostic, therapeutic, and rehabilitative public health policy interventions.

Supplementary Materials

The following supporting information can be downloaded at: https://www.mdpi.com/article/10.3390/economies13080241/s1, Supplementary Table S1. List of names and population of 54 sovereign countries in Africa. Supplementary Table S2. Africa’s COVID-19 recovered cases, active cases, and deaths reported by 30 June 2021. Supplementary Table S3. African countries’ gross domestic product (GDP) per capita in purchasing power parity (PPP) or international dollars (Int$), 2021. Supplementary Table S4. Forecast of current health expenditure (CHE) per capita for each African country (2021 PPP). Supplementary Table S5. Average life expectancy at birth per country in Africa. Supplementary Table S6. African countries’ number of COVID-19 deaths per age group as of 30 June 2021. Supplementary Table S7. African countries’ labor force participation rate for ages 15–64 in 2019. Supplementary Table S8. Number of people projected to contract COVID-19 without and with vaccination in Africa. Supplementary Table S9. Projected deaths from COVID-19 without and with Oxford–AstraZeneca vaccination in Africa.

Author Contributions

J.M.K. and G.M. designed the study, extracted the data on per capita GDP from the IMF database, current health expenditure per person from the WHO Global Health Expenditure database, number of COVID-19 deaths in the 54 African Sovereign States from the Worldometer database, ages of onset of death from the Worldometer database, developed the human capital approach model on Excel software, and wrote the manuscript. All authors have read and agreed to the published version of the manuscript.

Funding

This research has been fully funded by the African Economic Research Consortium (AERC), through grant number RC21533, in the context of the AERC collaborative project on “Addressing Health Financing Gaps & Vulnerabilities in Africa due to the COVID-19 pandemic”.

Institutional Review Board Statement

Ethics approval was unnecessary since the study did not involve human or animal subjects. It relied exclusively on the analysis of secondary data from the International Monetary Fund (IMF, 2021), Statista (2021a, 2021b), WHO (2021a, 2021b, 2020, 2019a), and Worldometer (2021) databases. The data is freely accessible to the public.

Informed Consent Statement

Not applicable.

Data Availability Statement

The original contributions presented in the study are included in the manuscript/Supplementary Materials. Further inquiries can be directed to the corresponding author.

Acknowledgments

The authors are indebted to God for meeting all their needs while undertaking the study. The authors are deeply grateful for the research grant from AERC, and the multifaceted support provided by the AERC staff throughout the study. The constructive comments and suggestions from the Economies journal editorial team, as well as the three anonymous peer reviewers, helped improve the quality of our paper. This paper is dedicated to the Governments, human resources for health, and people living on the African continent for the spirited fight against the COVID-19 global pandemic. The paper exclusively contains the authors’ views and does not represent the views or policies of the AERC or institutions of affiliation.

Conflicts of Interest

The authors declare that they have no conflicts of interest.

Abbreviations

AADiAverage age at onset of death in the ith age group
AERCAfrican Economic Research Consortium
ALEjAverage life expectancy in country j
A L T E S T C j Average cost per COVID-19 test
AMUArab Maghreb Union
ATICjAverage indirect cost per COVID-19 death in country j
AUAfrican Union
A W T P j Average willingness-to-pay
ECAEast African Community
CEHPCjCurrent expenditure on health per capita in the jth country in 2021
CEMACCentral African Economic and Monetary Community
COVID-19Coronavirus disease 2019
C O V I D - 19 D P r e v e n t e d Number of COVID-19-associated deaths prevented
D R P B Risk of COVID-19 resulting in death among those vaccinated with the Pfizer-BioNTech BNT162b2
D R u n v a c c i n a t e d Risk of COVID-19 resulting in death among the unvaccinated
DYLLDiscounted years of life lost
ECOWASEconomic Community of West African States
GDPGross domestic product
GDPPCjGDP per capita for the jth country in 2021
HCAHuman capital approach
HIV/AIDSHuman immunodeficiency virus infection and acquired immune deficiency syndrome
IMFInternational Monetary Fund
INT$International Dollars or Purchasing Power Parity (PPP)
I R A Z COVID-19 infection risk with Oxford–AstraZeneca
I R C o n t r o l COVID-19 infection risk without
IVAImplied values approach
MViMonetary value of a life lost for the ith age group
N A C Number of active COVID-19 cases
N A P Average number of working-age family members and friends accompanying and visiting COVID-19 patients
N D D A Number of disability days per active COVID-19 case
N D D R Number of disability days per recovered person
NHGPPCNon-health GDP per capita
NHRSNational health research system
NHSNational health systems
N R C Number of persons that recovered from COVID-19 infection in country j
N V Number of COVID-19 laboratory-diagnosed cases in country j
N V D Average number of days visited by a family/friend per COVID-19 patient
OOPsDirect out-of-pocket payments (OOPs)
PiProportion of COVID-19 deaths borne by age group i
P o P j Number of country j’s population
P o P D w i t h Number of people in the jth country that would be expected to die from COVID-19 even though vaccinated
P o P D w i t h o u t Number of people infected in the jth country expected to die from COVID-19 without vaccination
P o P I w i t h o u t Number of people in the population infected by COVID-19 without vaccination
rDiscount rate
SADCSouthern African Development Community
SDHSocial determinants of health
TCCOVID-19Total economic cost of COVID-19
TCOVDjTotal number of human lives lost from COVID-19 in the jth country
T C O V I D C A S E S j Total number of reported COVID-19 cases per country
T C O V I D N E G j Total number of cases that tested negative for COVID-19 per country
T D C C O V I D - 19 Total direct costs of COVID-19
T I C C O V I D - 19 Total indirect costs of COVID-19
TMVAfricaAfrican continent’s total monetary value of human life
TMVj=1,..,54Country j total monetary value
T N H S C C O V I D - 19 Transport of persons with COVID-19 symptoms to testing and treatment centers, and transport of accompanying family persons
T O O P S C O V I D - 19 Total out-of-pocket payments related to COVID-19 testing, isolation, treatment, health workers’ consultation, medicines, and bribes
T O S C C O V I D - 19 Monetary value of quantities of inputs borne by other sectors involved in combating the community spread of COVID-19 infections
T P C C O V I D - 19 Psychic/intangible costs
UDYLLUndiscounted years of life lost
VEVaccine efficacy
V F T L Value of work time lost among all family members (and friends) of working-age accompanying and/or visiting patients.
V P Y L L C O V I D - 19 Value of potentially productive years of life lost among 15–64-year-olds
V P T L N F L Value of productive time lost among non-fatal COVID-19 cases in a specific working-age bracket
W D Wage per day
WHOWorld Health Organization
WTPWillingness to pay
YLLYear of life lost

References

  1. Adekunjo, F. O., Rasiah, R., Dahlui, M., & Ng, C. W. (2020). Assessing the willingness to pay for HIV counselling and testing service: A contingent valuation study in Lagos State, Nigeria. African Journal of AIDS Research, 19, 287–295. [Google Scholar] [CrossRef] [PubMed]
  2. African Union (AU). (2020). Impact of the coronavirus (COVID-19) on the African economy. AU. [Google Scholar]
  3. Asante, A., Wasike, W. S. K., & Ataguba, J. E. (2020). Health financing in Sub-Saharan Africa: From analytical frameworks to empirical evaluation. Applied Health Economics and Health Policy, 18, 743–746. [Google Scholar] [CrossRef]
  4. Attema, A. E., Brouwer, W. B. F., & Claxton, K. (2018). Discounting in economic evaluations. PharmacoEconomics, 36, 745–758. [Google Scholar] [CrossRef]
  5. Barasa, E., Kairu, A., Ng’ang’a, W., Maritim, M., Were, V., Akech, S., & Mwangangi, M. (2021). Examining unit costs for COVID-19 case management in Kenya. BMJ Global Health, 6, e004159. [Google Scholar] [CrossRef] [PubMed]
  6. Benmelech, E., & Tzur-Ilan, N. (2020). The determinants of fiscal and monetary policies during the COVID-19 crisis. NBER Working Paper No. 27461. U.S. National Bureau Of Economic Research. [Google Scholar] [CrossRef]
  7. Bernal, J. L., Andrews, N., Gower, C., Robertson, C., Stowe, J., Tessier, E., Simmons, R., Cottrell, S., Roberts, R., O’Doherty, M., & Brown, K. (2021). Effectiveness of the Pfizer-BioNTech and Oxford-AstraZeneca vaccines on COVID-19-related symptoms, hospital admissions, and mortality in older adults in England: Test negative case-control study. British Medical Journal, 373, n1088. [Google Scholar] [CrossRef] [PubMed]
  8. Bhanot, D., Singh, R., Verma, S. K., & Sharad, S. (2021). Stigma and discrimination during the COVID-19 Pandemic. Frontiers in Public Health, 8, 577018. [Google Scholar] [CrossRef]
  9. Cabarkapa, S., Nadjidai, S. E., Murgier, J., & Ng, C. H. (2020). The psychological impact of COVID-19 and other viral epidemics on frontline healthcare workers and ways to address it: A rapid systematic review. Brain, Behavior, & Immunity—Health, 8, 100144. [Google Scholar] [CrossRef]
  10. Campello, M., Kankanhalli, G., & Muthukrishnan, P. (2024). Corporate hiring under COVID-19: Financial constraints and the nature of new jobs. Journal of Financial and Quantitative Analysis, 59(4), 1541–1585. [Google Scholar] [CrossRef]
  11. Catma, S., & Varol, S. (2021). Willingness to pay for a hypothetical COVID-19 vaccine in the United States: A contingent valuation approach. Vaccines, 9, 318. [Google Scholar] [CrossRef]
  12. Cerda, A. A., & García, L. Y. (2021). Willingness to pay for a COVID-19 vaccine. Applied Health Economics and Health Policy, 19, 343–351. [Google Scholar] [CrossRef]
  13. Cesare, C. (2020). COVID-19 psychological implications: The role of shame and guilt. Frontiers in Psychology, 11, 571828. [Google Scholar] [CrossRef]
  14. Chima, R. I., Goodman, C., & Mills, A. (2003). The economic impact of malaria in Africa: A critical review of the evidence. Health Policy, 63, 17–36. [Google Scholar] [CrossRef]
  15. Claxton, K., Paulden, M., Gravelle, H., Brouwer, W., & Culyer, A. J. (2011). Discounting and decision making in the economic evaluation of health-care technologies. Health Economics, 20, 2–15. [Google Scholar] [CrossRef]
  16. Cortes, G. S., Gao, G. P., Silva, F. B. G., & Song, Z. (2022). Unconventional monetary policy and disaster risk: Evidence from the subprime and COVID–19 crises. Journal of International Money and Finance, 122, 102543. [Google Scholar] [CrossRef]
  17. Costa-Font, J., Rudisill, C., Harrison, S., & Salmasi, L. (2021). The social value of a SARS-CoV-2 vaccine: Willingness to pay estimates from four western countries (pp. 1–41). IZA Discussion Paper Series No. 14475. IZA Institute of Labor Economics, Department of Economics and Finance, Rome (Italy), Catholic University. Available online: http://ftp.iza.org/dp14475.pdf (accessed on 28 August 2021).
  18. Cross, M. J., March, L. M., Lapsley, H. M., Tribe, K. L., Brnabic, A. J., Courtenay, B. G., & Brooks, P. M. (2000). Determinants of willingness to pay for hip and knee joint replacement surgery for osteoarthritis. Rheumatology, 39, 1242–1248. [Google Scholar] [CrossRef] [PubMed]
  19. Drummond, M. F., Sculpher, M. J., Claxton, K., Stoddart, G. L., & Torrance, G. W. (2015). Methods for the economic evaluation of health care programmes (4th ed., pp. 1–437). Oxford University Press. [Google Scholar]
  20. Dubey, S., Biswas, P., Ghosh, R., Chatterjee, S., Dubey, M. J., Chatterjee, S., Lahiri, D., & Lavie, C. J. (2020). Psychosocial impact of COVID-19. Diabetes & Metabolic Syndrome, 14, 779–788. [Google Scholar] [CrossRef]
  21. Edejer, T. T. T., Baltussen, R., Adam, T., Hutubessy, R., Acharya, A., Evans, D. B., & Murray, C. J. L. (Eds.). (2003). Making choices in health: WHO guide to cost-effectiveness analysis (pp. 1–318). WHO. [Google Scholar]
  22. Eichenbaum, M. S., Rebelo, S., & Trabandt, M. (2021). The macroeconomics of epidemics. The Review of Financial Studies, 34(11), 5149–5187. [Google Scholar] [CrossRef]
  23. Fein, R. (1958). Economics of mental illness (pp. 1–139). Basic Books. [Google Scholar]
  24. Funke, M., Schularick, M., & Trebesch, C. (2023). Populist leaders and the economy. American Economic Review, 113(12), 3249–3288. [Google Scholar] [CrossRef]
  25. Geirdal, A. Ø., Ruffolo, M., Leung, J., Thygesen, H., Price, D., Bonsaksen, T., & Schoultz, M. (2021). Mental health, quality of life, wellbeing, loneliness and use of social media in a time of social distancing during the COVID-19 outbreak. A cross-country comparative study. Journal of Mental Health, 30, 148–155. [Google Scholar] [CrossRef]
  26. Govindarajan, V., Ilyas, H., Silva, F. B. G., Srivastava, A., & Enache, L. (2022). How companies can prepare for a long run of high inflation. Harvard Business Review. Available online: https://hbr.org/2022/05/how-companies-can-prepare-for-a-long-run-of-high-inflation (accessed on 20 June 2025).
  27. Gronholm, P., Nosé, M., Van Brakel, W., Eaton, J., Ebenso, B., Fiekert, K., Milenova, M., Sunkel, C., Barbui, C., & Thornicroft, G. (2021). Reducing stigma and discrimination associated with COVID-19: Early-stage pandemic rapid review and practical recommendations. Epidemiology and Psychiatric Sciences, 30, e15. [Google Scholar] [CrossRef]
  28. Grossman, M. (2000). The human capital model. In A. J. Culyer, & J. P. Newhouse (Eds.), Handbook of health economics (Vol. 1, pp. 348–408). Elsevier. [Google Scholar]
  29. Haacker, M., Hallett, T. B., & Atun, R. (2020). On discount rates for economic evaluations in global health. Health Policy and Planning, 35, 107–111. [Google Scholar] [CrossRef] [PubMed]
  30. Hanly, P., Ahern, M., Sharp, L., Ursul, D., & Loughnane, G. (2022). The cost of lost productivity due to premature mortality associated with COVID-19: A Pan-European study. The European Journal of Health Economics, 23(2), 249–259. [Google Scholar] [CrossRef] [PubMed]
  31. Himmler, S., van Exel, J., & Brouwer, W. (2022). Did the COVID-19 pandemic change the willingness to pay for an early warning system for infectious diseases in Europe? The European Journal of Health Economics, 23, 81–94. [Google Scholar] [CrossRef] [PubMed]
  32. Ilesanmi, O., Afolabi, A., & Uchendu, O. (2021). The prospective COVID-19 vaccine: Willingness to pay and perception of community members in Ibadan, Nigeria. PeerJ, 9, e11153. [Google Scholar] [CrossRef]
  33. International Monetary Fund (IMF). (2021). World economic outlook database. Update, January 2021. Available online: https://www.imf.org/en/Publications/WEO/weo-database/2020/October (accessed on 16 June 2021).
  34. Ismaila, H., Asamani, J. A., Lokossou, V. K., Oduro-Mensah, E. O., Nabyonga-Orem, J., & Akoriyea, S. K. (2021). The cost of clinical management of SARSCOV-2 (COVID-19) infection by the level of disease severity in Ghana: A protocol-based cost of illness analysis. BMC Health Services Research, 21, 1115. [Google Scholar] [CrossRef]
  35. Jimoh, A., Sofola, O., Petu, A., & Okorosobo, T. (2007). Quantifying the economic burden of malaria in Nigeria using the willingness to pay approach. Cost Effectiveness and Resource Allocation, 5, 6. [Google Scholar] [CrossRef] [PubMed]
  36. Jones-Lee, M. W. (1982). The value of life and safety (pp. 1–309). North Holland. [Google Scholar]
  37. Jones-Lee, M. W. (1985). The value of life and safety: A survey of recent developments. The Geneva Papers on Risk and Insurance, 10, 141–173. [Google Scholar] [CrossRef]
  38. Kankeu, H. T., Saksena, P., Xu, K., & Evans, D. B. (2013). The financial burden from non-communicable diseases in low-and middle-income countries: A literature review. Health Research Policy and Systems, 11, 31. [Google Scholar] [CrossRef]
  39. Kirigia, J. M., & Muthuri, R. N. D. K. (2020a). The fiscal value of human lives lost from coronavirus disease (COVID-19) in China. BMC Research Notes, 13, 198. [Google Scholar] [CrossRef]
  40. Kirigia, J. M., & Muthuri, R. N. D. K. (2020b). The discounted money value of human lives lost due to COVID-19 in Spain. Journal of Health Research, 34, 455–460. [Google Scholar] [CrossRef]
  41. Kumar, A., & Nayar, K. R. (2021). COVID-19 and its mental health consequences. Journal of Mental Health, 30, 1–2. [Google Scholar] [CrossRef]
  42. Landefeld, J. S., & Seskin, E. P. (1982). The economic value of life: Linking theory to practice. American Journal of Public Health, 72, 555–566. [Google Scholar] [CrossRef]
  43. Lin, Y., Hu, Z., Zhao, Q., Alias, H., Danaee, M., & Wong, L. P. (2020). Understanding COVID-19 vaccine demand and hesitancy: A nationwide online survey in China. PLOS Neglected Tropical Diseases, 14, e0008961. [Google Scholar] [CrossRef]
  44. Mooney, G. H. (1977). The valuation of human life (pp. 1–165). Macmillan. [Google Scholar]
  45. Mostafa, A., Sabry, W., & Mostafa, N. S. (2020). COVID-19-related stigmatisation among a sample of Egyptian healthcare workers. PLoS ONE, 15, e0244172. [Google Scholar] [CrossRef] [PubMed]
  46. Msemburi, W., Karlinsky, A., Knutson, V., Aleshin-Guendel, S., Chatterji, S., & Wakefield, J. (2023). The WHO estimates of excess mortality associated with the COVID-19 pandemic. Nature, 613, 130–137. [Google Scholar] [CrossRef]
  47. Musango, L., Mandrosovololona, V., Randriatsarafara, F. M., Ranarison, V. M., Kirigia, J. M., & Ratsimbasoa, A. C. (2024). The present value of human life losses associated with COVID-19 and likely productivity losses averted through COVID-19 vaccination in Madagascar. BMC Public Health, 24, 3296. [Google Scholar] [CrossRef]
  48. Mushkin, S. J., & Collings, F. A. (1959). Economic costs of disease and injury. Public Health Reports, 74, 795–809. [Google Scholar] [CrossRef] [PubMed]
  49. Nabyonga-Orem, J., Christmal, C., Addai, K. F., Mwinga, K., Aidam, K., Nachinab, G., Namuli, S., & Asamani, J. A. (2023). The state and significant drivers of health systems efficiency in Africa: A systematic review and meta-analysis. Journal of Glob Health, 13, 04131. [Google Scholar] [CrossRef] [PubMed]
  50. Niewiadomski, P., Ortega-Ortega, M., & Łyszczarz, B. (2025). Productivity losses due to health problems arising from COVID-19 pandemic: A systematic review of population-level studies worldwide. Applied Health Economics and Health Policy, 23, 231–251. [Google Scholar] [CrossRef]
  51. Odum, A. L., Becker, R. J., Haynes, J. M., Galizio, A., Frye, C. C. J., Downey, H., Friedel, J. E., & Perez, D. M. (2020). Delay discounting of different outcomes: Review and theory. Journal of the Experimental Analysis of Behavior, 113, 657–679. [Google Scholar] [CrossRef]
  52. Onwujekwe, O., Orjiakor, C., Ogbozor, P., Agu, I., Agwu, P., Wright, T., Balabanova, D., & Kohler, J. (2023). Examining corruption risks in the procurement and distribution of COVID-19 vaccines in select states in Nigeria. Journal of Pharmaceutical Policy & Practice, 16(1), 141. [Google Scholar] [CrossRef]
  53. Organisation for Economic Co-operation and Development (OECD). (2000). A system of health accounts. Version 1.0 (pp. 1–184). OECD. [Google Scholar]
  54. Petty, W. (1699). Political arithmetick, or a discourse: Concerning the extent and value of lands, people, buildings; husbandry, manufacture, commerce, fishery, artizans, seamen, soldiers; publick revenues, interest, taxes, superlucration, registries, banks. Robert Caluel. [Google Scholar]
  55. Rice, D. P. (2000). Cost of illness studies: What is good about them? Injury Prevention, 6, 177–179. [Google Scholar] [CrossRef] [PubMed]
  56. Robinson, L., Hammitt, J., & O’Keeffe, L. (2019). Valuing mortality risk reductions in global benefit-cost analysis. Journal of Benefit-Cost Analysis, 10(S1), 15–50. [Google Scholar] [CrossRef] [PubMed]
  57. Rusakaniko, S., Makanga, M., Ota, M., Bockarie, M., Banda, G., Okeibunor, J., Mutapi, F., Tumusiime, P., Nyirenda, T., Kirigia, J. M., & Nabyonga-Orem, J. (2019). Strengthening national health research systems in the WHO African region—Progress towards universal health coverage. Globalization and Health, 15, 50. [Google Scholar] [CrossRef] [PubMed]
  58. Shiell, A., Gerard, K., & Donaldson, C. (1987). Cost of illness studies: An aid to decision-making? Health Policy, 8, 317–323. [Google Scholar] [CrossRef]
  59. Slothuus, U., & Brooks, R. G. (2000). Willingness to pay in arthritis: A Danish contribution. Rheumatology, 39, 791–799. [Google Scholar] [CrossRef]
  60. Statista. (2021a). Distribution of coronavirus (COVID-19) deaths in South Africa as of November 16, 2020, by age. Available online: https://www.statista.com/statistics/1127280/coronavirus-covid-19-deaths-by-age-distribution-south-africa/ (accessed on 2 June 2021).
  61. Statista. (2021b). Coronavirus (COVID-19) mortality rate in Tunisia as of January 2021, by age group (in deaths per 100,000 individuals). Available online: https://www.statista.com/statistics/1203320/covid-19-mortality-rate-in-tunisia-by-age-group/ (accessed on 2 June 2021).
  62. Stiglitz, J. E., Sen, A., & Fitoussi, J. P. (Eds.). (2010). Mismeasuring our lives: Why GDP doesn’t add up (pp. 1–176). The New Press. [Google Scholar]
  63. Thabane, L., Mbuagbaw, L., Zhang, S., Samaan, Z., Marcucci, M., Ye, C., Thabane, M., Giangregorio, L., Dennis, B., Kosa, D., Debono, V. B., Dillenburg, R., Fruci, V., Bawor, M., Lee, J., Wells, G., & Goldsmith, C. H. (2013). A tutorial on sensitivity analyses in clinical trials: The what, why, when and how. BMC Medical Research Methodology, 13, 92. [Google Scholar] [CrossRef]
  64. Thorbecke, E. (2022). What can Africa learn from a better understanding of the interaction among growth, inequality and poverty in the fight against the COVID-19 pandemic? Research Report, January 6, 2022, Prepared for the AERC Collaborative Project on Addressing Health Financing Gaps and Vulnerabilities in Africa Due to the Covid-19. AERC. [Google Scholar]
  65. United Nations (UN). (2015). Transforming our world: The 2030 agenda for sustainable development (pp. 1–35). General Assembly Resolution A/RES/70/1. UN. [Google Scholar]
  66. Voysey, M., Clemens, S. A. C., Madhi, S. A., Weckx, L. Y., Folegatti, P. M., Aley, P. K., Angus, B., Baillie, V. L., Barnabas, S. L., Bhorat, Q. E., Bibi, S., Briner, C., Cicconi, P., Clutterbuck, E. A., Collins, A. M., Cutland, C. L., Darton, T. C., Dheda, K., Dold, C., … Duncan, C. J. A. (2021). Single-dose administration and the influence of the timing of the booster dose on immunogenicity and efficacy of ChAdOx1 nCoV-19 (AZD1222) vaccine: A pooled analysis of four randomised trials. Lancet, 397, 881–891. [Google Scholar] [CrossRef]
  67. Wang, W.-C., Fann, F. C.-Y., Chang, R.-E., Jeng, Y.-C., Hsu, C.-Y., Chen, H.-H., Liu, J.-T., & Yen, A. M.-F. (2021). Economic evaluation for mass vaccination against COVID-19. Journal of the Formosan Medical Association, 120(S1), S95–S105. [Google Scholar] [CrossRef]
  68. Weisbrod, B. A. (1971). Costs and benefits of medical research: A case study of poliomyelitis. Journal of Political Economy, 79, 527–544. [Google Scholar] [CrossRef]
  69. WHO. (2001). Macroeconomics and health: Investing in health for economic development (pp. 1–210). WHO. [Google Scholar]
  70. WHO. (2009). Guide to identifying the economic consequences of disease and injury (pp. 1–132). WHO. [Google Scholar]
  71. WHO. (2019a). Global health expenditure database. Available online: https://apps.who.int/nha/database/Select/Indicators/en (accessed on 17 July 2021).
  72. WHO. (2019b). World health statistics overview 2019: Monitoring health for the SDGs, sustainable development goals (pp. 1–120). WHO. [Google Scholar]
  73. WHO. (2020). Global health observatory data repository. International health regulations (2005) monitoring framework, SPAR. Available online: http://apps.who.int/gho/data/node.main.IHRSPAR?lang=en (accessed on 19 December 2020).
  74. WHO. (2021a). Global health observatory. UHC service coverage index. Available online: http://apps.who.int/gho/portal/uhc-overview.jsp (accessed on 30 July 2021).
  75. WHO. (2021b). Global health observatory data repository. Water, sanitation, and hygiene. Available online: https://apps.who.int/gho/data/node.main.166?lang=en (accessed on 14 November 2021).
  76. WHO. (2021c). World health statistics 2021: Monitoring health for the SDGs, sustainable development goals (pp. 1–121). WHO. [Google Scholar]
  77. WHO/AFRO. (2006). Health financing: A strategy for the African region (pp. 1–16). Document AFR/RC56/10. WHO/AFRO. [Google Scholar]
  78. WHO/AFRO. (2012). The African health observatory: Opportunity for strengthening health information systems through national health observatories (pp. 1–6). Sixty-Second Session Regional Committee for Africa Document AFR/RC62/13. WHO/AFRO. [Google Scholar]
  79. World Bank. (2021). Labour force participation rate, total (% of total population ages 15–64) (modelled ILO estimate). Available online: https://data.worldbank.org/indicator/SL.TLF.ACTI.ZS (accessed on 6 September 2021).
  80. Worldometer. (2021). COVID-19 coronavirus pandemic. Last updated: June 30, 2021, 06:03 GMT. Available online: https://www.worldometers.info/coronavirus/?#countries (accessed on 30 June 2021).
  81. Zhao, J., HuajieJin, H., Li, X., Zheng, W., Wang, H., & Pennington, M. (2021). Disease burden attributable to the first wave of COVID-19 in China and the effect of timing on the cost-effectiveness of movement restriction policies. Value in Health, 24, 615–624. [Google Scholar] [CrossRef] [PubMed]
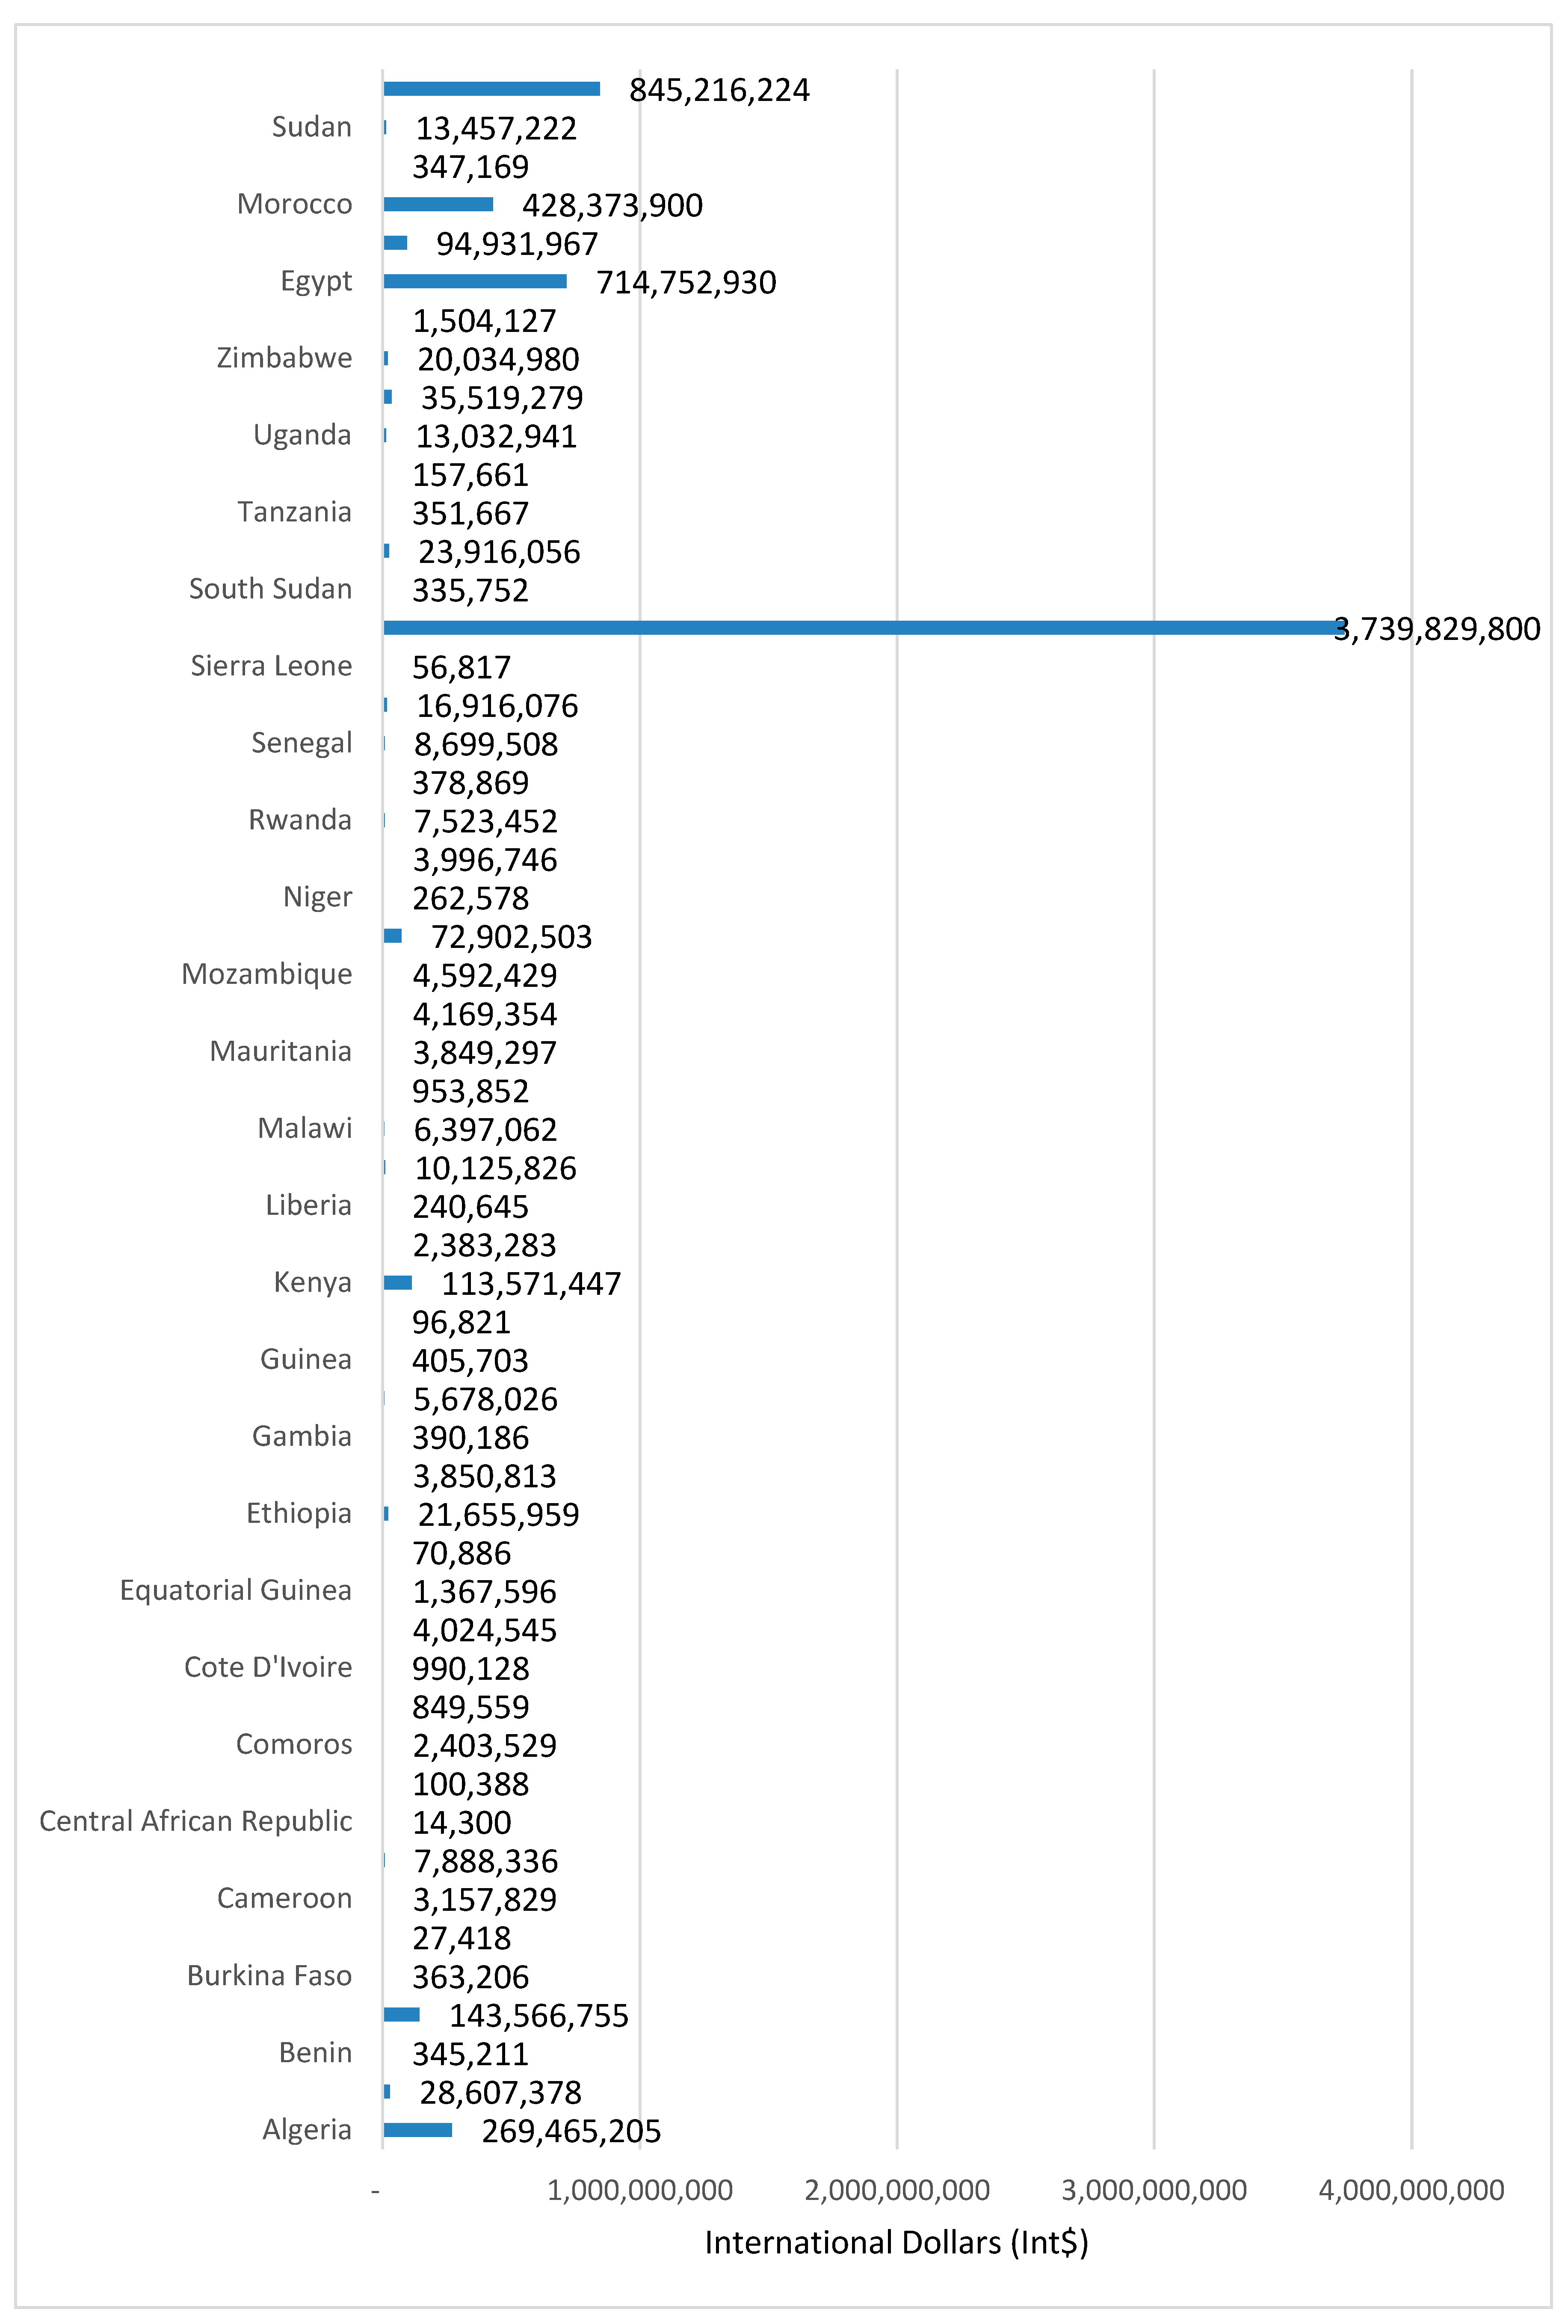
Figure 1. Discounted total monetary value of human life losses associated with COVID-19 in Africa by 30 June 2021 (in International Dollars).
Economies 13 00241 g001
Figure 2. Discounted monetary value of human life losses from COVID-19 by age group in Africa (Int$).
Economies 13 00241 g002
Figure 3. Total indirect cost of COVID-19 by country in Africa (in 2021 Int$ or PPP).
Economies 13 00241 g003
Figure 4. Average indirect cost of COVID-19 by country in Africa (in 2021 Int$ or PPP).
Economies 13 00241 g004
Figure 5. Estimated direct cost of preventing and managing COVID-19 cases in Africa (2021 Int$ or PPP).
Economies 13 00241 g005
Figure 6. Total costs associated with COVID-19 in Africa (in 2021 Int$ or PPP).
Economies 13 00241 g006
Figure 7. Average total cost associated with COVID-19 per person in population in Africa (in 2021 Int$ or PPP).
Economies 13 00241 g007
Figure 8. Total direct cost savings with COVID-19 Oxford–AstraZeneca vaccination in Africa (in 2021 Int$ or PPP).
Economies 13 00241 g008
Figure 9. Total indirect cost savings from COVID-19 Oxford–AstraZeneca vaccination in Africa (in 2021 Int$ or PPP).
Economies 13 00241 g009
Figure 10. Total cost saving expected from COVID-19 Oxford–AstraZeneca vaccine in Africa (in 2021 Int$ or PPP).
Economies 13 00241 g010
Table 1. South Africa and Tunisia’s age distribution of COVID-19 deaths.
Age Group (Years)South Africa (Percent) *Tunisia (Percent) **
0–4 years0.2750.014
5–9 years0.1750.000
10–14 years0.1750.014
15–19 years0.3750.078
20–24 years0.5750.071
25–29 years1.0750.107
30–34 years2.0750.170
35–39 years3.2750.448
40–44 years4.5750.618
45–49 years6.5751.051
50–54 years8.9752.223
55–59 years12.6754.482
60–64 years14.1759.192
65–69 years13.17518.802
70–74 years10.67523.114
75 years and older21.17539.615
Source: * Statista (2021a); ** Statista (2021b).
Table 2. Average age of onset of COVID-19 death per age group.
Age GroupAverage Age of Onset (Years) *
0–4 years2
5–9 years7
10–14 years12
15–19 years17
20–24 years22
25–29 years27
30–34 years32
35–39 years37
40–44 years42
45–49 years47
50–54 years52
55–59 years57
60–64 years62
65–69 years67
70–74 years72
Source: * Author’s estimates.
Table 3. COVID-19 infection risk among control group and the vaccinated group.
Group(A) Group
Size
(B) No. Infected(C) Infection Risk [C = (B/A)](D) Infection Risk (%) [D = C × 100]
Control85812480.028901062.890106048
ChAdOx1 nCov-19 (AZ)8597840.009770850.97708503
Source: Voysey et al. (2021). Note: Vaccine efficacy (VE) = ((risk for the control group − risk for the vaccinated group)/risk for the placebo group) × 100 = ((2.89010604824613 − 0.97708502966151)/2.89010604824613) × 100 = 66.19207%.
Table 4. The risk of death from COVID-19 among the unvaccinated and the vaccinated.
Group (A) Total No of Cases *(B) No. of Deaths *(C) Death Risk [C = (B/A)] **(D) Death Risk (%) [D = C × 100] **
Unvaccinated809110630.13138054613.13805463
≥14 days after vaccination750510.0686.8
Vaccine efficacy (VE) 48.24195673
Source: * Bernal et al. (2021). ** Author’s calculation.
Table 5. The discounted monetary value of actual human life losses from COVID-19 in Africa as of 30 June 2021 (in 2021 Int$ or PPP).
CountryPopulation in 2021 * (A)COVID-19 Deaths as of 30 June 2021 * (B)Total Discounted Monetary Value of Human Lives Lost (Int$) [C] **Discounted Monetary Value per Human Life Lost (Int$) [D = C/B] **The Discounted Monetary Value of Human Life Lost per Person in the Population (Int$) [E = C/A] **
Algeria44,634,4633708269,465,20572,6716.04
Angola33,874,01589428,607,37831,9990.84
Benin12,436,641104345,21133190.03
Botswana2,398,5761125143,566,755127,61559.85
Burkina Faso21,468,861168363,20621620.02
Burundi12,239,994827,41834270.00
Cameroon27,198,36413243,157,82923850.12
Cape Verde561,9732867,888,33627,58214.04
Central African Republic4,912,8639814,3001460.00
Chad16,890,785174100,3885770.01
Comoros887,9111462,403,52916,4632.71
Congo, Republic of5,652,216165849,55951490.15
Cote d’Ivoire27,023,309313990,12831630.04
Congo, Democratic Republic of92,245,8529244,024,54543560.04
Equatorial Guinea1,448,3961211,367,59611,3020.94
Eritrea3,595,0382370,88630820.02
Ethiopia117,775,639432021,655,95950130.18
Gabon2,277,6131593,850,81324,2191.69
Gambia, The2,483,649181390,18621560.16
Ghana31,714,1537955,678,02671420.18
Guinea13,484,325169405,70324010.03
Guinea-Bissau2,013,9486996,82114030.05
Kenya54,941,8313621113,571,44731,3652.07
Lesotho2,159,0953292,383,28372441.10
Liberia5,175,111127240,64518950.05
Madagascar28,393,80591110,125,82611,1150.36
Malawi19,617,94511946,397,06253580.33
Mali20,826,158525953,85218170.05
Mauritania4,770,2944873,849,29779040.81
Mauritius1,273,865184,169,354231,6313.27
Mozambique32,119,3518724,592,42952670.14
Namibia2,586,431144572,902,50350,45228.19
Niger25,069,087193262,57813610.01
Nigeria211,184,86921203,996,74618850.02
Rwanda13,269,2714317,523,45217,4560.57
São Tomé and Príncipe223,18537378,86910,2401.70
Senegal17,179,45111668,699,50874610.51
Seychelles98,9516816,916,076248,766170.95
Sierra Leone8,137,3759856,8175800.01
South Africa60,049,60160,2643,739,829,80062,05762.28
South Sudan11,323,788117335,75228700.03
Swaziland1,172,07367823,916,05635,27420.40
Tanzania61,412,58921351,66716,7460.01
Togo8,470,400129157,66112220.02
Uganda47,164,70198913,032,94113,1780.28
Zambia18,891,903213835,519,27916,6131.88
Zimbabwe15,077,192176120,034,98011,3771.33
Djibouti1,002,2281551,504,12797041.50
Egypt104,243,58216,148714,752,93044,2636.86
Libya6,963,848319194,931,96729,75013.63
Morocco37,344,1289292428,373,90046,10111.47
Somalia16,330,692775347,1694480.02
Sudan44,860,676275413,457,22248860.30
Tunisia11,941,21914,843845,216,22456,94470.78
TOTAL1,370,493,279142,1716,684,101,19647,0154.88
Sources: * Worldometer (2021); ** Authors’ estimates.
Table 6. Total and average indirect cost among 15–64 years old by country in Africa (in 2021 Int$ or PPP).
Country(A). COVID-19 Deaths 2021 *(B). Total Monetary Value of Lives Lost to COVID-19 (Int$) ***(C). Labor Force Participation Rate for Ages 15–64 (%) **(D). To Indirect Cost (Int$) [D = Bx(C/100)] ***(E). Average Indirect Cost [E = (D/A)] ***
Algeria684 109,107,102 46.4 50,625,695 74,040
Angola486 27,554,096 77.921,464,641 44,176
Benin19 342,422 71.7245,517 12,802
Botswana611 133,347,604 73.097,343,751 159,205
Burkina Faso31 360,381 67.8244,338 7887
Burundi4 26,455 80.021,164 4868
Cameroon244 3,121,502 76.92,400,435 9832
Cape Verde53 4,694,663 63.92,999,890 56,882
Central African Rep18 13,977 72.310,106 559
Chad32 98,344 70.769,529 2167
Comoros79 2,329,866 46.61,085,718 13,682
Congo30 844,274 70.3593,524 19,507
Cote d’Ivoire58 977,392 54.6533,656 9246
DRC502 3,871,323 64.12,481,518 4941
Equatorial Guinea22 1,351,863 63.2854,378 38,291
Eritrea4 62,991 81.351,212 12,075
Ethiopia797 19,419,954 81.315,788,423 19,819
Gabon29 3,831,028 54.72,095,572 71,473
Gambia The33 387,034 60.5234,155 7016
Ghana147 5,642,699 69.23,904,748 26,636
Guinea31 402,426 63.0253,528 8135
Guinea Bissau13 95,658 72.969,735 5481
Kenya1968 110,454,961 74.682,399,401 41,869
Lesotho179 2,244,799 69.91,569,114 8775
Liberia23 239,148 77.1184,383 7873
Madagascar495 9,675,527 87.28,437,060 17,040
Malawi649 6,212,044 77.34,801,910 7400
Mali97 944,317 71.3673,298 6955
Mauritania90 3,827,676 46.51,779,869 19,820
Mauritius10 3,467,754 66.22,295,653 234,657
Mozambique474 4,422,875 78.33,463,111 7307
Namibia785 70,668,214 60.642,824,938 54,529
Niger36 260,749 73.4191,390 5378
Nigeria391 3,922,315 56.72,223,953 5689
South Sudan64 320,264 73.8236,355 3717
Rwanda234 6,987,929 84.15,876,849 25,088
Sao Tome et Principe7 281,197 59.9168,437 24,687
Senegal215 7,213,397 47.13,397,510 15,802
Seychelles37 14,790,765 66.69,849,170 266,496
Sierra Leone18 55,759 58.832,786 1814
South Africa32,753 3,625,212,884 60.12,178,752,943 66,520
Swaziland (Eswatini)368 22,951,859 54.712,554,667 34,070
Tanzania11 341,496 84.5288,564 25,283
Togo24 156,146 58.591,346 3840
Uganda538 12,607,006 70.98,938,367 16,629
Zambia1162 34,430,697 75.125,857,454 22,252
Zimbabwe957 19,295,282 84.016,208,037 16,934
Djibouti29 1,348,824 63.7859,201 30,061
Egypt2978 460,883,696 47.9220,763,290 74,139
Libya588 61,213,594 52.832,320,778 54,928
Morocco1713 188,853,193 48.791,971,505 53,676
Somalia143 342,073 49.4168,984 1182
Sudan508 13,381,636 49.76,650,673 13,096
Tunisia2737 396,784,269 51.5204,343,899 74,658
TOTAL (Int$)54,210 5,401,675,398 3,173,546,125 58,542
Sources: * Worldometer (2021), ** International Monetary Fund (IMF), (2021), *** Authors’ estimates.
Table 7. Estimated direct cost of preventing and managing COVID-19 cases as of 30 June 2021.
Country(A) Total COVID-19 Cases *(B) Current Health
Expenditure per Capita
in 2021 (Int$) **
(C) Direct Cost (Int$) [C = A × B)] ***
Algeria139,229 940130,934,190
Angola38,682 1154,448,923
Benin8199 85700,219
Botswana69,680 108275,380,140
Burkina Faso13,479 73977,779
Burundi5428 89485,399
Cabo Verde32,457 48115,617,354
Cameroon80,858 15412,492,030
Central African Republic7141 5403,855,622
Chad4951 62306,781
Comoros3912 144562,929
Congo12,596 51643,920
Djibouti11,602 1361,580,972
DRC40,836 18720,805
Egypt281,031 491138,124,544
Equatorial Guinea8734 5855,105,836
Eritrea5936 139823,562
Eswatini19,084 65912,581,054
Ethiopia276,037 7019,349,040
Gabon24,984 48212,034,455
Gambia6079 76464,312
Ghana95,642 24423,291,505
Guinea23,753 1383,272,720
Guinea-Bissau3853 137529,337
Cote d’Ivoire (Ivory Coast)48,242 1818,746,361
Kenya183,603 26348,349,428
Lesotho11,344 3994,529,139
Liberia3900 59230,223
Libya193,238 81,559,041
Madagascar42,207 602,518,105
Malawi35,897 1154,133,405
Mali14,422 871,248,415
Mauritania20,747 2194,553,581
Mauritius1833 1741 3,190,929
Morocco530,585 560297,383,335
Mozambique75,828 14310,815,752
Namibia86,649 77867,442,498
Niger5488 79434,235
Nigeria167,543 27345,673,668
Rwanda38,198 27910,639,375
São Tomé and Príncipe2366 215507,569
Senegal42,957 1566,702,574
Seychelles15,579 1922 29,950,243
Sierra Leone5495 2641,447,951
Somalia14,933 30447,990
South Africa1,954,466 1256 2,454,780,059
South Sudan10,834 52561,673
Sudan36,658 2438,922,926
Tanzania509 12362,703
Togo13,881 1371,899,448
Tunisia414,182 1036429,152,254
Uganda79,434 16312,932,700
Zambia152,056 32449,332,595
Zimbabwe48,533 1969,495,444
TOTAL 5,465,790 3,981,927,049
Source: * Worldometer (2021), ** Authors’ projections using data from WHO (2019a), *** Authors’ estimates.
Table 8. Total costs associated with COVID-19 cases reported as of 30 June 2021 in Africa (in 2021 Int$ or PPP).
CountryTotal CostTotal Cost per COVID-19 Case (Int$)Total Cost per Person in Population (Int$)
Algeria181,559,885 13044.07
Angola25,913,564 6700.76
Benin945,736 1150.08
Botswana172,723,891 247972.01
Burkina Faso1,222,117 910.06
Burundi506,563 930.04
Cameroon14,892,465 1840.55
Cape Verde18,617,243 57433.13
Central African Republic3,865,727 5410.79
Chad376,311 760.02
Comoros1,648,647 4211.86
Congo, Republic of1,237,444 980.22
Cote d’Ivoire9,280,016 1920.34
Congo, Democratic Republic of3,202,323 780.03
Equatorial Guinea5,960,214 6824.12
Eritrea874,774 1470.24
Ethiopia35,137,463 1270.30
Gabon14,130,028 5666.20
Gambia, The698,467 1150.28
Ghana27,196,253 2840.86
Guinea3,526,248 1480.26
Guinea-Bissau599,072 1550.30
Kenya130,748,829 7122.38
Lesotho6,098,253 5382.82
Liberia414,606 1060.08
Madagascar10,955,165 2600.39
Malawi8,935,316 2490.46
Mali1,921,713 1330.09
Mauritania6,333,451 3051.33
Mauritius5,486,582 29934.31
Mozambique14,278,863 1880.44
Namibia110,267,435 127342.63
Niger625,625 1140.02
Nigeria47,897,621 2860.23
Rwanda16,516,224 4321.24
Sao Tome and Principe676,006 2863.03
Senegal10,100,085 2350.59
Seychelles39,799,413 2555402.21
Sierra Leone1,480,738 2690.18
South Africa4,633,533,002 237177.16
South Sudan798,028 740.07
Swaziland25,135,720 131721.45
Tanzania351,267 6900.01
Togo1,990,794 1430.24
Uganda21,871,067 2750.46
Zambia75,190,049 4943.98
Zimbabwe25,703,481 5301.70
Djibouti2,440,173 2102.43
Egypt358,887,834 12773.44
Libya33,879,818 1754.87
Morocco389,354,840 73410.43
Somalia616,974 410.04
Sudan15,573,599 4250.35
Tunisia633,496,153 153053.05
TOTAL (Int$)7,155,473,174 13095.22
Table 9. Total direct costs without and with the COVID-19 Oxford–AstraZeneca vaccine in Africa (in 2021 Int$ or PPP).
CountryControl Group
Direct Cost (Int$)
Vaccine Group
Direct Cost (Int$)
Algeria1,213,130,315 410,134,248
Angola112,596,891 38,066,678
Benin30,696,569 10,377,875
Botswana74,992,194 25,353,308
Burkina Faso45,009,650 15,216,831
Burundi31,634,010 10,694,804
Cameroon121,441,348 41,056,806
Cape Verde7,814,988 2,642,086
Central African Republic76,662,647 25,918,054
Chad30,248,209 10,226,293
Comoros3,692,648 1,248,408
Congo, Republic of8,350,869 2,823,256
Cote d’Ivoire141,597,107 47,871,051
Congo, Democratic Republic of47,058,206 15,909,405
Equatorial Guinea24,471,172 8,273,197
Eritrea14,415,171 4,873,471
Ethiopia238,595,019 80,664,037
Gabon31,707,221 10,719,555
Gambia, The5,482,538 1,853,533
Ghana223,211,109 75,463,056
Guinea53,694,939 18,153,147
Guinea-Bissau7,996,421 2,703,424
Kenya418,146,512 141,366,680
Lesotho24,913,510 8,422,742
Liberia8,829,117 2,984,942
Madagascar48,958,347 16,551,804
Malawi65,285,562 22,071,697
Mali52,102,243 17,614,690
Mauritania30,259,150 10,229,992
Mauritius64,090,232 21,667,581
Mozambique132,405,996 44,763,727
Namibia58,181,480 19,669,954
Niger57,327,529 19,381,251
Nigeria1,663,857,712 562,515,851
Rwanda106,816,010 36,112,282
Sao Tome and Principe1,383,754 467,819
Senegal77,469,502 26,190,835
Seychelles5,497,873 1,858,717
Sierra Leone61,970,418 20,950,916
South Africa483,391,950 163,424,812
South Sudan16,966,806 5,736,126
Swaziland22,331,405 7,549,786
Tanzania218,647,124 73,920,067
Togo33,498,430 11,325,126
Uganda221,928,779 75,029,526
Zambia177,141,323 59,887,815
Zimbabwe85,253,530 28,822,454
Djibouti3,947,041 1,334,413
Egypt1,480,743,156 500,608,610
Libya1,623,783 548,967
Morocco604,919,747 204,510,845
Somalia14,159,230 4,786,942
Sudan315,586,269 106,693,185
Tunisia357,587,739 120,893,013
Table 10. Savings in potential total costs of COVID-19 expected from COVID-19 vaccination in Africa (in 2021 Int$ or PPP).
CountryDirect Cost Savings (Int$)Indirect Cost Savings (Int$)Total Cost Savings (Int$)
Algeria802,996,0671,909,014,4162,712,010,483
Angola74,530,2132,547,771,0632,622,301,276
Benin20,318,69591,972,651112,291,346
Botswana49,638,885650,154,625699,793,511
Burkina Faso29,792,81997,813,488127,606,307
Burundi20,939,206101,436,938122,376,144
Cameroon80,384,542154,472,902234,857,444
Cape Verde5,172,90218,465,55323,638,455
Central African Republic50,744,5931,587,02052,331,613
Chad20,021,91621,143,50341,165,418
Comoros2,444,24020,684,31423,128,555
Congo, Republic of5,527,61363,691,41869,219,031
Cote d’Ivoire93,726,056144,332,155238,058,211
Democratic Republic of Congo31,148,801776,068,275807,217,076
Equatorial Guinea16,197,97532,037,56448,235,539
Eritrea9,541,70025,075,78634,617,486
Ethiopia157,930,9821,348,397,9481,506,328,931
Gabon20,987,66694,035,774115,023,440
Gambia3,629,00610,065,22713,694,232
Ghana147,748,054487,962,646635,710,699
Guinea35,541,79263,368,97098,910,762
Guinea-Bissau5,292,9976,376,10711,669,104
Kenya276,779,8323,916,573,4424,193,353,274
Lesotho16,490,76832,258,04548,748,812
Liberia5,844,17623,536,63229,380,808
Madagascar32,406,543823,766,172856,172,715
Malawi43,213,865247,155,826290,369,691
Mali34,487,55383,669,035118,156,588
Mauritania20,029,15754,615,00174,644,159
Mauritius42,422,651508,937,955551,360,606
Mozambique87,642,270399,598,914487,241,184
Namibia38,511,526240,125,016278,636,543
Niger37,946,27877,876,604115,822,882
Nigeria1,101,341,861694,000,9641,795,342,825
Rwanda70,703,728566,789,645637,493,373
São Tomé and Principe915,9363,182,7884,098,724
Senegal51,278,667156,811,935208,090,601
Seychelles3,639,15644,897,12548,536,282
Sierra Leone41,019,5028,528,26849,547,771
South Africa319,967,1386,800,921,7347,120,888,872
South Sudan11,230,68071,660,14982,890,829
Swaziland14,781,61967,988,86282,770,481
Tanzania144,727,0572,643,552,2202,788,279,277
Togo22,173,30418,789,27140,962,575
Uganda146,899,2531,335,323,8161,482,223,069
Zambia117,253,509715,750,036833,003,545
Zimbabwe56,431,076434,709,514491,140,591
Djibouti2,612,62817,403,51720,016,146
Egypt980,134,5464,464,420,1755,444,554,721
Libya1,074,816220,959,103222,033,918
Morocco400,408,9021,157,907,9451,558,316,848
Somalia9,372,28711,154,67220,526,959
Sudan208,893,084339,371,278548,264,362
Tunisia236,694,727514,987,003751,681,730
TOTAL6,261,584,81635,363,151,00941,624,735,824
Disclaimer/Publisher’s Note: The statements, opinions and data contained in all publications are solely those of the individual author(s) and contributor(s) and not of MDPI and/or the editor(s). MDPI and/or the editor(s) disclaim responsibility for any injury to people or property resulting from any ideas, methods, instructions or products referred to in the content.