The study employs a comparative analysis based on a quantitative and exploratory approach to evaluate, over the 2018–2024 period, the macroeconomic evolution of countries that adopted the Euro, compared to EU member states from Central and Eastern Europe that have not adopted the Euro. The primary methodological approach is quantitative, involving the collection and comparative assessment of macroeconomic indicators such as long-term interest rates, inflation (HICP), GDP per capita (as a percentage of the EU average), public debt, and foreign direct investment (FDI). Data were sourced from institutional databases, including Eurostat, the European Central Bank (ECB), and the International Monetary Fund (IMF).
The selection of countries is based on comparability in terms of economic size, institutional maturity, and EU membership duration. Slovenia, Slovakia, and Lithuania represent Eurozone members with post-2004 accession, while Romania, Hungary, and Poland are comparable non-Euro CEE peers.
To facilitate group-level comparison, countries were classified as either Euro area members or non-Euro states, and average values for each group were calculated and visualized over time using Python-based data frames and comparative line charts. This approach enabled the identification of consistent trends and structural divergences.
In addition, Pearson correlation coefficients were used to quantify the relationships between key variables (e.g., public debt and interest rates, inflation and FDI), highlighting the extent to which macroeconomic volatility influences investor behaviour and debt sustainability. This econometric component added depth to the analysis and an additional layer of statistical rigor.
This paper aims to present the differences in macroeconomic performance between Central and Eastern European (CEE) countries that adopted the Euro and those that did not, during the 2018–2024 period. In the context of multiple economic challenges—health crises, accelerated inflation, and financial instability—the key research question arises: “To what extent did Euro area membership protect CEE countries from macroeconomic volatility compared to their non-Euro counterparts?”
Based on this research question, a series of questions is formulated, derived from the existing literature and grounded in a comparative evaluation of relevant macroeconomic indicators (long-term interest rates, HICP inflation, GDP per capita as a percentage of the EU average, public debt, and foreign direct investment—FDI):
Is Euro area membership associated with lower levels and reduced volatility of long-term interest rates compared to non-Euro countries?
Do Euro area countries experience more stable HICP inflation rates, closer to the ECB’s target, reflecting better-anchored inflation expectations?
During the 2018–2024 period, did the Euro provide a competitive advantage through a positive impact on GDP per capita dynamics, FDI inflows, and public debt control, compared to non-Euro countries?
The quantitative results were complemented by a contextual qualitative assessment of relevant policy interventions—such as the ECB’s Pandemic Emergency Purchase Programme (PEPP) and the Transmission Protection Instrument (TPI)—as well as macroeconomic shocks such as the COVID-19 pandemic and the inflation surge during 2022–2023.
The comparative analysis relies on a set of core macroeconomic variables, monitored annually for each country included in the study. Specifically, we selected the following: Gross Domestic Product (GDP) per capita (at purchasing power parity) as an indicator of the level of economic development; annual inflation rate to assess price stability; long-term interest rate (government bond yields) as a proxy for financing costs and perceived risk; and public debt (as a percentage of GDP) to capture fiscal sustainability.
These variables are analyzed comparatively between the Euro area and non-Euro countries in order to identify systematic differences and to assess the potential role of the common currency in stabilizing macroeconomic performance.
3.1. The State of Nominal and Real Convergence in Non-Euro Area Countries
According to the Maastricht convergence criteria, the long-term interest rate should not exceed the average of the three best-performing Member States in terms of price stability by more than 2 percentage points (
European Commission, 2022, Convergence Report, p. 45). In the reference period June 2023–May 2024, these countries were Denmark: 2.6%, Netherlands: 2.8%, and Belgium: 3.1% (the reference value is 4.8%). The convergence criteria, represent essential conditions that European Union member states must meet in order to adopt the Euro. These include the following: maintaining the inflation rate at a low and stable level, without significantly exceeding the reference value established based on the best-performing economies in the EU; ensuring that public debt does not exceed 60% of GDP and that the budget deficit remains below 3% of GDP; the national currency must participate in the ERM II (Exchange Rate Mechanism) for at least two years, without significant deviations and without devaluation against the Euro; the long-term interest rate must reflect economic stability and confidence in the country’s monetary policy, not exceeding a certain reference threshold calculated at the EU level. These criteria are designed to ensure a solid and sustainable monetary integration, avoiding macroeconomic imbalances within the Euro area.
Maniatis (
2013) also presents the idea that, in many cases—especially in Central and Eastern Europe—countries have met the nominal criteria, but have failed to close the real economic gaps with the older member states. This supports the view that nominal convergence does not guarantee real convergence.
3.1.1. Long-Term Interest Rates
The inflation peak of 2023 marked a turning point in European monetary policy. Non-Euro countries continued to raise interest rates aggressively to combat inflation expectations, while the ECB began transitioning from tightening to stabilization (
Lane, 2023, ECB). In 2024, inflation declined across all analyzed states, signaling the beginning of a normalization phase. Long-term interest rates started to fall—Romania (5.7%), Hungary (6.1%), and Poland (4.9%)—indicating increased investor confidence and a stabilization of macroeconomic outlooks (
Table 1).
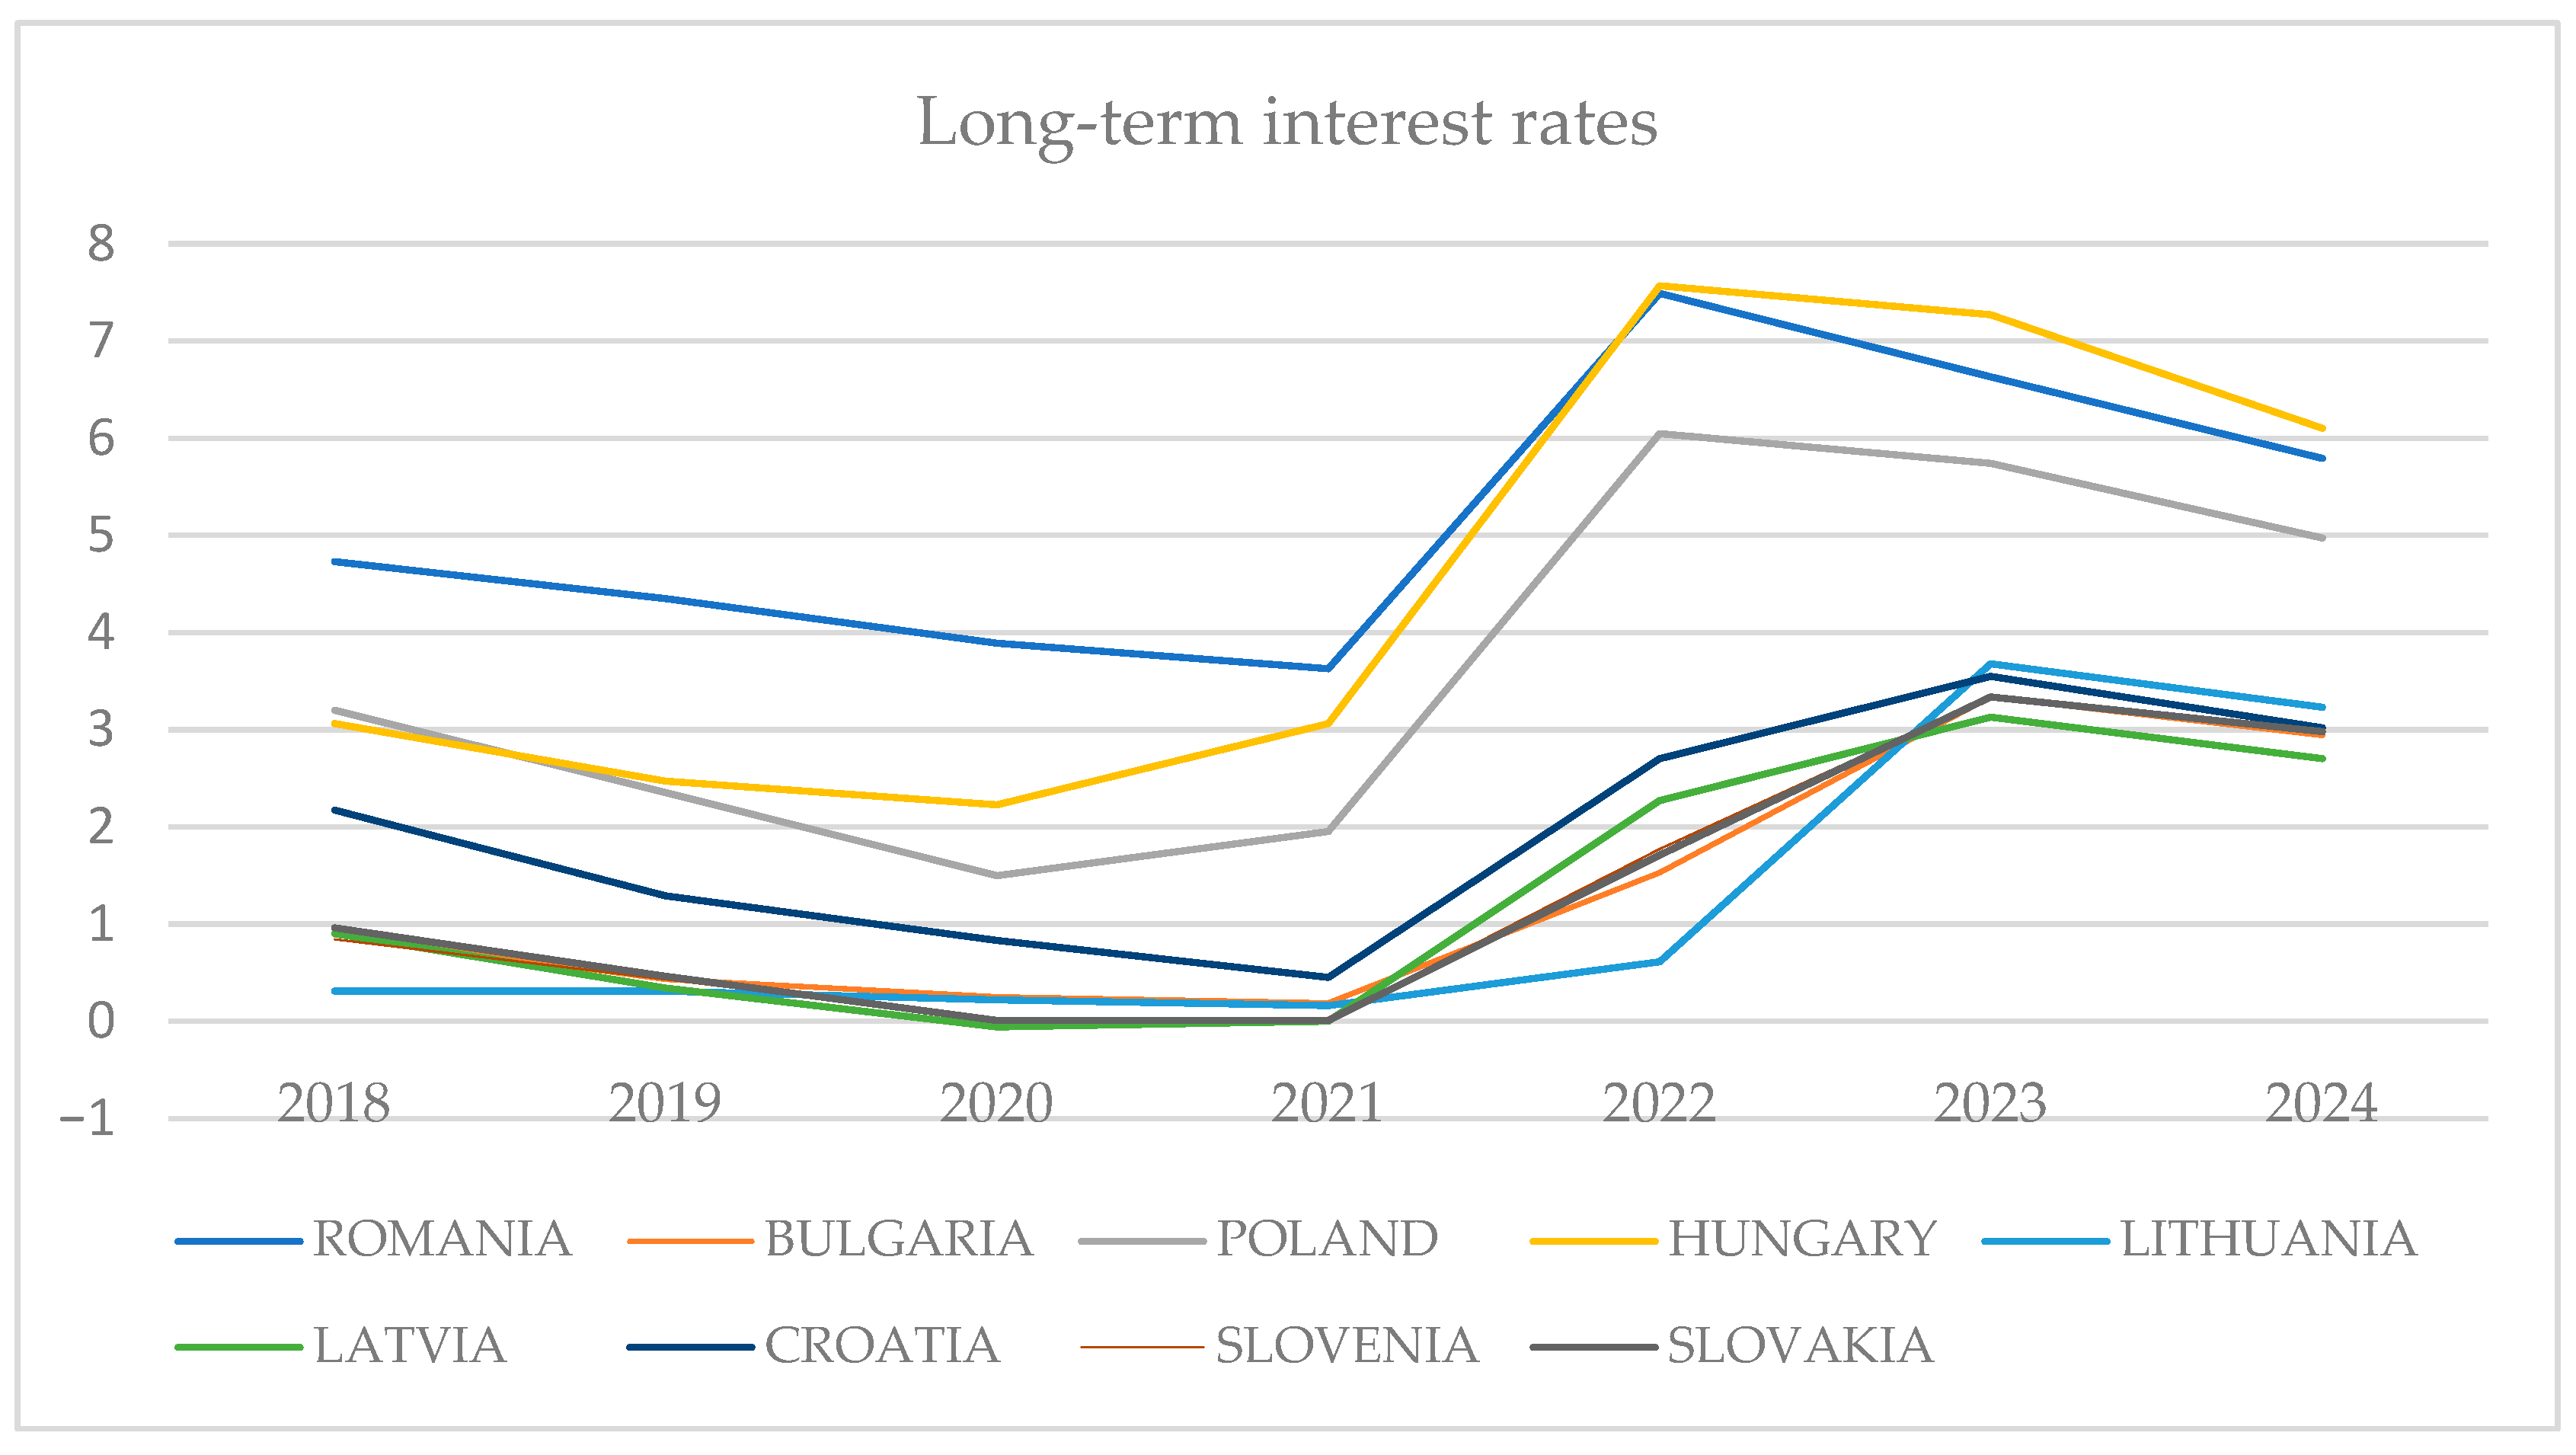
A significant structural disparity between Euro area and non-Euro area countries was already evident in 2018. Among the countries, Romania had one of the highest long-term interest rates of about 4.7%. Bulgaria had a rate of about 0.89%; Hungary and Poland had interest rates of roughly 3.1%. This disparity reflects greater perceived risks for the developing nations, but it also results from higher inflation in these nations, which drives nominal interest rates up. By comparison, Euro-area nations profiting from a consistent single monetary framework had far lower interest rates: below 1% in Lithuania, Latvia, Slovakia, Slovenia, and Croatia (
Figure 1). This is a result of the European Central Bank (ECB) ultra-loose monetary policy, which has maintained interest rates near zero and carried out quantitative easing initiatives.
For the year 2019, there was a widespread decline in most nations, and long-term interest rates kept declining in keeping with the slowdown in world economic development and the continuation of lax monetary policy. While Poland and Hungary hit roughly 2.4%, Romania’s interest rates dropped somewhat to about 4.4%. Bulgaria slumped to roughly 1.3%. With long-term interest rates ranging from 0.3% to 0.9%, Euro-area nations kept profiting from good financing conditions, which helped to lower public debt levels. Still, this modest convergence across groups was insufficient to eradicate structural variations in risk assessments.
The COVID-19 pandemic precipitated a sharp economic contraction across Europe. The Eurozone’s GDP contracted by 6.3%, while non-Euro countries faced similar downturns. The ECB implemented expansive monetary policies, including the Pandemic Emergency Purchase Program (PEPP), to stabilize financial markets (
ECB, 2020a).
Most countries experienced a broad-based decline in long-term interest rates, reflecting the global economic slowdown and the persistence of accommodative monetary policies (
Barigozzi et al., 2024). This trend was particularly evident in Central and Eastern European economies, where interest rates continued to fall amid diminishing external demand, weaker industrial output, and subdued inflationary pressures.
Long-term interest rates dropped in most countries. While Poland hit 1.5% and Hungary almost 2.3%, the interest rate in Romania dropped to almost 3.9%. Bulgaria fell somewhat noticeably, to about 0.7%. In rare circumstances, Eurozone nations have either modest or even negative interest rates. Lithuania, for instance, had a somewhat negative rate, but Latvia and Slovakia had rates almost equal to zero. These levels capture not just ECB actions but also the sense of security connected with the Euro during crises.
The global economy entered a gradual recovery phase in 2021, yet the legacy of the COVID-19 pandemic continued to weigh on public finances, labour markets, and inflation dynamics. As vaccine rollouts expanded and lockdowns eased, most countries saw a partial rebound in domestic demand, industrial output, and services. The recovery was uneven, and inflationary pressures began to re-emerge—initially driven by supply chain disruptions, surging energy prices, and base effects.
In this evolving context, long-term interest rates in non-Euro countries began to adjust. While still historically low, rates started to reflect early signs of monetary tightening in anticipation of persistent inflation. In Romania, long-term rates edged down slightly to around 3.7%, sustained by a cautious monetary stance from the National Bank of Romania. Hungary’s rate rose modestly to approximately 3%, in line with its central bank’s proactive response to early inflation signals. Poland maintained a relatively low level at around 2%, reflecting a delayed monetary tightening cycle despite rising price indices. Bulgaria remained stable at approximately 0.5%, consistent with the discipline imposed by its Euro peg.
The year 2022 marked a turning point in global economic trends, as inflation surged to levels not seen in decades, prompting an abrupt reversal in the monetary stance of central banks around the world. The combination of post-pandemic demand recovery, persistent supply bottlenecks, and geopolitical tensions—especially Russia’s invasion of Ukraine—created a perfect storm for price instability. The global energy crisis, amplified by sanctions and disrupted trade routes, pushed consumer price indices upward across both developed and emerging economies.
In Central and Eastern Europe, inflationary pressures became particularly acute. Non-Euro countries such as Romania, Hungary, and Poland were among the most affected, with inflation reaching double-digit levels by mid-year. Romania recorded a long-term interest rate of approximately 7.4%, while Hungary’s rate climbed to a staggering 7.5%, the highest in the region. Poland followed closely with a rate of 6%. That reflected both rising inflation expectations and the proactive stance of monetary authorities attempting to regain control over price stability.
In response, national central banks initiated aggressive tightening cycles. The National Bank of Romania, for example, raised its policy rate multiple times during the year, aiming to curb inflation expectations and stabilize the currency. The structural vulnerabilities of non-Euro economies—such as reliance on energy imports, relatively high fiscal deficits, and weaker institutional frameworks—limited the immediate effectiveness of such interventions (
Svensson, 1997). Moreover, the local currencies faced depreciation, adding fuel to inflation via imported goods and energy costs.
Bulgaria, although still outside the Euro area, benefited from its currency board arrangement, which maintains a fixed exchange rate with the Euro. As a result, long-term interest rates rose only modestly to around 1.6%, reflecting the perceived lower monetary risk premium.
Euro area countries experienced a more moderate rise in long-term interest rates, largely due to the ECB’s credibility and policy lag. Countries such as Lithuania and Latvia saw their rates increase to around 0.6%, while Croatia, which was preparing to adopt the Euro in 2023, experienced a sharper rise to 2.7%. Slovakia and Slovenia also saw their yields climb to between 2% and 2.3%. Although the consequences of the ECB have begun to show themselves, the single framework has nonetheless given more overall stability.
The year 2023 marked the apex of the inflationary cycle for many European economies, accompanied by the highest long-term interest rates of the post-pandemic period. Central banks across Europe had, by now, fully embraced monetary tightening, with cumulative rate hikes and restrictive policy stances intended to curb inflation expectations, restore price stability, and stabilize volatile financial markets.
Romania’s long-term interest rate moderated slightly to approximately 6.6%, a decrease from 7.4% the previous year, suggesting that inflation may have reached its peak. Nonetheless, this level remained historically high and signalled persistent price pressures and cautious investor sentiment. Hungary, which faced one of the most severe inflationary episodes in the EU, continued to struggle with high borrowing costs, as interest rates stayed elevated at around 7.3%. Poland held relatively stable at 5.9%, balancing between growth concerns and the need to defend monetary credibility.
Bulgaria, operating under its Euro-pegged currency board regime, saw its long-term rates rise further to approximately 3.4%. This increase, although lower than in floating-rate economies, indicated market concerns related to inflation spillovers, energy dependency, and geopolitical vulnerabilities.
The European Central Bank (ECB) continued its rate hikes into the early part of the year, but its messaging began to shift toward “data-dependence” and stabilization, anticipating a possible end to the tightening cycle. Long-term rates in Croatia, Slovenia, and Slovakia rose to around 3.2–3.4%, while Lithuania and Latvia reached slightly higher levels, approximately 3.6–3.7%.
Importantly, while interest rates increased across the board, market fragmentation was less severe within the Euro area, due to strong ECB signalling and the use of its Transmission Protection Instrument (TPI) to guard against unwarranted spikes in sovereign bond spreads. Countries such as Italy and Spain also benefited from these tools, demonstrating the ECB’s capacity to act as a backstop in times of volatility—something non-Euro countries lacked.
Inflation began to decelerate, particularly in the second half of 2023, as consumer demand softened and global supply chains gradually normalized. Romania, Hungary, and Poland recorded declining month-on-month inflation, even though year-end figures remained above targets.
Economic activity slowed significantly, especially in interest rate–sensitive sectors such as construction, real estate, and durable goods. Small and medium-sized enterprises (SMEs) reported tighter credit conditions, with higher financing costs reducing their investment appetite.
In macroeconomic terms, 2023 signalled the beginning of a disinflationary phase, yet one accompanied by new challenges: ensuring a soft landing, maintaining fiscal discipline amid rising debt service costs, and addressing long-term structural issues such as labour shortages, productivity stagnation, and demographic decline.
For non-Euro countries, this environment reinforced the limitations of monetary autonomy in small, open economies vulnerable to external shocks. The volatility of local currencies and exposure to investor sentiment made them more reactive to global interest rate cycles and capital flow reversals. Meanwhile, Euro-adopting nations remained more anchored, thanks to deeper financial integration and the ECB’s stabilizing role.
In 2024, inflation stabilized near the ECB’s target, allowing for cautious monetary easing. The Eurozone’s GDP growth moderated to 1.8%, reflecting a balanced economic environment.
Prospective Euro adopters, such as Bulgaria and Croatia, made significant strides toward convergence, aligning their monetary policies with ECB frameworks. Beginning the phase of the downward correction, A little drop in interest rates in 2024 indicates a likely stabilization of inflation and a reduction in market expectations, therefore guiding behaviour. Romania comes down to 5.1%, Hungary to 6.1%, and Poland to 5%. Bulgaria dipped to 2.8%. The declining trend is clear in the Eurozone: Slovakia at 2.9%, Croatia and Slovenia around 3%, and Lithuania and Latvia had rates between 3.2 and 3.3%. This correction shows a slow return to a post-crisis financial normalcy, even if values still exceed projections for 2018–2021.
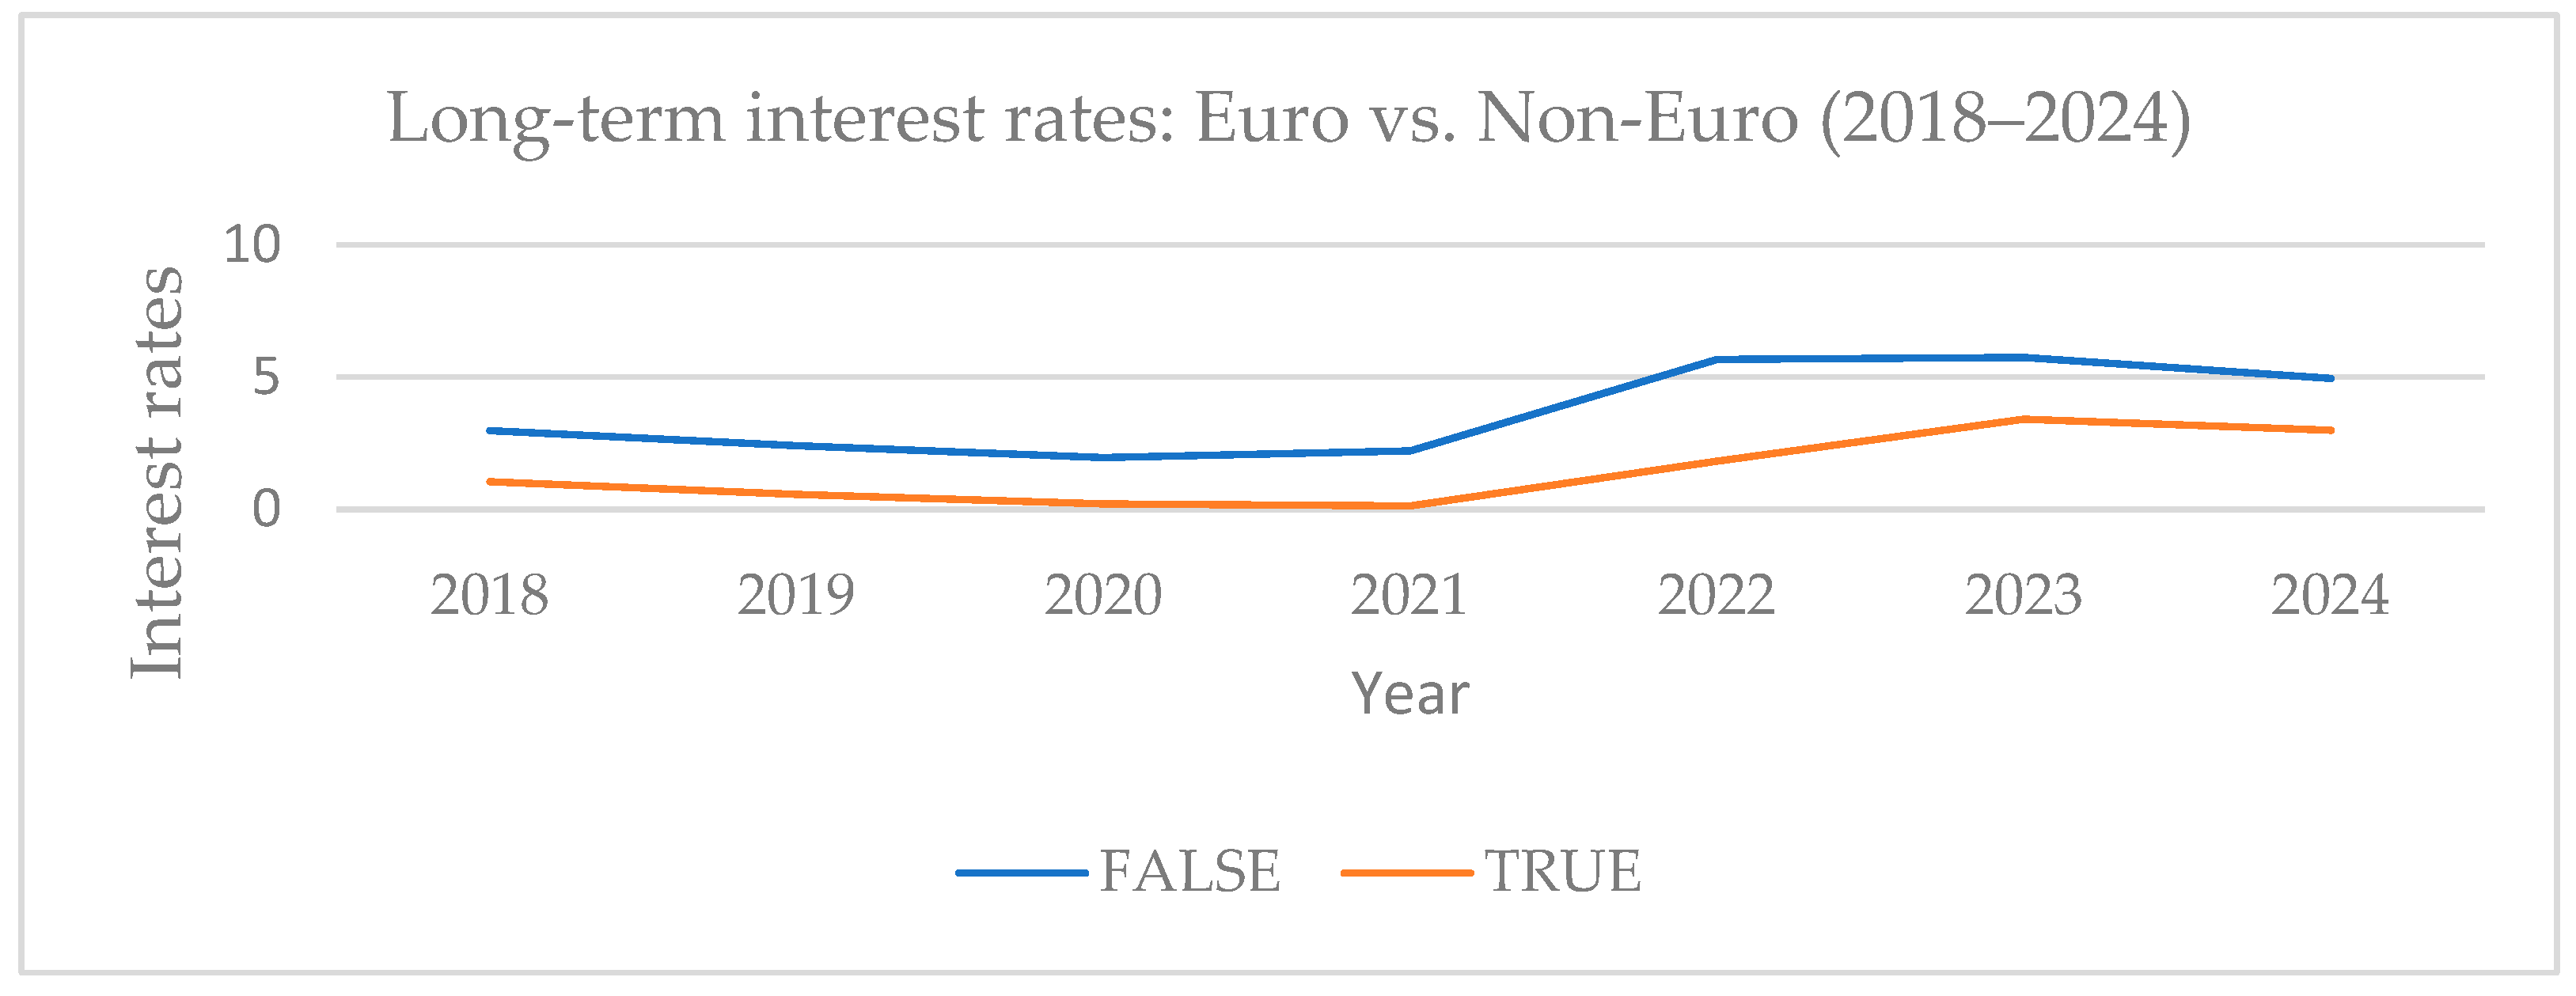
To further underline one of the advantages of joining the Euro area, we convert the long-term interest rates into data frame table as defined by the Pearson correlation coefficient, enter two columns for Euro and for non-Euro countries, and then add the data so that we obtain the average interest rates for both groups of countries. The following comparative graph is then obtained (
Table 2).
Lower interest rates in the Eurozone show market confidence in the ECB’s collective stability and monetary policies. Candidate countries may profit from decreased borrowing costs following membership, assuming budgetary discipline is maintained. Rate volatility in non-Euro nations shows weaknesses associated with national currency trust and political risk (
Figure 2).
3.1.2. Gross Domestic Product
Compared to the European Union average (EU = 100, reference value),
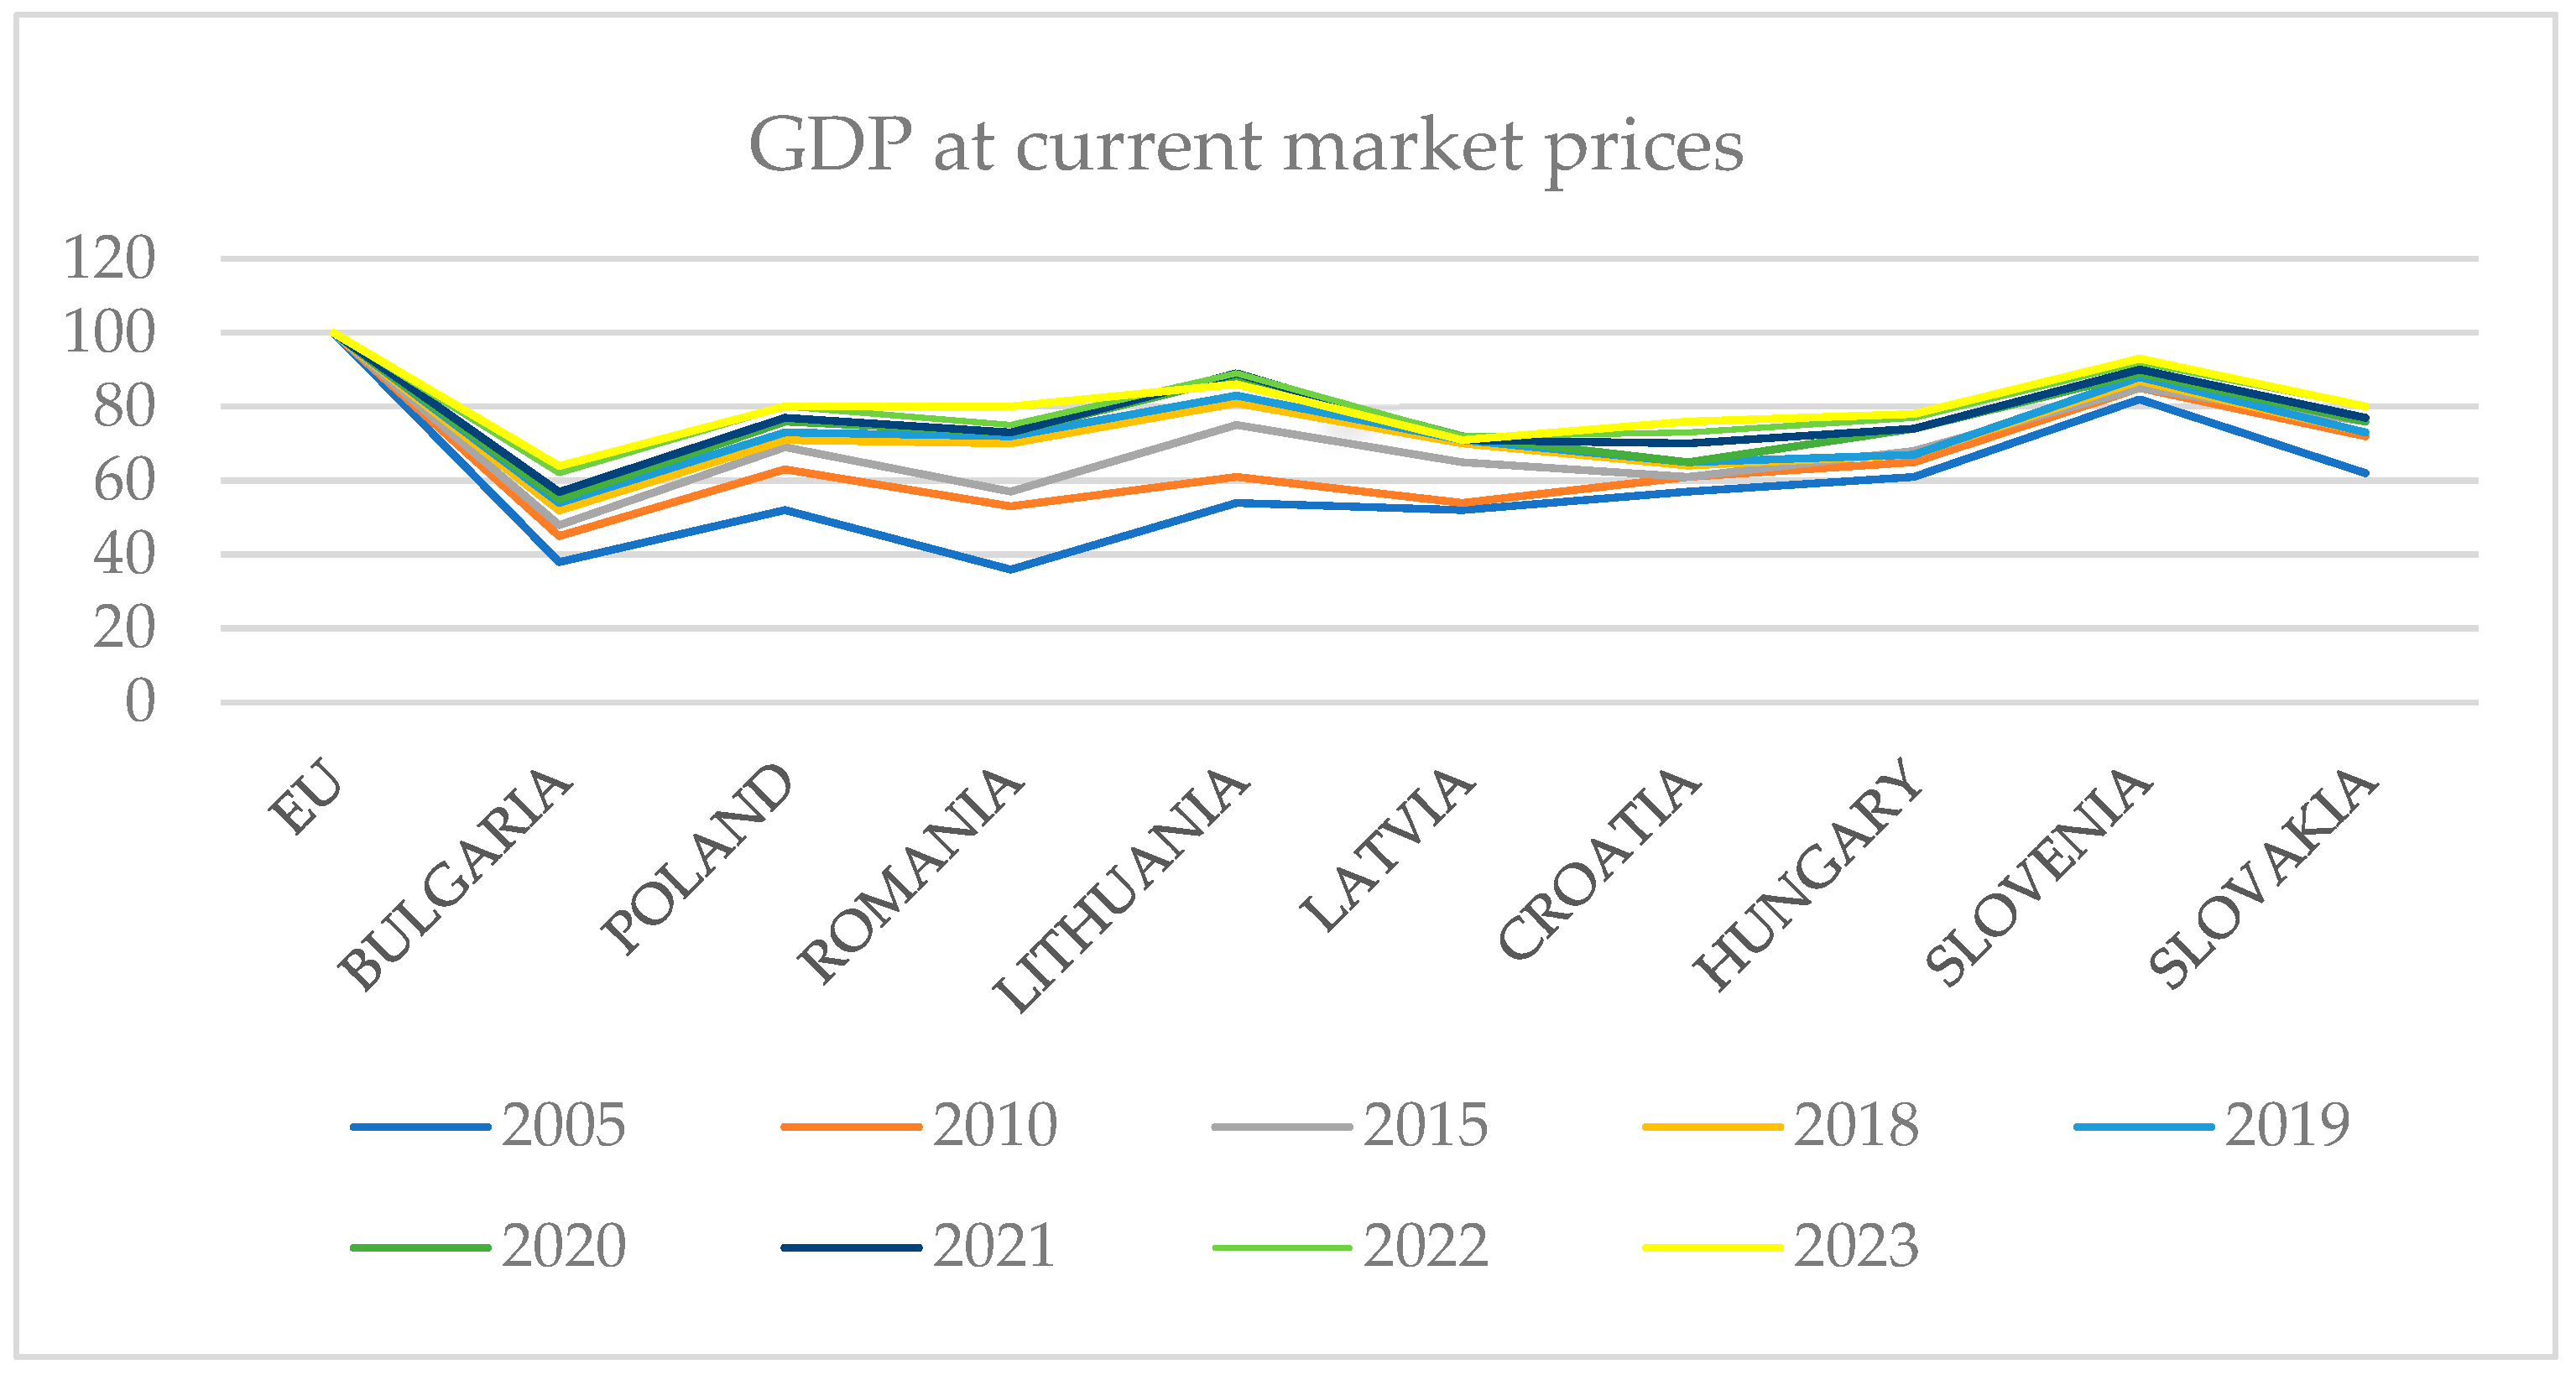
Figure 3 shows how Gross Domestic Product (GDP) at current prices has changed for numerous European economies—both inside and outside the Euro region. This is a popular approach to evaluate the degree of actual economic convergence, that is, the degree to which rising economies are catching up with developed EU economies. The index GDP expresses the level of economic convergence of each country to the EU average (which is standardized to 100).
The countries under analysis in 2005 deviated greatly from the EU average (EU = 100). Reflecting low per capita income and economic activity, Romania and Bulgaria were at the lowest levels, with GDP at current values roughly 36–38% of the EU average. Hungary, Poland, and Slovakia fell in an intermediary development level between 50 and 60 percent of the EU average. Though still below 65% of the EU average, nations like Lithuania, Latvia, and Croatia have much better scores. Between 2005 and 2023, countries in Central and Eastern Europe experienced a significant process of economic convergence relative to the European Union (EU) average, measured by GDP per capita at current prices (EU = 100). This indicator captures the extent to which emerging economies have managed to “catch up” with more developed member states in terms of economic output and living standards.
At the beginning of the reference period, several countries stood at considerable distances from the EU average. Romania and Bulgaria recorded the lowest GDP per capita levels, standing at just 36% and 38% of the EU average, respectively. Poland, Hungary, and Slovakia found themselves in the intermediate range, with values between 52% and 62%. Meanwhile, countries like Slovenia (82%) and Lithuania (54%) were better positioned for convergence, already benefiting from more advanced structural reforms and institutional readiness. Slovenia’s high value was especially notable, foreshadowing its swift alignment with Euro area standards (
Figure 3).
By 2010, the effects of EU accession became more evident. Romania made an impressive leap, rising from 36% to 53% in just five years. Bulgaria also improved, reaching 45%. Poland and Slovakia advanced to 63% and 72%, respectively, while Lithuania reached 61%. This period underscored the importance of EU integration mechanisms, such as access to structural funds, increased foreign direct investment, and institutional harmonization. Slovenia consolidated its strong position at 85%, maintaining its status as a front-runner among new EU members.
The momentum of convergence persisted in 2015. Romania climbed to 57%, while Bulgaria reached 48%, slowly narrowing the gap. Notably, Poland (69%), Lithuania (75%), and Slovakia (76%) neared the 70–75% mark, indicating that many Eastern European economies were on a steady upward trajectory. Latvia and Croatia also crossed the 65% threshold, reflecting improving macroeconomic fundamentals. This convergence phase was strongly driven by private consumption, export growth, and substantial EU fund absorption.
The years preceding the pandemic brought about accelerated growth for many of these economies. Romania rose to 70% in 2018 and 72% in 2019. Bulgaria followed with 52% and 54%, respectively. Lithuania surged to 81% in 2018 and 83% in 2019, confirming its rapid post-accession development. Slovakia remained stable at around 73%, while Slovenia advanced to 88% by 2019. These gains reflected higher employment rates, increased productivity, and robust infrastructure investments, especially in digital and transport sectors.
The COVID-19 pandemic in 2020 disrupted economies across the continent, yet in relative terms, convergence indicators remained largely intact. Romania held steady at 73%, while Bulgaria increased slightly to 55%. Poland advanced to 76%, and Lithuania reached an impressive 88%. Latvia and Slovakia also maintained their positions, demonstrating resilience rooted in stable macroeconomic frameworks and quick policy responses. Although real GDP experienced sharp contractions, nominal indicators remained stable as a result of inflation adjustments and support from the EU during the crisis.
By 2022, Romania had reached 75% of the EU average, and by 2023, it had broken the symbolic 80% threshold—its best performance in the observed period. This placed it on equal footing with Poland and Slovakia, which also stood at 80%. Bulgaria continued to grow modestly, reaching 64%. Meanwhile, Lithuania and Slovenia achieved some of the highest convergence levels at 86% and 93%, respectively. Hungary rose to 78%, while Croatia reached 76%, supported by tourism recovery and EU investment programs.
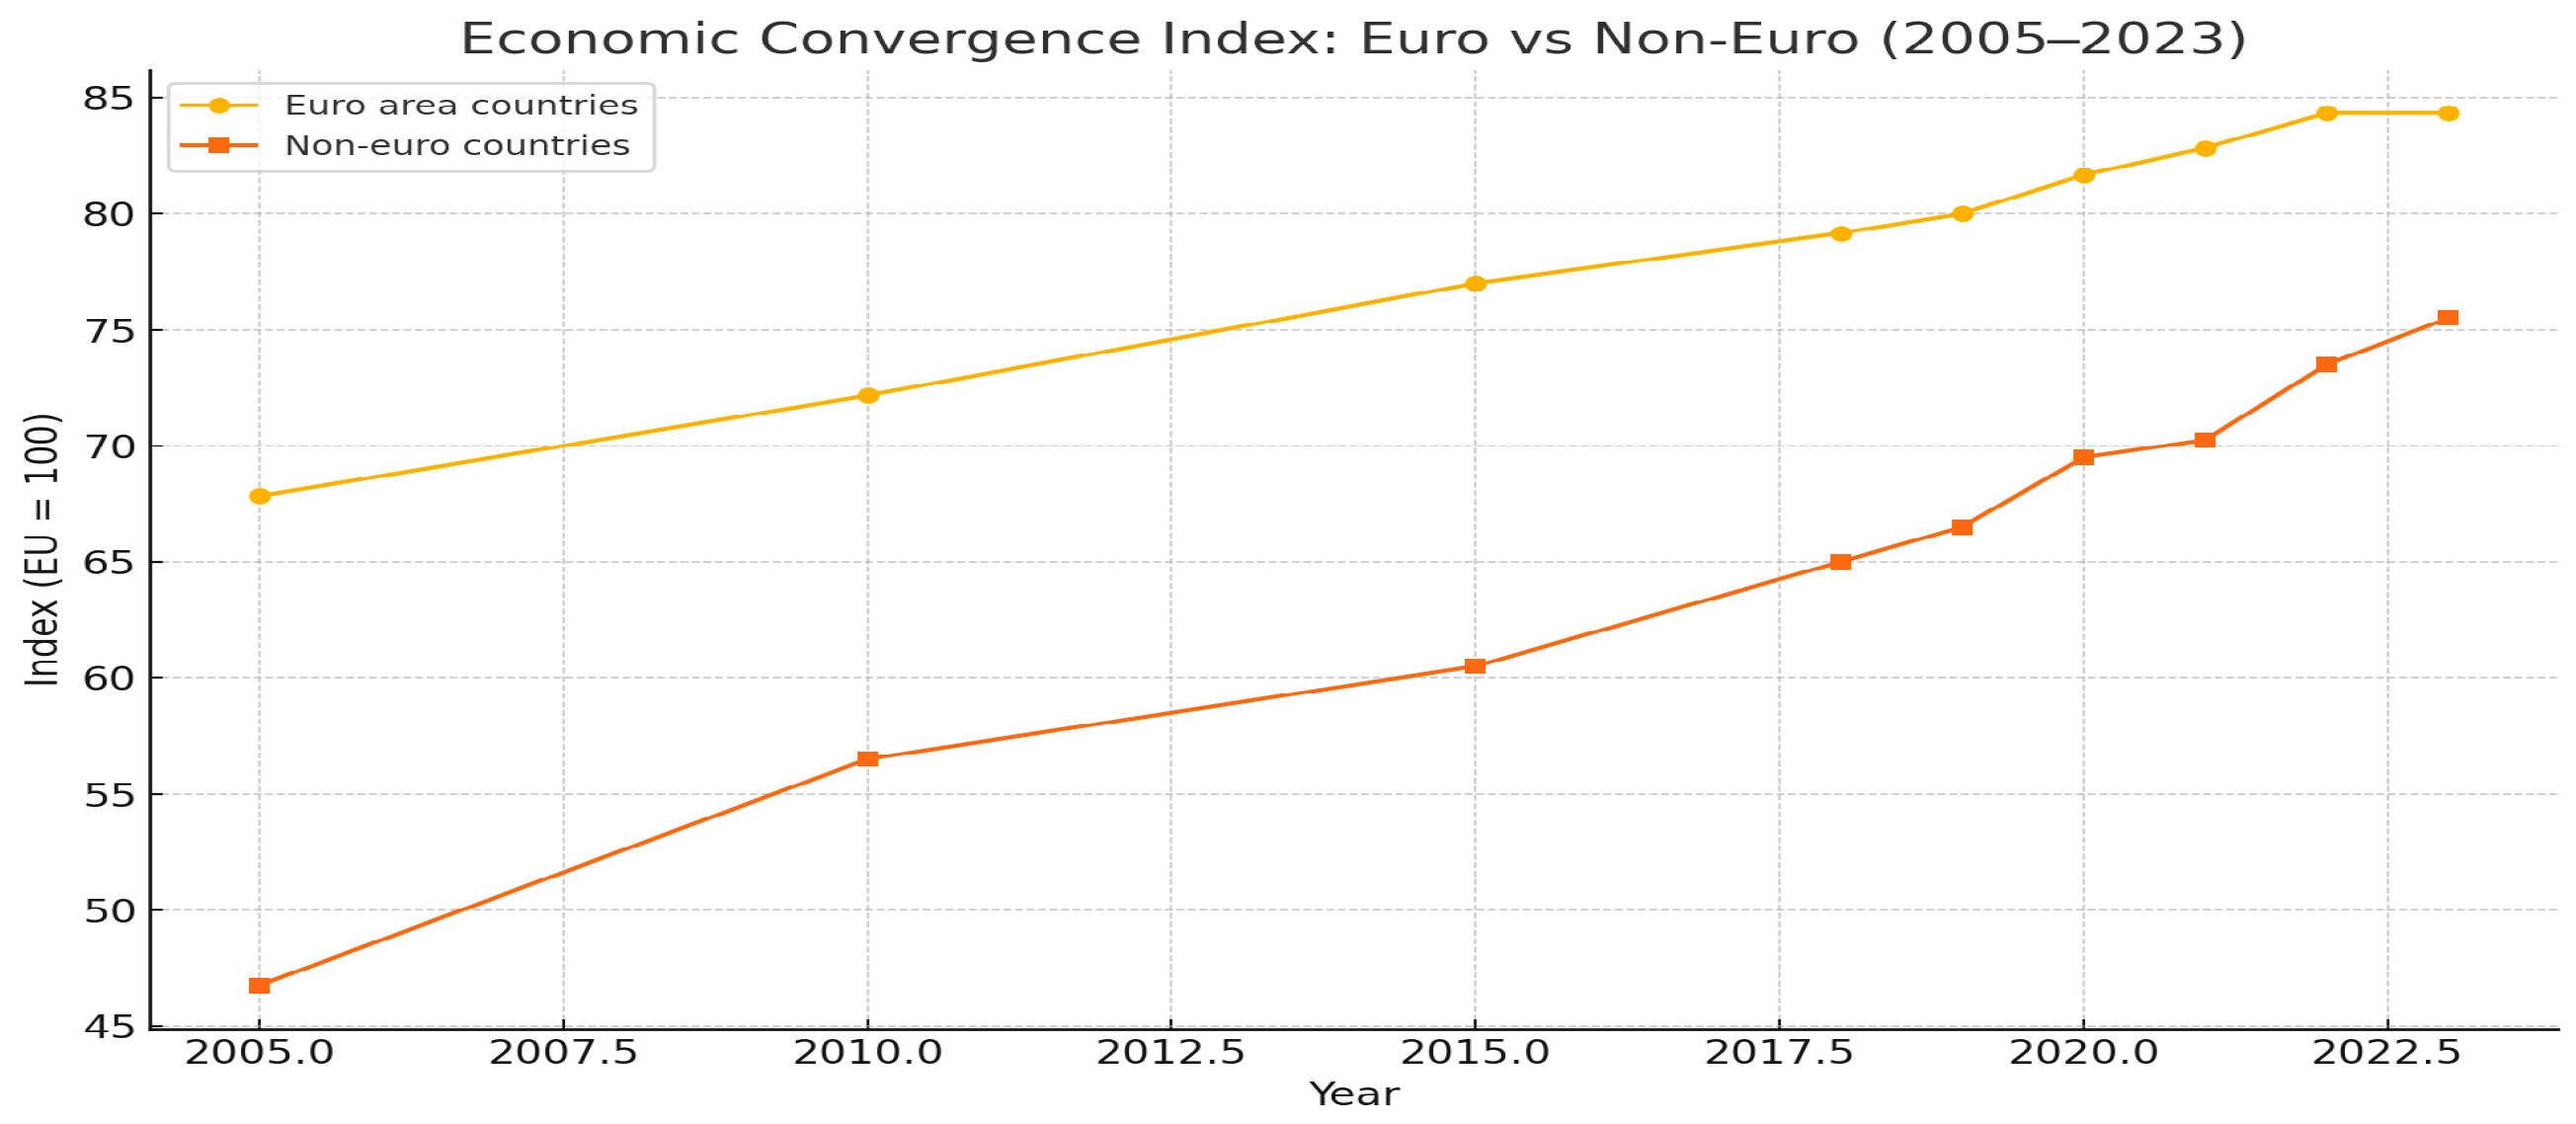
We proceeded in the same way by converting the data into a data frame table, and the following comparative graph was obtained (
Table 3).
The remarkable performance of certain non-Euro nations, such as Poland and Romania, economic instability, and higher perceived risk position them marginally beneath Eurozone countries. The lack of the Euro may adversely affect investor confidence and financing conditions. Membership in the Euro area appears to promote enhanced economic convergence via increased integration and macroeconomic discipline.
Non-Euro nations can attain comparable levels, albeit with increased work and heightened susceptibility to external shocks.
Differences fade over time, but the Euro area remains a strategic advantage for moving closer to the European average (
Figure 4).
3.1.3. Public Debt
Public debt remains one of the most closely monitored indicators of fiscal sustainability in the European Union. Typically expressed as a percentage of GDP, general government gross debt reflects a country’s total financial obligations, including those of central and local governments and social security systems. According to the Maastricht convergence criteria, sustainable public debt should not exceed 60% of GDP.
Extensive research (e.g.,
Buiter et al., 2010) argues that public debt must be assessed not only in terms of levels but also in terms of trajectory and resilience. Bulgaria’s consistent low debt reflects strong fiscal institutions, while rising debt in Romania and Hungary, as shown in your analysis, correlates with elevated borrowing costs and reduced investor confidence.
In 2018, the EU’s average public debt stood at 79.8% of GDP, reflecting a relatively stable post-crisis environment. Among Central and Eastern European economies, Bulgaria maintained the lowest debt ratio at just 22.3%, showcasing its longstanding conservative fiscal stance. Romania reported a modest 35.3%, while Poland and Slovakia recorded 48.9% and 48.1%, respectively—both under the Maastricht threshold. Hungary, Slovenia, and Croatia had higher debt levels of 70.2%, 70.1%, and 73.3%, positioning them closer to the EU average (
Figure 5).
The year 2019 did not witness dramatic changes. The EU-wide debt ratio dipped slightly to 77.6%. Bulgaria further reduced its debt to 20%, remaining well below the EU benchmark. Romania’s level remained steady at 35.2%, while Poland declined marginally to 45.7%. The stability in these figures reflected ongoing growth and relatively balanced fiscal policies across much of the region.
A turning point came in 2020 as the COVID-19 crisis hit. To cushion the economic blow, governments expanded fiscal spending significantly. Consequently, the EU’s average public debt surged to 89.5%. Croatia and Slovenia saw their debt rise to 86.5% and 79.8%, respectively. In Hungary, the debt climbed to 80.1%, while Slovakia approached the Maastricht limit at 59.7%. Though affected, Romania’s increase was modest, reaching 46.6%, and Poland’s debt rose to 56.6%. Even in this turbulent year, Bulgaria maintained fiscal discipline with a debt level of 24.4%, outperforming all other states in the region.
As the pandemic’s immediate impact waned, 2021 marked a tentative return to fiscal normalcy. The EU’s debt average declined slightly to 86.7%. Romania saw its debt increase to 48.3%, driven by persistent deficits and pandemic recovery measures. Hungary and Slovenia remained elevated at 76.8% and 74.7%, respectively. Meanwhile, Poland showed signs of consolidation, reducing its debt to 53%. Bulgaria continued to outperform, with a level of 23.8%, underlining its reputation as one of Europe’s most fiscally prudent nations.
In 2022, a broader fiscal consolidation effort began. The EU-wide debt ratio fell to 82.5%. Croatia and Slovenia reduced their debt to 68.5% and 69.9%, respectively. Slovakia dropped to 57.8%, and Hungary decreased slightly to 73.5%. Romania experienced a minor increase to 47.9%, signalling a lack of substantial adjustment. Poland reported a similar figure at 48.8%, while Bulgaria held firm at 22.5%. Lithuania and Latvia stayed below the 45% threshold, with 38.1% and 44.4%, respectively.
By 2023, debt levels appeared to stabilize across the region, albeit at higher-than-pre-crisis levels. The EU average settled at 80.8%. Romania’s public debt inched up to 48.9%, still below the EU average but showing a need for renewed fiscal discipline. Hungary and Slovenia remained elevated at 72.9% and 67.8%, while Croatia lowered its debt further to 61.8%. Poland held at 49.7%, just under the Maastricht limit. Bulgaria, consistently the lowest-debt country in the EU, maintained a ratio of 22.9%, proving the long-term benefits of its conservative fiscal strategy (
Table 4).
The price stability criterion requires that inflation should not exceed the average of the three best-performing Member States by more than 1.5 percentage points.” (
European Commission, 2022, ECB Convergence Reports). In the reference period June 2023–May 2024, the reference value is 4.3%. The same methodology was applied by organizing the data into a Python version 3.11.4. data frame, which facilitated the visualization of comparative trends (
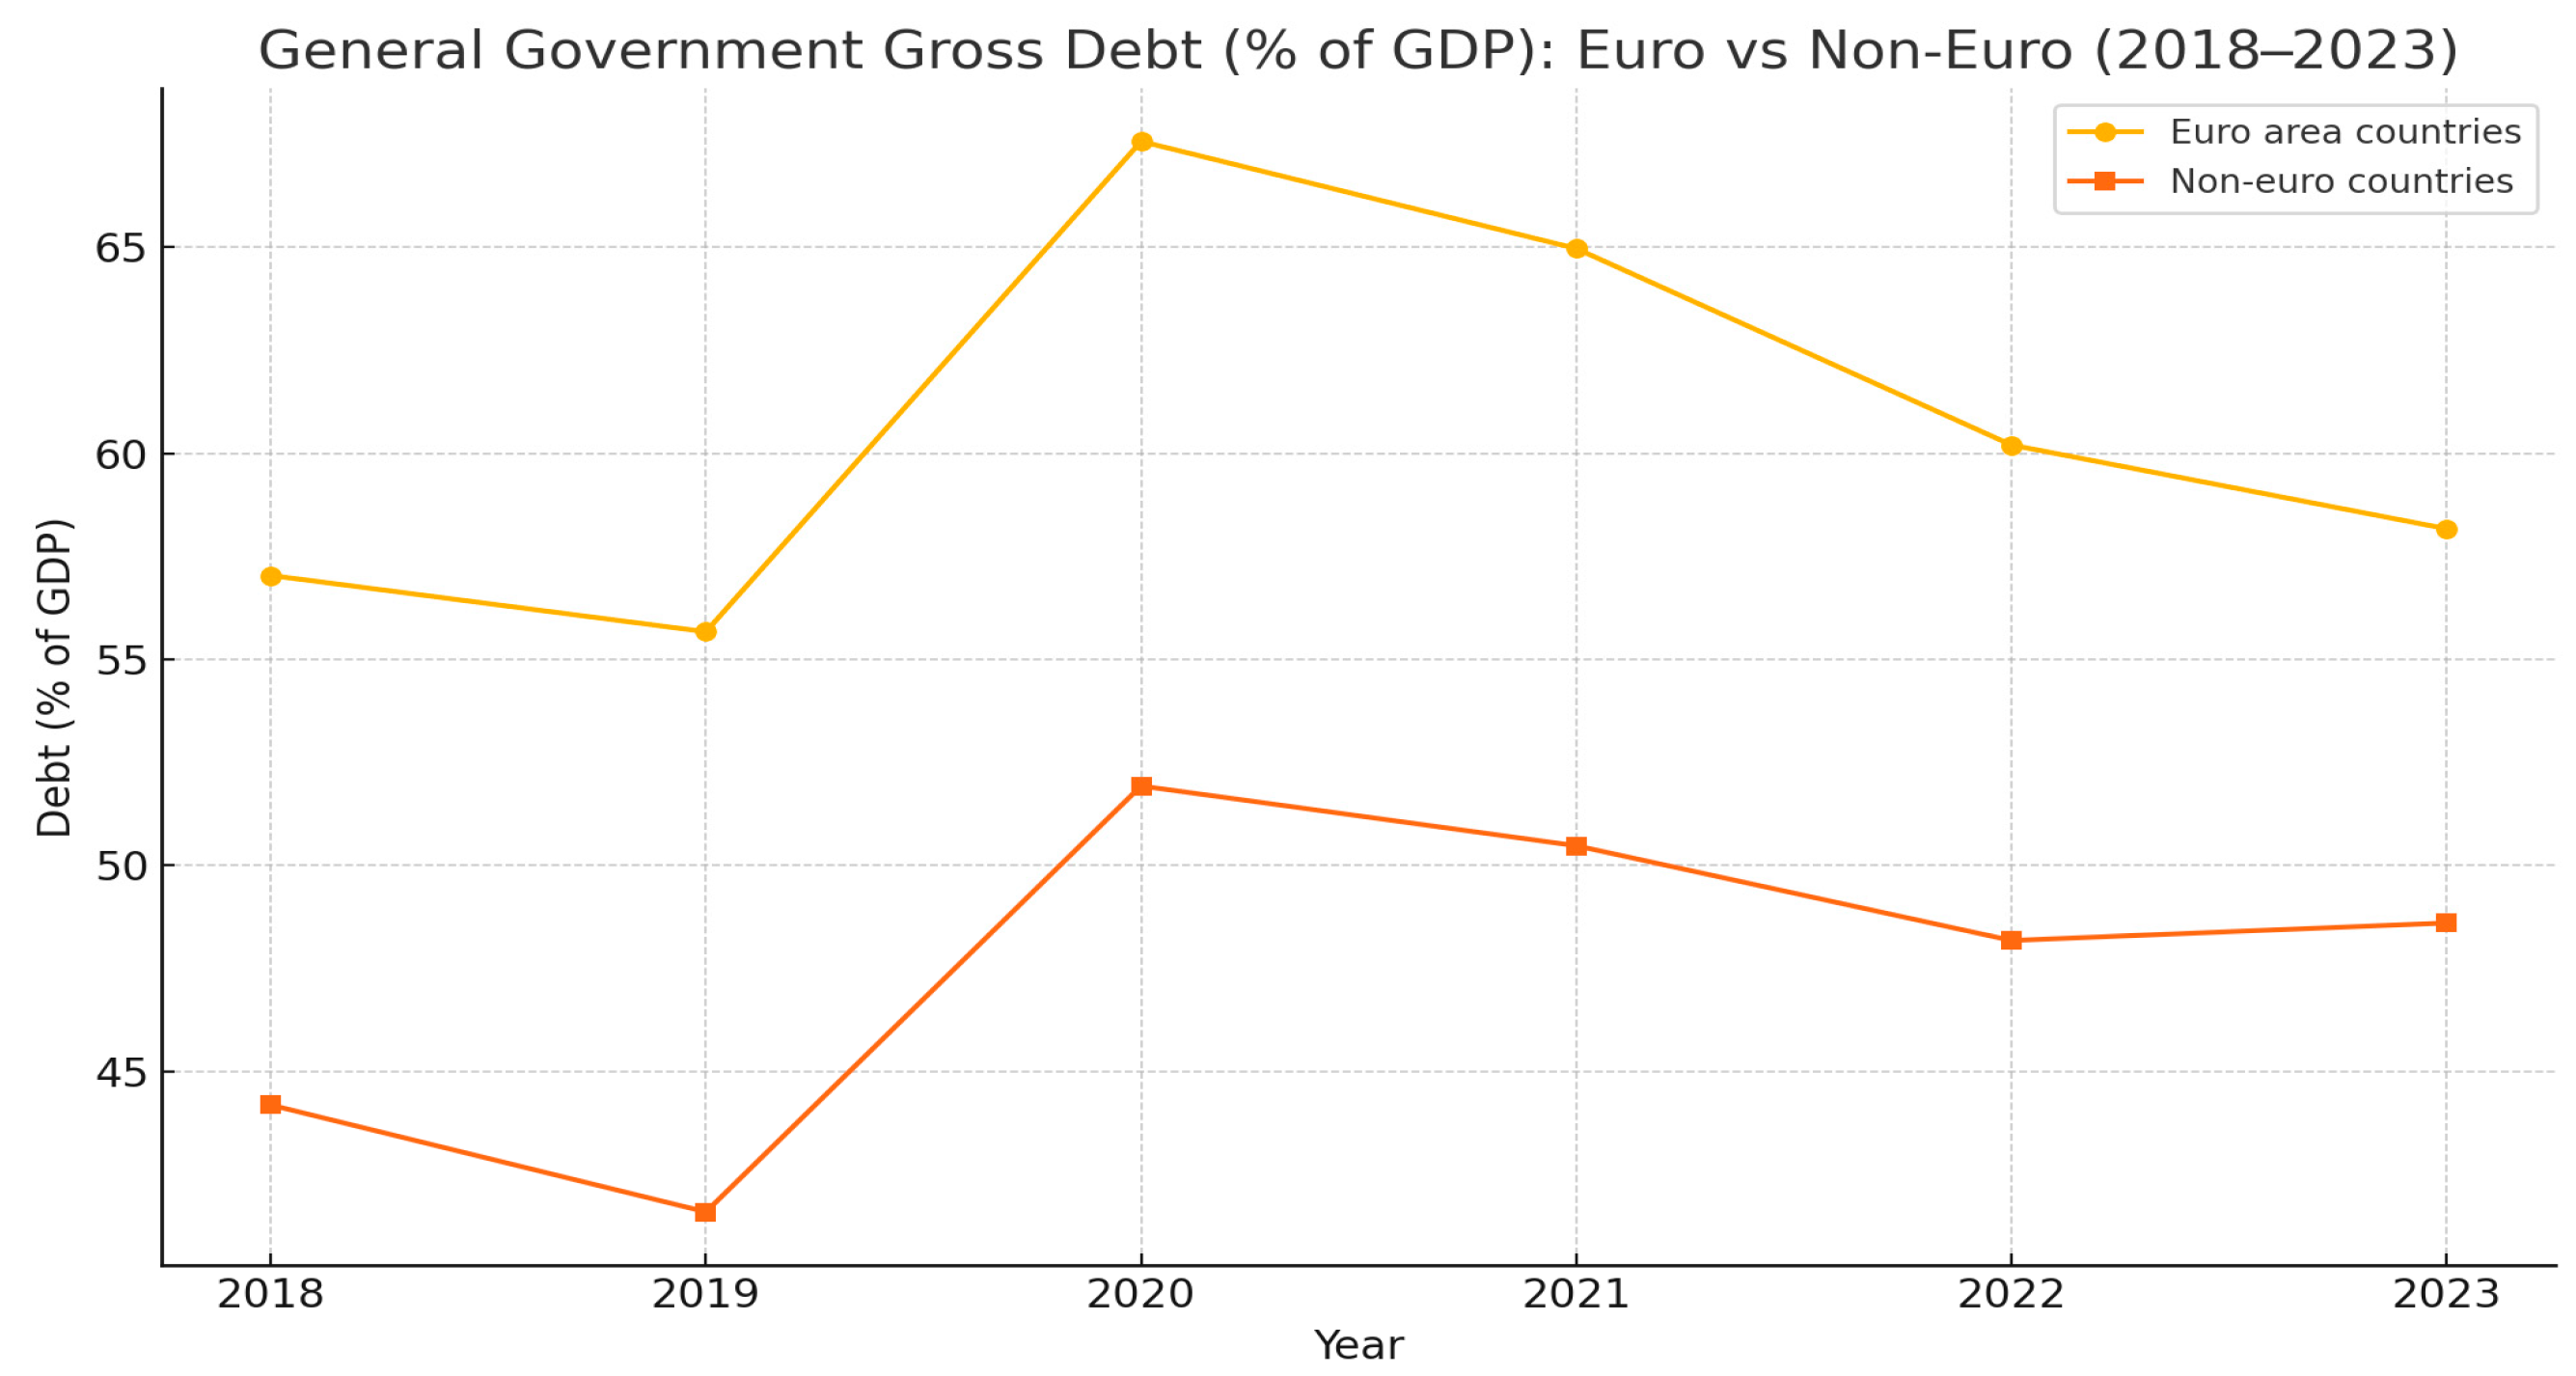
Figure 6).
Euro area countries have, on average, larger debts but also more coordinated fiscal policies. Non-Euro countries, although less indebted, may be more vulnerable in the absence of a common monetary policy.
To draw eloquent conclusions about sustainability, we correlated the debt level with the long-term interest rate. In this regard, we took two datasets, each with values for the same 9 countries:
We applied the Pearson correlation coefficient between these two series:
where
) is the covariance between the two variables;
are the standard deviations for debt and interest.
This was performed with the function: df_interest[year].corr(df_debt_short[year]).
This returns the value of r between the two columns (interest and debt) for that year (
Table 5).
Between 2018 and 2021, it is an insignificant association. In the initial years, the correlation between debt and interest rates was minimal (r < 0.2). This indicates an interval of low interest rates and expansionary monetary policies, during which the debt level had minimal impact on risk perceptions (
Figure 7). Beginning in 2022, the correlation markedly escalates to 0.35 in 2023 (
Laubach, 2009). This indicates that, with elevated inflation and the tightening of monetary policy, markets increasingly penalize nations with substantial debt. Interest rates are once more susceptible to fiscal risk.
From 2018 to 2021, the ECB and central banks in Central and Eastern Europe implemented an ultra-loose monetary policy that “decoupled” interest rates from fiscal risk, thereby alleviating the effect of debt on financing costs.
After 2022, with escalating inflation and the normalization of monetary policy, the association re-emerges: nations with elevated debt levels typically incur higher interest rates. This reinforces the notion that fiscal sustainability is once more a critical element in evaluating sovereign risk and borrowing costs.
3.1.4. HICP Inflation
The next index analysed is HICP inflation and reveals the process by which the effective consumption of the population (AIC) is converted into a common currency (the primary currency of exchange) as well as the way these values are adjusted to consider the price differences that exist between countries (the primary index of price levels).
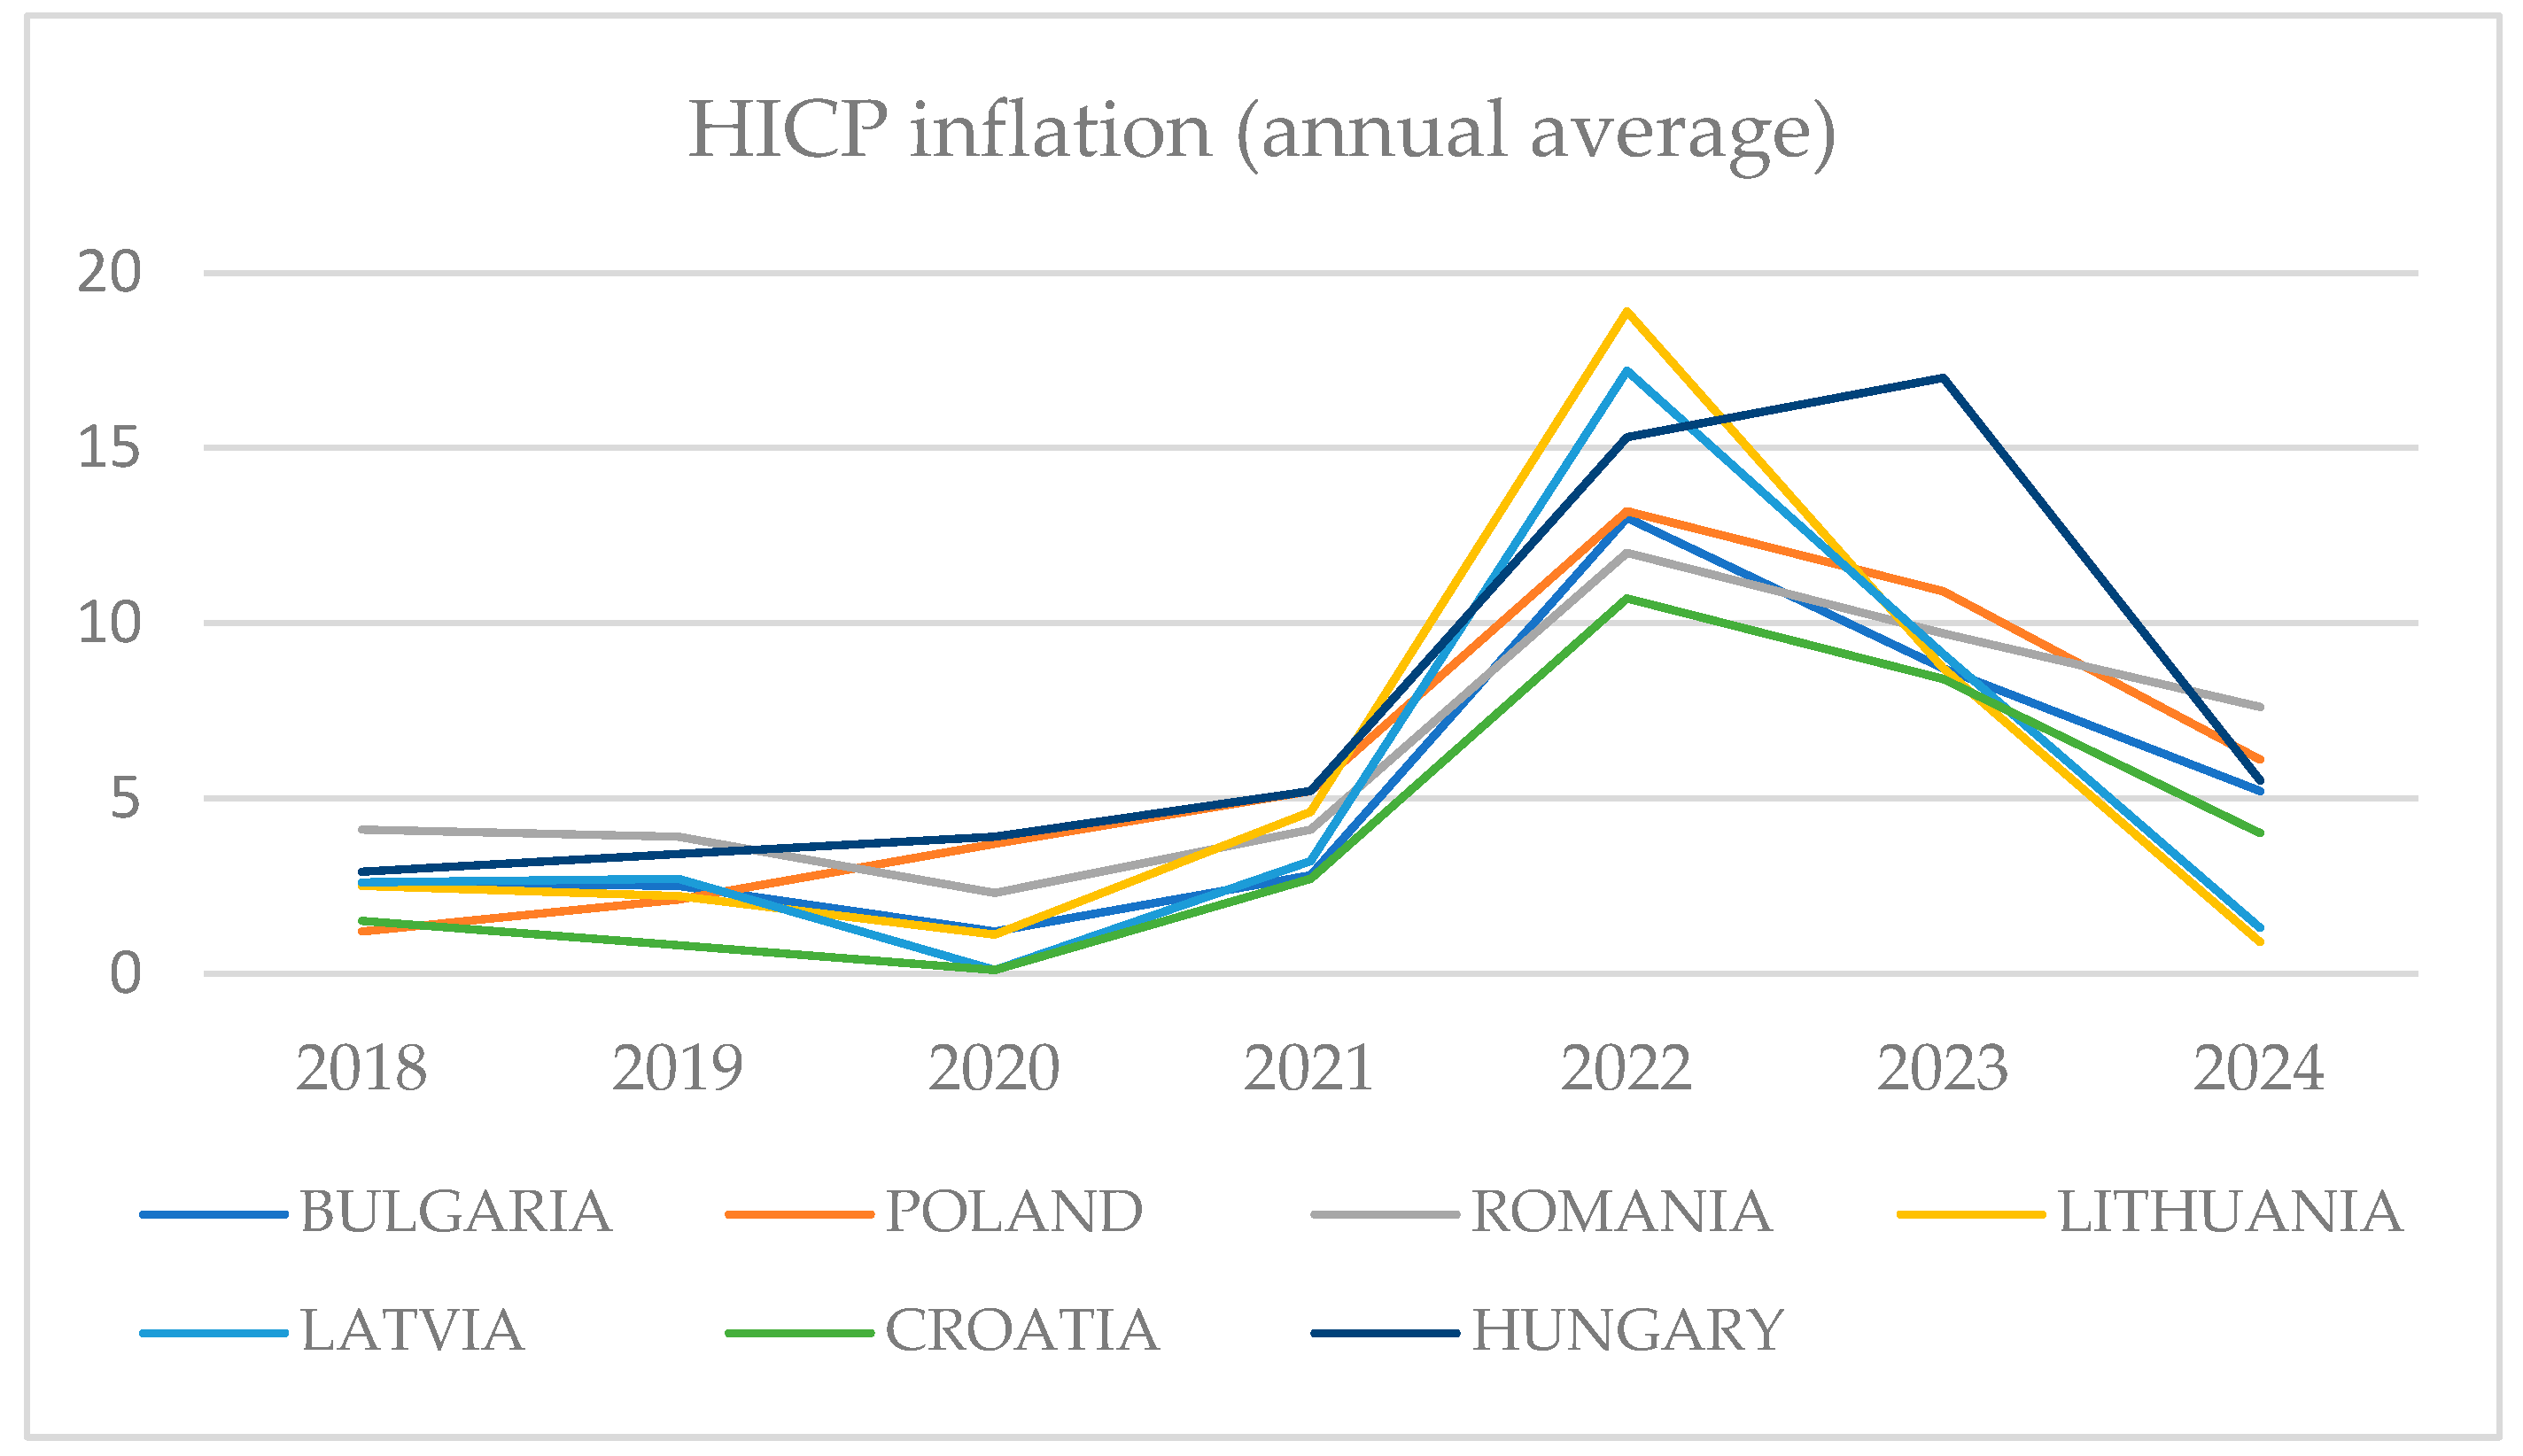
Between 2018 and 2024, annual inflation rates across selected Central and Eastern European countries demonstrate significant volatility, driven by both global shocks and internal macroeconomic pressures (
Table 6). This evolution, captured through HICP data, highlights key turning points and policy responses across the region.
In 2018, inflation was relatively moderate and stable, with most countries registering values between 1% and 4%. Romania and Poland led the group with higher inflation at 4.1% and 1.2%, respectively, while Latvia, Lithuania, and Croatia hovered between 2% and 3%. Hungary, slightly higher, recorded 2.9%. These rates aligned with a context of macroeconomic stability, low interest rates, and contained energy prices (
Figure 8).
By 2019, inflation remained under control, with Bulgaria decreasing to 2.5%, Poland increasing modestly to 2.1%, and Hungary climbing to 3.4%. Romania recorded 3.9%, continuing its relatively elevated trend. These movements suggested localized demand pressures and were accompanied by strong domestic growth and low external inflationary spillovers.
The onset of the COVID-19 pandemic in 2020 disrupted this stability. Lockdowns and collapsing demand suppressed inflation in most countries. Latvia and Croatia posted near-zero inflation (0.1%), while Lithuania reached 1.1%. Romania and Hungary remained above 2%, at 2.3% and 3.9%, respectively, due to higher supply-side rigidity and fiscal stimulus.
In 2021, as global economies rebounded, inflation began to rise again. Romania hit 4.1%, Hungary and Poland both reached 5.2%, and Lithuania surged to 4.6%. Rising commodity prices, disrupted supply chains, and post-pandemic demand recovery drove this inflationary trend. These signals also foreshadowed upcoming monetary policy adjustments.
The situation dramatically escalated in 2022, marking a historic inflation shock across the region. Triggered by the energy crisis following Russia’s invasion of Ukraine, inflation hit double digits across all countries: Hungary recorded 15.3%, Lithuania 18.9%, Latvia 17.2%, Romania 12%, and Poland 13.2%. Currency depreciation and second-round effects through wages and prices amplified these figures. These dynamics were followed by monetary tightening and increased long-term interest rates.
In 2023, inflation began to subside, although it remained elevated. Hungary peaked at 17%, while Lithuania and Latvia dropped to 8.7% and 9.1%, respectively. Romania saw a decline to 9.7%, and Bulgaria and Poland stabilized around 8.7% and 10.9%. This reduction reflects the lagged impact of tightened monetary policy, waning consumer demand, and partial normalization of supply chains. Yet, structural factors such as labour market rigidity and strong wage growth continued to delay full disinflation. As a result of high inflation, which is not compensated for by real wage growth, purchasing power is reduced. Additionally, high interest rates make it difficult for households and businesses to obtain financing, which maintains pressure on the cost of living.
The outlook for 2024 shows more promising signs. Most countries report significantly lower inflation: Lithuania and Latvia project under 2% (0.9% and 1.3%, respectively), Hungary drops to 5.5%, Romania to 7.6%, and Bulgaria to 5.2%. These trends suggest a return to price stability, driven by the cumulative impact of tighter monetary conditions and reduced external shocks (
Figure 9).
Countries outside the Eurozone had more unpredictable and higher rates of inflation, signifying weaker monetary policy transmission and greater susceptibility to external shocks.
Eurozone nations gained from ECB stability, resulting in a more rapid stabilization of inflation following the 2022 shock (
Table 7). This study indicates that Euro membership may offer a partial safeguard against inflation, particularly in a post-crisis environment.
3.1.5. Foreign Direct Investment
Foreign Direct Investment (FDI) remains a critical barometer of a nation’s economic attractiveness, reflecting investor confidence in the country’s institutional quality, macroeconomic stability, fiscal responsibility, and long-term growth potential (
Weber & Beck, 2005). For emerging European economies—both inside and outside the Euro area—FDI inflows have varied significantly over the past six years, influenced by domestic reforms, external shocks, and the broader monetary and fiscal context. The FDI index used in this study reflects normalized inward FDI stocks relative to GDP, allowing comparisons across countries and over time.
The years preceding the pandemic were marked by relatively high and stable levels of FDI across most countries. Bulgaria led the region with FDI index values exceeding 76 in both 2018 and 2019, underlining its reputation as a fiscally prudent and institutionally stable environment. Countries such as Latvia, Croatia, and Hungary also displayed strong investment appeal, with FDI values in the 58–61 range. Poland, Slovakia, and Slovenia attracted consistent inflows (50–55), underpinned by their EU membership, low labor costs, and integration into European supply chains.
Although it recorded a strong macroeconomic performance and high GDP growth, Romania recorded relatively lower FDI scores (45 in 2018 and 46.1 in 2019). This gap highlighted underlying structural deficiencies: bureaucratic inefficiencies, underdeveloped infrastructure, and regulatory unpredictability. These persistent weaknesses limited Romania’s ability to convert economic growth into sustained investor interest (
Table 8).
The COVID-19 crisis triggered a significant drop in FDI across all countries in the region. Widespread uncertainty, disrupted supply chains, and postponed investment decisions led to capital flight or stalled projects. Bulgaria, though still a regional leader, saw its FDI index fall to 76.1. Croatia and Slovenia also declined sharply, as did Hungary (56.3) and Poland (48.9) (
Figure 10).
Romania was particularly affected, with FDI falling to 41.1—confirming the vulnerability of its investment environment in the face of global shocks. Compounding this decline were rising levels of public debt and expanding fiscal deficits, which amplified investor concerns about the country’s economic governance and resilience.
As post-pandemic recovery efforts began to bear fruit, some countries saw partial rebounds in FDI. Latvia and Croatia posted significant gains, reflecting renewed investor interest in relatively more agile and stable economies. In Romania and Poland, FDI remained low (41.4 and 42.5, respectively), even though their GDP levels had rebounded and public debt had stabilized.
This disconnect suggests that quantitative macroeconomic recovery alone is insufficient to restore investor confidence. Instead, qualitative factors—legal certainty, policy predictability, governance quality, and institutional capacity—played a decisive role. Countries that failed to address structural barriers struggled to attract new investment, even in the context of favorable headline growth figures.
The year 2022 introduced a new layer of complexity: an inflationary shock compounded by rising interest rates and heightened geopolitical risk following Russia’s invasion of Ukraine. These developments significantly altered the risk–return calculus for investors.
Romania’s FDI index fell further to 38.3, marking one of the lowest points of the period. Meanwhile, Bulgaria, Latvia, and Croatia managed to maintain relatively high levels of investment (between 59.9 and 63.6), benefiting from better governance, sounder fiscal management, and clearer communication of economic policy.
Across the board, high inflation and surging financing costs—visible in long-term interest rate increases—eroded capital profitability. Investors grew more risk-averse, diverting flows away from volatile economies with weak policy frameworks.
Although inflation showed signs of easing in 2023, FDI continued to fall across many countries. Romania dropped to 36.4—the lowest among all peers—while Poland, Hungary, and Slovenia also saw their indices shrink. Notably, even Eurozone countries like Slovakia and Slovenia were not immune, suggesting that macroeconomic fundamentals matter more than currency regime alone.
This downward trend in FDI reflects broader concerns: fiscal consolidation remains sluggish; interest rates remain elevated; inflation, although decelerating, is still well above central bank targets. Moreover, repeated policy changes, populist fiscal stimuli, and inconsistent regulation have weakened investor trust, particularly in non-Euro countries (
Taylor, 1993).
This last indicator was also the basis for our data conversion (
Table 9).
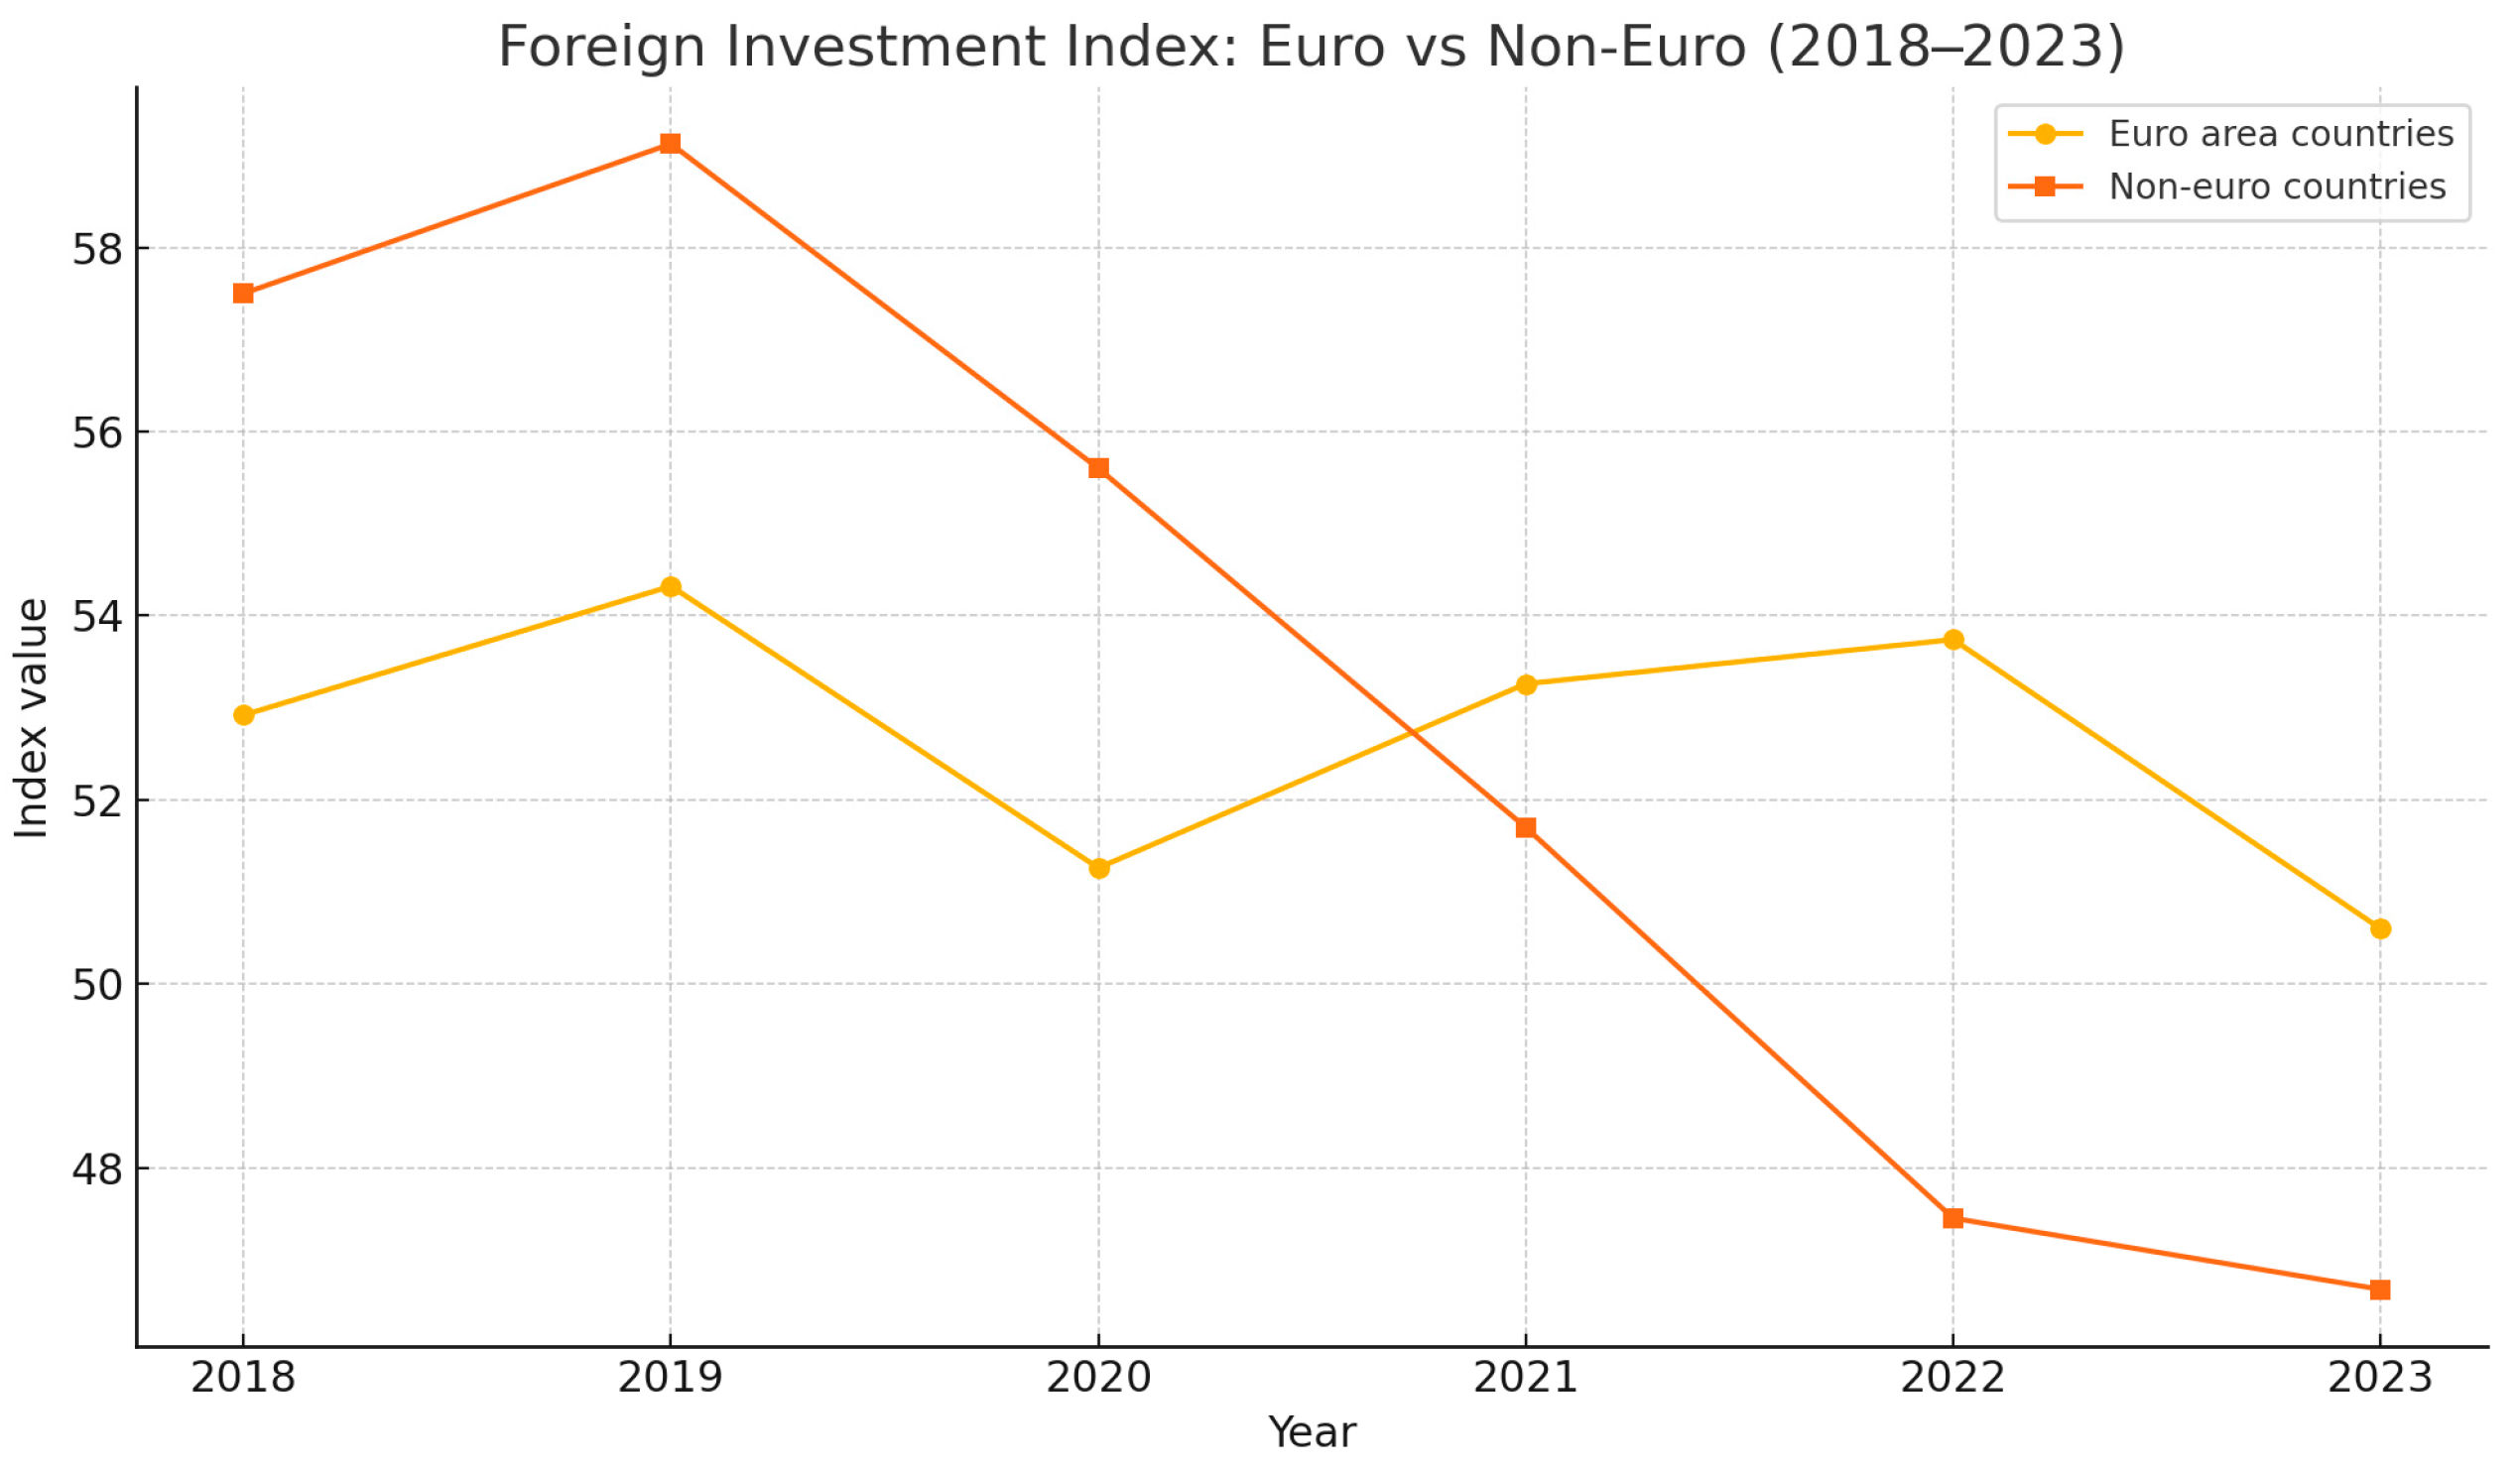
Euro area countries appear to be attracting more stable and sustained outward investment, thanks to higher investor confidence, monetary stability provided by the Euro, and lower risk perception. Non-Euro countries have seen clear declines in investment from 2020 to 2021, suggesting greater vulnerability to external shocks and possible problems of investment attractiveness (
Figure 11).
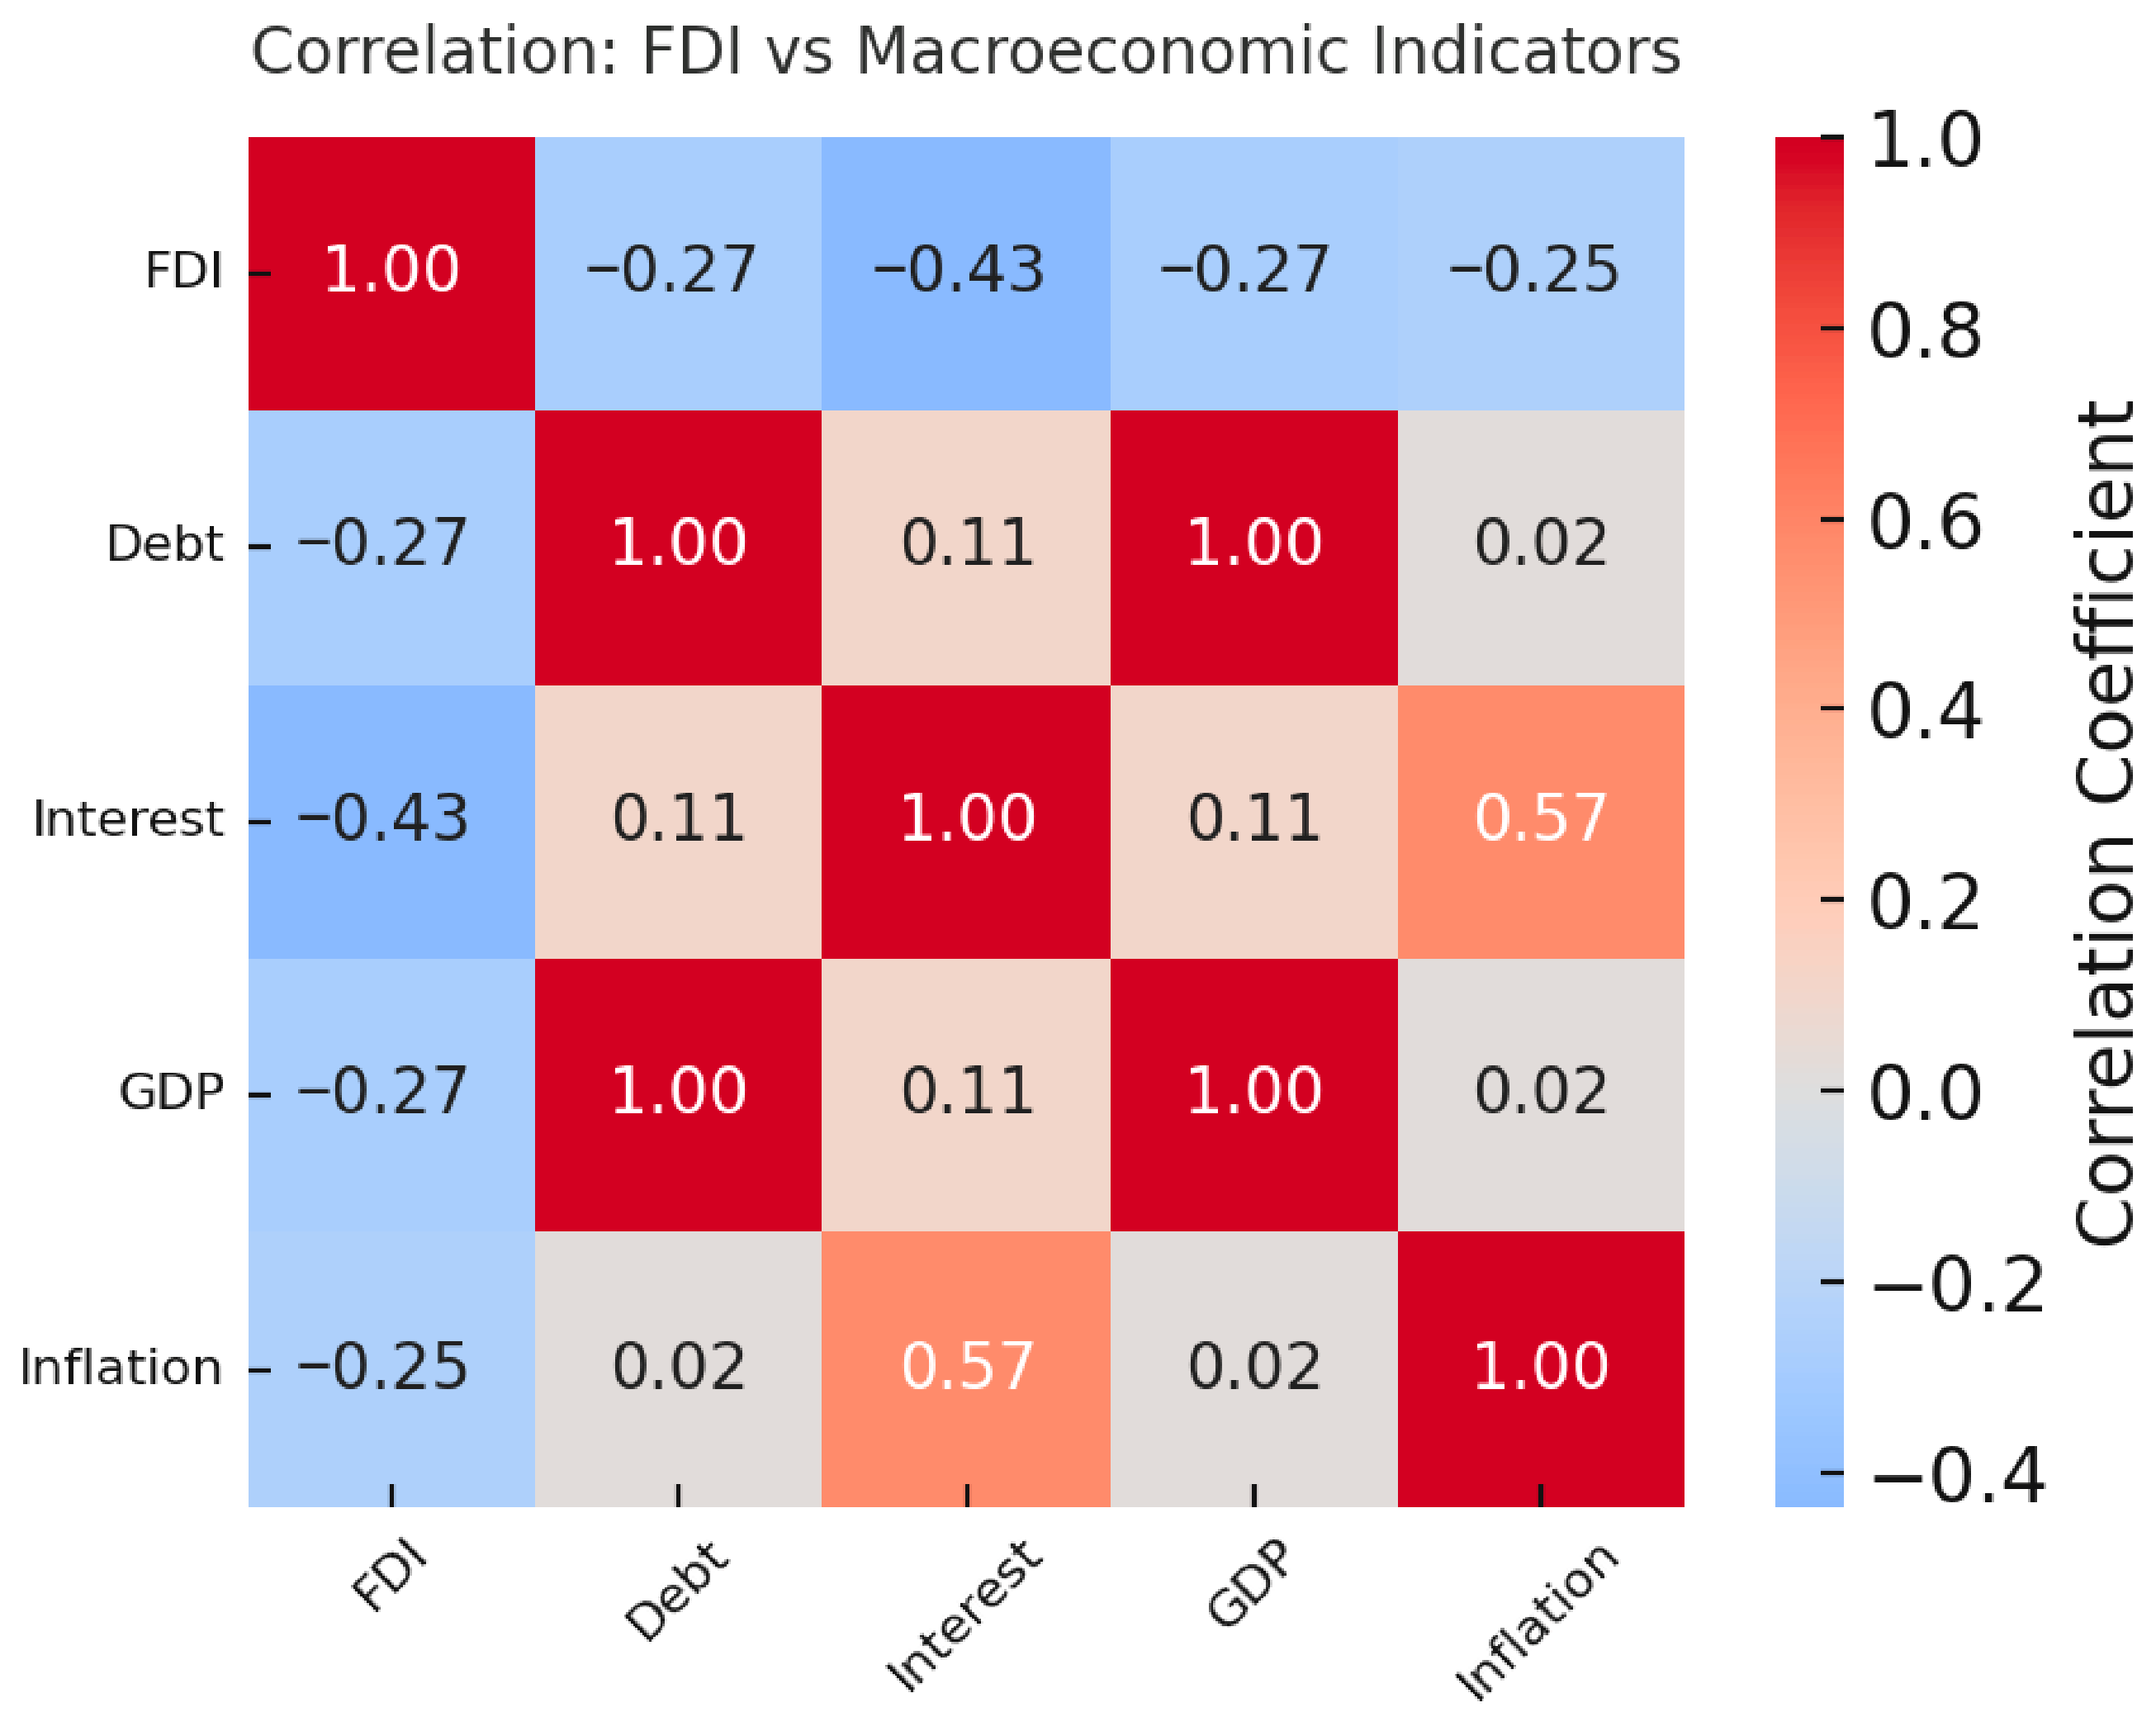
Finally, we calculated Pearson correlations between foreign direct investment (FDI) and the other macroeconomic indicators over the period 2018–2023 for all common countries, obtaining the correlation matrix and heatmap graph (Diagonal = 1.00 shows that any indicator is perfectly correlated with itself) (
Table 10).
Analysing the correlation results, we observe that the correlation between FDI and long-term interest rates is −0.43, which is the strongest negative association observed. Countries with higher interest rates tend to attract less international investment, most likely because of higher finance costs, increased perceived sovereign risk, and macroeconomic volatility (
Figure 12).
The correlation between FDI and public debt/GDP per capita (r = −0.27) is weak, but negative. More debt or lower GDP does not necessarily attract more foreign capital. Investors may choose budgetary sustainability over absolute development. The correlation between FDI and inflation (r = −0.25) highlights that high inflation might discourage investment due to pricing instability, profit erosion, and currency uncertainties. Negative correlations indicate that FDI is susceptible to economic risks such as interest rates, inflation, and debt. Policies that stabilize the macroeconomy (such as keeping inflation and interest rates low) can encourage foreign investment inflows.
FDI is an excellent additional metric for assessing economic convergence and Eurozone readiness.
