Abstract
Many countries worldwide share borders that offer several benefits, such as easier access, faster knowledge transfer, and more efficient trade diplomacy. However, reliance on land-border trade alone has not been consistently shown to increase GDP per capita or vice versa. This study investigates the relationship between trade and GDP per capita by distinguishing trade between land-border countries and non-land-border countries. The analysis applied two-stage least squares (2SLS) estimation using data from 87 countries with land borders covering 2010 to 2021. The share of trade to land and non-land borders around the world was dominated by China, Germany, and the United States, with a share of more than 10%. The results revealed a negative relationship between trade with land-border countries and GDP per capita, while trade with non-land-border countries showed a positive effect. To enhance the benefits of land-border trade, improving governance and infrastructure are essential to sustain its impacts in the future.
1. Introduction
Trade is widely recognized as one of the key components influencing the economy, primarily through its two main activities: exports and imports. Numerous studies have highlighted the positive impact of exports (Aslan & Topcu, 2018; Islam et al., 2022; Kang, 2015) and the negative influence of imports (Nguyen, 2020; Rehman et al., 2021; Usman & Bashir, 2022) on the economy. The findings of previous studies reinforce the view that exports are a major driver of GDP, as they contribute to foreign exchange earnings, expand production capacity, and enhance global competitive advantage (Abdulla & Ali, 2019; Mirzaei et al., 2012; Triyawan et al., 2023; Vohra, 2001). In contrast, imports are often considered to have a negative impact on GDP. Nevertheless, imports are essential for economic development by providing essential goods, advantage technology, and capital that can stimulate domestic production and overall economic activity (Elakkad & Hussein, 2023; Khan et al., 2016; Siregar & Widjanarko, 2022). The complex interactions between exports and imports underscore their collective importance in shaping a country’s economic structure and performance. Thus, this topic remains highly relevant, especially when exploring how modifications in border effect trade components can contribute to sustained GDP per capita across countries.
Several countries have advantages in owning land-border areas based on their geographical structure. Land-border areas are strategic regions in various aspects, including a country’s social, economic, political, cultural, and security dimensions. These areas also play a crucial role in fostering positive interactions between cross-border communities, thereby facilitating the smooth flow of trade between neighboring countries (Aleprete & Hoffman, 2012; Munir & Sultan, 2019; Rahim et al., 2021). In addition, they can be an advantage for several countries through the potential for easy agreement creation based on informal relationships and knowledge transfer among countries (Evans, 2003). The impact of intranational trade, especially exports to national borders, also influences the economy compared to international trade with partner countries (Nitsch, 2000). On the other hand, the development of intra-regional trade also leads to economic diversification through comparative advantage, economies of scale, and gravity analysis (Johnson, 2016). However, Zhao and Xiao (2022) have also stated that the development of land borders depends on policies and stability, whereby higher stability in neighboring countries leads to more developed imports and exports; as a result, it can enhance trade potential. This study also suggests improving the quality of infrastructure. Conversely, the effect of land-border countries could be negative on global trade. According to Raballand (2003), trade between landlocked countries is reduced by up to 80% due to additional land costs. It can influence the economic conditions due to the impact of lower exports to partner countries, implying a lower contribution to economic growth. Furthermore, land-border trade often has unintended consequences. Studies have shown that inefficiencies at checkpoints and stringent trade regulations exacerbate regional inequalities and harm broader economic outcomes (Maffini & González, 2023; Sakhare et al., 2024). Hence, the issue of borders in economic analysis remains relevant due to inconsistencies in previous empirical findings. While some studies suggest that trade with land-bordering countries offers geographic advantages, recent evidence highlights that expanding trade to non-land-border partners may be more beneficial for developing countries, as it tends to generate a higher trade share (Bunje et al., 2022; Sunde et al., 2023). This underscores the ongoing debate surrounding the geographical dimensions of trade and their broader implications for national income.
Based on the findings of the gap regarding the impact of trade with land border areas on the economy, measured based on GDP per capita, this study examines the relationship between trade and borders-GDP per capita using the total trade of certain countries to land borders and non-land-border countries worldwide. Currently, a total of 156 countries, or almost 80% of countries around the world, have land-border areas with neighboring countries (CIA, 2024), indicating that this study might be necessary for policymakers in the global world. In addition, the linkages between governance, logistics, and trade-led growth must be considered in this study. A strong governance framework helps reduce trade fraud and illicit financial flows, supporting a healthier trade environment and economic performance (Babatunde & Afolabi, 2023; Lin et al., 2020). Similarly, an efficient logistics system enhances a country’s trade competitiveness by lowering production and transportation costs and increasing trade volume and economic output (Kwasnicki, 2013; Sénquiz-DÍaz, 2021; Suroso, 2022). Therefore, the quality of governance and logistics performance are key pillars in optimizing the benefits of global trade integration in income generation. GDP per capita is a key economic indicator in this study, as it reflects economic performance and broader social outcomes relevant to sustainable development. The overall purposes of this study are as follows:
- To investigate trade’s impact on GDP per capita by comparing trade to land borders and non-land borders.
- To assess the influence of governance and logistics on trade performance in land-border and non-land-border countries and the GDP per capita nexus.
2. Literature Review
Trade is already known as a primary source of economic growth, enhancing the economy through increased specialization, enhanced economies of scale, increased capacity utilization, and rapid technological change (Feder, 1983; Purnama & Yao, 2019; Singh, 2010). Due to the positive impact on economic growth, many previous studies have analyzed the role of trade in economic growth in recent decades. Gulzar and Rafiq (2019) emphasized that although trade is an important factor in driving growth in developing countries, its empirical results may vary depending on the specific conditions and contexts faced by each country. Meanwhile, Raghutla (2020) showed empirical evidence that trade has a significant positive impact on long-term economic growth in emerging market countries. Siregar and Widjanarko (2022) also showed the positive impact of trade openness on economic growth in agricultural producers. Overall, the issue of trade is important for economic development in nations.
The impact of trade on the economy has also been distinguished into exports and imports in specific cases. Kang (2015), examining the nexus between agricultural exports and the gross domestic product of four rice-producing countries, found that rice exports affect the GDP of these four countries. Bakari and Mabrouki (2017) revealed that agricultural exports had a strong positive correlation with gross domestic product and positively impacted economic growth, indicating that it is essential to improve investment in the agricultural sector. Murindahabi et al. (2019) also showed that they found a significant and positive effect of coffee exports on economic growth, suggesting the promotion of the coffee sector to boost the nation’s economy. Seok and Moon (2021) revealed that agricultural exports had a positive effect on agricultural growth in the case of the European Union (EU), while imports had an inverse effect. On the other hand, the effect of imports on economic growth has also been explored by previous scholars. Kristjanpoller and Olson (2014) found that imports have a negative and significant effect on GDP growth in the Latin American country group. Similarly, Abdulla and Ali (2019) also noted a positive correlation between imports and economic performance, emphasizing the role of imports in providing essential capital goods and technology that support growth. Furthermore, Elakkad and Hussein (2023) highlighted that although imports are essential for development, inefficiencies in import management, particularly in the absence of effective government policies, can hamper the growth of domestic industries. Therefore, the positive effect of trade on the economy was found.
In the case of border or regional trade, Ling (2017) investigated the impact of border trade value on Myanmar’s economic growth for the period of 1996 until 2015, especially trade to China, Thailand, India, and Bangladesh. The result showed that the border trade export was the main driver to improve economic growth in Myanmar, showing the vital source of export destination countries. Zhang et al. (2023) investigated the impact of border area revitalization on economic growth in China by utilizing panel data regression from 1999 to 2016. The results revealed that this policy could contribute significantly to the economic growth of border countries. Specifically, Guo et al. (2024) explored the effect of cross-border e-commerce (CBEC) exports on regional economic growth in China from 2015 to 2020 in Chinese provincial data. The results demonstrated that CBEC exports significantly increased regional economic growth in China. Additionally, CBEC exports had a significant positive impact in less developed regions rather than in more developed regions. Arteaga et al. (2020) examined the nexus between exports to China and the economic growth of countries in Latin America by utilizing panel data regression from 1990 to 2017. The findings showed that exports to China after China joined the World Trade Organization (WTO) had a positive impact on the economic growth of South America. However, this export to China negatively impacted the economic growth of the group of Mexico, Central America, and the Caribbean. Hence, the land-border effect on trade produced different outcomes for the economy.
In summary, this literature review explores the impact of trade, including both exports and imports, on the economy, particularly in the case of GDP per capita. However, there are still a few previous articles that have examined the border effect on trade according to geographical factors, one of which is exportation to land-border countries. The previous literature also highlights the role of border area trade and its development on the economy in the third paragraph (Guo et al., 2024; Ling, 2017; Zhang et al., 2023), but further investigation is needed to comprehensively bridge the relationship between trade and GDP per capita from a geographic perspective. Addressing this gap is crucial for informing policy decisions to promote economic growth and strengthen bilateral relations with neighboring countries. This study distinguishes itself from previous studies by employing regression analysis to provide deeper insights into the impact of land-border trade on economic growth. Examining the trade–GDP per capita relationship through a geographic perspective contributes to a more nuanced understanding of how cross-border trade influences economic performance.
3. Methodology
Basically, this study adopted the framework developed by (Frankel & Romer, 1999) to estimate the geographical impact of border areas on the trade-GDP per capita nexus. This approach was deemed appropriate because it effectively addresses the issue of endogeneity in the relationship between trade and the economy. A two-stage regression was employed in this study to predict the nexus between trade and GDP per capita. Accordingly, the two models of regression proposed by Frankel and Romer (1999) are as follows:
where Tij/GDPi is trade (exports and imports) divided by GDP in country i to country j, DISTij is the geographical distance between country i and country j, POPi and POPj is the total population in country i and country j, Yi is the income of nation i proxied by GDP per capita (GDPC), AREAi is the area size of country i, a0 is the constant term, a1, a2, and a3 are the coefficient of regressor, Ln is the natural logarithm, and eij and ui are residual terms.
This framework could be extended based on our two research objectives by employing several variables, namely distance to land-border countries (DISTLB), distance to non-land-border countries (DISTNLB), trade to land-border countries (TLB), trade to non-land-border countries (TNLB), and the categorization of landlocked countries (LL), respectively. This modification model was conducted to achieve our research objective, especially in the comparison of the nexus between trade-GDP per capita in land-border or non-land-border countries. Unlike previous studies, this study analyzed the impact of trade on border areas by treating the distance variable as the average between country i and a group of countries j, which were classified into land-border and non-land-border groups. Furthermore, only the POP and AREA variables of the reporting country were included, since the trade analysis was conducted from one country to a group of destination countries. Therefore, in this study, we modified Equations (1) and (2), written as follows:
Equation (5) represents the model used in this study to explore the effect of trade on GDP per capita from geographical border perspectives. In addition, this study also correlated the predicted values from the first-stage regression with the actual values of trade, ensuring causal effects of land-border and non-land-border trade on income, not due to other unobserved variables. Hence, there is an additional equation to find the fitted value of trade before the estimation of the trade-GDP per capita nexus as follows:
PTLBit and PTNLBit were constructed to represent trade for land-border and non-land-border countries, respectively. In this study, we employed the two-stage least squares (2SLS) method to estimate the causal impact of international trade on per capita income, distinguishing between land-border and non-land-border countries. The 2SLS approach was preferred over ordinary least squares (OLS) in the presence of reverse causality or omitted variable bias in the regression model. Following Frankel and Romer (1999), the actual trade share was instrumented using a constructed trade share derived from a gravity model based on geographical factors in the first stage. The adjusted values from this stage, representing the exogenous component of trade, were then used in the second stage to assess its impact on income.
To achieve the second objective, the study also incorporates a landlocked variable (LL) into the second model for trade-GDP per capita nexus based on several previous literature sources (Dahal & Budhathoki, 2023; Rivero et al., 2020). Consequently, the model with the interaction term involving the landlocked variable can be rewritten as follows:
On the other hand, a robust analysis was conducted to ensure that the results of our study were accurate or otherwise. Based on some previous literature sources, we used two other measurements, namely, gross school enrollment (GES) and GDP per employee (GDPE). These two variables can be used as proxies for sustainable economic development and offer an alternative benchmark for assessing a country’s income (Lenka & Sharma, 2017).
Therefore, this study also improved Equation (5) by adding two interaction variables, namely, world governance index in aggregate (GOV) and logistic performance index (LPI) to explore these interactions’ impacts on trade in both land-border and non-land-border classifications. Hence, the four equations of second-stage regression derived from Equation (5) can be expressed as follows:
In this study, data were gathered from several sources for 87 countries around the world for the period of 2010 to 2021, which are shown in Figure 1 (detailed information about the names of countries is provided in Appendix A). Only 87 of 156 countries were included due to data completeness.
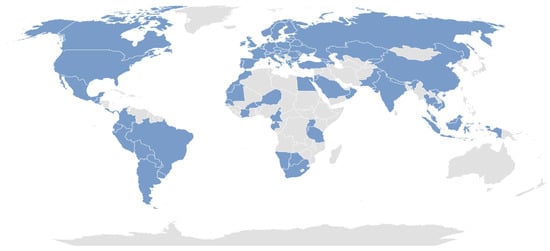
Figure 1.
The countries involved in this study (with the blue color). Source: (CIA, 2024), screening by author.
The sources of GDPC, GES, GDPE, S, and LPI were gathered from the World Development Indicator (WDI). The data for DISTLB, DISTNLB, and A were collected from CEPII, while the data for TLB, TNLB, and LL were collected from UN Comtrade and World Atlas, respectively. GOV was collected from the World Governance Index (WGI). The summary of these variables was shown in Table 1.

Table 1.
Description of all variables involved in the study.
4. Results
Figure 2 presents the distribution of international trade performance of countries to trading partners with and without land borders. In the category of trade to countries with land borders, the United States recorded the highest contribution of 15%, followed by Germany (12%), Canada (7%), Hong Kong (7%), and Mexico (7%). No single country had a proportion of trade to countries with land borders exceeding 20%, reflecting a relatively even trade distribution pattern between countries. This shows that most countries around the world continue to maintain trade relations with trading partners that have geographical proximity through land borders. In terms of trade to non-land-border countries, China is the country with the largest share, at 18%. The United States and Germany again recorded significant contributions of 13% and 8%, respectively. Furthermore, the United Kingdom, Italy, the Netherlands and France each contributed 5%, 4%, 3%, and 3%, respectively. As with trade to land-border areas, 40% of trade to non-land-border countries is spread across various other countries. This finding confirms that global trade activity shows a wide and balanced level of distribution, both in trade to land-bordering and non-land-bordering countries, which confirms the importance of the geographical dimension in the structure and strategy of international trade.
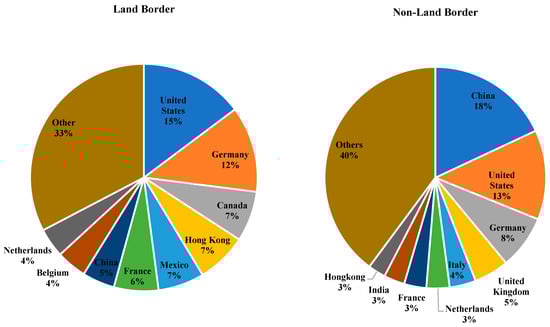
Figure 2.
Trade performance between land border and non-land border countries. Source: (UN Comtrade, 2025).
Table 2 presents descriptive statistics of the variables, including the mean, median, maximum, minimum, and standard deviation (Std. Dev). Based on the comparison between the mean and standard deviation, variables such as TLBit, TNLBit, and GOVit showed high variability, as their standard deviations exceeded their respective means. In contrast, GDPCit, DISTLBij, DISTNLBij, POPit, AREAi, and LPIit showed relatively stable distributions, indicating a more normal pattern of variation.
Table 2.
Descriptive statistics of variables involved in this study.
In this study, we also conducted the unit root test for several variables, namely, GDPC, TLB, TNLB, POP, and GOV, using data available for the period of 2010 to 2021. As shown in Table 3, all variant variables were found to be stationary at this level, with significance levels below 5%. Hence, all independent variables conducted were in the form of a level.
Table 3.
Unit root test.
Table 4 reveals the determinants of bilateral trade equations for both cases, such as land-border and non-land-border classifications. In this study, we found a positive impact of landlocked status and distance on trade with a land-border country, while population had a negative effect. Furthermore, the area size of a country has a positive and significant impact on trade with a land-border country. Countries categorized as landlocked often rely heavily on trade with neighbouring countries due to the geographical constraints they face. Despite these limitations, landlocked developing countries can still experience positive contributions to economic growth through such trade relationships (Khurelchuluun et al., 2023). However, a growing population negatively affects trade across land borders, potentially due to increased domestic demand or infrastructure strain.
Table 4.
The determinants of bilateral trade to land-border or non-land-border countries equation.
In contrast, trade involving non-land-border countries is influenced by a different set of factors. Several variables—such as geographic distance, population size, land area, and landlocked status—have been found to negatively and significantly impact trade with non-landlocked countries. The greater the geographical distance, the higher the logistics costs and shipping time, which ultimately reduces the volume of trade between countries, in accordance with several previous studies (Irshad et al., 2018; Ngoma, 2020; Tandra & Suroso, 2023). In addition, a larger land area does not necessarily translate into economic advantages in cross-border trade. The findings further revealed that being landlocked or lacking direct access to the sea continues to pose significant challenges, particularly in trade with non-landlocked countries. These results highlight that geographical barriers remain a critical limiting factor in international trade flows.
After estimating the determinants of bilateral trade, we further examined the effect of constructed trade shares on actual trade for both land-border and non-land-border country classifications. As presented in Table 5, the constructed trade share had a positive and significant impact on actual trade. Theoretically, this result reflects the natural tendency of countries to trade based on exogenous factors such as geographic distance, economic size, and location-specific characteristics. This finding aligns with the work of (Frankel & Romer, 1999), who demonstrated that constructed trade shares are a key determinant of cross-country differences in actual trade flows.
Table 5.
The nexus between actual and constructed trade, land border, and non-land border.
Figure 3 and Figure 4 also reveal the correlation between constructed and actual trade in the case of land-border and non-land-border countries. The distribution patterns observed in the scatterplots show clear differences in the relationship between constructed trade shares and actual trade, depending on the type of international border. For countries sharing a land border, the data points showed concentrated clustering, indicating a relatively uniform alignment between natural trade potential and realized outcomes. In contrast, the data for countries without a land border showed a more dispersed pattern, indicating heterogeneity in realized trade relative to expected potential. These findings imply that border characteristics significantly influence the extent to which a country’s trade potential, as estimated by the gravity-based constructed trade share, translates into actual trade performance.
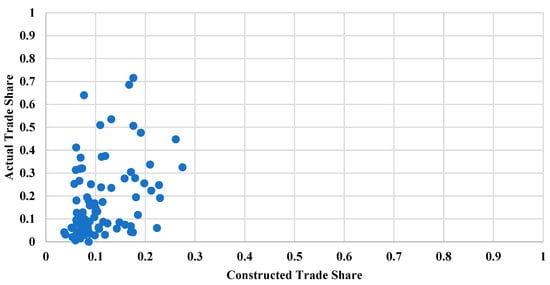
Figure 3.
Actual and constructed trade share, land border.
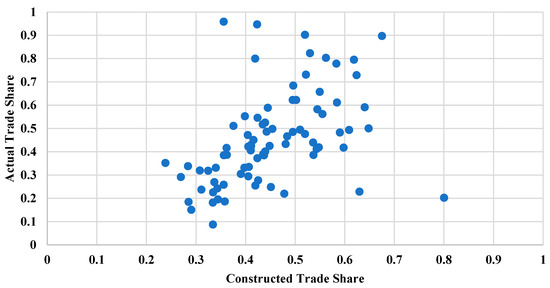
Figure 4.
Actual and constructed trade share, non-land-border.
Table 6 presents the estimated impact of trade on GDP per capita, distinguishing between trade with land-border and non-land-border countries. The results show that trade with land border countries and population has a negative and significant impact on GDP per capita, while trade with non-land-border countries has a positive and significant impact. Meanwhile, the country area did not show a significant effect on income per capita. This finding is consistent with previous studies, which emphasize that land-border trade is still suboptimal due to limited accessibility, high trade costs, and logistical constraints that hinder trade intensification (Dahal & Budhathoki, 2023; Gyawali, 2024; Paudel, 2019). Furthermore, trade with non-bordering countries has a positive impact on GDP per capita by expanding market access—an important driver of economic growth, particularly in developing countries. The increase in trade volume resulting from broader market reach can enhance a country’s economic performance, as reflected in indicators such as GDP per capita (Colla-De-Robertis & Garduno Rivera, 2021; Mbogela, 2019). As a result, trade with non-bordering countries generally supports higher per capita income by opening access to larger markets and encouraging strategic adaptations to global market dynamics.
Table 6.
The estimation of the impact of trade with land-border and non-land-border countries on GDP per capita, excluding and including landlocked countries.
We also uncovered the effect of landlocked countries on the trade-GDP per capita nexus from a border area perspective. Although trade with land-bordering countries continues to show a negative association with GDP per capita in models that include the landlocked variable, the positive and significant coefficients on both the landlocked dummy and its interaction terms with trade (for both land-bordering and non-land-bordering countries) suggest that landlocked countries can still derive economic benefits from trade under certain conditions. These findings are consistent with previous studies, which show that landlocked status positively influences economic indicators such as trade and investment, ultimately contributing to GDP growth (Márquez-Ramos et al., 2007; Subasat & Bellos, 2013). Despite the additional transportation costs associated with landlockedness, these countries often prioritize the development of efficient land and air transport infrastructure, which may require less investment complexity than maintaining maritime infrastructure in coastal countries. Moreover, improvements in logistics—such as the development of dry ports and streamlined cross-border procedures—have enabled several landlocked countries to integrate more effectively into regional and global markets (Myagmarsuren & Deng, 2015; Sharapiyeva et al., 2019).
In addition, the adverse impacts of being landlocked can be substantially mitigated by improving governance and institutional quality, which often exert a more decisive influence on economic performance than geography alone (Carmignani, 2015; Rivero et al., 2020). Thus, trade with land borders also does not produce a partial positive effect when landlocked is included in the equation. Finally, this study applied a Wald test to assess whether the coefficients for trade with land-bordering and non-land-bordering countries differ significantly. The results confirmed a statistically significant difference, with the F-statistic significant at the 1% level (p-value < 0.01), indicating that the impact of trade with non-land-border countries was significantly different from trade with land-border countries.
To ensure the validity of our results, we also conducted a robust analysis by changing the dependent variable and involving the two indexes, expanding the trade-GDP per capita nexus (Table 7). Our study results showed the consistency of the regression findings when the GDP per capita variable was replaced with two alternative variables, namely school participation and GDP per employed person. The estimation results still showed a negative effect of trade with land-border countries, while trade with non-land-border countries showed a positive effect. In addition, the land area was also found to have a positive and significant effect on both variables. This finding showed that the larger a country, the greater the opportunity to improve access to education and the welfare of its population. Land area allows for diversification of resources and wider infrastructure development and produces a positive impact on education indicators and income per worker (Ali & Memon, 2019). In the case of governance and logistics, we found that there was a positive impact of these indicators on GDP per capita and their interaction with trade, which strengthens their impact. Effective governance ensures supportive policies, while reliable logistics infrastructure facilitates the flow of goods and services, creating conditions conducive to economic growth (Nzeh et al., 2022). Moreover, the positive impact of logistics and governance on the economic indicator was in line with previous findings (Sharapiyeva et al., 2019; Yushi & Borojo, 2019). Therefore, these two policies are crucial for increasing the value of trade for both land borders and non-land borders.
Table 7.
Robustness analysis—The estimation of the impact of trade with land border and non-land border countries on GDP per capita.
5. Discussion
The findings of this study indicate that trade remains a relevant driver of economic growth—but primarily in the case of non-land-border trade. The results showed that trade with neighbouring countries sharing land borders does not contribute significantly to increasing per capita income. This is attributed to several structural challenges, including the limited number of land-based trading partners, most of which are also developing countries with relatively low economic capacity, as well as underdeveloped physical and logistical infrastructure, which need improvement to support economic growth, as reflected in empirical studies of countries engaged in border trade (Krainara & Routray, 2015; Okabe, 2025; Zahid-ul-Islam-Dar et al., 2023). In addition, administrative barriers, protectionist policies, and high levels of informal trade also reduced the effectiveness of cross-border trade contributions to national economic growth (Abiodun, 2021; Sarjono & Rudiatin, 2022). The lack of policy coordination between neighboring countries and unstable socio-political conditions further hinder efforts toward regional economic integration (Omodunbi et al., 2022; Yıldırım, 2017).
In contrast, trade with non-land-border countries has a positive and significant impact on GDP per capita. This is largely due to broader market access, reduced dependence on immediate neighbours, and increased opportunities for diversification (Esu & Udonwa, 2015; Lotfi & Karim, 2017). Engaging with distant trading partners allows countries to leverage comparative advantages and benefit from regional trade agreements, thereby boosting export capacity and enhancing economic integration. Furthermore, by avoiding the logistical and infrastructural constraints typically associated with land-border trade, non-land-border trade offers a more strategic and growth-oriented path for developing economies. To maximize the potential benefits of cross-border land trade, targeted policy interventions are necessary—particularly those aimed at improving governance, infrastructure, and logistics performance.
This study differs from prior research by concentrating on the border effect of the trade-GDP per capita nexus and the considerable influence on economic growth through trade with non-land-border countries. While trade with land-border countries negatively affects per capita income, cross-border trade still holds potential for economic improvement, particularly by increasing access to and development in border regions (Bressan, 2017). On the other hand, trade to land-border regions can significantly enhance individuals’ welfare, hence facilitating the attainment of sustainable development goals in the social sector (Okrasa, 2023). A previous study by Ugli (2020) suggested that export diversification was a key component of sustainable economic growth, as it improved the balance of payments and attracted greater investment. This effect aligns closely with the positive impact of trade with non-land-border countries on GDP per capita. Similarly, trading with high-performing economies could further stimulate domestic growth, underscoring the importance of non-land-border trade in national development strategies (Arteaga et al., 2020). Overall, this study reinforces the strategic significance of the border effect by revealing a strong and significant correlation between trade and GDP per capita, particularly in the context of trade with non-land-border countries.
6. Conclusions
In this study, we aimed to investigate the impact of trade on GDP per capita, focusing on the role of geographic borders—specifically, land and non-land borders. Descriptive analysis showed that most developed countries benefit from substantial trade contributions through both borders. The findings revealed that trade across land borders has a negative and statistically significant effect on GDP per capita. In contrast, trade across non-land borders (such as sea or air) shows a positive and significant effect. Additionally, the interaction between the Logistics Performance Index (LPI) and governance quality positively and significantly influences overall trade performance. These results suggest that effective trade management can enhance trade outcomes through land and non-land borders, especially when informed by strong governance and logistical capacity.
This study suggests recommendations to increase economic growth through increased exports, such as (1) expanding trade to non-land borders in addition to utilizing connections with land-border countries, (2) improving the quality of governance and infrastructure to maximize trade value, and (3) expanding trade to non-land-border countries to achieve higher GDP per capita. Finally, there are some limitations to this study regarding market intelligence in the case of one country, such as challenges and opportunities in trade to land-border countries. Therefore, further studies are needed by considering the expansion of the number of countries and the analysis period. In addition, this study only considers countries with land borders, so it does not include non-land-border countries such as countries on the Oceania continent.
Author Contributions
Conceptualization H.T., I.G.A.P.M., B.R. and Z.S.; methodology H.T., I.G.A.P.M., B.R. and Z.S.; software H.T. and S.S.; validation B.R., S.S., Z.S. and H.d.S.; formal analysis H.T., S.S., B.R., I.G.A.P.M., and Y.P.; investigation H.T., I.G.A.P.M. and H.d.S.; resources S.S., H.d.S. and Z.S.; data curation S.S., B.R., Z.S., H.d.S. and Y.P.; writing—original draft preparation H.T.; writing—review and editing I.G.A.P.M., Z.S., B.R., S.S. and Y.P.; supervision I.G.A.P.M. All authors have read and agreed to the published version of the manuscript.
Funding
This research received no external funding.
Institutional Review Board Statement
Not applicable.
Informed Consent Statement
Not applicable.
Data Availability Statement
The original contributions presented in this study are included in the article. Further inquiries can be directed to the corresponding author(s).
Acknowledgments
We express our sincere appreciation to the Directorate of Talent Management, National Research and Innovation Agency of the Republic of Indonesia, for their invaluable support. Our sincere gratitude also goes to the entire team (authors) for their precious and significant contribution to this manuscript.
Conflicts of Interest
The authors declare no conflicts of interest.
Appendix A. The Identification of Countries Involved in This Study
| List of 87 Countries Used in this Study |
| Albania, Argentina, Armenia, Austria, Azerbaijan, Belarus, Belgium, Bolivia, Bosnia and Herzegovina, Botswana, Brazil, Bulgaria, Burkina Faso, Burundi, Cambodia, Cameroon, Canada, Chile, China, Colombia, Costa Rica, Ivory Coast, Croatia, Czech Republic, Denmark, Egypt, Ecuador, El Salvador, Estonia, Finland, France, Gabon, Georgia, Germany, Greece, Guatemala, Hong Kong, Hungary, India, Ireland, Italy, Jordan, Kazakhstan, Kyrgyzstan, Latvia, Lithuania, Luxembourg, Macau, Malaysia, Mauritania, Mexico, Moldova, Morocco, Namibia, Nepal, the Netherlands, Niger, North Macedonia, Norway, Oman, Pakistan, Panama, Paraguay, Peru, Poland, Portugal, Romania, Russia, Rwanda, Saudi Arabia, Senegal, Slovakia, Slovenia, South Africa, Spain, Sweden, Switzerland, Tanzania, Thailand, Turkey, Uganda, Ukraine, the United Kingdom, the United States, Uruguay, and Vietnam |
References
- Abdulla, S., & Ali, H. (2019). An analysis of exports and imports and their effect on the economic growth in Iraq. UKH Journal of Social Sciences, 3(2), 68–76. [Google Scholar] [CrossRef]
- Abiodun, T. (2021). Untold impacts of Nigeria’s land borders closure policy on border communities, economy, and security in west african sub-region. International Journal of Research in Education and Sustainable Development, 1, 10–30. [Google Scholar] [CrossRef]
- Aleprete, M. E., & Hoffman, A. M. (2012). The strategic development of border areas: Explaining variation in interaction opportunity across land borders. International Interactions, 38(1), 1–28. [Google Scholar] [CrossRef]
- Ali, M., & Memon, M. H. (2019). Economic diversification and human development in South Asia. Journal of Asian and African Studies, 54(5), 674–690. [Google Scholar] [CrossRef]
- Arteaga, J. C., Cardozo, M. L., & Diniz, M. J. T. (2020). Exports to China and economic growth in Latin America, unequal effects within the region. International Economics, 164, 1–17. [Google Scholar] [CrossRef]
- Aslan, A., & Topcu, E. (2018). The relationship between export and growth: Panel data evidence from Turkish sectors. Economies, 6(2), 22. [Google Scholar] [CrossRef]
- Babatunde, M. A., & Afolabi, J. A. (2023). Growth effect of trade misinvoicing in Sub-Saharan Africa: The role of governance. International Journal of Development Issues, 22(2), 241–254. [Google Scholar] [CrossRef]
- Bakari, S., & Mabrouki, M. (2017). The effect of agricultural exports on economic growth in South-Eastern Europe: An empirical investigation using panel data (MPRA Paper No. 83810). Munich Personal RePEc Archive (MPRA). [Google Scholar]
- Bressan, G. (2017). Power, mobility and the economic vulnerability of borderlands. Journal of Borderlands Studies, 32(3), 1–17. [Google Scholar] [CrossRef]
- Bunje, M. Y., Abendin, S., & Wang, Y. (2022). The effects of trade openness on economic growth in Africa. Open Journal of Business and Management, 10(02), 614–642. [Google Scholar] [CrossRef]
- Carmignani, F. (2015). The curse of being landlocked: Institutions rather than trade. World Economy, 38(10), 1594–1617. [Google Scholar] [CrossRef]
- CIA. (2024). The world factbook—Land boundaries. CIA. [Google Scholar]
- Colla-De-Robertis, E., & Garduno Rivera, R. (2021). The effect of a free trade agreement with the United States on member countries’ per capita GDP: A synthetic control analysis. Regional Science Policy and Practice, 13(4), 1129–1146. [Google Scholar] [CrossRef]
- Dahal, A. K., & Budhathoki, P. B. (2023). Effect of landlockedness on receiving tourism income in SAARC countries. The Journal of Knowledge and Innovation, 9(1), 1–10. [Google Scholar] [CrossRef]
- Elakkad, R. M., & Hussein, A. M. (2023). The impact of imports on economic growth in Egypt. Open Journal of Social Sciences, 11(9), 209–227. [Google Scholar] [CrossRef]
- Esu, G. E., & Udonwa, U. (2015). Economic diversification and economic growth: Evidence from Nigeria. Journal of Economic and Sustainable Development, 6(16), 56–68. [Google Scholar]
- Evans, C. L. (2003). The economic significance of national border effects. American Economic Review, 93(4), 1291–1312. [Google Scholar] [CrossRef]
- Feder, G. (1983). On exports and economic growth. Journal of Development Economics, 12(1–2), 59–73. [Google Scholar] [CrossRef]
- Frankel, J. A., & Romer, D. (1999). Does trade cause growth? The American Economic Review, 89(3), 379–399. [Google Scholar] [CrossRef]
- Gulzar, A., & Rafiq, S. (2019). Analyzing the role of trade openness in economic growth of Pakistan. JISR Management and Social Sciences & Economics, 17(2), 109–120. [Google Scholar] [CrossRef]
- Guo, P., Hamzah, H. Z., & Chin, L. (2024). Whether cross-border e-commerce exports promote regional economic growth? Evidence from China. Pakistan Journal of Commerce and Social Sciences, 18(3), 752–780. [Google Scholar]
- Gyawali, P. (2024). Estimating the landlocked penalty for international trade. World Economy, 47(6), 2220–2235. [Google Scholar] [CrossRef]
- Irshad, M. S., Xin, Q., Hui, Z., & Arshad, H. (2018). An empirical analysis of Pakistan’s bilateral trade and trade potential with China: A gravity model approach. Cogent Economics & Finance, 6(1), 1504409. [Google Scholar] [CrossRef]
- Islam, M. S., Alsaif, S. S., & Alshammari, A. F. (2022). Export-growth nexus in the Kingdom of Saudi Arabia: A nonlinear ARDL approach. Singapore Economic Review, 1–17. [Google Scholar] [CrossRef]
- Johnson, O. E. G. (2016). Regional economic integration in Africa and intra-regional trade. In Economic Diversification and Growth in Africa: Critical Policy Making Issues (pp. 55–83). Palgrave Macmillan. [Google Scholar]
- Kang, H. (2015). Agricultural exports and economic growth: Empirical evidence from the major rice exporting countries. Agricultural Economics (Czech Republic), 61(2), 81–87. [Google Scholar] [CrossRef]
- Khan, S., Azam, M., & Emirullah, C. (2016). Import demand income elasticity and growth rate in Pakistan: The impact of trade liberalization. Foreign Trade Review, 51(3), 201–212. [Google Scholar] [CrossRef]
- Khurelchuluun, B., Cao, L., & Yan, W. (2023). The impact of trade openness on economic growth in landlocked developing countries. International Journal of Science and Business, 28(1), 84–97. [Google Scholar] [CrossRef]
- Krainara, C., & Routray, J. K. (2015). Cross-border trades and commerce between Thailand and Neighboring countries: Policy implications for establishing special border economic zones. Journal of Borderlands Studies, 30(3), 345–363. [Google Scholar] [CrossRef]
- Kristjanpoller, R. W., & Olson, J. E. (2014). Economic growth in Latin American countries: Is it based on export-led or import-led growth? Emerging Markets Finance and Trade, 50, 6–20. [Google Scholar] [CrossRef]
- Kwasnicki, W. (2013). Logistic growth of the global economy and competitiveness of nations. Technological Forecasting and Social Change, 80(1), 50–76. [Google Scholar] [CrossRef]
- Lenka, S. K., & Sharma, R. (2017). Does financial inclusion spur economic growth in India? The Journal of Developing Areas, 51(3), 215–228. [Google Scholar] [CrossRef]
- Lin, J., Flachsbarth, I., & von Cramon-Taubadel, S. (2020). The role of institutional quality on the performance in the export of coconut products. Agricultural Economics (United Kingdom), 51(2), 237–258. [Google Scholar] [CrossRef]
- Ling, Y. Z. (2017, February 16–18). An analysis of the effect of border trade value on Myanmar economic growth. The 11th Asia-Pacific Conference on Global Business, Economics, Finance and Business Management, Bangkok, Thailand. [Google Scholar]
- Lotfi, B., & Karim, M. (2017). Export diversification and economic growth in Morocco: An econometric analysis. Applied Economics and Finance, 4(6), 27–35. [Google Scholar] [CrossRef]
- Maffini, N. D., & González, F. A. I. (2023). International borders, integration and economic development: Evidence from Argentina. Journal of Economic Integration, 38(4), 545–570. [Google Scholar] [CrossRef]
- Márquez-Ramos, L., Martínez-Zarzoso, I., & Suárez-Burguet, C. (2007). The role of distance in gravity regressions: Is there really a missing globalization puzzle? The B.E. Journal of Economic Analysis & Policy, 7(1). [Google Scholar] [CrossRef]
- Mbogela, C. S. (2019). An Empirical study on the determinants of trade openness in the African economies. Advances in Management & Applied Economics, 9, 9–42. [Google Scholar]
- Mirzaei, F., Mostafa Mostafavi, S., & Yazdani, S. (2012). Export comparative advantage analysis of Iranian Hen Egg by RCA & RSCA and RC criteria. Modern Economy, 3(5), 553–556. [Google Scholar] [CrossRef][Green Version]
- Munir, K., & Sultan, M. (2019). Export competitiveness with border-sharing countries: An assessment of Pakistan. Competitiveness Review, 29(2), 96–118. [Google Scholar] [CrossRef]
- Murindahabi, T., Li, Q., Nisingizwe, E., & Ekanayake, E. M. B. P. (2019). Do coffee exports have impact on long-term economic growth of countries? Agricultural Economics (Czech Republic), 65(8), 385–393. [Google Scholar] [CrossRef]
- Myagmarsuren, O., & Deng, M. (2015). The research on the current logistics situation and the dry port development of Mongolia. Mongolian Journal of International Affairs, 19, 56–66. [Google Scholar] [CrossRef][Green Version]
- Ngoma, G. (2020). What determines import demand in Zimbabwe? Evidence from a gravity model. Cogent Economics and Finance, 8(1), 1782129. [Google Scholar] [CrossRef]
- Nguyen, H. H. (2020). Impact of foreign direct investment and international trade on economic growth: Empirical Study in Vietnam. Journal of Asian Finance, Economics and Business, 7(3), 323–331. [Google Scholar] [CrossRef]
- Nitsch, V. (2000). National borders and international trade: Evidence from the European Union. Canadian Journal of Economics, 33(4), 1091–1105. [Google Scholar] [CrossRef]
- Nzeh, I. C., Uzoechina, B. I., Imoagwu, C. P., & Okoli, U. V. (2022). Examining the roles of institutional quality and financial openness in enhancing economic performance: Evidence from BRICS countries. Journal of Advanced Research in Economics and Administrative Sciences, 3(2), 50–63. [Google Scholar] [CrossRef]
- Okabe, M. (2025). Economic development of land-border regions under ASEAN economic integration. Journal of Asian Economics, 96, 101864. [Google Scholar] [CrossRef]
- Okrasa, W. (2023). The impact of the Polish-Ukrainian borderland on the local community well-being. Statistics of Ukraine, 100(1), 111–126. [Google Scholar] [CrossRef]
- Omodunbi, O. O., Olawole, O. S., & Mohammed, J. B. (2022). The politics of border closure and its implications on the Nigerian Economy. RUDN Journal of Public Administration, 9(2), 200–210. [Google Scholar] [CrossRef]
- Paudel, R. C. (2019). Trade-growth nexus in landlocked developing countries: A quantile regression framework. Economic Journal of Nepal, 42(1–2), 1–16. [Google Scholar] [CrossRef]
- Purnama, P. D., & Yao, M. H. (2019). The relationship between international trade and economic growth. International Journal of Applied Business Research, 1(2), 112–123. [Google Scholar] [CrossRef][Green Version]
- Raballand, G. (2003). Determinants of the Negative impact of being landlocked on trade: An empirical investigation through the central Asian case. Comparative Economic Studies, 45(4), 520–536. [Google Scholar] [CrossRef]
- Raghutla, C. (2020). The effect of trade openness on economic growth: Some empirical evidence from emerging market economies. Journal of Public Affairs, 20(3), e2081. [Google Scholar] [CrossRef]
- Rahim, D. A., Priyarsono, D. S., Rustiadi, E., & Syaukat, Y. (2021). Analysis of development index of land border area through composite index construction. MIMBAR: Jurnal Sosial Dan Pembangunan, 37(2), 390–401. [Google Scholar] [CrossRef]
- Rehman, S. U., Taqi, M., ur Rahman, S., & Ahmad, W. (2021). Impact of trade deficit on economic growth: A case of some selected countries. International Research Journal of Management and Social Sciences, 2(2), 40–52. [Google Scholar] [CrossRef]
- Rivero, R. A. B., Ramirez, M. A. N., & Mendivil, Y. C. (2020). Landlocked countries, institutions and economic dynamics. Asian Economic and Financial Review, 10(2), 160–188. [Google Scholar] [CrossRef][Green Version]
- Sakhare, R. S., Desai, J., Saldivar-Carranza, E. D., & Bullock, D. M. (2024). Methodology for monitoring border crossing delays with connected vehicle data: United States and Mexico land crossings case study. Future Transportation, 4(1), 107–129. [Google Scholar] [CrossRef]
- Sarjono, F., & Rudiatin, E. (2022). Informal cross-border trade: Malaysia-Indonesia borders the conceptualisation from ‘authority-defined’ to “everyday-defined”. BASKARA: Journal of Business and Entrepreneurship, 5(1), 108–122. [Google Scholar] [CrossRef]
- Seok, J. H., & Moon, H. (2021). Agricultural exports and agricultural economic growth in developed countries: Evidence from OECD countries. Journal of International Trade and Economic Development, 30(7), 1004–1019. [Google Scholar] [CrossRef]
- Sénquiz-DÍaz, C. (2021). The effect of transport and logistics on trade facilitation and trade: A PLS-SEM approach. Economics—Innovative and Economics Research Journal, 9(2), 11–24. [Google Scholar] [CrossRef]
- Sharapiyeva, M. D., Antoni, A., & Yessenzhigitova, R. (2019). The impact of port transport-logistics infrastructure and lpi for economic growth: On the example of landlocked countries. Pomorstvo, 33(1), 63–75. [Google Scholar] [CrossRef]
- Singh, T. (2010). Does international trade cause economic growth? A survey. The World Economy, 33(11), 1517–1564. [Google Scholar] [CrossRef]
- Siregar, A. P., & Widjanarko, N. P. A. (2022). The impact of trade openness on economic growth: Evidence from agricultural countries. Journal of Asian Finance, Economics and Business, 9(3), 23–31. [Google Scholar]
- Subasat, T., & Bellos, S. (2013). Governance and foreign direct investment in Latin America: A panel gravity model approach. Latin American Journal of Economics, 50(1), 107–131. [Google Scholar] [CrossRef]
- Sunde, T., Tafirenyika, B., & Adeyanju, A. (2023). Testing the impact of exports, imports, and trade openness on economic growth in Namibia: Assessment using the ARDL cointegration method. Economies, 11(3), 86. [Google Scholar] [CrossRef]
- Suroso, A. I. (2022). The effect of logistics performance index indicators on palm oil and palm-based products export: The case of Indonesia and Malaysia. Economies, 10(10), 261. [Google Scholar] [CrossRef]
- Tandra, H., & Suroso, A. I. (2023). The determinant, efficiency, and potential of Indonesian palm oil downstream export to the global market The determinant, efficiency, and potential of Indonesian palm oil downstream export to the global market. Cogent Economics & Finance, 11(1), 2189671. [Google Scholar] [CrossRef]
- Triyawan, A., Cahyo, E. N., & Djayusman, R. R. (2023). The role of inflation, exchange, exports and imports on economic growth of Qatar. Wacana Equiliberium (Jurnal Pemikiran Penelitian Ekonomi), 11(2), 142–147. [Google Scholar] [CrossRef]
- Ugli, O. N. N. (2020). The role of export diversification in providing sustainable economic growth. The American Journal of Social Science and Education Innovations, 2(10), 372–380. [Google Scholar] [CrossRef]
- UN Comtrade. (2025). UN Comtrade database. Available online: https://comtradeplus.un.org/ (accessed on 10 March 2025).
- Usman, K., & Bashir, U. (2022). The effects of imports and economic growth in Chinese economy: A granger causality approach under VAR framework. Journal of Risk and Financial Management, 15(11), 531. [Google Scholar] [CrossRef]
- Vohra, R. (2001). Export and economic growth: Further time series evidence from less-developed countries. International Advances in Economic Research, 7(3), 345–350. [Google Scholar] [CrossRef]
- Yıldırım, A. (2017). From gun barrel to passport: Smuggling on the Turkish-Syrian border. Sociology and Anthropology, 5(11), 941–953. [Google Scholar] [CrossRef]
- Yushi, J., & Borojo, D. G. (2019). The impacts of institutional quality and infrastructure on overall and intra-Africa trade. Economics, 13, 1–34. [Google Scholar] [CrossRef]
- Zahid-ul-Islam-Dar, Kaur, S., & Chattu, V. K. (2023). Barriers to Indo-Pak trade: A case study of land routes. Millennial Asia, 16(1), 78–101. [Google Scholar] [CrossRef]
- Zhang, X., Zuo, X., & Chen, X. (2023). Open doors: The impact of border reforming and opening policies on the regional border economies of China. International Studies of Economics, 18(4), 527–546. [Google Scholar] [CrossRef]
- Zhao, X., & Xiao, F. (2022). Border effect and proximity effect of bilateral trade between China and its land neighbors—Simulation Based on GTAP Mode. Modern Economics & Management Forum, 3(3), 162. [Google Scholar] [CrossRef]
Disclaimer/Publisher’s Note: The statements, opinions and data contained in all publications are solely those of the individual author(s) and contributor(s) and not of MDPI and/or the editor(s). MDPI and/or the editor(s) disclaim responsibility for any injury to people or property resulting from any ideas, methods, instructions or products referred to in the content. |
© 2025 by the authors. Licensee MDPI, Basel, Switzerland. This article is an open access article distributed under the terms and conditions of the Creative Commons Attribution (CC BY) license (https://creativecommons.org/licenses/by/4.0/).