Abstract
Poverty is a global problem associated with deprivation; it is marked by the lack of access to the minimum social needs for people’s integration and well-being. This work aims to measure the relationships between multidimensional poverty and unidimensional poverty in Brazil from 2016 to 2022. The research methodology used microdata from the Continuous National Household Sample Survey of the IBGE, multidimensional and unidimensional poverty measures, and multinomial logit regression. The results show a reduction in poverty in its different approaches. However, in 2022, 2.5% of the Brazilian population still lived in chronic poverty, 0.8% in structural poverty, and 25.7% in situational poverty, while the rest enjoyed their basic freedoms. Women, children and young people, non-whites, those with less education, and those living in the North and Northeast regions are more vulnerable. Based on the research results, it is recommended to enhance public policies to housing, education, employment inclusion, and food stability.
JEL:
D63; I32; I28; H51
1. Introduction
In 2022, it was estimated that 1.1 million people worldwide were experiencing multidimensional poverty, which includes indicators related to health, education, and standard of living. Out of the total number, around 50% were in sub-Saharan Africa, 33 million were in Latin America and the Caribbean, and 7.9 million were in Brazil (UNDP & OPHI, 2023). Considering a poverty line of USD 3.65, from the World Bank for low- and middle-income countries, there were 26.7 million people in a situation of monetary poverty in Brazil. However, when the poverty line of BRL 606,00 is considered, this totals 63.4 million people, which corresponds to around 30% of the Brazilian population in 2022 (IBGE, 2023).
Hence, poverty has consequences for people across the globe. This problem is concerning, and addressing it fully is the primary objective of the first Sustainable Development Goal outlined in the 2030 Agenda, which was established during the 2015 United Nations Sustainable Development Summit held at the headquarters in New York (ONU, 2015). Essentially, poverty means the absence of basic personal freedoms. Seeing it in this light, the growth of a nation would revolve around the advancement of these freedoms, the absence of which constrains opportunities, choices, and accomplishments. Access to essential amenities for well-being has beneficial effects on both individuals and society (Sen & Anand, 1997; Sen, 2000).
Previous studies in this area have aimed to quantify poverty using both unidimensional (Chen & Ravallion, 2013) and multidimensional approaches (Alkire & Foster, 2009; Alkire et al., 2017; Alkire & Fang, 2019; Bárcena-Martín et al., 2020), yet there is a lack of research delving into the interplay between these two approaches. In this method, the population is divided into distinct categories of deprivation, aiding in the detection of social vulnerabilities (Alkire & Santos, 2010; Alkire et al., 2015; Valente, 2023). Considering these studies for some countries, this research aims to add to this subject by providing new data for Brazil. The interaction between these two approaches creates four population categories.
This study seeks to assess both multidimensional and unidimensional poverty and explore their interconnections in Brazil between 2016 and 2022. Information from the IBGE’s Continuous National Household Sample Survey, measures of multidimensional and unidimensional poverty, and multinomial logit regression are used to identify the main determinants of poverty, considering both personal and spatial characteristics. Furthermore, in addition to per capita household income, which measures monetary poverty, eleven other indicators related to education, health, basic services, and housing conditions are used to calculate multidimensional poverty.
Thus, we seek to carry out an empirical analysis, identifying the population’s situation as chronic poverty, structural poverty, situational poverty, or nor-poverty, which contributes to a better targeting of public policies, as well as their monitoring and evaluation.
Besides unidimensional measures, multidimensional poverty analysis improves the understanding of the well-being status of a population, identifies the recipients of public policies and services, and aids in tracking and assessing the effectiveness of public policies and programs. Moreover, researchers and public managers are interested in the theoretical insights of Amartya Sen and the wealth of information from a multidimensional viewpoint (Alkire & Foster, 2009). Public social policies need to focus not only on taking people out of poverty but also on preventing them from falling back into it (A. M. R. Silva et al., 2011).
This work is organized into five sections and this introduction. The upcoming section explores theoretical and empirical factors related to poverty. Section 3 it discusses the research methodology related to the database and techniques employed. It proceeds by discussing the measures and trends of multidimensional and unidimensional poverty in Brazil. Additionally, this section covers the connections between multidimensional and unidimensional poverty, presenting regression estimates that aim to describe the population experiencing deprivation. Section 5 discusses the main findings of the study, considering the literature on the subject. Section 6 presents the key findings of the study.
2. Theoretical and Empirical Aspects
Classical economic literature defines poverty based on unfulfilled survival requirements like food and shelter, as determined by income levels. Townsend (1993) proposed that poverty could be objectively defined by examining the relative deprivation experienced by individuals, families, or groups within a population. Poverty can be defined as not having enough resources to buy food and maintain a standard of living that is considered normal, which results in significant exclusion from community activities and traditions. The method of tackling poverty outlined here stems from utilitarian economic principles, which prioritize income or consumption as the most reliable measures of individual welfare.
Defining basic necessities and determining the acceptable threshold are essential steps in operationalizing this comprehensive concept of poverty. As a result, poverty can be quantified either absolutely or relatively. Salama and Destremau (1999) point out that absolute poverty refers to having enough income to sustain an individual or family, whereas relative poverty places them within the societal context. In this method, poverty is defined as the lack of income and is referred to as the monetary or unidimensional viewpoint. Rocha (2006) argues that in contemporary economies, where people satisfy their basic needs through commercial transactions, it is common for the assessment of these needs to be carried out indirectly by looking at income levels. Chen and Ravallion (2013) stated that the poverty line is influenced by the consumption and income levels of a society, which are determined by the overall well-being and social norms.
Sen (2000) argues that wealth’s value is in what it can accomplish and acquire, whereas Bourguignon and Chakravarty (2003) view poverty as a multidimensional phenomenon with income serving as a mere indicator. Towards the end of the 20th century, there was a shift in focus within research on poverty, looking at the fulfillment of basic needs or adopting a multidimensional viewpoint. According to Salama and Destremau (1999), the perspective of Unsatisfied Basic Needs (UBNs) encompasses two key elements: the first one is tied to biological requirements, whereas the second is associated with the availability of public resources and services. Rocha (2006) also views basic needs, such as food, education, sanitation, and housing, from this standpoint.
Following Amartya Sen’s ideas, a second multidimensional viewpoint known as capabilities arises, which, rooted in principles of social justice, integrates freedom of choice regarding the opportunities available to each person. From this standpoint, the notions of functioning and capabilities are integrated. Individuals value certain functioning for their well-being, whereas capabilities refer to the functioning that individuals can actually achieve. Hence, empowerment denotes a kind of independence, enabling individuals to engage in different sets of functioning (Sen, 1993; Sen, 2000).
Hence, unidimensional or monetary indicators of poverty are considered indirect measures of poverty, whereas multidimensional indicators are considered direct measures. Therefore, poverty could stem from factors beyond income, which is reflective of the opportunities acquired over a person´s lifespan. Other elements come into play, like the investments made in health and education, which are crucial for economic success. In the beyond-income perspective, poverty is defined as the attainment of valued goals or outcomes by individuals, which are accomplished using income or a set of goods.
Furthermore, certain authors suggest assessing the connections between multidimensional and unidimensional methods. (Alkire & Santos, 2010; Alkire et al., 2015; Alkire & Fang, 2019; Valente, 2023). The interaction between these two approaches creates four population categories, which are detailed in Table 1. The first one is when individuals are affected by both monetary poverty and multidimensional poverty, called chronic poverty. In this scenario, people lack enough income and are denied access to necessities. Therefore, this group consists of the most susceptible individuals in the population. Another type of poverty, known as structural poverty, is observed when a population faces multidimensional deprivation rather than just monetary hardships. This group comprises individuals who earn enough to meet their basic needs yet lack access to minimum living conditions.

Table 1.
Multidimensional and unidimensional poverty dynamics.
In contrast, individuals may face situational poverty if they lack income but can still access basic goods and services. Therefore, even though the basic needs are being fulfilled, the income of this group falls below the threshold for monetary poverty, resulting in a state of recent poverty. In conclusion, there is a group within the population that does not fall into either monetary poverty or multidimensional poverty, referred to as the non-poor. This group of individuals is socially integrated because it has its basic needs fulfilled and enough income to maintain a decent quality of life.
International studies have deepened the discourse on multidimensional poverty by examining its relationships in a more holistic manner, departing from the narrow, unidimensional viewpoint. Regarding monetary poverty, the work of Chen and Ravallion (2013) stands out when they analyzed information for 125 countries, from 1981 to 2008. They confirmed a decrease in poverty and found that economic growth has occurred alongside the decrease in absolute poverty, while relative measures are more influenced by inequality than by economic growth. Scholars have investigated how poverty is measured using a multidimensional approach, both across different countries (Alkire & Santos, 2010; Bárcena-Martín et al., 2020) and within individual countries (Alkire & Foster, 2009; Alkire et al., 2017; Alkire & Fang, 2019).
Various studies in the empirical literature for Brazil have utilized the multidimensional perspective. Bourguignon and Charkravarty (2003) observed a decrease in educational deprivation but a rise in income deprivation among the rural population in Brazil during the 1980s. Over the following few decades, data from the National Household Sample Survey also shows a decrease in multidimensional poverty in the country (Hoffmann & Kageyama, 2006; Barros et al., 2006; Fahel et al., 2016; Marcelino & Cunha, 2024). In turn, Neves and Silva (2023) showed a reduction in multidimensional poverty from 2004 to 2008, but an increase from 2016 to 2019. The authors attribute this performance to the greater economic growth in the initial period and the allocation of funds to social programs. During the second period, the economy experienced a decrease in dynamism, a rise in unemployment, and a decline in social well-being.
By examining data from the 1991, 2000, and 2010 Demographic Censuses, Brambilla and Cunha (2021) and Brites et al. (2022) demonstrated a decline in poverty within the country’s municipalities. Additionally, Rosa et al. (2023) researched the North region and noted a trend of poverty becoming more concentrated in metropolitan areas from 1991 to 2010, followed by a reversal in the following decade.
Studies have examined different regions of the country, such as the North and Northeast (A. F. Silva et al., 2017; J. J. Silva et al., 2020), and specific studies have focused on individual states (Albuquerque & Cunha, 2012; Fahel & Teles, 2018; Vieira et al., 2017). Pereira et al. (2020) examined poverty in Brazilian youths, while Belkiss et al. (2021) focused on the COVID-19 pandemic period. Reviewing both theoretical and empirical literature on poverty emphasizes its intricate nature and the necessity of addressing it to foster a more equitable society and sustainable development. Overall, there are signs of advancement, which are notable on a global scale as well as in Brazil.
Finally, there is still scarce evidence on the relationships between unidimensional and multidimensional poverty, following the approach of Alkire and Foster. In this sense, for China, in 2008, the evidence points to 1.82% of the population in situational poverty, 11.6% in structural poverty, 0.87% in chronic poverty, and 85.71% in non-poverty (Alkire & Santos, 2010).
In this empirical literature, there are studies that follow the approach of Bourguignon and Charkravarty (2003), which include income as an additional indicator in the elaboration of a multidimensional poverty index (Hoffmann & Kageyama, 2006; Barros et al., 2006; Albuquerque & Cunha, 2012; Bárcena-Martín et al., 2020; Brambilla & Cunha, 2021; Brites et al., 2022; Rosa et al., 2023; Neves & Silva, 2023). On the other hand, there are studies that follow the approach of Alkire and Foster (2009) and Alkire et al. (2015), which analyze unidimensional and multidimensional poverty separately (Fahel et al., 2016; Vieira et al., 2017; Fahel & Teles, 2018; Pereira et al., 2020; Belkiss et al., 2021; Marcelino & Cunha, 2024). As in the present study, in general, the studies that follow the latter approach use three dimensions, with social well-being indicators related to education, health, public services, and housing conditions.
3. Methodology
3.1. Data and Measurement of Multidimensional and Unidimensional Poverty
This work uses information from the Continuous National Household Sample Survey (PNADC) of the Brazilian Institute of Geography and Statistics (IBGE), from 2016 to 2022. It considers households with accessible per capita income, adjusting their values with the National Consumer Price Index (INPC) for the last quarter of 2022. Moreover, in order to keep the comparison consistent across PNADC years and standardize the databases, observations were included that contained all the relevant information for the study.
The Alkire and Foster method was utilized to assess multidimensional poverty, taking into account indicators, dimensions, weighting procedures, and aggregation techniques (Alkire & Foster, 2009; Alkire et al., 2015). Thus, suppose there are n individuals and d dimensions. Considering a given indicator, its achievement for individual i in dimension j is represented by xij. To avoid being classified as deprived, an individual must achieve at least the minimum performance specified by zj. Therefore, if xij is smaller than zj, individual i is private in dimension j and has a equal to 1; otherwise equals zero.
In order to create a poverty index, it is necessary to give a weight to each indicator to show its relative importance, denoted as wj, where the total sum from j = 1, …, to d must be equal to 1. The deprivation level of individual i is determined by summing up , which falls between zero (indicating no deprivation) and one (signifying deprivation in all dimensions). A deprivation score or poverty threshold needs to be established, indicating the value (k) at which an individual is classified as poor (ci ≥ k). In this study, a score of 1/3 or higher, in line with existing research, was used to classify someone as experiencing multidimensional poverty.
The multidimensional poverty index (M0) is calculated by multiplying the percentage of individuals living in poverty (H) by the degree of poverty (A). The percentage of individuals in poverty is determined by dividing the number of identified deprived individuals by the total number of individuals, based on the chosen score for k. Additionally, the severity of poverty is calculated specifically for individuals living in poverty and indicates the proportion of hardships that they experience, denoted as . Thus, the multidimensional poverty index is the product: M0 = H × A, where M0, H and A can vary from 0 to 1.
In this study, three dimensions are examined, each carrying an equal weight of 1/3, as suggested by previous research. Eleven dimensions of poverty are analyzed, assigning a value of one in cases of deprivation and zero in cases of non-deprivation. Hence, Table 2 displays the indicators, dimensions, and weights utilized.
Table 2.
Dimensions, indicators, description, and weight for multidimensional poverty.
Three indicators of deprivation are taken into account for the education dimension. Deprivation in terms of school attendance refers to the presence of at least one school-aged child (between six and seventeen years old) in the household who is not enrolled in school. Regarding academic delay, not completing secondary education was viewed as a deprivation for at least one individual aged between nineteen and twenty-four. Households were classified as educationally deprived if they did not have any adult aged twenty-five or older with a complete primary education.
Four indicators are present in the dimension of health and basic services. Water deprivation happens when a household does not have access to running water from a general distribution network, well, or spring in at least one room. When garbage is not collected by a cleaning service, it indicates a deficiency in these services. Households that do not have main electricity, generators, or solar lighting are in a precarious position. In this context, the lack of proper sewage systems linked to either a network or a river denotes deprivation.
In the dimension of housing conditions, there are a total of four indicators. Having three or more residents per bedroom is a form of deprivation, just like having insufficient ceiling material in the house. Using cooking fuel other than electricity or gas suggests a lack of resources, as well as not having two or more durable goods.
Thus, the indicators seek to capture deprivation in households and the absence of social well-being. However, despite being widely used as a measure of access to goods and services, they measure their presence or absence, but not their quality, which may represent a limitation in measuring poverty.
Furthermore, the proportion of poor individuals is utilized as a metric for unidimensional poverty, with two poverty thresholds determined by the minimum wage (SM) of 2022 and the per capita household income. In order to identify extreme poverty, the poverty line was set at BRL 303.00, equivalent to a quarter of the minimum wage (SM), whereas to assess poverty, it was set at BRL 606.00, corresponding to half of the minimum wage (SM).
3.2. Multinomial Logit Regression
Our goal was to define the characteristics of individuals in different segments by conducting regressions with the multinomial logit model. The dependent variable was a discrete polychotomous variable with multiple values. The multiple choices logit model is a generalization of binary models. The unordered nominal dependent variable is modeled by the multinomial logit.
The general structure of this model, as described by Greene (2018), is as follows:
where i denotes the individual, j denotes the state, and wi represents a vector with the control variables for individual i and denotes the probability of individual i being in state j. In this study, each estimated model has a value of three for J, with a total of four categories. As such, every conceivable link between multidimensional and unidimensional poverty was investigated, encompassing chronic, situational, and structural poverty, with the individual placed in a non-poor situation. According to Greene (2018), since the probabilities total one, estimating J vectors is sufficient to determine the J + 1 probabilities.
Estimates are presented in the form of odds ratios, calculated as pij/pi0, to illustrate the likelihood of being in state j compared to the reference state j = 0. According to Cameron and Trivedi (2005), the natural logarithm of the odds ratio, ln[pij/pi0], is linear with the regressors, and the model takes the form of relative risk. Therefore, if the coefficient estimates for all control variables are above one, the probability of being in state i is higher than in the reference state. Chances are reduced compared to the reference state when the value is less than one.
Concerning the control variables, a binary variable was incorporated to differentiate between sex, assigning a value of one for women. Another variable was introduced to distinguish race or skin color, assigning a value of one for non-white individuals, that is, black, brown, and indigenous people. To differentiate the age of the population, seven binary variables were included for age groups from 0 to 5 years, from 6 to 10 years, from 11 to 14 years, from 15 to 17 years, from 18 to 24 years, from 25 to 29 years, and from 30 to 59 years. Six binary variables based on different education levels to analyze the impact of education were used: those with no education or less than 1 year of study, incomplete elementary school, complete elementary school, incomplete secondary education, complete secondary education, and incomplete higher education.
Three binary variables were included to differentiate between nuclear, extended, and compound household units in which the individual lives. A binary variable with a value of one to distinguish rural households from urban ones was used. A binary variable was used to separate individuals living in metropolitan areas from those living in non-metropolitan areas, with a value of one indicating residence in metropolitan areas. To account for the country’s regional variations, four binary variables were incorporated, representing the North, Northeast, South, and Central-West regions.
Thus, for the binary variables included, men, white people, individuals aged 60 or over, people with a higher education degree or more, and residents of single-person households in urban, metropolitan areas, and the Southeast region were considered as reference categories.
4. Results
4.1. Multidimensional and Unidimensional Poverty Measures from 2015 to 2022
At first, the multidimensional poverty index was obtained by gathering indicators related to education, health, basic sanitation, and housing conditions, as outlined in Table 3. In 2016, the adult population in households experiencing multidimensional poverty had the highest level of deprivation in terms of years of study, that is, the absence of at least one adult with complete primary education in the household, which was equal to 91.6%. In terms of education, the second most severe deprivation for young individuals is the delay in completing secondary education, which stands at 62.2%. This is followed by school attendance in basic education, with deprivation of 21.2%, which considers both primary and secondary education. In 2022, high levels of educational deprivation persisted among those in multidimensional poverty, reaching 15.6% in school attendance, 54.9% in academic delay among young people, and 86% in years of study in the adult population.
Table 3.
Deprivation in households in situations of multidimensional poverty, 2016–2022.
People living in multidimensional poverty experience significant deficiencies in health and basic sanitation. Among the indicators analyzed, sewage represented 85.5% in 2016. It became even more intense in 2022, when it reached 88.85%. The reason for this outcome is the building of houses in regions lacking proper infrastructure. The indicator for waste disposal ranked second in terms of deprivation in this dimension. It rose over the period, reaching 72% in 2022. About 4% of the population surveyed did not have access to electricity, which was one of the indicators with the highest level of availability.
In terms of housing conditions, the indicator that shows the highest level of deprivation is household density, which refers to households with three or more residents sharing the same room, standing at approximately 50% in 2022. This indicator saw a decrease of 2% during the period. The percentage of inappropriate ceiling material rose to 16% during this period. In 2022, 19% of the population in multidimensional poverty used inappropriate cooking fuel. In the period studied, the ownership of goods showed the lowest level of deprivation, at approximately 4%.
Consequently, individuals living in poverty exhibited considerable shortcomings across various indicators, as illustrated in Table 3. The country still faces significant challenges in the dimensions studied. When it comes to education, Federal Law 12,796 of 2013 set out new directives and foundations for the national education system, such as increasing the age for free and compulsory basic education from 4 to 17 years of age (Brasil, 2013). The 2014 National Education Plan (PNE) laid out principles, objectives, and tactics for education in the country from 2014 to 2024 (Brasil, 2014). Therefore, the PNE aimed to have at least 50% of children under 3 years old enrolled in daycare centers by 2024, as well as provide universal access to preschool for 4- and 5-year-olds by 2016. By 2024, the aim was for at least 95% of students aged 6 to 14 to finish primary education at the appropriate age. By 2016, the aim was to ensure that all individuals aged 15 to 17 would have access to secondary education, and by 2024, the goal was to raise the net enrollment rate to 85%.
Data from the 2022 IBGE Demographic Census reveal that approximately 24.3% of the Brazilian population still lacked proper sanitation (IBGE, 2024). In 2020, the Federal Government enacted law no. 14,026/2020 to regulate the sanitation sector in the country. The National Congress approved the New Sanitation Legal Framework in 2022, aiming to guarantee that 99% of the population would have access to drinking water and 90% will have sewage collection and treatment by 2033 (Brasil, 2020). When it comes to housing conditions, the most significant change is the growing number of households lacking cooking fuel, which affects almost 20% of Brazilian homes in 2022, possibly due to the increase in cooking gas costs.
Hence, the indicators reveal that there are significant challenges remaining for public education, basic sanitation, and economic policies in Brazil, particularly for those experiencing multidimensional poverty.
These indicators allowed us to assess the proportional influence of each dimension on the multidimensional poverty index, as depicted in Figure 1. Over the period studied, education was the most influential factor in the multidimensional poverty index, making up 47% in 2016 and 2017, then decreasing to 42% in 2022. In the first two years, the health and basic sanitation aspect stood at 38%, but by 2022, it had risen to 40%. At the same time, housing conditions rose from 14% to 18% during this period.
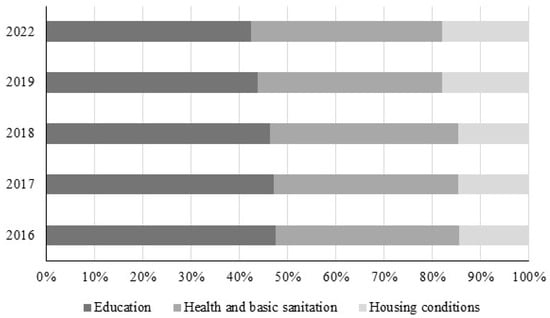
Figure 1.
Composition of multidimensional poverty, Brazil, 2016–2022. Source: Research information, obtained based on PNADC/IBGE.
After analyzing the indicators and dimensions examined, the multidimensional poverty index, M0, was calculated. It is the result of multiplying poverty prevalence (H) by its severity (A), showcasing a decline particularly between 2019 and 2022, as outlined in Table 4. The decrease in occurrence was a result of the higher intensity, indicating that individuals remaining in multidimensional poverty are facing more severe deprivation. Furthermore, two indicators of unidimensional poverty are included, based on the poverty line of BRL 606.00 (P) and BRL 303.00 for extreme poverty (EP). Between 2016 and 2022, there was a decrease of approximately 2% for both poverty lines. The decrease from 2016 to 2022 was also about 2% for both poverty lines.
Table 4.
Multidimensional and monetary poverty, Brazil, 2016–2022.
Multidimensional poverty was 2.03% in 2016 and reached 1.84% in 2019 and 1.34% in 2022, which corresponds to an estimated population of 4146 thousand, 3861 thousand and 2863 thousand, respectively. Consequently, there were close to 3 million individuals in 2022 who did not have access to fundamental resources for their well-being.
These findings align with previous research on the topic. For the year 2003, Alkire and Santos (2010) had estimated a multidimensional poverty index for Brazil of 3.9%. UNDP & OPHI (2019) estimated a rate of 1.6% for 2015, with an incidence of 3.8% and intensity of 42.5%. Monetary poverty affected a larger proportion of the population, with extreme poverty at 12.6% in 2016, decreasing to 12.4% in 2019 and 10.8% in 2022. In these years, it corresponded to 30.6%, 28.2%, and 28.1%, respectively. Hence, the estimated population living in extreme poverty in 2022 was 23,080 thousand, while 60,220 thousand were living in poverty.
From 2019 to 2022, extreme poverty decreased more significantly than poverty, partly due to the influence of the Bolsa Família program (PBF), known as Auxílio Brasil during that period. According to information from the Secretariat for Evaluation, Information Management and Single Registry, SAGICAD (2024), from the Ministry of Development and Social Assistance, Family and Fight Against Hunger, in December 2022, 21,905,353 families benefited from the program, which had an average value of BRL 606.91. In November 2021, there were 14,506,301 families receiving an average amount of BRL 224.41. Not only did the number of families grow, but the benefit’s value also rose. This value plays a role in enabling families to move out of extreme poverty, although it may not be sufficient for families to move out of poverty entirely. Souza et al. (2019) found similar results, showing that the PBF had a significant impact on poverty reduction, particularly extreme poverty, due to its high coverage and targeting of the poorest individuals. Additionally, Hoffmann and Jesus (2023) as well as Neri (2022) noted that monetary poverty in 2021 peaked at its highest level since 2012. However, in 2022, the proportion of poor people returned to 2019 levels, according to Hoffmann and Jesus (2023). Hence, variations in income transfers play a role in clarifying the decrease in monetary poverty observed from 2021 to 2022, leading back to the level of 2019. Poverty levels in 2019 and 2022 are shown to be similar by the results of this study.
4.2. Relationship Between Multidimensional and Monetary Poverty
The relationships between multidimensional and monetary poverty can be seen in Table 5. Chronic poverty (CRN)—which occurs when the population is in a situation of multidimensional and monetary poverty—reached 3.9% in 2016 and fell to 2.5% in 2022. Structural poverty (EST)—where the population faces multidimensional rather than unidimensional poverty—affected roughly 1% of the population in 2016 and decreased to 0.8% in 2022. In the timeframe analyzed, roughly 25% of the population faced situational poverty (CNJ), defined by exclusive financial insufficiency, with a decrease of approximately 1%. During the period of 2016 to 2019, the number of people in this category decreased, reaching a minimum, and then increasing again in 2022, after the COVID-19 pandemic. On the other hand, chronic and structural poverty were lower in 2022.
Table 5.
Population composition between unidimensional and multidimensional poverty, Brazil, 2016–2022.
The population without basic deprivations, the socially integrated population (SCI), increased from 68% to 71%, from 2016 to 2022. The non-poor population saw a more pronounced growth from 2016 to 2017 compared to the increase from 2019 to 2022, with an approximate 1% rise in each period.
The structure of the connections between multidimensional and unidimensional poverty raises an important question: who and where are the individuals in each segment of poverty? To address this issue, multinomial logit models for the years 2016, 2019, and 2022, with non-poor individuals as the reference category, were estimated. The estimates are in Table 6.
Table 6.
Estimates from the multinomial logit regression model, Brazil, 2016–2022.
Based on the data provided, there is a noticeable difference in the likelihood of experiencing chronic poverty between men and women in the years 2016 and 2019. This disparity shows a positive trend, revealing that women are roughly 15% more likely to face chronic poverty than men. In the period studied, non-white individuals are more than 100% as likely to experience poverty compared to white people based on their skin color or race. The findings concern age, as young individuals aged 18 to 24 have a significantly higher likelihood of experiencing chronic poverty, followed by children under 5 years old and teenagers aged 15 to 17 years, compared to the reference group. Overall, the variations remain consistent in the calculations for the three years, with a rise observed in 2019. Therefore, it seems that individuals aged 60 and above are less likely to experience poverty.
As anticipated, individuals with lower educational attainment are more prone to poverty because they have fewer opportunities in the job market. Additionally, this feature deteriorated in 2019 and 2022, as the probability of enduring poverty exceeds one, even among individuals with incomplete and complete secondary education. In 2016, individuals who are single or live alone faced a higher risk of poverty compared to those in extended, compound, and nuclear families. Composite arrangements showed more significant differences in 2022.
Poverty is more likely in rural areas compared to metropolitan areas. When looking at extensive areas, the North region shows the highest level of deprivation, with the Northeast and Central-West regions following closely behind, followed by the Southeast. The South region has a lower likelihood of chronic poverty compared to the Southeast, as shown in the three estimates provided for chronic poverty. In 2022, the Central-West region’s coefficient estimates were not significant, suggesting that the likelihood of chronic poverty is comparable to that of the Southeast region, which is the reference group.
Based on these estimates, sex does not show a statistically significant difference in cases of structural poverty, while skin color or race does, especially for non-white individuals. Young people aged 18 to 24, along with children aged 0 to 5 and teenagers aged 15 to 17, are the most susceptible to chronic poverty when considering age. People with higher levels of education are less likely to experience structural poverty, with values below one for those who have completed secondary education, have some college education, and have completed college education. When individuals are employed, the likelihood of experiencing structural poverty decreases, as expected.
Individuals living in extended and compound family setups in 2016 faced higher risks of structural poverty than in single-person arrangements. In 2022, there was no statistical significance in being in compound household arrangements, while individuals in nuclear and extended arrangements had lower poverty rates compared to those in single-person arrangements. In terms of regional variances, residing in rural areas heightens the risk of experiencing structural poverty, while living in urban areas diminishes the risk. When compared to the Southeast, all other regions are more likely to experience structural poverty, with the North having the highest difference, followed by the Northeast, Central-West, and South in descending order.
Women showed a lower likelihood of experiencing situational poverty in both 2016 and 2022. In 2019, these differences were not statistically significant. Minorities face a higher risk of temporary poverty, just like they do with chronic and structural poverty. Children between 0 and 5 years old experience the highest rates of temporary poverty, with young adults aged 18 to 24 following closely behind. The influence of education on the probability of situational poverty was evident in all levels except for level 6 in both 2016 and 2019. In 2022, individuals with a higher education degree or more (reference category) had a lower probability of experiencing poverty compared to all other educational levels. The likelihood of situational poverty is higher in the three household arrangements than in single-person households.
Similar to other poverty sectors, living in rural locations enhances the probability of facing transitional poverty, albeit to a lesser extent than in other poverty classifications. In metropolitan areas as well, there is a decrease in disparity, with lower chances than in non-metropolitan areas. Transitional poverty is most pronounced in the Northeast in contrast to the Southeast, with the North region following closely behind, whereas transitional poverty is less likely in the South and Central-West.
As a result, the regressions show that women are more prone to chronic and situational poverty than men. When it came to structural poverty, there was no statistically significant gap between men and women. Conversely, certain traits are frequently found in the three poverty groups that were analyzed: non-white individuals, younger individuals, less educated individuals, and individuals living in rural households; individuals in non-metropolitan areas; and individuals in the North and Northeast regions of the country.
In 2022, based on PNADC data, the study examined a projected Brazilian population of 213,999,280 individuals. In Brazil, most of the population consisted of women who were experiencing a lack of money and essential resources. There were 32,143 women compared to 29,728 men. According to the regression model estimates shown in Table 5, women displayed a statistically significant contrast with men in terms of chronic and situational poverty, with no significant gap observed for structural poverty. Men have greater access to the job market, which is one of the main factors contributing to this variation.
In contrast, most of the Brazilian population is made up of non-white individuals who were experiencing poverty, with racial or skin color distinctions being more prominent than gender discrepancies. About 44,362 thousand black, mixed-race, and indigenous individuals are living in poverty, compared to 17,510 thousand white and yellow individuals.
Another concerning factor for the outlook is the examination based on different age brackets. Poverty disproportionately affects younger individuals, limiting their opportunities and social mobility over their lifetime. Around 40% of children in the age ranges of 0–5, 6–10, and 11–14 are affected by situational poverty. Over the next two age categories, it falls to about 25%, reaching a total of 30,632 thousand individuals in the age range of children, adolescents, and young adults. Among those aged 30 to 59, there are a further 20,217 thousand people experiencing poverty. Chronic poverty is just below 5% for younger people and around 1.5% among adults. Poverty disproportionately impacts individuals with lower levels of education, as expected. Individuals who are illiterate or have less than a year of education have a poverty rate of 59.7%, indicating social integration. On the other hand, 95.7% of those with a higher education degree are not in poverty.
When examining the PNAC data for 2022, it is evident that São Paulo is the most populous state in Brazil and has the highest number of impoverished individuals. The wealthiest federation unit (UF) has the highest number of impoverished residents, with 7022 thousand in situational poverty, 91 thousand in chronic poverty, and 46 in structural poverty. An additional 39,755 individuals have achieved social integration. The poverty rate in this UF is higher than in any other location. Additionally, states like Bahia, Minas Gerais, Pará, and Rio de Janeiro also play a major role in the overall poverty levels of the country. Chronic poverty also stands out in Bahia, Pará, Amazonas and Maranhão.
5. Discussion
This work provides evidence that allows us to emphasize certain results. At first, it was able to confirm the decrease in the poverty-stricken population in the country. Hoffmann and Jesus (2023) studied monetary poverty in the country from 2012 to 2022, which aligns with this finding. They noticed a decrease from 2016 to 2019 and again from 2019 to 2022, reaching a poverty line of BRL 600.00.
The findings show that approximately 30% of the Brazilian population were still experiencing poverty, in terms of either income or multiple dimensions, by the end of the studied period. Poverty is closely linked to the second goal of sustainable development, which aims to eliminate hunger. Banerjee and Duflo (2021) suggest that hunger is often equated with poverty for a significant number of people, leading to a cycle of poverty. When the poor lack sufficient resources to feed themselves, their productivity decreases, leading to their continued poverty. The population living in poverty also lacks time for leisure and rest, and it is observed that women suffer more from time poverty (Ribeiro & Taques, 2012).
The population in poverty, as identified in this study, is predominantly made up of women, non-whites, younger individuals, and those with lower educational levels. This outcome highlights the need for public policies that center on these specific population groups. Public educational policies play a significant role in this scenario, focusing on increasing access and enhancing the quality of daycare centers, preschools, primary, and secondary education, as well as full-time schooling.
Public educational policies are particularly noteworthy in this context for their emphasis on expanding access and enhancing the quality of daycare centers, preschools, and primary and secondary education, which are now offering full-time schooling. One of the observed outcomes highlights the significance of job market access in alleviating poverty. Women, young individuals, non-white individuals, and those with lower levels of education face limited opportunities to secure higher-paying and more prestigious employment in the nation. The dimension of health and sanitary conditions presents challenges, particularly concerning sewage treatment and garbage collection. Individuals living in poverty experience higher levels of household overcrowding, with approximately half of them residing in households where there are three or more people per bedroom.
It is important to emphasize the scale of poverty. São Paulo, the wealthiest state in the country, is home to a total of 7161 thousand people experiencing some form of deprivation. The number is higher than the entire population of most states in the country, specifically 16 UFs. Poverty is more widespread in the North and Northeast regions in comparison.
According to J. J. Silva et al. (2020), this unequal development can be attributed to Brazil’s socioeconomic history. Furtado (2007) stated that the Northeast was negatively impacted by the decline of the sugar cane cycle, which took place from the late 17th century to the early 19th century. As a result, the interior regions shifted towards a subsistence economy. In the North, many people, including immigrants from the Northeast, shifted to the subsistence economy as the rubber cycle came to an end. In contrast, the Southeast region experienced a boost in its industrialization process after the coffee economy crisis in 1930, leading to its increased growth. Furthermore, L. O. Silva (1996) and J. J. Silva et al. (2020) pointed out that the Land Law of 1850 constrained land availability and promoted large estates, resulting in the ongoing land concentration in the country. Gremaud et al. (2002) further mention that the social inequalities in Brazil can be attributed to the 300 years of slavery and the challenging circumstances faced by the freed slaves.
In addition, the results for Brazil in 2022 point to a country with greater deprivations than China in 2008, as evidenced by Alkire and Santos (2010), in the case of chronic poverty (2.49%), situational poverty (25.65%), and social integration (71.09%). Although in the structural poverty segment, Brazil has better conditions (0.77%), China reached a level of 11.6%. Thus, in Brazil, the lack of income to overcome poverty stands out as being associated with situational poverty.
Therefore, poverty in the country is a result of the policies implemented since colonial times, where the country has been defined as a significant exporter of primary goods globally. Nevertheless, Brazil has yet to effectively provide for its citizens, leaving many without the essentials for a decent standard of living. Consequently, the findings of this study confirm empirical research and present new evidence. They enable us to enhance our comprehension of the intricate nature of poverty in the nation.
6. Conclusions
This study focused on both multidimensional and unidimensional poverty and examined how these two approaches are interconnected. This led to the division of the population into categories of chronic, structural, situational, and socially integrated poverty. It analyzed PNADC data from 2016 to 2022, along with poverty measures, and conducted regressions to identify the key factors influencing poverty levels in the Brazilian population.
Based on the findings presented, it was evident that poverty metrics decreased, both from 2016 to 2019 and from 2019 to 2022. The exception was situational poverty, which increased from 2019 to 2022. In 2016, approximately 32% of the population faced some form of deprivation, compared to around 29% in 2022. This still accounts for a significant segment of the population.
In terms of multidimensional poverty, a lack of access to education had the greatest impact, followed by inadequate health and sanitation, and lastly, poor housing conditions. The majority of people living in poverty are women, non-whites, young individuals, those with lower education levels, those living in rural or non-metropolitan areas, and those in the North and Northeast regions. Poverty rates are the highest in the state of São Paulo, followed by Bahia, Minas Gerais, Pará, and Rio de Janeiro. Hence, the study outcomes imply that poverty does not result from a shortage of wealth but from the notably unequal distribution of wealth across the country.
Another important point to consider is the high rate of poverty affecting children, teenagers, and young adults in the nation, which stands at approximately 40%. This hinders the possibilities of advancing socially and escaping poverty in the future. These individuals require protection but face daily struggles with basic needs, such as food insecurity. This issue could be addressed through access to daycare centers and full-time education programs.
For future work, we suggest to analyzing the impact on the measurement of multidimensional poverty when the weights used for the dimensions and for the level of deprivation necessary to be considered in a situation of poverty are changed. The inclusion of new indicators is also suggested, such as those associated with health, such as food and nutritional security and infant mortality, which are not available at the household level for the years analyzed. Furthermore, a limitation of the study is the availability of indicators on the quality of goods and services, not just their quantity.
Hence, the findings from the study enable us to describe the nation as having significant socioeconomic disparities. A significant portion of the population, about 30%, remains inadequately integrated into society, meaning they are unable to access their basic freedoms to engage in education. In this scenario, it is recommended to enhance public policies such as health services, education from daycare up to high school graduation, housing, employment inclusion, and food security. Poverty is marked by the lack of access to minimum social necessities for integration and well-being, basic for the sustainable progress of succeeding generations.
Funding
The author receives a research productivity grant from CNPq during the study.
Institutional Review Board Statement
Not applicable.
Informed Consent Statement
Not applicable.
Data Availability Statement
The research data is available at IBGE (https://www.ibge.gov.br/ accessed 10 February 2024).
Conflicts of Interest
The author declares no conflict of interest.
References
- Albuquerque, M. R., & Cunha, M. S. (2012). Uma análise da Pobreza sob o enfoque multidimensional no Paraná. Revista de Economia, 38(3), 45–64. [Google Scholar] [CrossRef]
- Alkire, S., Apablaza, M., Chakravarty, S., & Yalonetzky, G. (2017). Measuring chronic multidimensional poverty. Journal of Policy Modeling, 39, 983–1006. [Google Scholar] [CrossRef]
- Alkire, S., & Fang, Y. (2019). Dynamics of multidimensional poverty a unidimensional income poverty: An evidence stability analysis from China. Social Indicator Research, 142, 25–64. [Google Scholar] [CrossRef]
- Alkire, S., & Foster, J. (2009). Counting and muldimensional poverty measurement. Oxford Poverty & Human Development Initiative, University of Oxford. [Google Scholar]
- Alkire, S., Foster, J., Seth, S., Santos, M. E., Roche, J. M., & Ballon, P. (2015). Multidimensional poverty measurement and analysis. Oxford Poverty & Human Development Initiative, University of Oxford. [Google Scholar]
- Alkire, S., & Santos, M. E. (2010). Acute multidimensional poverty: A new index for developing countries. University of Oxford. [Google Scholar]
- Banerjee, A. V., & Duflo, E. (2021). A economia dos pobres: Uma nova visão sobre a desigualdade. Zahar. [Google Scholar]
- Barros, R. P., Carvalho, M., & Franco, S. (2006). Pobreza multidimensional no Brasil. IPEA. [Google Scholar]
- Bárcena-Martín, E., Pérez-Moreno, S., & Rodríguez-Díaz, B. (2020). Rethinking multidimensional poverty through a multi-criteria analysis. Economic Modelling, 91, 313–325. [Google Scholar] [CrossRef]
- Belkiss, M., Pauli, R. I. P., & Oliveira, S. V. (2021, December 6–10). Pobreza multidimensional na pandemia do Covid-19: Uma aplicação do método Alkire-Foster (AF) para o caso brasileiro. Encontro Brasileiro de Economia, São Paulo, Brazil. Available online: https://www.anpec.org.br/encontro/2021/submissao/files_I/i12-99217de2f6e784f101d03e19fe924ec0.pdf (accessed on 20 February 2024).
- Bourguignon, F., & Chakravarty, S. (2003). The measurement of multidimensional poverty. The Journal of Economic Inequality, 1, 25–49. [Google Scholar] [CrossRef]
- Brambilla, M. A., & Cunha, M. S. (2021). Pobreza multidimensional no Brasil, 1991, 2000 e 2010: Uma abordagem espacial para os municípios brasileiros. Nova Economia, 31, 869–898. [Google Scholar] [CrossRef]
- Brasil. (2013). Lei nº 12.796, de 4 de abril de 2013. Brasília. Available online: https://legis.senado.leg.br/norma/588172 (accessed on 10 February 2024).
- Brasil. (2014). Lei nº 13.005, de 25 de junho de 2014. Brasília. Available online: https://www.planalto.gov.br/ccivil_03/_ato2011-2014/2014/lei/l13005.htm (accessed on 10 February 2024).
- Brasil. (2020). Lei nº 14.026, de 15 de julho de 2020. Brasília. Available online: https://legislacao.presidencia.gov.br/atos/?tipo=LEI&numero=14026&ano=2020&ato=cfaATWE9EMZpWT417 (accessed on 15 May 2024).
- Brites, M., Marin, S. R., & Rohenkohi, J. E. (2022). Pobreza multidimensional fuzzy nos municípios brasileiros em 2010. Pesquisa e Planejamento Econômico, 52(2), 1–52. [Google Scholar] [CrossRef]
- Cameron, C., & Trivedi, P. K. (2005). Microeconometrics: Methods and applications. Cambridge University Press. [Google Scholar]
- Chen, S., & Ravallion, M. (2013). More relatively—Poor people in a less absolutely—Poor world. Income Wealth, 59(1), 1–28. [Google Scholar] [CrossRef]
- Fahel, M., & Teles, L. R. (2018). Medindo a pobreza multidimensional do estado de Minas Gerais, Brasil: Olhando para além da renda. Revista de Administração Pública, 52(3), 386–416. [Google Scholar] [CrossRef]
- Fahel, M., Teles, L. R., & Caminha, D. A. (2016). Para além da renda: Uma análise da pobreza multidimensional. Revista Brasileira de Ciências Sociais, 31(92), e319205. [Google Scholar] [CrossRef]
- Furtado, C. (2007). Formação econômica do Brasil. Companhia das Letras. São Paulo. [Google Scholar]
- Greene, W. H. (2018). Econometric analysis (8th ed.). Pearson. [Google Scholar]
- Gremaud, A. P., Vasconcelos, A. S., & Tonello, R. (2002). Economia brasileira contemporânea. Atlas. [Google Scholar]
- Hoffmann, R., & Jesus, J. G. (2023). Pobreza no Brasil, 2012–2022. Revista Brasileira de Economia Social e do Trabalho, 5, e023010. [Google Scholar] [CrossRef]
- Hoffmann, R., & Kageyama, A. (2006). Pobreza no Brasil: Uma perspectiva multidimensional. Revista Economia e Sociedade, 15(1), 79–113. [Google Scholar]
- IBGE—Instituto Brasileiro de Geográfia e Estatística. (2023). Síntese de indicadores sociais: Uma análise das condições de vida da população brasileira. IBGE. [Google Scholar]
- IBGE—Instituto Brasileiro de Geográfia e Estatística. (2024). Censo demográfico 2022. IBGE. [Google Scholar]
- Marcelino, G. C., & Cunha, M. S. (2024). Multidimensional poverty in Brazil: Evidences for rural and urban areas. Revista de Economia e Sociologia Rural, 62(1), e266430. [Google Scholar] [CrossRef]
- Neri, M. C. (2022). Mapa da nova pobreza (40p). FGV Social. [Google Scholar]
- Neves, O. J. F., & Silva, A. M. R. (2023). The effects of muldimensional well-being growth on poverty and inquality in Brazil over the periods of 2004–2008 and 2016–2019. Brazilian Journal of Political Economy, 43(2), 358–379. [Google Scholar] [CrossRef]
- ONU—Organização das Nações Unidas. (2015). Transformando nosso mundo: A agenda 2030 para o desenvolvimento sustentável. Available online: https://brasil.un.org (accessed on 15 January 2020).
- Pereira, O. L. F., Santos, V. F. S., Silva, G. J., & Oliveira, S. V. (2020). Sobre el futuro y la juventud de Brasil: Un análisis de la incidencia de la pobreza multidimensional en las grandes regiones. Revista Apuntes, 47(86), 244. [Google Scholar] [CrossRef]
- Ribeiro, L. P., & Taques, F. H. (2012). Pobreza: Da insuficiência de renda à privação de tempo. Revista de Desenvolvimento Econômico, XIV(25), 108–120. [Google Scholar] [CrossRef]
- Rocha, S. (2006). Pobreza no Brasil: Afinal do que se trata? (3rd ed.) FGV. Available online: https://books.google.rs/books?hl=sr&lr=&id=H4llDwAAQBAJ&oi=fnd&pg=PA2&dq=Rocha,+S.+(2006).+Pobreza+no+Brasil:+Afinal+do+que+se+trata%3F+(3nd+Ed.).+FGV,+244.&ots=KxU7mvoHch&sig=zQwFhkWTIXsC7fhoRH1BvVta95c&redir_esc=y#v=onepage&q&f=false (accessed on 23 January 2024).
- Rosa, S. S. D., Bagolim, I. P., & Ávila, R. P. (2023). Multidimensional poverty in Brazil’s north region. International Journal of Social Economics, 50(5), 725–739. [Google Scholar] [CrossRef]
- SAGICAD (Secretaria de Avaliação, Gestão da Informação e Cadastro Único). (2024). Programa auxílio Brasil—Quantidade de famílias e valores do Auxílio Brasil. Available online: https://aplicacoes.cidadania.gov.br/vis/data3 (accessed on 23 January 2024).
- Salama, P., & Destremau, B. (1999). O tamanho da pobreza. Economia política de distribuição de renda (p. 160). Grammont. [Google Scholar]
- Sen, A. (1993). Capability and well-being. In A. Sen, & M. Nussbaum (Eds.), The quality of life (pp. 30–55). Clarendon Press. [Google Scholar]
- Sen, A., & Anand, S. (1997). Concepts of human development and poverty: A multidimensional perspective. In ONU (Ed.), Poverty and human development (pp. 1–20). United Nations Development Programme. [Google Scholar]
- Sen, A. K. (2000). Desenvolvimento como Liberdade. Companhia Das Letras. [Google Scholar]
- Silva, A. F., Sousa, J. S., & Araujo, J. A. (2017). Evidências sobre a pobreza multidimensional na região Norte do Brasil. Revista de Administração Pública, 51(2), 219–239. [Google Scholar] [CrossRef]
- Silva, A. M. R., Lacerda, F. C. C., & Neder, H. D. (2011). A evolução do estudo da pobreza: Da abordagem monetária à privação de capacitações. Bahia Análise & Dados, 21(3), 509–527. [Google Scholar]
- Silva, J. J., Bruno, M. A. P., & Silva, D. B. N. (2020). Pobreza multidimensional no Brasil: Uma análise do período 2004–2015. Revista de Economia Política, 40(1), 138–160. [Google Scholar] [CrossRef]
- Silva, L. O. (1996). Terras devolutas e latifúndio: Efeitos da Lei de 1850. Editora da UNICAMP. [Google Scholar]
- Souza, P. H. G. F., Osorio, R. G., Paiva, L. H., & Soares, S. (2019). Os efeitos do programa bolsa família sobre a pobreza e a desigualdade: Uma balança dos primeiros quinze years (38p). IPEA. [Google Scholar]
- Townsend, P. (1993). The international analysis of poverty. Harvester Wheatsheaf. [Google Scholar]
- UNDP & OPHI. (2019). Illuminating inequalities. United Nations Development Programme (UNDP), and Oxford Poverty and Human Development Initiative (OPHI), University of Oxford. [Google Scholar]
- UNDP & OPHI. (2023). Unstacking global poverty—Data for high-impact action (31p). United Nations Development Programme (UNDP), and Oxford Poverty and Human Development Initiative (OPHI), University of Oxford. [Google Scholar]
- Valente, X. (2023). La pobreza en Venezuela: Conceptos, medidas y políticas de los enfoques tradicionales. Revista Venezolana de análisis de conjuntura, XXIV(1), 9–42. [Google Scholar]
- Vieira, C. A., Kuhn, D. D., & Marin, S. R. (2017). Método Alkire-Foster: Uma aplicação para a medição de pobreza multidimensional no Rio Grande do Sul (2000–2010). Planejamento e Políticas Públicas, 48, 267–299. [Google Scholar]

Disclaimer/Publisher’s Note: The statements, opinions and data contained in all publications are solely those of the individual author(s) and contributor(s) and not of MDPI and/or the editor(s). MDPI and/or the editor(s) disclaim responsibility for any injury to people or property resulting from any ideas, methods, instructions or products referred to in the content. |
© 2025 by the author. Licensee MDPI, Basel, Switzerland. This article is an open access article distributed under the terms and conditions of the Creative Commons Attribution (CC BY) license (https://creativecommons.org/licenses/by/4.0/).