Abstract
Based on endogenous growth theory and technological innovation theory, this paper uses panel data from 30 provinces in China from 2011 to 2022 to investigate the impact of digital village construction on agricultural green total factor productivity (AGTFP). AGTFP was measured by the EBM-GML method, and mediated effects and heterogeneity analysis were used to reveal its conduction pathway. The findings are as follows: (1) AGTFP showed an overall upward trend during the sample period, and most provinces peaked in 2018. Among them, the AGTFP index value of the eastern coastal provinces (such as Tianjin and Beijing) is between 1.059 and 1.129, maintaining the leading position. The western region fluctuates greatly; e.g., the AGTFP value of Qinghai Province fluctuates between 0.915 and 1.047. (2) Digital village construction significantly improves AGTFP by promoting green technology progress (coefficient 0.105, significant at the 5% level) but has no significant impact on technical efficiency. (3) Agricultural informatization (coefficient 0.040, significant at the 5% level) and rural human capital (coefficient 0.115, significant at the 5% level) are important intermediary channels for digital village construction to affect AGTFP. (4) Regional heterogeneity analysis showed that the effect of digital village construction in the eastern region (coefficient 0.151, significant at the 5% level) and the southern provinces (coefficient 0.170, significant at the 1% level) was more significant. The digital village construction in the main producing areas (coefficient 0.113, significant at the 1% level) also significantly promoted AGTFP. Based on the research results, it is suggested that the promotion and application of digital technology be strengthened, the land transfer system improved, an agricultural information platform built, rural human capital improved, and regional differentiated development strategies implemented.
1. Introduction
Global food security and sustainable agricultural development face unprecedented challenges. With the world’s population projected to reach 10.3 billion by 2080 (United Nations, 2024), food production must increase by 70% to meet rising demand. Despite record global cereal production of 28,421 million tons in 2023, approximately 733 million people remain undernourished (FAO, 2024). Moreover, agricultural activities significantly contribute to environmental degradation, accounting for 24% of global greenhouse gas emissions (IPCC, 2022), 72% of freshwater withdrawals (World Bank, 2024), and severe soil degradation caused by excessive chemical fertilizer use. In response to these challenges, major agricultural economies have implemented comprehensive digital transformation strategies, including the EU’s “Farm to Fork” strategy (European Commission, 2020), Japan’s “Green Food System”, and the US’s “Agriculture Innovation Mission for Climate (AIM4C) (USDA, 2024).
As the world’s largest agricultural producer, China’s agricultural development shows significant regional differences. Economically developed regions have made remarkable progress in agricultural modernization and efficiency improvement, while less developed regions still face the challenge of improving production efficiency. This dual development pattern further increases the difficulty of balancing food security and environmental sustainability. Although China achieved remarkable growth in grain production, reaching 694.71 million tons in 2023 (National Bureau of Statistics of China, 2024), this growth has been accompanied by substantial environmental externalities. Fertilizer application intensity, at 338 kg/ha, substantially exceeds the global average of 125 kg/ha (FAO, 2024), while agricultural non-point source pollution affects 130 million hectares of farmland. These critical issues underscore the imperative for sustainable farming practices, with digital transformation emerging as a promising intervention strategy.
According to endogenous growth theory, technological progress and efficiency improvement constitute fundamental drivers of productivity growth (Romer, 1990; Lucas, 1988). In the context of digital agriculture, Wolfert et al. (2017) demonstrated how digital transformation enhances sustainable productivity through technology diffusion and knowledge spillovers.
In January 2018, the Opinions of the CPC Central Committee and the State Council on Implementing the Rural Revitalization Strategy proposed to implement the digital village strategy, make good overall planning and design, accelerate the pace of broadband network and fourth-generation mobile communication network coverage in rural areas, develop information technology, products, applications, and services that are adapted to the characteristics of “agriculture, rural areas and farmers”, promote the popularization of telemedicine, distance education, and other applications, and bridge the urban-rural digital divide (CPC Central Committee and State Council, 2018). In May 2019, the General Office of the CPC Central Committee and the State Council issued the Outline of the Digital Village Development Strategy (CPC Central Committee and State Council, 2019). They put forward the concept of digital village development. Digital village development is an endogenous process of agricultural and rural modernization and transformation accompanied by the application of networking, informatization, and digitalization in the economic and social development of agricultural and rural areas, as well as the improvement of farmers’ modern information skills. It is the strategic direction of rural revitalization and an important part of building a digital China. The introduction of this concept aligns with the global digital transformation trend in agricultural and rural development and has significant implications for promoting green agricultural development.
Agricultural green total factor productivity (AGTFP) is an important indicator for measuring the comprehensive production efficiency of agricultural systems under environmental constraints and resource utilization efficiency. It not only focuses on the growth of agricultural output but also emphasizes the minimization of environmental impact during the production process, reflecting the core requirements of sustainable agricultural development. The measurement of AGTFP usually includes expected output (such as total agricultural output value) and undesired output (such as negative environmental externalities such as carbon emissions). Through dynamic production frontier analysis methods, such as the extended Epsilon-Based Measure (EBM) model and the Global Malmquist–Luenberger (GML) index, it comprehensively evaluates the efficiency changes and technological progress of agricultural production. The improvement of AGTFP depends not only on improving technical efficiency but also on promoting green technological progress. It reflects how agricultural development can reduce environmental pressure and achieve coordinated development of the economy and ecology through technological innovation and optimal resource allocation while achieving economic growth.
By 2023, substantial progress had been made in the digital village strategy, with rural e-commerce transactions reaching 2.49 trillion yuan (Ministry of Agriculture and Rural Affairs, 2024) and the agricultural production informatization rate increasing to 26.5% (Cyberspace Administration of China, 2023). While existing literature extensively explores the relationship between technological innovation and agricultural productivity (W. Huang & Wang, 2024; D. Lu et al., 2025), there is a notable gap in research regarding the impact mechanisms of the digital village strategy on AGTFP.
This paper addresses this research gap by examining the influence of digital village development on Agricultural Green Total Factor Productivity (AGTFP). Based on provincial panel data from 2011 to 2022, the mediating role of agricultural informatization, rural human capital, and regional heterogeneity is empirically analyzed based on endogenous growth theory and technological innovation theory. Using the EBM-GML model (Tone & Tsutsui, 2010), desired and non-desired outputs can be measured simultaneously, making it more suitable for measuring AGTFP. The main contributions of this study include (1) constructing a comprehensive evaluation framework, combining endogenous growth theory with digital villages, and applying the entropy method to measure the construction of digital villages; adopting the EBM-GML method to integrate environmental factors and dynamically measuring AGTFP, to more accurately assess agricultural productivity growth. (2) The transmission mechanism of digital village development promoting agricultural digital transformation through agricultural informatization and human capital accumulation is verified, revealing how digital transformation endogenously promotes sustainable agricultural development through multiple channels. (3) The heterogeneity analysis provides an empirical basis for developing countries to promote the digital transformation of agriculture and provides practical references for relevant policymakers.
2. Literature Review
2.1. Theoretical Basis and Analytical Framework
2.1.1. Theoretical Perspective
The endogenous growth theory (Romer, 1990) and the technological innovation theory (Schumpeter, 1942) provide the core theoretical support for this study. Schumpeter (1942) proposed that technological innovation is the core driving force behind economic development, emphasizing the fundamental impact of entrepreneurial innovation and “creative destruction” on the economic system. Romer’s (1990) endogenous growth theory further supplemented the continuous driving effect of technological progress on economic growth, revealing the key role of knowledge accumulation and technological innovation in economic development. These two theories jointly construct a theoretical framework for understanding the construction of digital villages. From the two dimensions of the initial driving force of innovation and the long-term impact of knowledge accumulation, they comprehensively reveal the innovation logic of digital technology in the agricultural system and provide a theoretical basis for analyzing the effect of digital village construction on AGTFP.
2.1.2. Theoretical Analysis Framework of Digital Village Construction on AGTFP
The path of influence of digital village construction on AGTFP is mainly reflected in technological innovation, resource allocation, and knowledge spillover mechanisms. Klerkx et al. (2019), through a systematic analysis of digital agriculture policies in 36 countries, revealed the key role of multi-stakeholder collaborative innovation in promoting digital agriculture technologies and emphasized the importance of building a supportive institutional environment for developing digital agriculture. According to the study of Romera et al. (2024), digital transformation can establish an information interconnection mechanism for the whole agricultural industry chain, effectively break the information barriers of traditional agricultural production, and significantly optimize resource allocation. D. Lu et al. (2025) further revealed various factors affecting China’s AGTFP through qualitative comparative analysis of dynamic fuzzy sets, which provided a new perspective for understanding the role of digital village construction. These findings provide a theoretical basis for analyzing the relationship between digital village construction and AGTFP improvement.
2.2. Digital Technology and Green Development of Agriculture
Agricultural informatization plays an important intermediary role in the construction of digital villages. Romera et al. (2024) found through a systematic analysis of 178 farms that integrating information systems can significantly improve agricultural production efficiency and reduce technical barriers and privacy risks. Vahdanjoo et al. (2025) comprehensively reviewed the digital transformation of the agricultural food system. They systematically analyzed the key challenges and potential opportunities in technological innovation, institutional change, and social adaptation.
The regulatory mechanism of human capital should not be ignored. Based on an empirical study of 854 farmers, Gong et al. (2025) used the Probit model to analyze how digital human capital promotes farmers’ green production willingness through online learning and social networks, revealing the inherent path of digital skills transmission. Based on provincial panel data from 2010 to 2020, Hu et al. (2023) used a spatial econometric model to empirically analyze the regional heterogeneity of rural human capital on agricultural ecological efficiency and found that the role of human capital in promoting ecological efficiency was significantly different in the eastern, central, and western regions.
2.3. Regional Heterogeneity and Institutional Innovation
2.3.1. Regional Development Differences
Significant differences exist between the eastern, central, and western regions regarding digital village construction and AGTFP. Li et al. (2022) showed that due to differences in digital infrastructure, economic development level, and institutional support mechanisms, the impact of digital village construction on AGTFP showed apparent heterogeneity in different regions. Hu et al. (2023) further pointed out that the role of rural human capital in promoting agricultural ecological efficiency varies significantly among different regions, reflecting the current situation of unbalanced regional development.
2.3.2. Institutional Innovation
International experience provides an important reference for my country’s green agricultural development. Klerkx et al. (2019) summarized the key role of digital agricultural policies in promoting technology popularization and application, emphasizing that countries should fully consider local resources and industrial characteristics when formulating development strategies.
Institutional innovation is key to promoting digital village construction and agricultural green transformation. Tang and Chen’s (2022) institutional innovation index system reveals the inherent mechanism of digital village construction on the green transformation of cultivated land use and proposes multidimensional innovation paths such as technological innovation, institutional supply, and factor flow. This analytical framework provides an important theoretical perspective for understanding the interactive relationship between digital technology and sustainable agricultural development.
2.4. Research Review and Research Contribution
2.4.1. Limitations of Existing Research
Existing research has certain deficiencies in the construction of theoretical frameworks. Although existing studies have explored the application of digital technology in agriculture, there is a lack of a systematic theoretical framework that organically combines digital village construction with AGTFP. At the same time, existing empirical studies do not fully consider regional heterogeneity, so an in-depth analysis of the impact mechanisms of different regions is needed.
2.4.2. Literature Gap and Research Contribution
Despite substantial progress in understanding the relationship between digital village building and agricultural total factor productivity, some key research gaps remain. Existing research has not systematically explored how digital village construction affects agricultural total factor productivity, particularly the mediating role of agricultural informatization and rural human capital. In addition, limited attention has been paid to regional heterogeneity in the effectiveness of digital transformation, and significant differences in economic development, digital infrastructure, and institutional capacity have not been fully explored. In addition, prior studies often lack a dynamic perspective to capture the time-varying total factor productivity in agriculture under digital transformation. Therefore, this study has specific practical significance and can fill the gap in this field.
3. Theoretical Analysis and Research Hypotheses
This study builds on previous theoretical frameworks for digital agriculture (Chambers et al., 2015) and combines endogenous growth theory (Romer, 1990) and technological innovation theory (Nelson & Winter, 1982) to analyze the mechanisms by which digital village construction affects AGTFP.
Endogenous growth theory emphasizes that technological progress and human capital accumulation are endogenous drivers of productivity improvement. It provides a theoretical basis for digital village construction to enhance AGTFP through technological innovation and rural talent cultivation. Technology innovation theory, on the other hand, explains the regional differences in the process of digital technology adoption from the perspectives of institutional environment and technology absorption capacity. Based on these two theoretical perspectives, this paper constructs an analytical framework for the impact of digital village construction on AGTFP.
3.1. Direct Effects of Digital Village Construction on Agricultural Green Total Factor Productivity
3.1.1. Technology Efficiency Effect
The construction of digital villages represents a fundamental paradigm shift in agricultural production systems by integrating technological innovations. The increased efficiency of resource allocation is reflected in two main mechanisms:
Through the integration of technological innovation, digital village construction has realized a fundamental change in the agricultural production system, which is mainly reflected in many aspects. First, precision agriculture technology optimizes agricultural production through data-driven decision-making. Digital technologies are making agricultural production more precise and efficient. For example, Ma et al. (2020), based on the survey data of 493 farmers, found that applying modern agricultural technology and information systems, especially the promotion of agricultural mechanization, can significantly improve the efficiency of resource allocation and farm production efficiency. Second, integrating the Internet of Things (IoT) infrastructure has facilitated the optimization of precision inputs. Y. Liu et al. (2020) showed that in the era of Agriculture 4.0, the application of digital technologies such as the Internet of Things can realize precision agricultural production and improve resource utilization efficiency. At the same time, by integrating technologies such as the Internet of Things and artificial intelligence, environmental impact can be reduced while maintaining agricultural productivity levels. Together, these mechanisms constitute a comprehensive path for digital village construction to promote innovation in the agricultural production system.
3.1.2. Technology Progress Effect
Digital village construction promotes agricultural technological progress in multiple dimensions by building digital infrastructure and platforms. Theoretically, this technological progress effect is mainly achieved through the following mechanisms: improving digital infrastructure provides key support for agricultural green technology innovation. On the one hand, digital platforms reduce the marginal cost of technological innovation and diffusion, accelerating the spillover effect of agricultural green technology among regions. On the other hand, digital technology improves the precision level of agricultural production and creates conditions for applying environmentally friendly technologies. At the same time, the construction of digital platforms optimizes the agricultural technology dissemination system. By integrating various links in the agricultural value chain, digital platforms improve the systematicness and precision of technology promotion and promote knowledge sharing and technical collaboration among agricultural production entities, thereby promoting the overall improvement of agricultural innovation capabilities.
Based on this theoretical framework, we propose the following:
H1:
Digital village construction exhibits a positive correlation with agricultural green total factor productivity.
H1a:
Digital village construction can promote the improvement of agricultural green technology efficiency.
H1b:
Digital village construction can promote agricultural green technology progress.
We propose a theoretical framework, as shown in Figure 1, which illustrates the relationships between digital village construction and AGTFP, including both direct effects and mediating mechanisms.
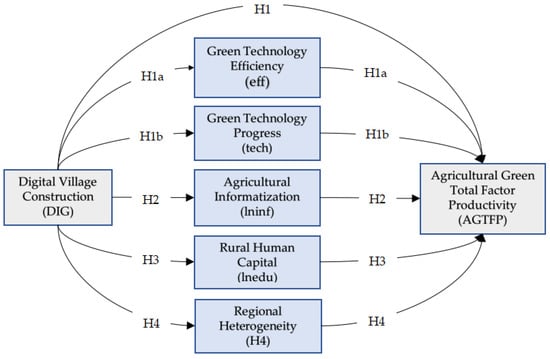
Figure 1.
Theoretical Framework.
3.2. Mediating Effect Analysis
3.2.1. Mediating Role of Agricultural Informatization
According to the endogenous growth theory (Romer, 1990) and the technological innovation theory (Nelson & Winter, 1982), technological progress and knowledge accumulation are the endogenous driving forces of economic growth, and this process is characterized by gradualness and accumulation. Based on this theoretical framework, agricultural informatization mainly acts on the production side as an important intermediary mechanism between digital village construction and AGTFP. On the consumption side: on the one hand, agricultural informatization provides farmers with precise agricultural production technology guidance and market information through the construction of digital agricultural service platforms, reduces the resource consumption of agricultural production, and improves the green level of agricultural output; on the other hand, agricultural informatization promotes the development of agricultural product e-commerce platforms, broadens the sales channels of green agricultural products, and increases farmers’ enthusiasm for adopting green production technologies, thereby promoting the improvement of AGTFP.
H2:
Agricultural informatization shows a significant mediating role in the relationship between digital village construction and green total factor productivity in agriculture.
3.2.2. Mediating Role of Rural Human Capital
Digital village development enhances rural human capital through systematic digital capacity development. Drawing on Lucas’s (1988) theory of human capital, this process represents an endogenous accumulation of knowledge in which technological progress and human capital development reinforce each other. Spillover effects are significant in the digital village context, where knowledge is transmitted through formal training and informal peer learning networks.
The impact of digital human capital on farmers’ willingness to engage in green production has been confirmed by empirical research. Gong et al. (2025) found that improving digital human capital can significantly enhance farmers’ willingness to participate in green production, among which informal online learning is more effective than formal online learning in promoting farmers’ willingness to engage in green production. This shows that farmers can be effectively encouraged to adopt green production methods by improving their’ digital human capital, especially by strengthening the construction of informal online learning channels. This is consistent with Lucas’s emphasis on human capital’s dual role: increasing individual productivity and generating positive externalities that increase overall technology absorptive capacity.
H3:
Rural human capital exhibits a significant mediating role in the relationship between digital village development and green total factor productivity in agriculture.
3.2.3. Regional Heterogeneity in Digital Transformation Effects
Due to the significant differences in the level of digital infrastructure construction, economic development, and institutional support mechanisms among regions, the impact of digital village construction on AGTFP shows apparent heterogeneity in the eastern, central, and western areas of China. With its complete digital infrastructure system and high level of economic development, the east region has shown more significant effects in improving AGTFP. Although the overall development level of the central area is lower than that of the eastern region, it has achieved considerable benefit growth through precise investment in agricultural informatization construction and rural human capital cultivation. Although the western region faces excellent infrastructure construction and resource allocation constraints, it has shown the potential for latecomer catch-up through technology diffusion effects and gradual adoption strategies. Empirical studies have shown that formulating differentiated development strategies that meet regional characteristics plays a key role in fully realizing the benefits of digital village construction (Wang et al., 2024).
H4:
The impact of digital village construction on AGTFP shows significant regional heterogeneity, with a greater impact in regions with advanced infrastructure and higher levels of economic development.
4. Measurement of the Digital Village and AGTFP
4.1. Measurement of Digital Village
Given that academics have not yet formed a unified and standardized evaluation system for digital village construction, this study builds a comprehensive evaluation index system containing three dimensions of digital infrastructure environment, agricultural digitization, and rural digitization based on the theoretical frameworks of Li et al. (2022) and Wolfert et al. (2017). The indicator system ensures theoretical rigor while fully considering data availability and representativeness, realizing the organic unity of theoretical construction and empirical research. The entropy method is used to quantify the level of digital village construction, consistent with the existing measurement methods of rural digital development (Tang & Chen, 2022). assigning weights based on each indicator’s variability minimizes subjectivity and ensures that the index objectively reflects regional differences in digital village development.
Given the missing data from some years in the Tibet Autonomous Region, the panel data of 30 provinces (autonomous regions and municipalities) in China from 2012 to 2022 have been collected and sorted. The sample data come from the 2013–2023 “China Statistical Yearbook”, the “Statistical Yearbook” of each province (autonomous region and municipality), “China Rural Statistical Yearbook”, “China Taobao Village Research Report” (2013–2023) (Alibaba Research Institute, 2023), “Peking University Digital Inclusive Finance Index (2013–2023)” (Peking University Digital Finance Research Center, 2023), etc. Some missing data are supplemented by interpolation and moving average method.
This study constructs a multidimensional digital village construction evaluation system, which includes three core dimensions: digital infrastructure environment, agricultural digitalization, and rural digitalization , as shown in Table 1. 1. The environmental dimension of digital infrastructural construction, including agricultural financial input (1), the completeness of digital infrastructure (2), the development level of rural logistics (3), and the level of digital financial services (4). 2. Agricultural digitalization dimension (5–8): focuses on the digital transformation process of agricultural production and operation, including digital transaction scale (5), online payment level (6), the proportion of rural residents’ communication expenditure (7), and agricultural financial expenditure (8). 3. Rural digital dimension (9–12): focuses on measuring the penetration of digital technologies in rural areas, including Internet penetration rate (9), number of agrometeorological monitoring stations (10), smartphone penetration rate (11), and rural per capita electricity consumption (12). The construction of the indicator system strictly follows the three principles of scientific, representativeness, and data availability. The data source mainly relies on authoritative statistical databases such as the National Bureau of Statistics and the China Statistical Yearbook to ensure the reliability and cross-regional comparability of the measurement results.

Table 1.
Digital Village construction indicator system and reference source.
Since the academic community has not yet formed a unified, standardized framework for evaluating digital village construction, this study uses the entropy method for measurement. This method can effectively reduce the subjectivity of indicator weight assignment and objectively reflect the differences in development levels among regions. The entropy method determines weights based on the variability of indicators, making it particularly suitable for evaluating the complex and multidimensional nature of digital village development across different regions and periods.
The specific operation steps of the entropy method are as follows:
- Data description. Assume that there are provinces and cities and indicators in year , which represents the value of the th indicator of province in year
- Standardize each indicator. Because the selected indicators have a positive impact on the system, the treatment of negative indicators is not considered:
- Calculate the proportion of indicator in province
- Determine the entropy of indicator
- Calculate the coefficient of difference of indicator
- Calculate the weight of indicator
- Calculate the development index of province in different years
The results of the digital village measurement are shown in Figure 2.
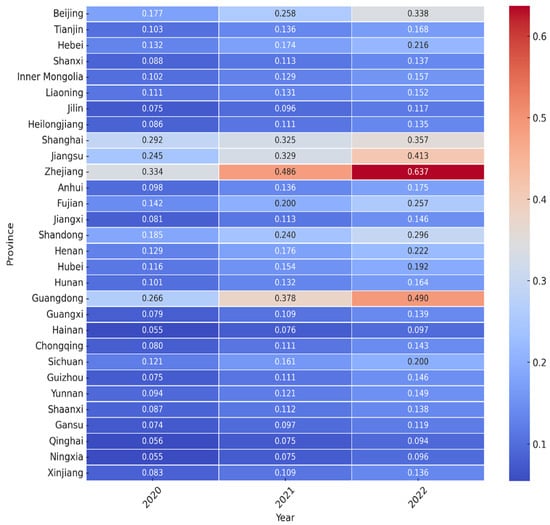
Figure 2.
Heat map of digital village construction measurement results.
1. Overall data. By measuring the digital village construction measurement of 30 provinces in China from 2012 to 2022, the involvement and differences of various regions in the digitalization process can be intuitively displayed. The data show apparent high and low differences in the level of digital village construction between the eastern region and the central and western regions, and the overall migration process remains upward. In the heat map, the color changes from dark blue to dark red, representing the index change from low to high values.
2. Regional differences. Eastern provinces (such as Zhejiang and Guangdong) show obvious index advantages, among which Zhejiang’s digital village index reached 0.637 in 2022, reaching the national peak. Provinces such as Henan and Hubei in the central region also showed a steady upward trend, but there was a significant gap with the eastern region. The indexes of western areas (such as Qinghai and Ningxia) reached 0.094 and 0.096, showing that the digitalization process has a regular trend, but the prospects are still different from those in the East.
3. Time process analysis. From 2012 to 2022, the indexes of most provinces showed an upward trend, especially in the eastern provinces. For example, the indexes of Zhejiang and Guangdong increased from 0.162 and 0.138 in 2012 to 0.637 and 0.490 in 2022, showing the indexes’ continuous growth and empirical advantages. In general, the level of digital village construction tends to improve comprehensively, but there are noticeable high and low differences between regions, especially in the eastern region. The central and western areas also showed gradual growth and improved digital infrastructure.
The results of the digital village measure are consistent with previous studies that have shown regional differences in the digitization process in rural China (Li et al., 2022). Thus, although China’s digital village construction policies have achieved positive results, significant regional imbalances still exist. Addressing these disparities requires a differentiated policy approach that considers local conditions and stages of development.
This analysis provides important implications for policymakers and researchers studying rural digitalization in developing countries. It emphasizes the need for balanced regional development strategies and targeted support mechanisms for lagging regions.
4.2. Measurement of AGTFP
4.2.1. Indicator Selection and Measurement Methodology of AGTFP
- (1)
- Input Variables
Based on the research framework of D. Liu et al. (2021) and S. Lu et al. (2024), this study selects five input indicators: labor input, land input, capital input, water input, and energy input. Labor input is measured by the number of employments in the primary industry, reflecting the scale of human resource input in agricultural production. The land input is represented by the sown area of crops, which reflects the basic factor input of agricultural production. Capital input includes the total power of agricultural machinery, the application amount of agricultural fertilizer conversion, and the use of pesticides and agricultural film, reflecting the level of agricultural modernization and material input. Water resource input is measured by agricultural water consumption, which reflects the water resource utilization intensity of agricultural production. Energy input includes agricultural diesel and electricity consumption, reflecting the energy consumption of agricultural output. These indicators were chosen with both agricultural productivity and environmental impact in mind.
- (2)
- Output Variables
Referring to the study of X. Huang et al. (2022), two dimensions of expected output and non-expected output are considered. The expected output is measured by the total output value of agriculture, forestry, animal husbandry, and fisheries (converted to 2013 constant prices). Agricultural carbon emissions represent the undesired output, and the calculation of carbon emissions is based on the methods proposed by IPCC (2007) and Dubey and Lal (2009), which are calculated according to the inputs of different carbon sources and their corresponding emission coefficients. Specific measurement indicators and coefficients are shown in Table 2. The relevant data were obtained from the China Statistical Yearbook, China Agricultural Yearbook, China Rural Statistical Yearbook, and provincial Statistical Yearbook, and unified measurement methods were adopted during the study period to ensure the comparability of data.
Table 2.
Carbon emissions sources, emission factors, and reference sources in agriculture.
Dubey and Lal (2009) showed that the carbon emission coefficient of agricultural irrigation was 25 kg/hm2. However, considering the dependence of electricity production on fossil fuels in irrigation, a thermal power generation coefficient was necessary to correct it. Based on the average thermal power generation coefficient from 1993 to 2016, the adjusted carbon emission coefficient is 20.476 kg/hm.
4.2.2. Measurement Methodology of AGTFP
- (1)
- Extended EBM model
Compared with the traditional DEA (Data Envelopment Analysis) model, the EBM model (Epsilon-Based Measure Model) has significant technical advantages. First, the conventional DEA model can only handle a single radial or non-radial efficiency measure, and this limitation cannot fully reflect the complex relationship between input and output in the agricultural production process. The EBM model effectively overcomes this technical constraint by integrating radial and non-radial characteristics into the same framework. Second, the EBM model has unique advantages in environmental efficiency measurement and can more accurately characterize the impact of environmental factors on production efficiency. Third, the EBM model can handle both expected output and undesired output, which is of great significance for evaluating negative externalities such as environmental pollution in agricultural production. Fourth, the model is monotonic and translation invariant, which ensures the robustness of the efficiency measurement results. Finally, the EBM model can identify the slack value of each input factor, providing a more targeted decision-making basis for improving production efficiency. These characteristics make it an ideal tool for measuring AGTFP. Guo (2019) uses the EBM-GML method to measure AGTFP and verifies the unique advantages of this method in measuring agricultural production efficiency. Given the advantages of the EBM-GML method, AGTFP was measured in terms of its methodological framework.
The input-oriented EBM model is shown in Equation (7):
Since desired output and undesired output are included when measuring AGTFP, and radial and non-radial relationships exist simultaneously, the EBM model is extended to a non-oriented EBM model that provides for undesired output and is used to measure static agricultural production efficiency, specifically as shown in Equation (8).
Among them, represents the p-th undesired output of the q-th proven; (, ) represents the slack vector of the th expected output and the -th undesired output. If both values are greater than 0, the actual agricultural input and output are lower than the level of the production frontier, and there is room for improvement in the static AGTFP. represents the weight of the -th input factor, reflects the importance of input factor , afford satisfies presents the weight of the -th expected output, which means the weight of the undesired -th production, and the meanings of other symbols are the same as in Equation (7).
In Equations (8), the importance of expected output, undesired output, and input factors is reflected by weights, which must be determined manually. However, subjective settings cannot truly reflect their importance. This study introduces the entropy weight method into the EBM model to more objectively and reasonably reflect the AGTFP differences between DMUs.
- (2)
- GML index
The Global Malmquist–Luenberger (GML) model was chosen to measure AGTFP because of its methodological advantages in dealing with complex agricultural production systems. Unlike traditional productivity measures, the GML model can dynamically analyze changes in productivity over time while accounting for undesirable outputs such as agricultural pollution and environmental degradation. This feature is significant in green agricultural development, as environmental impacts cannot be ignored. In addition, the GML model provides a global benchmark that ensures the solution’s viability over time, solving the problem of infeasibility often encountered in traditional DEA-based models. Another significant advantage is that GML models do not require specific production function settings or distributional assumptions, making them more flexible and applicable to agricultural production scenarios (Li et al., 2022). The robustness of GML makes it particularly suitable for analyzing total factor productivity in Chinese agriculture.
The global GML exponential expression is shown in Equation (9):
Obtained from the global benchmark production possibility set PG.
If > 1 it means that AGTFP increases; if < 1, it implies that AGTFP decreases. The GML index can also be decomposed into the Green Technology Efficiency Index (GTEC) and the Green Technology Progress Index (GTC). See Equation (10):
In formula (10), GTE represents green technology efficiency, GTEC represents the change in green technology efficiency, PG represents the gap between the best practitioners of the technology frontier between the current period and the global benchmark, and GTC represents green technology progress. If GTC > 1, green technology progresses; if GTC < 1, green technology regresses.
The breakdown of the GML Index provides insight into the sources of AGTFP growth. Based on these outstanding advantages, this study uses the extended EBM model and GML index to combine AGTFP and growth rate, which are measured and decomposed to explore the growth status and sources of AGTFP. Each decision-making unit (DMU) is included in the global benchmark set under the global benchmark, so there is no need to worry about a situation with no feasible solution. In addition, this method does not require specific production function settings or distribution assumptions for production efficiency terms. The GML index decomposition provides an effective tool for in-depth analysis of the driving mechanism of agricultural total factor productivity (AGTFP) growth. Compared with the common infeasibility problem of traditional DEA models, the GML model ensures the feasibility and comparability of inter-period measurement results by establishing a global benchmark technology. Based on this, this study uses the extended EBM model combined with the GML index to measure AGTFP and its growth dynamics.
4.2.3. Measurement Results of AGTFP
Based on the EBM-GML model, this study systematically calculated the AGTFP of 30 provinces and regions in China from 2012 to 2022 (see Table 3 for details). The empirical results show that the average AGTFP index during the sample period is 1.015, indicating that China’s agricultural development is gradually becoming sustainable. This finding is consistent with Wolfert et al.’s (2017) conclusion that technological progress promotes sustainable agricultural development.
Table 3.
Measurement Results of AGTFP.
From a regional distribution perspective, the AGTFP index shows significant spatial heterogeneity. The eastern coastal provinces, especially Tianjin and Beijing, have AGTFP index values ranging from 1.059 to 1.129, maintaining a leading position throughout the period. In contrast, the AGTFP in the western region fluctuates more significantly. For instance, the AGTFP value in Qinghai Province ranges from 0.915 to 1.047, suggesting considerable room for improvement in agricultural green production efficiency in this region.
The AGTFP value is centered around 1 in the calculation characteristics of the GML index. When the AGTFP value equals 1, the production unit has reached the benchmark level of green production efficiency under the current technological conditions. Specifically, AGTFP > 1 means that the production unit has an advantage in technological progress or resource allocation and can achieve higher green production efficiency. For example, the AGTFP value in Tianjin reached as high as 1.129 in Beijing, which was 1.059, demonstrating their leading positions in agricultural green transformation.
AGTFP < 1 indicates inefficiencies in technology or resource allocation, and further optimization is needed. For instance, the AGTFP value in Qinghai Province was as low as 0.915 in some years, reflecting the region’s shortcomings in enhancing agricultural green production efficiency.
From the time trend perspective, most provinces’ AGTFP index fluctuates between 0.99 and 1.01, reflecting the gradual changes in agricultural production efficiency. Such minor fluctuations are not flaws but rather an important feature of the transformation of agricultural green productivity, indicating that China’s agriculture is advancing towards sustainable development.
5. Data Sources and Sample Description
5.1. Variable Description
5.1.1. Core Explanatory Variable
Following Li et al. (2022) and Wolfert et al. (2017), this study constructs a comprehensive evaluation framework for digital village construction (lndig) encompassing three dimensions: Digital Infrastructure Environment (measuring agricultural financial investment and rural logistics development), Agricultural Digitalization (capturing digital transactions and online payments), and Rural Digitalization (assessing digital technology penetration). Data are sourced from the National Bureau of Statistics, the China Taobao Village Research Report (2013–2023), and the Peking University Digital Financial Inclusion Index. The entropy weight TOPSIS method ensures objective measurement of regional digital development variations.
5.1.2. Explained Variables
The core dependent variable of this study is AGTFP, which is calculated using the extended EBM-GML model proposed by D. Liu et al. (2021). This model comprehensively assesses the level of agricultural sustainable development by considering expected output (agricultural output value) and undesired output (carbon emissions). According to the research of X. Huang et al. (2022), AGTFP can be decomposed into two dimensions: technical efficiency change (Effch) and technological progress (Tech). The former reflects the improvement in resource allocation efficiency, and the latter measures the advancement of green agricultural technology innovation.
5.1.3. Control Variables
This study introduces four control variables with theoretical and empirical support in the econometric model to alleviate potential omitted variable bias. Agricultural structure (lnstr) is expressed as the proportion of grain crop planting area to total planting area, which is used to control the differences in crop specialization between regions (Ma et al., 2020); agricultural fiscal support (lnfisc) is measured by the proportion of agricultural fiscal expenditure to total fiscal expenditure, reflecting the government’s institutional support for agricultural development (Wang et al., 2024); the agricultural production price index (lnapi) is calculated by the logarithmic weighted ratio of current prices to base period prices, which is used to capture the impact of market price fluctuations; the effective irrigation rate (lneir) is expressed as the proportion of effective irrigation area, which controls the differences in agricultural infrastructure levels among regions (Zhang et al., 2023).
5.1.4. Mediating Variables
Two mediating variables explore how digital village construction affects AGTFP. Agricultural Informatization (lninf), measured by the share of postal and telecommunications business volume in GDP, captures the role of digital information systems in resource optimization (Nelson & Winter, 1982; Zhang et al., 2023). Rural Human Capital (lnedu) is quantified through weighted average years of schooling in rural areas, calculated as:
(Number of People with No Formal Education × 1 + Number with Primary School Education × 6 + Number with Junior Middle School Education × 9 + Number with Senior Middle School or Technical Secondary Education × 12 + Number with College or Higher Education × 16)/Total Rural Population Aged 6 and Above.
This measurement approach aligns with Lucas’s (1988) human capital theory and captures the varying levels of educational attainment in rural areas. Empirical evidence suggests that such educational investments significantly improve technology adoption rates and innovation capacity (Li et al., 2022). The descriptive statistics of variables are presented in Table 4.
Table 4.
Descriptive Statistics.
5.2. Model Construction
5.2.1. Fixed Effect Model Construction
A fixed effects panel model was constructed using individual and time double fixed effects. First, the individual fixed-effects model is tested, followed by a two-dimensional fixed-effects model with fixed time effects for regression. Among them, it represents the AGTFP and the digital village of province in year . is a control variable, is a constant term, , represents individual effects, time effects, and random errors. If the coefficient is significantly positive, then developing a digital village will help improve agriculture green total factor productivity.
Our statistical tests justify the selection of a fixed-effects model. The Hausman test results (χ2 = 20.796, p < 0.01) reject the null hypothesis of random effects, indicating fixed effects are more appropriate. This is further supported by the F test results (F = 20.796, p < 0.001), which confirm the significance of individual effects, and the LM test results (LM = 20.796, p < 0.001), which verify the presence of panel effects. These comprehensive test results strongly support the appropriateness of using a fixed-effects model specification for our panel data analysis.
5.2.2. Mediating Effect Model
This article introduces two intermediary variables: agricultural informatization and rural residents’ income level. It establishes the following regression model to further explore the transmission mechanism of digital village construction to AGTFP.
M represents intermediary variables, including agricultural informatization and rural residents’ income level, both of which are intermediary variables. The explanation of other variables is consistent with the previous article and will not be repeated here.
6. Empirical Results
Based on the panel data of 30 provinces (excluding Tibet) in China from 2011 to 2022, this study explores the impact of digital rural construction on agricultural green total factor productivity (AGTFP). The data sources include the agricultural input-output data (2011–2022) required for AGTFP calculation, which comes from the China Statistical Yearbook, China Rural Statistical Yearbook, and provincial statistical yearbooks; digital rural construction indicators and other control variables and mediating variable data (2012–2022) mainly come from the China Taobao Village Research Report and the Peking University Digital Inclusive Finance Index. The research process is as follows: First, the entropy method is used to construct a comprehensive evaluation index system for digital rural construction, and the EBM-GML method is used to measure AGTFP and its decomposition indicators; secondly, the fixed effect model is used to test the impact of digital rural construction on AGTFP; thirdly, the mediating effect model is used to analyze the transmission mechanism of agricultural informatization and rural human capital; finally, a heterogeneity analysis is conducted based on regional and functional area divisions, and the reliability of the research conclusions is verified through multiple robustness tests.
6.1. Benchmark Regression Results
Based on the LM test, F test, and Hausman test results, this paper employs a fixed-effects model for analysis. Table 5 presents the stepwise regression results, where column (1) is a univariate regression, and columns (2)–(5) progressively incorporate control variables. Comparing the results from columns (1) to (5), it is evident that the variable’s coefficient size and significance level remain relatively stable as control variables are added. This stability indicates the robustness of the impact of digitalization on AGTFP.
Table 5.
Stepwise_Regression.
Column (5) serves as the baseline regression model, showing that the coefficient of lndig is positive and statistically significant at the 1% level. This finding implies that digitalization significantly enhances AGTFP by improving the efficiency of resource allocation, advancing agricultural modernization, and facilitating the adoption of green production technologies. Furthermore, the positive and significant coefficients of control variables—fiscal expenditure (lnfisc), rural infrastructure (lnstr), and agricultural price indices (lnapi)—demonstrate the comprehensive factors supporting AGTFP growth.
The R² value of the model is 0.124, and the goodness of fit is low. The possible reasons are as follows: First, the panel data model is adopted in this study, and the individual time dual fixed effect is adopted, so the R² value is usually lower than the cross-section data. Second, as a comprehensive index, the change of agricultural total factor productivity is affected by many challenging-to-quantify factors, such as weather conditions, natural disasters, and other random impacts. Third, the research sample covers 30 provinces, with significant differences in resource endowment and agricultural development levels among different regions. Such regional heterogeneity will also affect the degree of overall fit of the model. According to the regression results, the main explanatory variables all show good statistical significance, indicating that the model can effectively capture the impact of the core explanatory variable, digital village, on agricultural total factor productivity.
The regression results indicate that digital village development significantly contributes to AGTFP, validating Hypothesis 1. The baseline model’s lndig coefficient (0.132) increases AGTFP by 0.132 units for every unit increase in digital village development. Thus, digital village development significantly impacts agricultural sustainability through improved resource allocation efficiency and technological advancement.
6.2. Robustness Tests
In the baseline regression, a stepwise regression method was used, and the results showed that the coefficients and significance of Digital Village and AGTFP remained stable, which reflects the robustness of the findings to some extent. To further validate the robustness of the findings, this study conducted additional robustness checks, including replacing the model, altering the dependent and independent variables, and excluding the four municipalities. The specific results are presented in Table 6.
Table 6.
Robustness Tests.
First, the fixed-effects model was replaced with a random effects model, as shown in column (1) of Table 6. The results indicate that rural digitalization continues to impact AGTFP significantly, which is consistent with the baseline regression and further demonstrates the robustness of the findings. Second, the dependent variable was replaced with AGTFP-GML, calculated using an output-oriented approach. The results, shown in column (2), remain significant. Similarly, the key independent variable was replaced with indigo, measured using the Principal Component TOPSIS method, and the results remained significant, as seen in column (3). Finally, considering the unique characteristics of Beijing, Shanghai, Tianjin, and Chongqing—where the urban-rural divide is less pronounced, agriculture is not primarily production-oriented, and digital infrastructure is highly advanced—the four municipalities were excluded from the analysis. The results, shown in column (4), indicate that the impact of rural digitalization on AGTFP remains significant.
In conclusion, the robustness checks consistently demonstrate that rural digitalization has a stable and positive effect on AGTFP. This proves that digital village construction significantly contributes to sustainable agricultural development, further supporting Hypothesis 1.
6.3. Heterogeneity Analysis
The baseline regression focuses on examining the average effects of rural digitalization. However, given China’s vast territory and significant regional differences in geographical location, resource endowments, agricultural economic development levels, and agricultural infrastructure, it is essential to explore the heterogeneous effects across different dimensions. This study analyzes heterogeneity based on regional division, geographical location, and grain functional zones. Specifically, the country is divided into eastern, central, and western regions for the regional division. The impact of rural digitalization on AGTFP is estimated separately for these regions, as shown in Table 7.
Table 7.
Heterogeneity Test.
- Heterogeneity Across Eastern, Central, and Western Regions
Following the regional classification framework established by the National Bureau of Statistics of China and widely adopted in academic research (Li et al., 2022; Wolfert et al., 2017), this study divides China’s provinces into three regions:
Eastern China: Beijing, Tianjin, Hebei, Liaoning, Shanghai, Jiangsu, Zhejiang, Fujian, Shandong, Guangdong, and Hainan. Central China: Shaanxi, Jilin, Heilongjiang, Anhui, Jiangxi, Henan, Hubei, and Hunan. Western China: Inner Mongolia, Guangxi, Chongqing, Sichuan, Guizhou, Yunnan, Shaanxi, Gansu, Qinghai, Ningxia, and Xinjiang.
The regional heterogeneity analysis results show that rural digitalization’s impact on AGTFP shows significant spatial differences. The INDIG coefficient in the eastern region is 0.151, which is significantly positive at the 5% significance level, indicating that rural digitalization significantly promotes AGTFP. This result is consistent with the regional characteristics of the eastern region, such as the superior economic foundation, complete digital infrastructure system, high digital literacy level of agricultural operators, and agglomeration of scientific research institutions with technology spillover effects.
In comparison, the central region (0.133) and the western region (0.137) showed positive effects but did not reach the statistical significance level. The central region has shown a positive impact with its relatively complete digital infrastructure and moderate economic development level. The fact that the coefficient of the western region did not reach significance reflects the constraints faced by the region in terms of digital penetration, infrastructure construction, and accessibility of agricultural resources. However, the positive coefficient of the western region suggests its potential for latecomer advantage. Absorbing the technological spillover effects of the eastern and central regions is expected to accelerate the digitalization process and gradually narrow the regional development gap.
- 2.
- Heterogeneity Between Southern and Northern Regions
The analysis also uncovers notable differences between southern and northern provinces. In the south, the coefficient of lndig is 0.170 and significant at the 1% level, highlighting the substantial impact of rural digitalization on AGTFP. Southern provinces have historically led in digital village construction, with earlier adoption and faster progression of digital technologies in agriculture. This advantage, more substantial economic support, and mature e-commerce ecosystems contribute to the positive effect.
In the north, the coefficient of lndig is negative (−0.006) and not statistically significant. This suggests that digitalization has yet to exert a meaningful impact on AGTFP in northern regions. Contributing factors include slower adoption of digital technologies, lower levels of rural digital literacy, and the region’s focus on traditional farming methods. Systemic improvements in digital infrastructure and capacity-building initiatives are crucial to enhancing the effectiveness of digital village construction in the north.
- 3.
- Heterogeneity Across Grain Functional Zones
The impact of rural digitalization on AGTFP varies significantly across grain functional zones. In grain-producing regions, the coefficient of lndig is 0.113 and highly significant at the 1% level, indicating that digital technologies play a critical role in improving productivity through precision agriculture and efficient resource allocation. In grain-marketing regions, the coefficient is 0.162 and significant at the 10% level, reflecting the benefits of digitalization in reducing transaction costs and enhancing supply chain efficiency.
In grain-balance regions, the coefficient of lndig is 0.197, which is significant at the 10% level. This suggests that digitalization also supports agricultural productivity in these areas, though to a lesser extent than producing and marketing zones. The weaker effects in balance zones may be attributed to a less pronounced focus on agricultural production and trade and greater reliance on external support for technology diffusion.
Our heterogeneity analysis reveals that regional economic structures and institutional environments fundamentally shape the effectiveness of digital village initiatives. The significant positive effects in eastern regions (coefficient = 0.151, p < 0.05) and southern provinces (coefficient = 0.170, p < 0.01) reflect the role of agglomeration economies and institutional complementarities in technology adoption, consistent with endogenous growth theory’s emphasis on increasing returns to scale (Acemoglu, 2009).
The varying impacts across grain functional zones, particularly the significant effects in major grain-producing areas (coefficient = 0.113, p < 0.01), demonstrate how resource endowment structures influence the returns to digital transformation. As Li et al. (2022) document, regions with stronger institutional foundations exhibit path dependency in digital adoption, where market depth and complementary capabilities create self-reinforcing mechanisms for continued innovation. This pattern aligns with technological innovation theory’s focus on cumulative learning and institutional evolution (Nelson & Winter, 1982).
Overall, the heterogeneity results underscore the varying degrees of rural digitalization’s impact on AGTFP, influenced by regional and functional disparities in economic conditions, infrastructure development, and agricultural priorities. These findings highlight the importance of tailored policies and strategies to address different regions’ and functional zones’ specific needs and challenges, fostering balanced and inclusive agricultural development and verifying Hypothesis 4.
6.4. Impact Mechanism Test
We conduct a comprehensive mechanism analysis using two approaches to investigate the specific mechanisms through which digital village construction affects AGTFP. First, we decompose AGTFP into two components—green technology efficiency (eff) and green technology progress (tech)—and examine the impact of digital village construction on each element separately (columns 1–2). Second, we employ a three-step mediation analysis to test the heterogeneity analysis, which reveals dynamic changes in policy effectiveness across regions over time, as well as the mediating roles of both rural human capital (lnedu) and agricultural informatization (lninf) (columns 3–6). For each mediator, we examine (a) the impact of digital village construction on the mediator, (b) the effect of the mediator on AGTFP, and (c) the direct effect of digital village construction on AGTFP while controlling for the mediator. The results presented in Table 8 report the coefficient estimates and significance levels for each mechanism test.
Table 8.
Mechanism of Impact Test.
1. Green Technology Efficiency (eff) and Green Technology Progress (tech).The impact of digital village construction on green technology efficiency is insignificant (column 1) due to the following interrelated factors: First, from a micro perspective, small farmers generally cannot apply digital technology. This is reflected in the significant correlation between farmers’ digital technology acceptance and the regional development level, which restricts the effective application of advanced technology in agricultural production. This can also be verified from the heterogeneity analysis in Table 7. Due to the high level of digital literacy in the eastern region, the promotional effect of digital village construction on AGTFP is more significant (the coefficient is 0.151, significant at the 5% level).
Second, from the institutional level, there are structural barriers in the rural land system. The current land contract system and high transfer costs hinder the large-scale concentration of farmland, which is not conducive to the large-scale application of digital technology. This can be seen from Table 7—The coefficient of the main production area (0.113) is significantly higher than that of other regions, indicating the importance of large-scale operations to the application of digital technology.
Third, from the market level, the imperfect development of the agricultural market system, especially the lack of a market-oriented allocation mechanism, reduces farmers’ enthusiasm for adopting digital technology. This is reflected in information asymmetry and imperfect price mechanisms, which significantly restrict the effect of agricultural digital transformation. This can also be confirmed by the benchmark regression results in 6.1 of the articles—the coefficient of the agricultural price index (lnapi) is significantly positive, indicating that the market mechanism has an important impact on technical efficiency.
These factors jointly weaken the potential of digital village construction to improve the efficiency of green technology. This conclusion is consistent with the article’s theoretical analysis framework and is supported by empirical results.
Column (2) demonstrates that digital village construction significantly and positively influences green technology progress. This reflects the ability of digital village initiatives to drive the development and adoption of green technologies. By fostering research and development (R&D) in green technologies, accelerating their dissemination, and promoting the adoption of innovative practices, digital village construction actively propels green technological advancements. Therefore, Hypothesis 1a was not confirmed, while Hypothesis 1b was confirmed.
2. Mediation Effects. The mediation effect of digital village construction through rural human capital and agricultural informatization is analyzed in columns (3) to (6).
Column (3) shows that the coefficient of digital village construction is 0.291, significant at the 1% level, indicating that digital village initiatives enhance rural human capital. Column (4) further reveals that rural human capital positively and significantly affects AGTFP, with a coefficient of 0.115 (significant at the 5% level). Together, these results suggest that digital village construction positively impacts AGTFP by improving rural human capital.
In columns (5) and (6), the coefficients of digital village construction and agricultural informatization are 0.313 and 0.040, respectively, significant at the 1% and 5% levels. This indicates that digital village construction promotes agricultural informatization, contributing positively to AGTFP. Agricultural informatization helps allocate resources accurately, improves decision-making capacity, and accelerates the adoption of advanced technologies, thus supporting sustainable growth in agricultural productivity.
The results in columns (3) to (6) suggest that digital villages support AGTFP by promoting rural human capital development and advancing agricultural informatization and that digital villages provide a platform for skill building and technology diffusion, enabling rural communities to adopt more efficient and sustainable agricultural practices. These findings confirm the mediating role of human capital and informatization in promoting the positive impacts of digital village building on AGTFP, thus validating Hypotheses 2 and 3. Further, to improve the efficiency of green technologies in agriculture, targeted interventions are needed to increase digital literacy, reduce institutional barriers in land transfer, and develop integrated agricultural markets.
7. Findings and Policy Recommendations
7.1. Findings
The study examines the impact of digital village construction on China’s AGTFP and draws the following main conclusions:
- Promoting AGTFP
Digital village construction significantly increases AGTFP by promoting green technological progress. However, its impact on technological efficiency is limited by factors such as barriers to land transfer and insufficient digital literacy.
- 2.
- Role of Mechanisms
Agricultural informatization and rural human capital are crucial mediators. Digital initiatives optimize resource allocation, enhance market efficiency, and improve rural education and skill levels, facilitating better adoption of sustainable technologies.
- 3.
- Regional Variations
The positive effects of digital village construction are most pronounced in eastern regions due to superior infrastructure and higher digital adoption rates. Central and western regions show weaker impacts, reflecting infrastructure and economic development disparities.
- 4.
- Temporal Patterns
AGTFP has generally increased over the study period, peaking in 2018. However, persistent regional disparities highlight the uneven progress between developed and less developed areas.
- 5.
- Importance for Grain Functional Zones
Major grain-producing regions benefit most from digital village construction, underscoring its critical role in bolstering food security and advancing sustainable agricultural practices.
7.2. Policy Recommendations
- Promote the integrated development of digital green
The construction of a digital village has significantly promoted the progress of green technology, but there are still certain limitations in improving technical efficiency. It is necessary to strengthen the promotion of precision agriculture and smart agriculture technology, develop suitable digital agricultural technology according to the resource endowment and agricultural characteristics of different regions, establish an agricultural environment monitoring system, optimize resource utilization efficiency, and reduce the negative impact of agricultural production on the environment. At the same time, agricultural industries are encouraged to adopt green production technology and promote digital technology’s application in the whole agricultural production chain.
- 2.
- Improve institutional support for land transfer and large-scale management
Empirical results show that land institutional barriers limit the large-scale application of digital technology in agriculture. It is necessary to deepen the rural land transfer system reform, reduce the cost of land transfer, promote large-scale land management, and create conditions for the promotion of digital technology. At the same time, strengthen the role of agricultural cooperatives in the promotion of digital technologies, establish a comprehensive agricultural service platform covering production, circulation, and services, promote the market-oriented allocation of agricultural factors, optimize the efficiency of resource flow, and improve the overall technical efficiency of agricultural production.
- 3.
- Strengthen the construction of agricultural informatization
Agricultural informatization plays an important intermediary role in promoting AGTFP through the construction of a digital village. A comprehensive information platform covering production, market, and technical services should be built to make agricultural production decisions more scientific and accurate. In response to regional agricultural problems, develop localized digital applications to solve specific challenges in agricultural production, promote the construction of agricultural e-commerce platforms, broaden the sales channels of green agricultural products, and enhance the enthusiasm of farmers to adopt green production technologies.
- 4.
- Build a multi-level human capital cultivation system
Rural human capital is an important intermediary mechanism for digital village construction to promote green agricultural development. Establish a tiered and categorized digital skills training mechanism and set up digital agriculture demonstration bases in major food-producing areas. Make full use of the technological advantages of universities, research institutes, and leading agricultural enterprises to establish a talent training mechanism for school-local synergy and industry-education integration and enhance the capacity of rural human capital to absorb and transform digital technology.
- 5.
- Implement differentiated regional development strategies
Regional heterogeneity analysis shows significant differences in the impact of digital village countryside construction on AGTFP in the eastern, central, and western regions. The eastern region will take digital technology innovation as the lead and improve the digital agricultural innovation system; the central and western regions will increase digital infrastructure investment and improve the agricultural information service system, establishing an interregional digital agricultural technology transfer mechanism, promoting the diffusion of advanced experience from the east to the central and western regions, and constructing a platform for regional synergistic development to realize the optimal allocation of digital resources.
7.3. International Implications of the Study
Based on China’s provincial panel data, this study explores the impact of digital village construction on AGTFP, which has the following theoretical and practical value to the international academic community: First, it expands the research scope of existing literature in terms of research perspective. Global research on digital agriculture is mainly concentrated in developed countries such as Europe and the United States, and large-sample empirical research on developing countries is relatively scarce. Second, it provides important empirical evidence in terms of empirical results. The study found significant regional heterogeneity in the impact of digital village construction on AGTFP. This heterogeneity is reflected in the more significant promotion effect in the eastern region and the main grain-producing areas, which provides an important reference for other countries to formulate digital agricultural development strategies. Third, a replicable analytical framework is constructed regarding research methods, laying a methodological foundation for subsequent international comparative studies. In addition, considering the differences between different countries regarding the agricultural development stage, resource endowment, and institutional environment, this provides a new research direction for deepening cross-national comparative studies.
Author Contributions
Author Contributions: Conceptualization, L.X., D.T. and S.R.; methodology, L.X. and D.T.; software, L.X.; validation, L.X., D.T. and S.R.; formal analysis, L.X.; resources, L.X. and S.R.; data curation, L.X.; writing—original draft preparation, L.X.; writing—review and editing, L.X., D.T. and S.R.; visualization, L.X. and S.R.; supervision, D.T. and S.R. All authors have read and agreed to the published version of the manuscript.
Funding
This research received no external funding.
Informed Consent Statement
Not applicable.
Data Availability Statement
The data used in this study are publicly available. National statistical data were obtained from the National Bureau of Statistics of China (https://data.stats.gov.cn/english/, accessed on 1 March 2025) for the period 2012–2024, including national and provincial statistical yearbooks, China Rural Statistical Yearbook, and China Agricultural Yearbook. Additional data sources include the Alibaba Research Institute’s Taobao Village Research Report (2013–2023), Beijing University Digital Inclusive Finance Index (2013–2023), United Nations population data (2024), and the Food and Agriculture Organization (FAO) World Food Situation Report (2024). No new datasets were created during this study. All data used are from publicly accessible sources and are fully referenced in the reference list.
Conflicts of Interest
The authors declare no conflict of interest.
References
- Acemoglu, D. (2009). Introduction to modern economic growth. Princeton University Press. [Google Scholar]
- Alibaba Research Institute. (2023). China Taobao village research report (2013–2023). Available online: https://www.alibabagroup.com/en/news/research/taobao-village-report (accessed on 1 March 2025).
- Central Committee of the Communist Party of China, State Council. (2019). Digital village development strategy outline. Available online: https://english.www.gov.cn/ (accessed on 1 March 2025).
- Chambers, R. G., Serra, T., & Stefanou, S. E. (2015). Using ex-ante output elicitation to model state-contingent technologies. Journal of Productivity Analysis, 43(3), 329–345. [Google Scholar] [CrossRef]
- CPC Central Committee and State Council. (2018). Opinions of the CPC Central Committee and the State Council on implementing the rural revitalization strategy. Available online: http://www.gov.cn/zhengce/2018-01/03/content_5253361.htm (accessed on 1 March 2025).
- Cyberspace Administration of China. (2023). Digital rural development guidelines 2.0. CAC Press.
- Dubey, A., & Lal, R. (2009). Carbon footprint and sustainability of agricultural production systems in Punjab, India, and Ohio, USA. Journal of Crop Improvement, 23(4), 332–350. [Google Scholar]
- European Commission. (2020). Farm to fork strategy—For a fair, healthy, and environmentally-friendly food system. Available online: https://food.ec.europa.eu/horizontal-topics/farm-fork-strategy_en (accessed on 28 February 2025).
- FAO. (2024). World food situation: Cereal supply and demand brief. Available online: https://www.fao.org/worldfoodsituation/csdb/zh/ (accessed on 28 February 2025).
- Gong, S., Jiang, L., & Yu, Z. (2025). Can digital human capital promote farmers’ willingness to engage in green production? Exploring the role of online learning and social networks. International Journal of Environmental Research and Public Health, 21(4), 1852. [Google Scholar] [CrossRef] [PubMed]
- Guo, H. (2019). The spatial and temporal differentiation of China’s agricultural green total factor productivity and growth path [Doctoral dissertation, China University of Petroleum (East China)]. [Google Scholar]
- Hu, Y., Yu, H., & Yang, X. (2023). Can rural human capital improve agricultural ecological efficiency? Empirical evidence from China. Sustainability, 15(16), 12317. [Google Scholar] [CrossRef]
- Huang, W., & Wang, X. (2024). The Impact of technological innovations on agricultural productivity and environmental sustainability in China. Sustainability, 16, 8480. [Google Scholar] [CrossRef]
- Huang, X., Feng, C., Qin, J., Wang, X., & Zhang, T. (2022). Measuring China’s agricultural green total factor productivity and its determinants considering carbon emissions. Science of The Total Environment, 838, 156374. [Google Scholar]
- IPCC. (2007). Climate change 2007: Mitigation of climate change. Contribution of Working Group III to the fourth assessment report of the intergovernmental panel on climate change. Cambridge University Press. [Google Scholar]
- IPCC. (2022). Climate change 2022: Mitigation of climate change. Contribution of Working Group III to the sixth assessment report of the intergovernmental panel on climate change. Cambridge University Press. Available online: https://www.ipcc.ch/report/ar6/wg3/ (accessed on 28 February 2025).
- Klerkx, L., Jakku, E., & Labarthe, P. (2019). A review of social science on digital agriculture, smart farming and agriculture 4.0: New contributions and a future research agenda. NJAS-Wageningen Journal of Life Sciences, 90, 100315. [Google Scholar]
- Li, X., Chandel, R. B. S., & Xia, X. (2022). Analysis on regional differences and spatial convergence of digital village development level: Theory and evidence from China. Agriculture, 12(2), 164. [Google Scholar] [CrossRef]
- Liu, D., Zhu, X., & Wang, Y. (2021). China’s agricultural green total factor productivity based on carbon emission: An analysis of evolution trend and influencing factors. Journal of Cleaner Production, 278, 123692. [Google Scholar] [CrossRef]
- Liu, S., Zhu, S., Hou, Z., & Li, C. (2023). Digital village construction, human capital and the development of the rural older adult care service industry. Frontiers in Public Health, 11, 1190757. [Google Scholar]
- Liu, Y., Ma, X., Shu, L., Hancke, G. P., & Abu-Mahfouz, A. M. (2020). From industry 4.0 to agriculture 4.0: Current status, enabling technologies, and research challenges. IEEE Transactions on Industrial Informatics, 17(6), 4322–4334. [Google Scholar]
- Lu, D., Zhang, X., Yang, D., & Zhang, S. (2025). What affects agricultural green total factor productivity in China? A configurational perspective based on dynamic fuzzy-set qualitative comparative analysis. Agriculture, 15, 136. [Google Scholar] [CrossRef]
- Lu, S., Zhuang, J., Sun, Z., & Huang, M. (2024). How can rural digitalization improve agricultural green total factor productivity: Empirical evidence from counties in China. Heliyon, 10(2), e24492. [Google Scholar]
- Lucas, R. E. (1988). On the mechanics of economic development. Journal of Monetary Economics, 22(1), 3–42. [Google Scholar]
- Ma, W., Renwick, A., & Grafton, Q. (2020). Farm machinery use, off-farm employment and farm performance in China. Australian Journal of Agricultural and Resource Economics, 64(1), 87–109. [Google Scholar]
- Ministry of Agriculture and Rural Affairs, Department of Rural Economy. (2024). China rural e-commerce development report 2023. Available online: http://english.moa.gov.cn/ (accessed on 1 March 2025).
- National Bureau of Statistics of China. (2024). National database. 2012–2024. Available online: https://data.stats.gov.cn/english/ (accessed on 1 March 2025).
- Nelson, R. R., & Winter, S. G. (1982). An evolutionary theory of economic change. Harvard University Press. [Google Scholar]
- Peking University Digital Finance Research Center. (2023). Digital financial inclusion index of China (2013–2023). Available online: https://en.idf.pku.edu.cn/achievements/index.htm (accessed on 1 March 2025).
- Romer, P. M. (1990). Endogenous technological change. Journal of Political Economy, 98(5), S71–S102. [Google Scholar] [CrossRef]
- Romera, A. J., Sharifi, M., & Charters, S. (2024). Digitalization in agriculture: Towards an integrative approach. Computers and Electronics in Agriculture, 217, 108084. [Google Scholar]
- Schumpeter, J. A. (1942). Capitalism, socialism and democracy. Harper & Brothers. [Google Scholar]
- Tang, Y., & Chen, M. (2022). The impact mechanism and spillover effect of digital rural construction on the efficiency of green transformation for cultivated land use in China. Land, 11(12), 2219. [Google Scholar]
- Tone, K., & Tsutsui, M. (2010). An epsilon-based measure of efficiency in DEA—A third pole of technical efficiency. European Journal of Operational Research, 207(3), 1554–1563. [Google Scholar]
- United Nations, Department of Economic and Social Affairs, Population Division. (2024). World population prospects 2024. Available online: https://population.un.org/wpp/ (accessed on 1 March 2025).
- United States Department of Agriculture (USDA). (2024). Agriculture INNOVATION Mission for Climate (AIM4C). Available online: https://www.aimforclimate.org/ (accessed on 28 February 2025).
- Vahdanjoo, M., Sørensen, C. G., & Nørremark, M. (2025). Digital transformation of the agri-food system: Challenges and opportunities. Journal of Rural Studies, 107, 177–189. [Google Scholar]
- Wang, Z., Wu, Z., & Wei, L. (2024). Effects of fiscal support for agriculture on grain production technical efficiency: Empirical evidence from Chinese farms. Journal of Applied Economics, 27(1), 2347687. [Google Scholar] [CrossRef]
- Wolfert, S., Ge, L., Verdouw, C., & Bogaardt, M. J. (2017). Big data in smart farming—A review. Agricultural Systems, 153, 69–80. [Google Scholar]
- World Bank. (2024). World development report 2024: Agriculture in the digital age. World Bank. [Google Scholar]
- Zhang, Y. F., Ji, M. X., & Zheng, X. Z. (2023). Digital economy, agricultural technology innovation, and agricultural green total factor productivity. Sage Open, 13(3), 21582440231194388. [Google Scholar] [CrossRef]
- Zhu, H., & Chen, H. (2023). Level measurement, spatiotemporal evolution and promotion path of China’s digital rural development (in Chinese). Issues in Agricultural Economy, 3, 21–33. [Google Scholar]

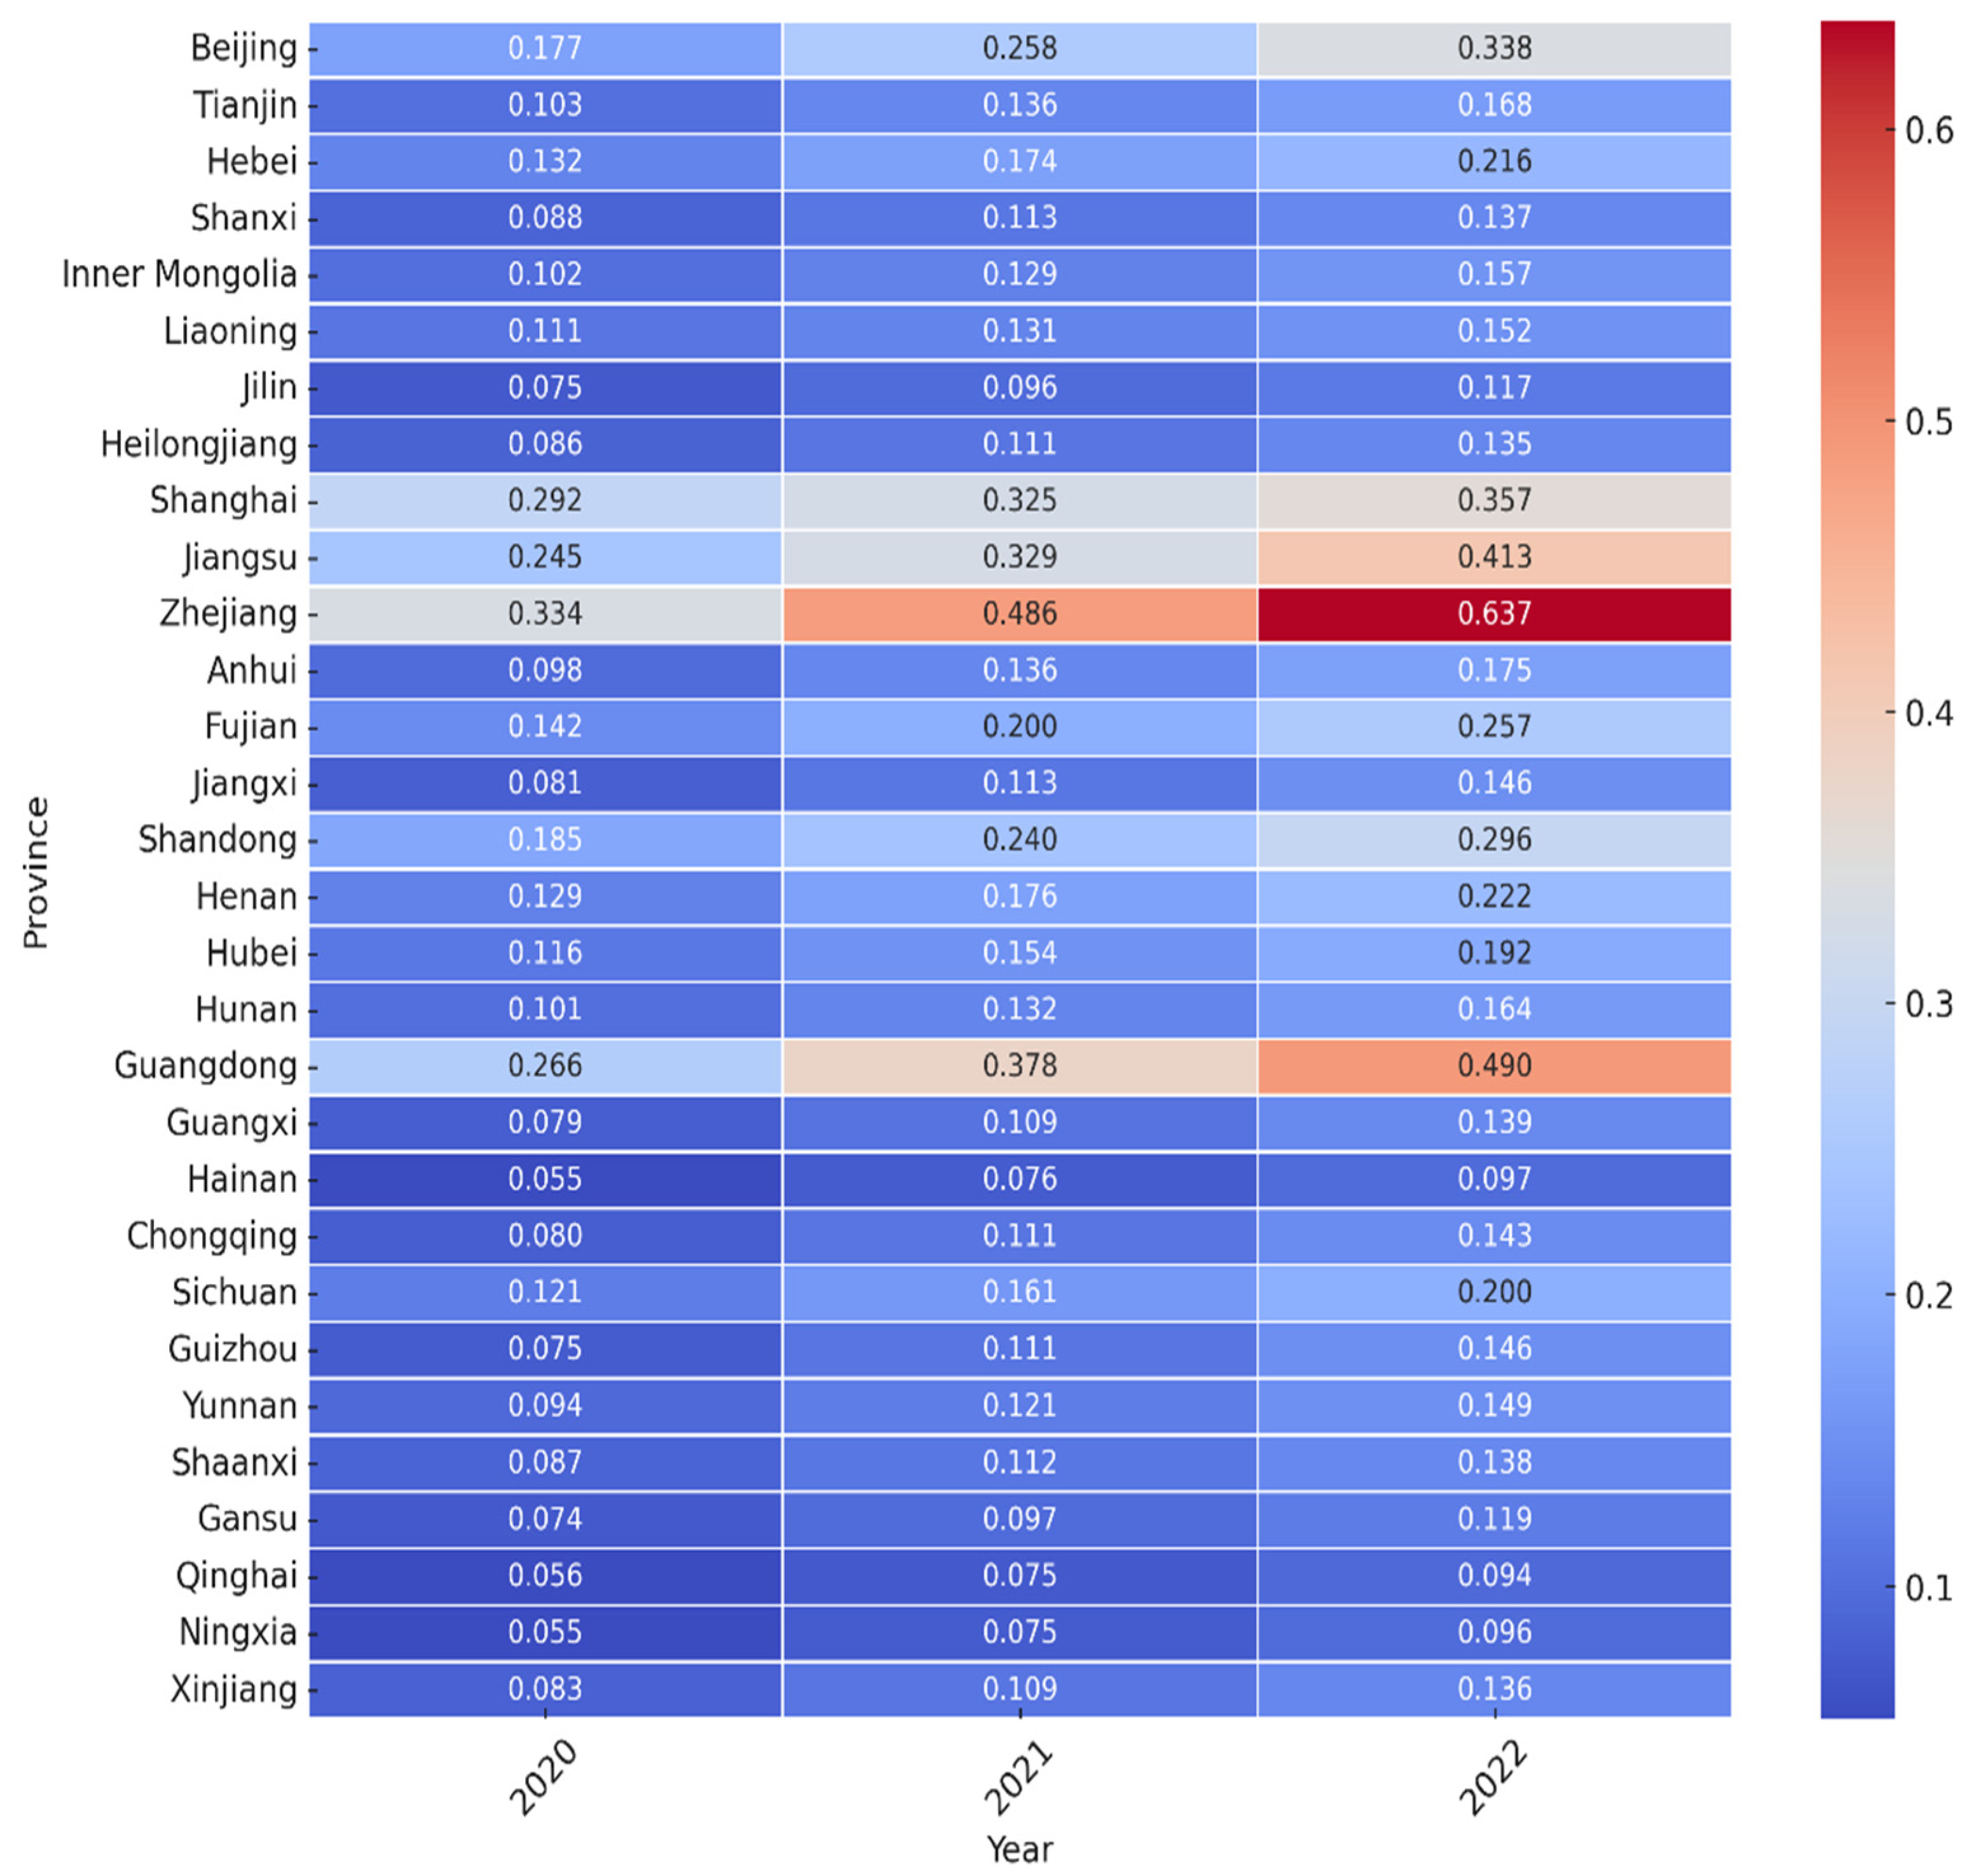
Disclaimer/Publisher’s Note: The statements, opinions and data contained in all publications are solely those of the individual author(s) and contributor(s) and not of MDPI and/or the editor(s). MDPI and/or the editor(s) disclaim responsibility for any injury to people or property resulting from any ideas, methods, instructions or products referred to in the content. |
© 2025 by the authors. Licensee MDPI, Basel, Switzerland. This article is an open access article distributed under the terms and conditions of the Creative Commons Attribution (CC BY) license (https://creativecommons.org/licenses/by/4.0/).