Article

The Role of Food Processing in Sustaining Food Security Indicators in the Kingdom of Saudi Arabia

by
Fahad Abdelaziz Almohaimeed
* and
Khaled Ahmed Abouelnour
*
Department of Finance, College of Business and Economics, Qassim University, Buraydah 52571, Saudi Arabia
*
Authors to whom correspondence should be addressed.
Economies 2025, 13(3), 84; https://doi.org/10.3390/economies13030084
Submission received: 24 January 2025 / Revised: 3 March 2025 / Accepted: 5 March 2025 / Published: 20 March 2025

Abstract

:
This research aims to explain the role of food processing in improving the sustainability of food security under the framework of ‘Goal 2’ associated with the Sustainable Development Goals (SDGs). The research methodology relied on descriptive and quantitative analysis methods, where the VAR model was used. The key findings reveal that food manufacturing reduces malnutrition rates and increases the level of exports and capital investment, contributing to enhancing the level of sustainability of food security in the Kingdom of Saudi Arabia (KSA). Increasing food production reduces the prevalence of severe food insecurity. Malnutrition in the KSA is not due to a shortage in production of food quantities; rather, it is due to the consumption pattern of the population, and unhealthy food habits and traditions. The food production index does not cause a difference between exports and imports, as there is no dependence of imports and exports on food production. Likewise, the food production index does not cause a change in the value of capital investment in food and beverage factories. The increase in food production and, investment in food processing, and the decrease in the difference between food imports and exports by 10% for one lag period led to a decrease in the proportion of malnourished people in the total population by about 0.25%, 1.7%, and 1.33%, respectively. Moreover, these variables led to a decline in the prevalence of severe food insecurity by 0.3%, 0.66%, and 0.4%, respectively, and led to an increase in the food production index by 1.62. The study recommends that more emphasis should be given to increasing food processing and encourages local and foreign investment in this area to maintain sustainable food security indicators in the KSA.

1. Introduction

Food manufacturing in the Kingdom of Saudi Arabia (KSA) plays a pivotal role in enhancing food security indicators, by bridging the gap between agricultural production and consumer food needs. Food manufacturing not only improves food preservation and safety, but also contributes to reducing food waste by 33% and costs the country about USD 10.7 billion annually, according to the statistics of the ministry of Water, Environment and Agriculture for the year 2023. The size of the food services market in Saudi Arabia is estimated at USD 27.2 billion in 2024, and is expected to reach USD 42.48 billion by 2029, at a CAGR of 9.34% during the forecast period (2024–2029) (Mordorintelligence, 2024). Therefore, the KSA Vision 2030 led the actual transformation to enhance the sustainability of food security by supporting production sectors, developing systems, improving agricultural productivity, enhancing research and innovation capabilities, and transforming the Grain Corporation into the General Authority for Food Security to preserve the KSA’s needs for basic commodities and pumping more supply into the markets (Al-Badr, 2023). Vision 2030 in KSA set an ambitious goal to achieve 85% localization of food production by 2030, which creates excellent investment opportunities for food and beverage producers to meet the untapped local demand for dairy, meat, and fruit products. The Food Industries Institute was also established in 2011 with the aim of qualifying specialized and professional Saudi cadres in the food industries, with an annual investment of USD 9.6 million, where the number of beneficiaries of this initiative was more than 3300 young people until 2022 (Platform, 2024).
The KSA has launched some initiatives to achieve self-sufficiency, maintain food supplies, and address the challenges of climate change and water scarcity, to contribute towards improving food security indicators (Platform, 2024). Examples of these initiatives are the Red Palm Weevil Prevention and Control Program, an effective program for strategic food reserves and storage, including an early warning system and information for agricultural markets; a strategy and an executive plan for responsible Saudi agricultural investment across the border; and a national program to reduce food loss and waste based on international standards, experiences, and good practices (Ministry of Environment, Water & Agriculture, 2023). These initiatives had a significant impact on achieving water and food security, by encouraging livestock and fish farmers, bee and honey farmers, poultry projects, and greenhouses. In addition, the Public Investment Fund established specialized companies to support the production of some crops in the regions where crops thrive. There are approximately 1616 food and beverage production facilities in the KSA, with a capital of USD 31.7 billion, and about 198.4 thousand workers (General Authority for Statistics, 2024). The share of food, beverages, and tobacco, according to World Bank statistics, was 13.14% of the added value in manufacturing in the KSA during 2020. In light of the above, Saudi Arabia was able to achieve progress in global food security indicators, as it jumped two places in the International Food Security Index by the end of 2022, to occupy 41st place globally with 69.9 points, compared to 43rd place in 2021 with 68.1 points, while maintaining its 6th place among Arab countries for two consecutive years, crowning the KSA’s plans for achieving sustainable food security and self-sufficiency (Index, 2022).
The main concept of this research is based on the improvement in food security indicators that can result from the improvement and availability of food security in the country, which considers improving food manufacturing, and also increasing the difference between the level of food exports and imports in favor of exports. This has positive impact on providing food security, and thus positive effects on the sustainability of food security in the country. The framework of this study also includes the problems of water scarcity and the nature of dry desert lands in the KSA, where agricultural production becomes limited, which makes providing food security dependent on imports along with domestic production, which poses some difficulties and challenges to providing food security without relying on multiple factors such as food manufacturing. Therefore, this research focuses on finding out to what extent the food manufacturing affects the sustainability of food security in the KSA.
The main goal of this study is to identify the role of food processing in improving the sustainability of food security indicators in the KSA and the opportunities for developing them. This topic relates to the ninth goal of the United Nations Charter for Sustainable Development, which focuses on the sustainability of food security. As stated within the content of that goal, it focuses on industry processes, innovation, and institutional structures, which make the research objective consistent with the national transformation strategy and programs of the Kingdom’s Vision 2030.
The importance of this research revolves around the fact that the food manufacturing process plays a vital role in supporting the food security system in most countries, especially the countries that have the ability to create infrastructure, diverse investments, and advanced companies in the field of food manufacturing to produce and trade goods, and a fertile environment that encourages the expansion of supply chains in order to enhance food security. All countries are trying to work to improve food security indicators, which are concentrated in four basic elements: availability, ability, abundance, and goods that are safe from a health standpoint. From this standpoint, and also since this research is related to the KSA’s achievement of the second goal of the United Nations Sustainable Development Goals, the research presented here will highlight the interest of food manufacturing in terms of the sustainability and stability of food security in the KSA. Which pays more attention to the role of industrialization in how to develop it. On the other hand, how to link manufacturing to food security indicators that help identify sustainability factors and how to deal with them in order to stabilize food security in countries where agricultural production is limited due to lack of water (including the KSA) is included in the scope of this study. The findings of this study introduce new literature and scientific contributions, and the empirical work reveals fresh evidence that supports food sustainability. The finding of this study will also offer certain recommendations for policymakers and, the organizations, such as the Authority for Nutrition and Medication, the Food Security Unit in the Ministry of Agriculture and Water, food manufacturers, and food exporters and importers in the KSA, in supporting the sustainability of food processing in the KSA, and in other countries that have a special interest in the field of food sustainability in general.
This research study is organized as follows: Section 1 presents the introduction of the study (including the research problem, research goal, and research importance), background of the study, literature review, research gap, hypotheses, and research objectives. Section 2 reports the methodology (including data sources, variables, and model specifications). Section 3 presents the results, Section 4 includes a discussion on the results, and Section 5 concludes the study and presents policy recommendations.

1.1. Background and Literature Review

The key advantages of food processing include the following:
  • Food Safety: (A) Techniques such as pasteurization and sterilization effectively eliminate harmful pathogens, significantly reducing foodborne illnesses (Singh et al., 2023). (B) Processing methods like refrigeration and drying help preserve food, preventing spoilage and waste (Knorr, 2024).
  • Nutritional enhancement: (A) Processing alters food structures, enhancing the bioavailability of nutrients, making them easier to digest and absorb (“Food Processing and Its Impact on Food Structure, Digestion, and Absorptionwhich in turn confirms the importance of food processing in improving the sustainability of food security” (Knorr, 2024). (B) Processed foods can be fortified with essential vitamins and minerals, addressing nutritional deficiencies in populations (Knorr, 2024).
  • Convenience and accessibility: (A) Processed foods are often ready-to-eat or require minimal cooking, catering to busy lifestyles (Dobre et al., 2024). (B) The processing sector supports a stable food supply chain, making diverse foods accessible to various populations (Broad, 2024).
While food processing has clear benefits, it is essential to consider the potential downsides, such as nutrient loss and the prevalence of ultra-processed foods, which may contribute to health issues. Balancing these perspectives is crucial for informed dietary choices. As long as food self-sufficiency and citizens’ wellbeing depend on sustainable food security, food security will remain a global priority. An ideal food security indicator should capture all the four food security dimensions at the individual level, as the Food and Agriculture Organization has established. Brief (2006) stated four dimensions, availability, access, utilization, and stability, as a guide to improving the sustainability of food security. Berry et al. (2015) indicated that sustainability must be integrated as an explicit fifth dimension of food security.
Sustainable food security was discussed in 1993 by Speth (1993). It was mentioned that sustainable development should encompass aspects of food, agriculture, and people. Findiastuti et al. (2017) indicated that sustainable food security measures how a region provides food for its people without endangering the environment. Sustainability can be considered as a precondition for long-term food security. The environment, and especially climate and the obtainability of natural resources, are preconditions for the availability of food as well as the preservation of biodiversity (Sperling & McGuire, 2012). The three dimensions of sustainability—social, economic, and environmental—also ensure the stability of the systems on which constancy of the other dimensions of food security depends.
On the other hand, the relationships are reciprocal, as food security is considered increasingly as a condition for sustainability (Findiastuti et al., 2017). Jolly Masih et al. (2017) indicated that the sustainability of food security indicators relies on their ability to adapt to changing conditions, such as climate change and government policies, while effectively measuring availability, access, utilization, and stability across different economies to ensure long-term food security. The sustainability of food security indicators includes factors from production, distribution, consumption, and import substitution. The Food Security Sustainability Index (IFS) quantifies these influences, allowing for a comprehensive assessment of food security sustainability across different regions and conditions (Antamoshkina & Rogachev, 2020). According to Findiastuti et al. (2017), the sustainability of food security indicators encompasses food availability, access, utility, and stability, while integrating environmental impacts. Gustafson et al. (2016) proposes seven metrics for sustainable nutrition security, including food nutrient adequacy, ecosystem stability, food affordability, sociocultural wellbeing, food safety, resilience, and waste reduction, each comprising multiple indicators to assess the sustainability of food security outcomes, which confirms that improving food security indicators can be considered as evidence of improving the sustainability of food security.
Food security encompasses four main components. These include (1) food availability: the key elements of food availability are production, distribution, and exchange (Arshad & Shafqat, 2012). (2) Food accessibility: the key elements of food accessibility are (A) physical accessibility, which includes proximity to food outlets (Abubakari, 2018), and transportation (Strome et al., 2016). (B) Economic accessibility, which includes the a affordability of food and food assistance programs (Samygin, 2021). (C) Social and policy dimensions, which includes community engagement (Wixey et al., 2010) and policy implications (Bao, 2017). (3) Food utilization key components of food utilization are (A) proteins (Ackerson & Mussehl, 1947), (B) minerals (Ackerson & Mussehl, 1947), and (C) fats and carbohydrates (Das, 2021). (4) Food stability: key elements of food stability are (A) molecular dynamics and structure (Fundo & Silva, 2018), (B) food preservation techniques (Mukhopadhyay et al., 2017), and (C) system resilience (Rimhanen et al., 2023).
Processed food production can mitigate food insecurity by reducing losses in the supply chain and enhancing food safety, nutrient content, and shelf life (Augustin et al., 2016). It enables the supply of safe, affordable, and nutritious options. Processed food production can also increase availability and affordability, potentially reducing food insecurity, which can have positive effects on the sustainability of food security (Black, 2016). Heien (1983) emphasizes that productivity in food processing can raise the food production index through increased efficiency and demand for processed food products. Riccardi et al. (2024) also emphasizes that intensive food production, driven by processed food methods, increased food availability. (Ohiokpehai, 2003) indicated that food processing enhances agricultural development by reducing food losses and improving nutrition. This dual effect at the household level contributes positively to the food production index and supports industrialization in agriculture. Processed food production plays a crucial role in reducing malnutrition by enhancing food preservation, minimizing waste, and ensuring stable food supply. Sustainable food systems developed through efficient processing techniques can provide healthier diets, addressing chronic hunger and malnutrition effectively. This could have repercussions on the sustainability of food security.
Augustin et al. (2016) indicated that food processing plays a crucial role in enhancing food security by reducing losses, improving nutrient content, and extending the shelf life, which collectively contribute to providing safe, affordable, and nutritious foods, ultimately helping to reduce malnutrition in vulnerable populations. Sustainable food security has been demarcated in seven areas: nutrition, environment, food affordability and availability, social and cultural well-being, resilience, food safety, and waste (Chen et al., 2019). Sustainability should be a key component of food security, because out of the 17 UN Sustainable Development Goals, 10 were related to food sustainability, which emphasizes the importance of studying food security indicators (Willett et al., 2019). Access to food can be ensured through improved storage and transportation techniques over long distances and applying innovative manufacturing practices, such as using food waste to produce animal feed, thus reducing food waste and improving food security (Damini, 2023).
Owusu et al. (2022) found a positive and statistically significant relationship between food production (both crop and livestock) and malnutrition levels in sub-Saharan Africa. Mughal and Fontan Sers (2020) indicate that a 1% increase in cereal production and yield in South Asia is associated with up to a 0.84% decrease in undernourishment rates. Saleh (2015) indicated that increasing total food output is essential to meet the nutritional needs of the growing population. Without sufficient food production, malnutrition and hunger will persist, affecting a significant percentage of the global population facing starvation. Cleaver (2012) indicated that investment in food processing can lead to agricultural productivity growth, which is correlated with poverty reduction and improved nutrition. Ashok (2022) found that food processing enhances the nutritional quality of food products, making them more accessible and appealing. This is crucial in addressing micronutrient deficiencies, which affect over two billion people globally, which in turn, confirms the relationship between food security indicators and an improvement in the sustainability of food security. Marson et al. (2023) indicated that cereals’ trade openness, particularly imports, significantly impacts food security, contributing to lower undernourishment prevalence in developing countries. A higher reliance on food imports may correlate with reduced malnutrition rates among the population. Baryshnikova et al. (2019) indicated that countries with high food imports often struggle with malnutrition due to insufficient domestic production and low labor productivity, leading to a high proportion of malnourished individuals, particularly in less developed agrarian countries. Higher food production typically leads to improved food availability, which can decrease food insecurity levels. For instance, countries with robust agricultural systems often report lower Global Hunger Index (GHI) scores. Also, investments in food processing can improve the supply chain, reduce food losses, and increase the availability of nutritious foods, thereby addressing food insecurity, which affects the sustainability of food security. Grabowski (2016) emphasizes that investment in raising agricultural productivity is crucial for developing labor-intensive manufacturing. A higher food production index leads to cheaper labor, facilitating the expansion of manufacturing, thus establishing a direct relationship between investment in food manufacturing and food production. Despite the positive effects of food processing on reducing the prevalence of food insecurity, it may sometimes cause negative effects, by contributing to food insecurity by making nutrient-poor foods more affordable and accessible, undermining local food systems, and displacing small farmers. The production of processed foods often prioritizes inexpensive calorie sources with minimal nutritional value, contributing to food insecurity and malnutrition, particularly in low- and middle-income countries. This result can help support the sustainability of food security indicators.
This trend exacerbates hidden hunger and dietary deficiencies, affecting vulnerable populations globally (Dwyer & Drewnowski, 2017). Also, food insecurity, particularly in recently urbanized areas, is exacerbated by the consumption of ultra-processed foods (UPF), as affordability issues lead to substituting fresh foods with UPF, thereby impacting overall nutrition and health outcomes (Sato et al., 2020). Food processing can also affect food security negatively, where it relies on a limited number of crops, which can undermine local food systems and biodiversity (Sousa, 2008). According to Temesgen (2015), emissions and waste from food processing, through reduced soil fertility, water purity, and reduced crop productivity, are a long-term threat to sustainable food security. Otekunrin (2024) and Mozumdar (2012) indicated that an increase in agricultural productivity directly contributes to food security by enhancing food availability, which reduces the prevalence of severe food insecurity. A study by Mirza et al. (2023) suggested that food production and the food production index are closely related. A study by Ding et al. (2021) indicated that investment in food manufacturing significantly influences the food production index, which has an indirect relationship with the sustainability of food security.
Kompas et al. (2024) established that a reduction in food production directly increases the number of people with severe food insecurity. Alkunain et al. (2024) indicated that investment expenditure significantly impacts food availability in the KSA. Enilolobo et al. (2023) identified unidirectional causality between agricultural exports and food security, as well as between agricultural imports and food security.

1.2. Research Gap

Through clarification of and, reviewing the methods and analysis of the results of previous studies, it is possible to deduce and identify the research gap acting in the previous studies. These studies haves explored various dimensions of food security; however, they mostly focused on addressing food security indicators, which haves an indirect impact on food sustainability in general, while the specific role of food processing on the sustainability of food security indicators has not been adequately addressed, especially in the KSA. Therefore, this study can be distinguished from previous studies and which includes a more comprehensive analysis studying the interdependence between the role of food processing, malnourished people, the sustainability of the prevalence index of severe food insecurity (FINS), and the sustainability of the food production index (FPI), where there is a lack and scarcity of research on sustaining food security indicators in the Kingdom of Saudi Arabia. This research is also based on two basic considerations: the first consideration is knowing to what extent food manufacturing affects food security indicators in the Kingdom, and the second consideration is the sustainability of food security to the extent of its impact or repercussions on food security indicators in the Kingdom of Saudi Arabia, as the literature indicates that improving food security is naturally reflected in food security indicators. So, this study focused on measuring this variable, its relations, and interdependence in order to ensure that the expected research results will be of more use and benefit for policymakers and different entities related to food security in the KSA and other countries. This study serves to support food sustainability in the Kingdom of Saudi Arabia within the fourth goal of the United Nations’ Sustainable Development Goals.

1.3. Research Idea and Study Hypotheses

The idea of this research stems from within the framework of achieving the second goal of the Sustainable Development Goals (SDGs), especially in the sustainability of food security. Therefore, the idea of this research is based on the improving food security indicators as a results of the improvements occurring in food processing and the availability of food security in the country. Increasing the level of food insecurity and the percentage of undernourished people has a negative impact on the sustainability of food security. It was considered that improving food manufacturing, capital investment in food and beverage factories, and also increasing the difference between the level of food exports and imports in favor of exports has a positive impact on providing food security, and thus they can have positive effects on the sustainability of food security in the country. Therefore, based on the theoretical and empirical literature reviewed, the following hypotheses were developed:
H1. 
There is a negative relationship between the prevalence of severe food insecurity (FINS) as a dependent variable, and a set of independent variables, i.e., FP, CF, and DIMEX. The development of this hypothesis is based on studies by Augustin et al. (2016), Broad (2024), and Ashok (2022).
H2. 
There is a negative relationship between the index of the percentage of undernourished people in the total population (NO) as a dependent variable, and a set of independent variables, i.e., FP, CF, DIMEX. This hypothesis developed on the arguments given in studies by Marson et al. (2023), Marson et al. (2023), and Ohiokpehai (2003).
H3. 
There is a positive relationship between the Food Production Index (FPI) and the quantity of food production (FP) as a dependent variable and, CF and DIMEX, as independent variables. This hypothesis was based on studies Sousa (2008), Temesgen (2015), Mirza et al. (2023), and Kompas et al. (2024).
The research hypotheses will be tested using an ordinary least squares (OLS) regression model, and the results will provide valuable insights for related parties and policymakers aiming to enhance food processing and sustaining food security indicators in the KSA.

1.4. Research Objectives

The goal of this study is to find out the effect of food processing on sustaining food security indicators in KSA in 2000–2022). Therefore, the research attempts to estimate the degree and rank of the KSA in terms of the components of the food security index, and the role of food manufacturing sector in supporting and providing sustainable food security in the KSA. The VAR Model is used, to study the causal relationship between variables related to food manufacturing in the KSA and indicators related to the sustainability of food security.

1.5. Features of Food Manufacturing, Food Availability, and the Food Security Index in KSA

1.5.1. Description of Food Manufacturing Sector in the KSA

The food industry in the KSA has generated an income worth approximate USD 15.9 billion in 2023 (Insights, 2024). According to an estimation, revenues in the food market will reach USD 58.73 billion in 2023, and they are expected to grow annually by 4.27% (CAGR 2023–2028) (Insights, 2024).
Figure 1 illustrated that the quantity of processed food in Saudi Arabia in 2022 was estimated at 16.34 million tons. Vegetables comprise the largest share (25.7%), followed by bread and cereal products (22.9%), dairy products and & eggs (16.8%), and fruits and nuts (10.7%). The least contributing processed food groups to the quantity of processed food were oils and fats, spreads and sweeteners, and pet food, comprising (1.8%), (0.6%), and (0.4%) respectively.
According to 2022 data, the number of existing food industry factories is 1616, including 1320 food factories, and 296 beverage factories. The capital of these factories is about USD 31.7 billion, of which USD 25.4 billion is related to food factories, and USD 6.3 billion is related to beverage factories contrast, the number of workers in the food industry is 198,383, including 150,367, workers in food factories and 48,016 workers in beverage factories (General Authority for Statistics, 2024). Table 1 depicts the value of exports of the food manufacturing industry.
Table 2 presents the production of major food groups in Saudi Arabia from 2015 to 2022.

1.5.2. The Degree and Rank of the KSA in the Components of the Food Security Index

Table 3 shows the development of general food security indicators for the KSA within 113 countries. The table showed that there is an improvement in the general food security index, as it rose from 65.3% in 2015 to 69.9% in 2022 (ranked 41st globally), with a percentage increase of about 7.04%. As for the main indicators of food security, the value of the food affordability index reached about 88.2% in 2015 and then declined to about 83.2% in 2022 (ranked 40th globally), with a rate of decrease of about −5.7%. In contrast, the value of the food availability index reached about 55% in 2015 and rose to 67.2% in 2022 (ranked 23rd globally), with a growth rate estimated at about 22.2%. As for the food quality and safety index, its value reached 78.1% in 2015 and then decreased to 71.6% in 2022 (ranked 49th globally), with a rate of decrease of about −8.3%. As for the Sustainability and Adaptation Index, its value reached 53.3% in 2022 (ranked 57th globally), with an increase of approximately 61.3%. It is noted in the above that there is an improvement in the main indicators of food security in Saudi Arabia, with the exception of the ability to afford food and the quality and safety of food.

2. Methodology

2.1. Data Sources and Variables

For the current study, the data of the following variables were collected:, the percentage of malnourished people in the total population (NO) (%), the prevalence of severe food insecurity (FINS) (%), and food production index (FPI) 2004 = 100 as dependent variables, food production quantity (FP) (thousand tons), the difference between the quantity of food imports and exports (DIMEX) (thousand tons), the value of investment in food manufacturing (capital of food and beverage factories) (CF) (million riyals) were, independent variables.
The data were collected from the Central Bank of Saudi Arabia, the General Authority for Statistics, and the National Center for Industrial Information, Food Industries Polytechnic, Arab Agricultural Statistics Yearbook, Food and Agriculture Organization Statistics, Global Food Security Index (GFSI), Unified National Platform, and World Bank data. The descriptive analytical approach was used, including tabular presentation, percentages, and arithmetic averages, when reviewing the description of the food manufacturing sector in the Kingdom of Saudi Arabia, as well as when reviewing food security indicators in the KSA. OLS wase used because it provides the best linear unbiased estimator and accessibility to interpret the relationship between the independent and dependent variables. The estimated coefficients show how independent variables in this model affect the sustainability of food security.

2.2. Model Specification

The research used the Vector Autoregressive (VAR). A number of estimates and tests were used, for example, Unit Root Test, selection of the lag length, application of Johansen-Juselius methodology for testing joint integration, and estimation of the VAR model, as well as statistical tests to verify the validity of the estimated model. This model also has the ability to interpret research results efficiently, which increases the credibility of research results. These results can then be used to derive recommendations, which represent a scientific addition in the field of food manufacturing and the sustainability of food security indicators in general.

2.3. Key Features of VAR Models

Multivariate framework: VAR models analyze multiple time series simultaneously, capturing the interactions between them, such as the relationship between stock prices and Bitcoin prices (Zeng, 2024).
Lagged relationships: the model incorporates lagged values of all variables, allowing for the examination of both short-term and long-term effects (Suyanto, 2023).
Time-varying coefficients: Recent advancements include time-varying VAR models, which allow coefficients to change over time, enhancing the model’s adaptability to evolving economic conditions (Gao et al., 2024).
The first step in VAR modeling is to test whether the variable time series are stationary by using Unit root test.
The purpose of conducting the unit root test is to determine the properties of the time series of the model variables during the 2000–2022 period to ensure their stationarity and to determine the rank of each integration of each variable separately. To conduct this test, the research relied on the augmented Dickey-Fuller (ADF) test (Dickey & Fuller, 1981).
The unit root test is performed using three regression equations (Gujarati, 2009).
Without   a   fixed   limit   and   without   a   time   trend   Y t = ρ Y t 1 + u t
Having   only   a   fixed   limit   Y t = a + ρ Y t 1 + u t
Having   a   fixed   limit   and   a   time   trend   Y t = a + a 1 ρ Y t 1 + u t
The ADF hypothesis is as follows:
H 0 ρ = 0 u n i t   r o o t H 1 ρ 0 n o   u n i t   r o o t
The second step in VAR modeling is to estimate via test using Johansen-Juselius methodology:
A cointegration test is a statistical method used to determine whether a set of non in this paper, the Johansen cointegration test was applied. Cointegration trends are determined within the framework of the Johansen-Juselius methodology through two tests: (Johansen, 1988).
(a)
Trace Test (trace λ), which takes the following form:
λ t r a c r = T i = r + 1 k ln 1 λ i
The null hypothesis (r = 0) is tested against the alternative hypothesis (r = 1). If the calculated maximum probability rate value is less than the critical value, the null hypothesis is accepted, which means that the cointegration vectors are equal to zero. However, if the calculated value is greater than the critical value, the alternative hypothesis is accepted, which means that the number of vectors is greater than zero, which means that there is cointegration between the model variables.
(b)
Maximum Eigen Values Test (max):
λ t r a c r = T i = r + 1 k
If the calculated value of the maximum likelihood rate is greater than the table value (critical), we reject the null hypothesis and accept the alternative hypothesis (r = 1), which states that there is at least one vector for joint integration, and vice versa if we accept the null hypothesis and reject the alternative hypothesis.
The third step in VAR modeling is to determine the lag length:
Before estimating the equation of the VAR model, the number of lags for this model should be determined using the (VAR Lag Order Selection Criteria), which is based on several criteria, to determine the best models. The lowest lag periods value was chosen for any of the thesis’s criteria: Log Likelihood Function (LIF), Akaike Information Criterion (AIC), Log Akaike Information Criterion (LAIC), Akaike Final Prediction Error (FPE), Log Schwarz Criterion (LSC), Schwarz Criterion (Sc), and Hannan–Quinn Criterion (HQ).
The fourth step in VAR modeling is estimating the VAR Equations.
The equations of the proposed model were estimated by using the ordinary least squares (OLS), as follows:
l n F I N S 1 . t = α 1 + j = 1 k β 1 . j l n F I N S 1 , t j + J = 1 K δ 1 . j l n F P I 1 , T j + j = 1 k ε 1 , J l n N O 1 , T J + J = 1 K θ 1 l n F P 1 , T J + J = 1 K μ 1 , J l n D I M E X 1 , T J + i = 1 k π 1 , j l n N O 1 , T J + u 1 t
This equation measures the effect of food production quantity (FP), the difference between the quantity of food imports and exports (DIMEX), and the value of investment in food manufacturing (capital of food and beverage factories) (CF) on the prevalence of severe food insecurity (FINS) (%). This equation also tests the first hypothesis of the research.
l n F P I 1 . t = α 1 + j = 1 k β 2 . j l n F I N S 1 , t j + J = 1 K δ 2 . j l n F P I 1 , T j + j = 1 k ε 2 , J l n N O 1 , T J + J = 1 K θ 2 , J l n F P 1 , T J + J = 1 K μ 2 , J l n D I M E X 1 , T J + i = 1 k π 2 , j l n N O 1 , T J + u 1 t
This equation measures the effect of food production quantity (FP), the difference between the quantity of food imports and exports (DIMEX), and the value of investment in food manufacturing (capital of food and beverage factories) (CF) on food production index (FPI) 2004 = 100 as dependent variables. This equation also tests the second hypothesis of the research.
l n N O 1 . t = α 1 + j = 1 k β 3 . j l n F I N S 1 , t j + J = 1 K δ 3 . j l n F P I 1 , T j + j = 1 k ε 3 , J l n N O 1 , T J + J = 1 K θ 3 , J l n F P 1 , T J + J = 1 K μ 3 , J l n D I M E X 1 , T J + i = 1 k π 3 , j l n N O 1 , T J + u 1 t
This equation measures the effect of food production quantity (FP), the difference between the quantity of food imports and exports (DIMEX), and the value of investment in food manufacturing (capital of food and beverage factories) (CF) on the percentage of malnourished people in the total population (NO) (%). This equation also tests the third hypothesis of the research.
This study used some diagnostic tests to check the quality of the VAR model in estimating the relationship between the variables of the study, such as inverse roots of AR characteristic polynomial, Jarque–Bera test to ensure the normal distribution of the residual’s series, Breusch–Godfrey to test for serial correlation through the LM test, and Heteroskedasticity test to test the instability of the residuals’ variance.
After establishing the relationships among the variables, it is crucial to understand the direction of these associations, so we used Granger Causality Test:
The Granger Causality Test is used in most time series studies. Random variable X causes the random variable Y if there is information in the past of X that is useful in predicting Y, and this information is not present in the past of Y. This test used to test the null hypothesis that there is no causal relationship between the variables X and Y.
There are four possibilities for the directions of causality (Gourieroux, 2000):
-
Unidirectional causality: X causes Y.
-
Bidirectional causality: X and Y cause each other.
-
Instantaneous causality: This means that the present value of X causes the present value of Y.
-
Lagging (forward) causality: This means that the past value of X causes the present value of Y.
-
The direction of causality between two economic variables can be determined by estimating the following two equations:
Y t = β 0 + α 0 X t + i = 1 m α i X i + j = 1 n β j Y t 1 + U t
X t = Y 0 + δ i Y t + i = 1 m Y i X t i + j = 1 n δ j Y t j + V t

3. Results

3.1. VAR Analysis Results

3.1.1. Unit Root Test (Test of Stability of the Time Series Ranks of the Model Variables)

Table 4 indicates that all the research variables are unstable at level I(0), because the value of the statistical probability level is greater than 0.05. These variables are stable at the first difference I(1). This implies that there was an absence of temporal fluctuations assuring the authenticity of subsequent statistical tests, eliminating the possibility of inconsistent results. Since the time series of the variables studied are integrated to the same degree I(0), it is likely that there is cointegration between the research variables. Therefore, a VAR model could be constructed to describe the influence relationship among variables.

3.1.2. Cointegration Test

Since all variables are stable at first difference I(1), we can use the cointegration test to determine the long-term equilibrium relationships between the model variables, according to the Johansen and Juselius methodology under the following assumptions:
Null   hypothesis no   cointegration , H 0 β = δ = ε = θ = μ = π
Alternative   hypothesis long-run   cointegration ;   H 1 β δ ε θ μ π
Table 5 indicates that the eigenvalues are greater than the critical values at 5%, whether when estimating the impact test or when estimating the maximum value of the cointegration test. Therefore, we can reject the null hypothesis that there is no cointegration between the model variables, and thus accept the alternative hypothesis that there are at most four cointegration vectors at a significance level of 5%. This result also confirms the existence of a long-term equilibrium relationship between the series of the variables. Thus, it can be verified that the VAR model is of practical significance in quantitatively expressing the relationship between variables of food processing and the variables of sustainability food security indicators. Therefore, we move to the next step in the analysis, which is estimating the VAR model.

3.1.3. Determining the Optimal Deceleration Period

Table 6 shows that the number of lag degrees in the model is one degree, according to the delay degrees that give the lowest value for the LR, FPE, AIC, SC, and HQ criteria. This means that the number of parameters in the VAR model was the most appropriate at this time, and the model parameters could be estimated effectively.

3.1.4. Analysis of VAR Equations

-
The Role of Food Processing in the Sustainability of Percentage of Malnourished People Out of the Total Population (NO)
Table 7 shows the quality of the estimated model, as the adjusted coefficient of determination value reached about 0.798, and the significance of the estimated model as a whole according to the result of the Fisher test, as the F-statistic value reached about 14.9.
-
The Role of Food Processing in the Sustainability of Prevalence Index of Severe Food Insecurity (FINS)
Table 8 shows the quality of the estimated model, as the adjusted coefficient of determination value reached about 0.937, as well as the significance of the estimated model as a whole according to the result of the Fisher test, as the F-statistic value reached about 14.9.
-
The Role of Food Processing in the Sustainability of Food Production Index (FPI)
Table 9 shows the quality of the estimated model, as the value of the adjusted coefficient of determination reached about 0.9217, and the significance of the estimated model as a whole according to the result of the Fisher test, as the value of the F-statistic reached about 41.9.
It is noted in the equations in Table 7, Table 8 and Table 9 that the regression coefficients for most of the variables are not significant. This lack of significance is explained by the fact that in such models, the number of parameters is large due to the lag periods, and significance here is not very important, because the main goal of such models is to study the kinetic behavior of the variables, study causality, and the response of the variables to each other.

3.1.5. Diagnostic Tests for VAR Model

-
Testing the Stability of the Estimated VAR Model
All values of the inverse roots fall within the boundary circle, which confirms that the estimated model is stable. This also means that all coefficients are less than one, which means that the model does not suffer from the problem of autocorrelation or non-constancy of variance. This indicates that the constructed VAR model was stable, and it was reasonable and effective for quantitatively representing the effect of LU and PREP on AWRs in the YRB with the VAR model. The results are presented in Table 10.
-
Testing the Normal Distribution of the Model
To ensure the normal distribution of the residuals series and adopt the null hypothesis, the Jarque-Bera test (Bera & Jarque, 1981) is used, which combines the Skewness and Kurtosis tests. It is clear in Table 11 that the Jarque-Bera values for all residuals are less than the table value, as their values are greater than 0.05, and this is confirmed by the Prob. values, which means that the null hypothesis is not rejected for each of the residuals of the estimated model, i.e., all residuals follow the normal distribution.
-
Autocorrelation Test of Residuals (Ljung & Box, 1978)
Table 12 shows the results of the autocorrelation test, which indicates that we cannot reject the null hypothesis. This means that there is no autocorrelation in the case of two lag periods at a significance level of 0.05. This is because the probability value prob. estimated at about 0.134 in one lag period, is greater than the significance level of 0.05. This ultimately means that the model is free from the problem of serial correlation of errors at the statistical probability levels (0.01, 0.05).
-
Testing the Instability of the Residuals’ Variance (Heteroskedasticity)
In the data in Table 13, it is clear that the probability value reached about 0.289, which is not significant, and therefore we cannot reject the null hypothesis, i.e., the variance of the random error term is constant and there is no correlation between the residuals and the independent variables included in the model at the statistical probability levels (0.01 and, 0.05).

3.2. Causality Test

Causality means ‘the change in the current and past values of a variable due to the change in another variable’ (Granger, 1988), his test is used to test the null hypothesis that there is no causal relationship between the variables according to Granger, and each of the internal research variables was tested as an external variable. The results are shown in Table 14.

3.2.1. The Causal Relationship Between the Percentage of Those Suffering from Malnutrition (NO) of the Total Population and Some Variables Related to Food Processing

Neither the percentage of those suffering from malnutrition (NO) nor the amount of food production (FP) cause the other. This means that malnutrition is not due to a shortage in food production in the KSA, but rather to other factors that may be related to income, the population’s consumption patterns, and unhealthy food habits and traditions that cause malnutrition despite the availability of locally produced food products. The percentage of those suffering from malnutrition (NO) causes the difference between the amount of food exports and imports (DEXIM), while the opposite is not true. The relationship between the percentage of those suffering from malnutrition (NO) and the value of investment in food processing (factory capital food and beverages (CF) is a common causal relationship, and each causes the other.

3.2.2. The Causal Relationship Between the Prevalence of Severe Food Insecurity (FINS) and Some Variables Related to Food Manufacturing

The prevalence of severe food insecurity (FINS) and both the quantity of food production (FP) and the difference between the quantity of food imports and exports (DIMEX) do not causes each other. The value of investment in food manufacturing (capital of food and beverage factories) (CF) causes the prevalence of severe food insecurity (FINS), while the opposite is not true.

3.2.3. The Causal Relationship Between the Food Production Index (FPI) and Some Variables Related to Food Manufacturing

The food production index (FPI) and both the difference between the quantity of food exports and imports (DEXIM) and the value of investment in food manufacturing (capital of food and beverage factories) (CF) do not causes each other. The food production index (FPI) causes the amount of food production (FP), but the reverse is not true.
The food production index (FPI) does not cause a change in the value of capital investment in food and beverage factories (CF).

4. Discussion

This study investigates the asymmetries in the effects of food processing in sustaining food security indicators in the KSA by employing a VAR approach under the framework of (Goal 2) associated with the Sustainable Development Goals (SDGs). The results of the VAR model and causality test are discussed as follows:

4.1. Discussion the Results of the VAR Model

When measuring the impact of some economic variables on the indicator of the percentage of malnourished people out of the total population in KSA during the 2000–2022 period, the findings of the current research are consistent with the previous studies, such as those by Owusu et al. (2022), Saleh (2015), Cleaver (2012), Baryshnikova et al. (2019), Mughal and Fontan Sers (2020), Kompas et al. (2024), Alkunain et al. (2024), and Enilolobo et al. (2023). The empirical results of the understudy shows a negative relationship between the quantity of food production in the previous period and the percentage of malnourished people out of the total population. When increasing the quantity of food production by 10% for a previous period, the percentage of malnourished people out of the total population decreases by 0.25%. This illustrates the importance of food processing and its positive impact on reducing malnutrition. By increasing the value of investment in food manufacturing by 10%, the percentage of malnourished people out of the total population decreases by 1.7%. It is evident from this that increasing investment in food manufacturing is playing a positive role in reducing malnutrition rates and thus contributing to increasing the level of sustainability of food security in the KSA. By decreasing the difference between the quantity of food imports and exports by 10%, the percentage of malnourished people out of the total population in KSA decreases by about 1.32% during 2000–2022. It is evident from this that increasing the level of exports resulting from local food manufacturing operations in the KSA has a positive impact on reducing malnutrition rates, which proves that food manufacturing has positive effects on increasing the level of food security sustainability by reducing malnutrition rates and providing local products that can replace food imports and shifting to exporting the surplus of local consumption needs. This confirms the need to invest more in the local food manufacturing in order to reduce the level of malnutrition, achieve sustainable food security, and increase food exports in a way that simultaneously supports exporting companies and the national economy. These results support Second research hypothesis.
When measuring the impact of some economic variables on the Prevalence Index of Severe Food Insecurity KSA during the understudy period, the findings of the current study are consistent with previous studies by Otekunrin (2024) and Mozumdar (2012), while the results of this study indicated that there is a negative relationship between the quantities of food production for the previous period and the prevalence of severe food insecurity. When increasing the quantity of food production by 10% for the previous period, the prevalence of severe food insecurity decreases by 0.3%. This indicates the importance of increasing food production to reduce the prevalence of severe food insecurity, i.e., achieving sustainable food security in the KSA. Increasing the value of investment in food manufacturing by 10% led to the prevalence of severe food insecurity decreases by 0.66%, which helps to achieve sustainable food security by increasing the size of food producing assets such as vertical and horizontal expansion in food production plants and diversification in food production, which works to provide the food commodities traded and available in the Saudi market and, at the same time, helps to achieve sustainable food security. A 10% decrease in the difference between the quantity of food imports and exports reduces the prevalence of severe food insecurity in KSA by about 0.4%. This means that reducing the gap between exports and imports in favor of exports means more production directed toward export, i.e., increasing the export of food surpluses beyond the need for local consumption means increasing production, which supports food security. This indicates the positive impact on the sustainability of food security in Saudi Arabia. These results also support H2. By measuring the impact of some economic variables on the indicator of food production index in KSA during the 2000–2022 period, the results of the study indicate that when increasing the quantity of food production by 10% for a previous period, the food production index increases by 1.62%; when increasing the value of investment in food manufacturing by 10%, the food production index increases by 0.78%. This result is consistent with the findings of the study by Otekunrin (2024), Mirza et al. (2023), and Ding et al. (2021). A decrease in the difference between the quantity of food imports and exports by 10% leads to an increase in the food production index in KSA by about 2.26% in 2000–2022. We conclude that there is a trend toward reducing dependence on food imports to ensure the sustainability of food security in KSA by increasing the number of food production plants; increasing investments; improving the level of technology; developing supply chains, transportation, storage, and logistics related to food production; and rationalizing imports and developing exports in accordance with the KSA’s Vision 2030, which confirms the need to focus on food production to support food security in the KSA. These results support the third research hypothesis.

4.2. Discussion the Results of Granger Causality Analysis

4.2.1. The Causal Relationship Between the Percentage of Those Suffering from Malnutrition of the Total Population and Some Variables Related to Food Processing

There is no relationship between the percentage of those suffering from malnutrition and the amount of food production, and neither of them causes the other. It can be concluded that malnutrition is not due to a shortage in food production in the KSA, but may be related to other factors, for example, income, consumption patterns, unhealthy food habits, and traditions that cause malnutrition despite the availability of locally produced food products.
The percentage of those suffering from malnutrition causes the difference between the amount of food exports and imports, it is worthwhile to note that the relationship between them is a unidirectional causal relationship. This indicates that malnutrition is the result of the Saudi consumer’s tendency or attraction to imported food products in large quantities, whether fully processed or semi-processed foods or those containing raw food materials, which then leads to an increase in the import side at the expense of widening the gap between exports and imports. Following such consumption patterns may be the cause of malnutrition, which causes an increase in the gap between exports and imports in favor of imports on the one hand. At the same time, increasing food imports under these consumption patterns does not cause malnutrition resulting from a shortage in the quantities of food offered and available in the local market. This may be represented by fast food producers from foreign companies operating in the Saudi market or companies that rely on the use of imported food inputs and raw materials to obtain food goods and products sold in the local market. Hence, the effect becomes one-way.
The relationship between the percentage of those suffering from malnutrition and the value of investment in food processing (factory capital food and beverages) is a common causal relationship, and each causes the other. It is evident from this that malnutrition resulting from the shortage of locally produced food prompts investors, manufacturers, and food producers to increase their production by expanding investment and the number of factories and food-producing assets, such as production lines. At the same time, increasing investment in food manufacturing reduces the level of malnutrition resulting from the shortage of locally produced and available quantities in the local market as a result of making more food supply available. This confirms the direct role played by investment in the food sector in achieving sustainable food security.

4.2.2. The Causal Relationship Between the Prevalence of Severe Food Insecurity and Some Variables Related to Food Manufacturing

There is no relationship between the prevalence of severe food insecurity and both the quantity of food production and the difference between the quantity of food imports and exports, and neither causes the other. This indicates the abundance of food products available in the local market in terms of the quantities and types required for consumption, as the prevalence of severe food insecurity did not lead to the production of locally produced food quantities, and, at the same time, did not lead to the import of food products due to a large supply tradable in the local market. The difference between exports and imports and the quantity of local food production also did not lead to the spread of food insecurity, as the latter only appears when there is a severe shortage in the quantities of food offered in the market, and thus a causal relationship between them did not appear. This indicates the abundance of food available in the Saudi market, which supports the sustainability of food security in the KSA.
The value of investment in food manufacturing causes the prevalence of severe food insecurity, while the opposite is not true, which means that the relationship between them is a unidirectional causal relationship. It is evident from this that although the volume of investments directed to factories is increasing, they focused on establishing factories, most of which have an infrastructure whose size does not match the food products required by the market. The lack of these investments leads to the spread of food insecurity, and this is confirmed by the increase in various food imports from multiple sources, meaning that the size of factory capital is not sufficient to meet the needs of the local market for total food products. On the other hand, severe food insecurity does not cause a change in the demand for investment because this relationship only appears at the minimum levels of production, and this is not present in the case of the Saudi market.

4.2.3. The Causal Relationship Between the Food Production Index and Some Variables Related to Food Manufacturing

There is no relationship between the food production index and the difference between the quantity of food exports and imports and the value of investment in food manufacturing, and neither causes the other. The food production index causes the amount of food production, and it is also noted that the relationship between them is a one-way causal relationship. This indicates that the food production index has no significant relationship with the difference between imports and exports, due to the existence of a semi-permanent gap in the part directed at the import-dependent consumption of fully manufactured food commodities for direct consumption, and the part directed to exports is small. Also, the food production index does not cause a difference between exports and imports, as there is no dependence of imports and exports on food production, as this gap persists in items that cannot be covered by local production.
The food production index does not cause a change in the value of capital investment in food and beverage factories, as the latter depends on the size of fixed assets and production lines, which are not included as a value causing food production, as they are fixed values that do not revolve around obtaining more food products produced. A group of other factors are also included in the calculation of the food production index that neutralize the effect of the variables studied. At the same time, the food production index causes more food production, as food production is one of the main components of the food production index, while food production is not responsible for the food production index, due to the existence of other factors, such as imports and other variables with distributional effects on each of them. This indicates the complexity of the process of food security sustainability, as it is affected by a large group of intertwined factors that have a reciprocal effect, either in one direction sometimes or in both directions. Given the above, the results of the research confirm the need to pay attention to the variables studied, as they are important factors that affect food security sustainability and work to achieve it, in addition to other factors that can be addressed in other research in the future.

5. Conclusions and Policy Recommendations

This study aims to identify the relationship between food processing and the sustainability of food security indicators in the Kingdom of Saudi Arabia under the framework of Goal 2 associated with the Sustainable Development Goals (SDGs). VR was applied for empirical estimations. The literature indicates that there is a research gap in studies that focus on food processing and the sustainability of food security indicators, which gives importance to the research topic. The main findings are:
Food manufacturing is of great importance in reducing malnutrition rates and thus contributing to increasing the level of sustainability of food security in the Kingdom. Also, increasing the level of exports resulting from local food manufacturing operations in the Kingdom has a positive impact on reducing malnutrition rates and providing local products that can replace food imports. Increasing food production reduces the prevalence of severe food insecurity, i.e., achieving sustainable food security in the KSA. Increasing investment in food manufacturing reduces the prevalence of severe food insecurity by increasing the size of food-producing assets such as vertical and horizontal expansion in food production plants and diversification in food production, which works to provide food commodities traded and available in the Saudi market and, at the same time, helps in achieving sustainable food security.
Malnutrition in the KSA is not due to a shortage in food production quantities, but is due to the consumption pattern of the population and unhealthy food habits and traditions, as well as the result of the Saudi consumer’s tendency or attraction to imported food products in a large way, whether fully manufactured or semi-manufactured foods or those containing raw food materials. The food production index does not cause a difference between exports and imports, as there is no dependence of imports and exports on food production. Likewise, the food production index does not cause a change in the value of capital investment in food and beverage factories.
The research results provide scientific contributions in the field of food processing and indicators of food security sustainability and encourage more research in the future. It is widely recognized that the role of food processing in sustaining food security indicators has positive effects on the sustainability through its distributional effects on the development of the food sector.
Therefore, it is suggested that future studies include some of the following topics: studies encouraging the private sector to invest in food and beverage manufacturing; research in the field of food quality, ensuring the quality of production and distribution, and securing supply chains; security indicators to enhance the sustainability of food security, especially in developing countries; establishing sustainability indicators for food security in developing countries; implementing research on modernization and technology transfer in food and beverage production factories; research on food industries in order to sustain food security and its impact on sustainability, with the interpretation of more detailed data to conduct more in-depth analyzes to clarify the impact of food industries especially in developing countries, in order to promote sustainable development within the framework of the United Nations recommendations for the international development agenda under SDGs.
Finally, the research introduces a package of recommendations that assist policymakers and institutions in enhancing and supporting the improvement in food processing and sustainability of food security in the KSA, as well as encouraging private investment in the food and beverage industries through facilitation packages, such as providing appropriate financing and investment incentives according to the needs of the local market; rationalizing food and beverage imports to benefit consumers and increase exports of food and beverage industries in excess of the needs of local consumption; Providing modern technology to tighten quality control and identify countries of origin for food and beverage imports to ensure the health and suitability of food to contribute to improving sustainable food security indicators; encouraging the trend toward localizing agricultural products, especially processed food products, developing their technologies, and training Saudi workers in the food manufacturing sector, which supports food security in the KSA; ensuring improved food delivery to all consumers, by developing sustainable, effective, and responsible systems for food packaging, storage, transportation, and delivery; establishing sustainable practices in food preparation and processing; creating flexible, scalable, and suitable models for food processing, preparation, delivery, and consumption in urban areas; developing food operations based on the principles of PAN (preferences, acceptance, and nutritional needs) of consumers, rationalizing and develop consumer behavior while improving transparency and gaining consumer confidence by providing unbiased information while tightening control and providing consumer protection devices more effectively and efficiently; working on integration along the food value chain by re-evaluating current food chains, and improving integration along the food supply chain to improve sustainability; providing more detailed data from the Ministry of Environment, Water and Agriculture, the Food and Drug Authority, and the Ministry of Industry on the status of the food and beverage manufacturing sector, supply chains, and logistics necessary to emphasize the need to conduct more studies and research on the causes of malnutrition and analyze consumption patterns to formulate a sound food policy and programs that support the components of sustainable food security in the KSA.

Author Contributions

F.A.A. and K.A.A. have contributed equally to this editorial. All authors have read and agreed to the published version of the manuscript.

Funding

This research received a small research grant from Qassim University, KSA.

Informed Consent Statement

Not applicable.

Data Availability Statement

The original contributions presented in the study are included in the article; further inquiries can be directed to the corresponding authors.

Acknowledgments

The authors gratefully acknowledge Qassim University, represented by the Deanship of Graduate Studies and Scientific Research, on the financial support for this research under the number (2023-SDGl-HSRC-36178) during the academic year 1445 AH/2023 AD.

Conflicts of Interest

The authors declare no conflict of interest.

References

  1. Abubakari, M. R. (2018). Towards an interdisciplinary approach to food accessibility research. Global Journal of Human-Social Science: H Interdisciplinary, 18(1), 13–24. [Google Scholar]
  2. Ackerson, C. W., & Mussehl, F. E. (1947). The utilization of food elements by growing poults. Historical Research Bulletins of the Nebraska Agricultural Experiment Station, Nebraska, United States (1913–1993). University of Nebraska. [Google Scholar]
  3. Al-Badr, A. b. N. (2023). Saudi food security from enhancement to sustainability. Journal of the Food Industries Polytechnic. Available online: https://magazine.fip.edu.sa (accessed on 12 August 2024).
  4. Alkunain, B., Elzaki, R. M., & Al-Mahish, M. (2024). Impact of the total expenditure shocks on food security: VAR model. Agricultural and Resource Economics: International Scientific E-Journal, 10(2), 290–315. [Google Scholar] [CrossRef]
  5. Antamoshkina, E., & Rogachev, A. (2020). The methodological approach to analyzing the food security sustainability in the context of import substitution. E3S Web of Conferences, 208, 03004. [Google Scholar] [CrossRef]
  6. Arshad, S., & Shafqat, A. (2012). Food security indicators, distribution and techniques for agriculture sustainability in Pakistan. International Journal of Applied Science and Technology, 2(5), 137–147. [Google Scholar]
  7. Ashok, K. (2022). Agriculture and allied sectors in nutritional security. Indian Journal of Agricultural Economics, 77(1), 96–119. [Google Scholar] [CrossRef]
  8. Augustin, M. A., Riley, M., Stockmann, R., Bennett, L., Kahl, A., Lockett, T., Osmond, M., Sanguansri, P., Stonehouse, W., Zajac, I., & Cobiac, L. (2016). Role of food processing in food and nutrition security. Trends in Food Science & Technology, 56, 115–125. [Google Scholar]
  9. Bao, Y. (2017). The geography of urban food access: Exploring the spatial and socioeconomic dimensions. The University of Arizona. [Google Scholar]
  10. Baryshnikova, N., Klimecka-Tatar, D., & Kiriliuk, O. (2019). The role of the foreign trade in ensuring food sacurity in the countries of the world: An empirical analysis. System Safety: Human-Technical Facility-Environment, 1(1), 867–874. [Google Scholar]
  11. Bera, A. K., & Jarque, C. M. (1981). Efficient tests for normality, homoscedasticity and serial independence of regression residuals: Monte Carlo evidence. Economics Letters, 7(4), 313–318. [Google Scholar] [CrossRef]
  12. Berry, E. M., Dernini, S., Burlingame, B., Meybeck, A., & Conforti, P. (2015). Food security and sustainability: Can one exist without the other? Public Health Nutrition, 18(13), 2293–2302. [Google Scholar] [CrossRef]
  13. Black, E. (2016). Globalization of the food industry: Transnational food corporations, the spread of processed food, and their implications for food security and nutrition. Available online: https://digitalcollections.sit.edu/cgi/viewcontent.cgi?article=3375&context=isp_collection (accessed on 7 November 2024).
  14. Brief, F. P. (2006). Food security (Issue 2). FAO Agriculture and Development Economics Division. [Google Scholar]
  15. Broad, G. M. (2024). Processed foods. In Oxford research encyclopedia of food studies. Oxford Research Encyclopedias. Available online: https://global.oup.com/academic/product/oxford-research-encyclopedia-of-food-studies-9780197762530?cc=sa&lang=en& (accessed on 7 November 2024).
  16. Chen, C., Chaudhary, A., & Mathys, A. (2019). Dietary change scenarios and implications for environmental, nutrition, human health and economic dimensions of food sustainability. Nutrients, 11(4), 856. [Google Scholar] [CrossRef]
  17. Cleaver, K. (2012). Investing in agriculture to reduce poverty and hunger: Scaling up in agriculture, rural development, and nutrition. International Food Policy Research Institute. Available online: https://www.scirp.org/reference/referencespapers?referenceid=3486929#:~:text=Cleaver%2C%20K.%20(2012)%20Investing%20in%20Agriculture%20to%20Reduce%20Poverty%20and%20Hunger%3A%20Scaling%20up%20in%20Agriculture%2C%20Rural%20Development%2C%20and%20Nutrition.%20International%20Food%20Policy%20Research%20Institute%2C%20Washington%20DC (accessed on 13 October 2024).
  18. Damini. (2023). Impact of food manufacturing on food sustainability and food security. Deskera. Available online: https://www.deskera.com/blog/impact-of-food-manufacturing-on-food-sustainability-and-food-security/ (accessed on 7 October 2024).
  19. Das, U. N. (2021). Structure–activity relationship between food components and metabolic syndrome. In Food structure and functionality (pp. 235–248). Elsevier. [Google Scholar]
  20. Dickey, D. A., & Fuller, W. A. (1981). Likelihood ratio statistics for autoregressive time series with a unit root. Econometrica: Journal of the Econometric Society, 49, 1057–1072. [Google Scholar] [CrossRef]
  21. Ding, G., Vitenu-Sackey, P. A., Chen, W., Shi, X., Yan, J., & Yuan, S. (2021). The role of foreign capital and economic freedom in sustainable food production: Evidence from DLD countries. PLoS ONE, 16(7), e0255186. [Google Scholar] [CrossRef] [PubMed]
  22. Dobre, I., Dimitriu, A., & Turcea, V.-C. (2024, November 7–8). The importance of the processing sector in the Agri-food industry. Competitiveness of Agro-Food and Environmental Economy, Bucharest, Romania. [Google Scholar] [CrossRef]
  23. Dwyer, J. T., & Drewnowski, A. (2017). Overview: Food and nutrition security. In Sustainable nutrition in a changing world (pp. 3–24). Springer Nature. [Google Scholar]
  24. Enilolobo, O., Babalola, B., Nnoli, I., Ajibola, A., & Okere, W. (2023). Food security in Africa: The role of agricultural import and export. Development (AJHSD), 3(1), 68–82. [Google Scholar]
  25. Findiastuti, W., Singgih, M., & Anityasari, M. (2017). Sustainable food security measurement: A systemic methodology. IOP Conference Series: Materials Science and Engineering, 193, 012053. [Google Scholar] [CrossRef]
  26. Fundo, J. F., & Silva, C. L. (2018). Microstructure, composition and their relationship with molecular mobility, food quality and stability. In Food microstructure and its relationship with quality and stability (pp. 29–41). Elsevier. [Google Scholar]
  27. Gao, J., Peng, B., & Yan, Y. (2024). Estimation, inference, and empirical analysis for time-varying VAR models. Journal of Business & Economic Statistics, 42(1), 310–321. [Google Scholar]
  28. General Authority for Statistics. (2024). Available online: https://www.stats.gov.sa/en/home (accessed on 8 October 2024).
  29. Gourieroux, C. (2000). Econometrics of qualitative dependent variables. Cambridge University Press. [Google Scholar]
  30. Grabowski, R. (2016). Food production and the growth of manufacturing: The case of Tanzania. International Journal of Social Economics, 43(10), 1049–1062. [Google Scholar] [CrossRef]
  31. Granger, C. W. (1988). Some recent development in a concept of causality. Journal of Econometrics, 39(1–2), 199–211. [Google Scholar] [CrossRef]
  32. Gujarati, D. N. (2009). Basic econometrics. McGraw-Hill. [Google Scholar]
  33. Gustafson, D., Gutman, A., Leet, W., Drewnowski, A., Fanzo, J., & Ingram, J. (2016). Seven food system metrics of sustainable nutrition security. Sustainability, 8(3), 196. [Google Scholar] [CrossRef]
  34. Heien, D. M. (1983). Productivity in US food processing and distribution. American Journal of Agricultural Economics, 65(2), 297–302. [Google Scholar] [CrossRef]
  35. Index, G. F. S. (2022). Exploring challenges and developing solutions for food security across 113 countries. Environment Systems and Decisions, 43, 143–160. [Google Scholar] [CrossRef]
  36. Insights, M. (2024). In statista market insights. Available online: https://www.statista.com/outlook/ (accessed on 11 November 2024).
  37. Johansen, S. (1988). Statistical analysis of cointegration vectors. Journal of Economic Dynamics and Control, 12(2–3), 231–254. [Google Scholar] [CrossRef]
  38. Jolly Masih, J. M., Amita Sharma, A. S., Leena Patel, L. P., & Shruthi Gade, S. G. (2017). Indicators of food security in various economies of world. Journal Agriculture Science, 9, 254. [Google Scholar] [CrossRef]
  39. Knorr, D. (2024). Food processing: Legacy, significance and challenges. Trends in Food Science & Technology, 143, 104270. [Google Scholar]
  40. Kompas, T., Che, T. N., & Grafton, R. Q. (2024). Global impacts of heat and water stress on food production and severe food insecurity. Scientific Reports, 14(1), 14398. [Google Scholar] [CrossRef]
  41. Ljung, G. M., & Box, G. E. (1978). On a measure of lack of fit in time series models. Biometrika, 65(2), 297–303. [Google Scholar] [CrossRef]
  42. MacKinnon, J. G., Haug, A. A., & Michelis, L. (1999). Numerical distribution functions of likelihood ratio tests for cointegration. Journal of Applied Econometrics, 14(5), 563–577. [Google Scholar] [CrossRef]
  43. Marson, M., Saccone, D., & Vallino, E. (2023). Total trade, cereals trade and undernourishment: New empirical evidence for developing countries. Review of World Economics, 159(2), 299–332. [Google Scholar] [CrossRef]
  44. Ministry of Environment, Water & Agriculture. (2023). Available online: https://www.mewa.gov.sa/ar/InformationCenter/Pages/default.aspx (accessed on 11 October 2024).
  45. Mirza, F. M., Qurat-ul-Ann, A.-R., Rizvi, S. B.-u.-H., & Iqbal, N. (2023). An assessment of water-energy-food nexus for environmental sustainability: The case of developing economics. Pakistan Journal of Humanities and Social Sciences, 11(1), 692–700. [Google Scholar] [CrossRef]
  46. Mordorintelligence. (2024). Food services market size in Saudi Arabia and stock analysis—growth trends and forecasts until 2029. Available online: https://www.mordorintelligence.com/ar/industry-reports/saudi-arabia-foodservice-market (accessed on 7 November 2024).
  47. Mozumdar, L. (2012). Agricultural productivity and food security in the developing world. Bangladesh Journal of Agricultural Economics, 35, 53–69. [Google Scholar]
  48. Mughal, M., & Fontan Sers, C. (2020). Cereal production, undernourishment, and food insecurity in South Asia. Review of Development Economics, 24(2), 524–545. [Google Scholar] [CrossRef]
  49. Mukhopadhyay, S., Ukuku, D. O., Juneja, V. K., Nayak, B., & Olanya, M. (2017). Principles of food preservation. In V. Juneja, H. Dwivedi, & J. Sofos (Eds.), Microbial control and food preservation (pp. 17–39). Food Microbiology and Food Safety. Springer. [Google Scholar] [CrossRef]
  50. Ohiokpehai, O. (2003). Food processing and nutrition: A vital link in agricultural development. Pakistan Journal of Nutrition, 2(3), 204–207. [Google Scholar]
  51. Otekunrin, O. A. (2024). Assessing the prevalence and severity of global hunger and food insecurity: Recent dynamics and Sub-Saharan Africa’s burden. Sustainability, 16(12), 4877. [Google Scholar] [CrossRef]
  52. Owusu, S. M., Chen, J., Merz, E., & Fu, C. (2022). Progressing towards nutritional health in Sub-Saharan Africa: An econometric analysis of the effect of sustainable food production on malnutrition. The International Journal of Health Planning and Management, 37(4), 2266–2283. [Google Scholar] [CrossRef]
  53. Platform, U. N. (2024). Available online: https://www.my.gov.sa/ (accessed on 7 November 2024).
  54. Riccardi, B., Resta, S., & Resta, G. (2024). Transforming nutritional value into commercial gain: The impact of intensive food production. European Journal of Nutrition &Food Safety, 16(8), 39–52. [Google Scholar]
  55. Rimhanen, K., Aakkula, J., Aro, K., & Rikkonen, P. (2023). The elements of resilience in the food system and means to enhance the stability of the food supply. Environment Systems and Decisions, 43(2), 143–160. [Google Scholar] [CrossRef] [PubMed]
  56. Saleh, M. M. (2015). Towards facing global famine: Modeling food distribution according to Iraqi case. European Scientific Journal, ESJ, 11(10). Available online: https://eujournal.org/index.php/esj/article/view/6469 (accessed on 9 September 2024).
  57. Samygin, D. Y. (2021). On strategizing the economic availability of products and food aid to the population. Agrarian Bulletin of the Urals, 3(206), 92–100. [Google Scholar] [CrossRef]
  58. Sato, P. d. M., Ulian, M. D., da Silva Oliveira, M. S., Cardoso, M. A., Wells, J., Devakumar, D., Lourenço, B. H., & Scagliusi, F. B. (2020). Signs and strategies to deal with food insecurity and consumption of ultra-processed foods among Amazonian mothers. Global Public Health, 15(8), 1130–1143. [Google Scholar] [CrossRef]
  59. Singh, B., Pavithran, N., & Rajput, R. (2023). Effects of food processing on nutrients. Current Journal of Applied Science and Technology, 42(46), 34–49. [Google Scholar] [CrossRef]
  60. Sousa, C. P. d. (2008). The impact of food manufacturing practices on food borne diseases. Brazilian Archives of Biology and Technology, 51, 615–623. [Google Scholar] [CrossRef]
  61. Sperling, L., & McGuire, S. (2012). Fatal gaps in seed security strategy. Food Security, 4(4), 569–579. [Google Scholar] [CrossRef]
  62. Speth, J. G. (1993). Towards sustainable food security, 1993 October 25. Available online: https://archives.yale.edu/repositories/12/archival_objects/3064587 (accessed on 7 March 2025).
  63. Strome, S., Johns, T., Scicchitano, M. J., & Shelnutt, K. (2016). Elements of access: The effects of food outlet proximity, transportation, and realized access on fresh fruit and vegetable consumption in food deserts. International Quarterly of Community Health Education, 37(1), 61–70. [Google Scholar] [CrossRef]
  64. Suyanto, S. (2023). Vector Auto Regressive (VAR) model approach in the capital market. JRAP (Jurnal Riset Akuntansi dan Perpajakan), 10(2), 253–263. [Google Scholar] [CrossRef]
  65. Temesgen, M. (2015). Effect of climate change on food security in relation with the empact of food industries emission: A review. Journal of Environment and Earth Science, 5, 9–21. [Google Scholar]
  66. Willett, W., Rockström, J., Loken, B., Springmann, M., Lang, T., Vermeulen, S., Garnett, T., Tilman, D., DeClerck, F., Wood, A., Jonell, M., Clark, M., Gordon, L. J., Fanzo, J., Hawkes, C., Zurayk, R., Rivera, J. A., De Vries, W., Sibanda, L. M., … Murray, C. J. L. (2019). Food in the anthropocene: The EAT–Lancet Commission on healthy diets from sustainable food systems. The Lancet, 393(10170), 447–492. [Google Scholar] [CrossRef]
  67. Wixey, S., Elliot, D., & Blair, A. (2010, October 11–13). A healthy food physical accessibility standard and its implications for transport, spatial planning and public health. European Transport Conference, 2010Association for European Transport (AET), Glasgow, UK. [Google Scholar]
  68. Zeng, J. (2024). Stock prices and bitcoin prices: A VAR Model. Advances in Economics, Management and Political Sciences, 57(1), 1–6. [Google Scholar] [CrossRef]
Figure 1. Quantity of food manufactured in the KSA (in thousand tons), distributed by type in 2022.
Economies 13 00084 g001
Table 1. Development of the value of manufactured food exports and imports in Saudi Arabia in 2017–2022 in USD Million.
Indicator2017–20192020–2022Change Ratio
Value of food exports1498187725.4
Value of food imports7211821713.9
Note: Saudi Central Bank.
Table 2. Production of major food groups in Saudi Arabia (000 tons) in 2015–2022.
Groups20152016201720182019202020212022Percentage Change Between 2015 and 2022
Cereals926104814291200134511811187106915.4
Tubers and roots477433476425472561578605.026.8
Legumes13.614.215.316.116.614.714.915.010.3
Vegetables1303171813631082137116232194239283.6
Fruits1549164310502234246223422212228147.3
Dates8929657551428154015421566161180.6
Oils and fats3.73.72.71488183891333495
Total meat (*)955905964979107411891202126031.9
Total fish10110912114114316218218078.2
Eggs25028028334538235035937550.0
Dairy and dairy products2546270324462361268329112600293915.4
Numbers in parentheses indicate negative values. (*) Includes red meat and white meat. Note: the period (2018–2021) is from Arab Agricultural Statistics Yearbook, and the year 2022 is from, Food and Agriculture Organization.
Table 3. Development of food security indicators in KSA in 2015–2022.
Year
Indicators
20152016201720182019202020212022Ranking in 2022 (*)
Food security environment65.364.566.167.365.069.168.269.941
Affordability88.283.790.089.482.988.179.283.240
Availability55.057.457.766.465.768.067.567.223
Quality and safety78.177.976.172.971.971.971.971.649
Sustainability and adaptation33.333.333.333.333.342.350.553.757
(*) Scores are normalized 0–100, where 100 = best conditions. Note: Global Food Security Index 2023, exploring challenges and developing solutions for food security across 113 countries, https://impact.economist.com/sustainability/project/food-security-index (accessed on 3 December 2024).
Table 4. The probability value of the results of the augmented Dickey-Fuller (ADF) test for the research model variables in 2000–2022.
ModelConstantTrend and InterceptNone
Probability
lnFPI(0)0.3440.1970.887
I(1)0.002 (**)0.009 (**)0.000 (**)
lnDIMEXI(0)0.2630.9930.741
I(1)0.007 (**)0.018 (*)0.000 (**)
lnCFI(0)0.8860.8330.999
I(1)0.025 (*)0.0990.021 (*)
lnnOI(0)0.9480.9730.251
I(1)0.0130.033 (*)0.001 (**)
lnFINSI(0)0.2860.2290.002
I(1)0.023 (*)0.050 (*)0.011 (*)
lnFPII(0)0.9460.1790.993
I(1)0.000 (**)0.000 (**)0.051
(*) and (**) indicate significance at the probability level of (0.05) and (0.01), respectively. Note: prepared by the researcher based on the results of the ADF test, from the outputs of the E-views 9 program.
Table 5. Results of the cointegration test according to the Johansen and Juselius methodology.
HypothesizedTest TraceMax Eigenvalue Test
No. of CE(s)EigenvalueTrace
Statistic
0.05
Critical Value
Prob. **EigenvalueMax-Eigen
Statistic
0.05
Critical Value
Prob. **
None *0.963200.79495.7530.0000.96369.47840.0770.000
At most 1 *0.935131.31669.8180.0000.93557.66533.8760.000
At most 2 *0.80173.65147.8560.0000.80133.95227.5840.000
At most 3 *0.66739.69829.7970.00260.66723.13721.1310.0026
At most 4 *0.54416.56015.4940.03440.54416.53014.2640.0344
At most 50.0010.0303.8410.86110.0010.0303.8410.8611
Note: Prepared from the outputs of the E-views 9 program. * Denotes rejection of the hypothesis at the 0.05 level. ** MacKinnon et al. (1999) p-values.
Table 6. Criteria for determining the most optimum lag for the research variables.
LagLogLLRFPEAICSCHQ
068.130NA1.42 × 1010−5.648−5.350−5.578
1185.058159.446 *1.04 × 1013 *−13.005 *10.922 *−12.514 *
* Indicates lag order selected by the criterion.
Table 7. Results of measuring the impact of some economic variables on the indicator of the percentage of malnourished people out of the total population (No) in KSA during 2000–2022.
Equation lnNO = −0.235 × lnFINS(−1) +0.115 × lnFPI(−1) + 0.936 × lnNO(−1) + 0.025 × lnFP(−1) + 0.132 × lnDIMEX(−1) − 0.170 × lnCF(−1) + 0.324
            (0.621)       (0.654)       (0.000)      (0.920)     (0.461)        (0.046)  (0.934)
R-squared0.856208Mean Dependent Var1.586364
Adj. R-squared0.798691S.D.dependent var0.244998
S.E. regression0.109925Sum squared resid0.181251
Durbin-Watson stat0.687049F-statistic14.9
Numbers in brackets indicate p-value. Note: prepared by the researcher from the outputs of the E-views 9 program.
Table 8. Results of measuring the impact of some economic variables on the prevalence index of severe food insecurity (FINS) in KSA in 2000–2022.
Equation lnFINS = 0.492 × lnFINS(−1) − 0.069 × lnFPI(−1) + 0.040 × lnNO(−1) − 0.030 × lnFP(−1) − 0.040 × lnDIMEX(−1) − 0.066 × lnCF(−1) + 2.59
            (0.002)       (0.421)       (0.473)      (0.472)     (0.505)        (0.021)  (0.503)
R-squared0.955458Mean Dependent Var1.927273
Adj. R-squared0.937641S.D.dependent var0.147202
S.E. regression0.036759Sum squared resid0.020268
Durbin-Watson stat1.636177F-statistic53.6
Numbers in brackets indicate p-value. Source: prepared by the researcher from the outputs of the E-views 9 program.
Table 9. Results of measuring the impact of some economic variables on the food production index (FPI) in KSA in 2000–2022.
Equation lnFPI = −0.131 × lnFINS(−1) + 0.647 × lnFPI(−1) + 0.005 × lnNO(−1) + 0.162 × lnFP(−1) − 0.226 × lnDIMEX(−1) +0.078 × lnCF(−1) + 1.761
             (0.571)      (0.000)      (0.952)      (0.187)      (0.011)       (0.060)   (0.365)
R-squared0.943701Mean Dependent Var4.682273
Adj. R-squared0.921181S.D.dependent var0.191210
S.E. regression0.053682Sum squared resid0.043226
Durbin-Watson stat2.283256F-statistic41.9
Numbers in brackets indicate p-value. Note: prepared by the researcher from the outputs of the E-views 9 program.
Table 10. The stability of the Autoregressive VAR Model.
Roots of Characteristic PolynomialEconomies 13 00084 i001
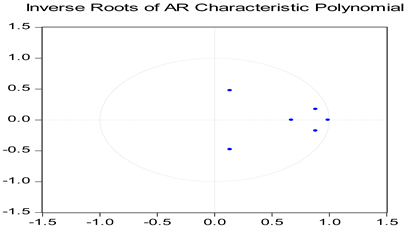
Endogenous variables: NFP, NFPI, NNO, NCF, NDIMEX, NFINS
Exogenous variables: C
Lag specification: 11
RootModulus
0.99060.9906
0.8817 − 0.17500.8989
0.8817 + 0.17500.8989
0.67080.6708
0.1353 − 0.47720.4960
1353 + 0.47720.4960
Note: Model results using E-views 9 program.
Table 11. VAR residual tests for autocorrelations.
VAR Residual Normality Tests
ComponentJarque-Bera
11.41522
20.25122
31.23922
44.48322
50.15422
63.08022
Joint10.624120.561
Note: Model results using EViews 9 program.
Table 12. VAR residual serial correlation LM test.
LagsLM-Stat.Prop.
145.4620.134
Note: model results using E-views program.
Table 13. Results of the heteroskedasticity test for the model variables.
VAR Residual Heteroskedasticity Tests
Chi-sqdfProb.
264.002520.289
Note: Model results using E-views program.
Table 14. Granger Causality Test.
Pairwise Granger Causality Tests
Sample: 2000 2022
Lags: 1
Null Hypothesis:ObsF-StatisticProb.
LNNO does not Cause Graner LNFP
LNFP does not Cause Graner LNNO
223.2800.085
0.2720.607
LNNO does not Cause Graner LNDEXIM
LNDEXIM does not Cause Graner LNNO
228.5090.009 (**)
0.5940.450
LNNO does not Cause Graner LNCF
LNCF does not Cause Graner LNNO
227.9780.011 (*)
4.6160.044 (*)
LNFINS does not Cause Graner LNFP
LNFP does not Cause Graner LNFINS
223.8880.021
0.0630.885
LNFINS does not Cause Graner LNDEXIM
LNDEXIM does not Cause Graner LNFINS
222.2250.152
0.1630.691
LNFINS does not Cause Graner LNCF
LNCF does not Cause Graner LNFINS
220.1320.719
7.3380.013 (*)
LNFPI does not Cause Graner LNFP
LNFP does not Cause Graner LNFPI
227.6780.012 (*)
3.1610.091
LNFPI does not Cause Graner LNDEXIM
LNDEXIM does not Cause Graner LNFPI
223.8240.065
1.1160.304
LNFPI does not Cause Graner LNCF
LNCF does not Cause Graner LNFPI
220.4410.514
(*) indicates significance at the probability level of (0.05). (**) indicates significance at the probability level of (0.01), respectively. Source: prepared by the researcher from the outputs of the E-views 9 program.
Disclaimer/Publisher’s Note: The statements, opinions and data contained in all publications are solely those of the individual author(s) and contributor(s) and not of MDPI and/or the editor(s). MDPI and/or the editor(s) disclaim responsibility for any injury to people or property resulting from any ideas, methods, instructions or products referred to in the content.

