Abstract
Efficiency is one of the tenets in assessing the financial health of an enterprise. Ultimately, the form of asset management has a major impact on growth but also on the decline of profit. It also reveals how the enterprises are positioned within the competitive market environment. For this reason, the aim of this article is to define the level of business activity in the Visegrad Four in the pre-crisis, during-crisis and post-crisis periods of the COVID-19 pandemic. The investigation included 48,650 enterprises from Slovakia, Czechia, Poland, and Hungary over the period 2017–2023. We determined the median values of eleven business efficiency indicators separately for each country and sector. The Friedman test and Kruskal–Wallis test confirmed significant differences between years and countries. Furthermore, multiple pairwise comparisons revealed analogies between the pre-crisis and post-crisis periods, as well as similarities between the two pandemic years for the tested ratios. One can observe that the results serve as the foundation for regional and international benchmarks, particularly for enterprises from former Eastern Bloc countries.
1. Introduction
Changes in the global market have posed critical challenges for industrial and services industries (). Especially, the COVID-19 pandemic, which started in the first quarter of 2020, triggered unprecedented economic challenges, prompting governments worldwide to implement intervention measures to mitigate its impacts on business and employment (). During negative pandemic years, 2020 and 2021, several companies have come to believe in the importance of continuous analysis of the financial situation (; ). Business continuity and sustainability of business operations, especially for managing any turbulent situation like the COVID-19 pandemic, are necessary (). Identification of threats and business weaknesses, but also preparation for unexpected and crisis situations (), were the most important areas of interest for the company’s management (; ). Despite the partial improvement in the situation, global stabilization has not yet taken place. The ongoing energy crisis also corresponds to the current development (). Particularly, considering the mentioned rationale, it is crucial to persist in monitoring the financial well-being of the company through the use of appropriate tools (). Effective monitoring of financial health is essential in the financial management of enterprises (). Financial managers must implement a mechanism for analysing the financial situation that will effectively respond to all stimuli threatening the very existence of the company and its further operation in the market (; ).
One of the most important steps in financial analysis, apart from the preparation of financial statements and the collection of data from around the company (), is the process of choosing an appropriate method (). Businesses use various procedures and techniques that bring relevant results. Currently, various statistical analysis methods are gaining prominence, while, at the same time, “traditional” methods like ratio analysis continue to receive constant application (). The analysis includes several groups of indicators that represent the basic elements of various professional studies, due to their simple applicability in business practice (). This paper primarily focuses on one of these indicator groups, revealing the effectiveness of individual property components in the operational process ().
Activity indicators, together with recommendations resulting from the achieved results, represent an important part of analysing the financial health of the company (). Ultimately, the form of asset management has a major impact on growth but also on the decline of profit (). It also indicates the position of the company in the environment of market competition (). Thus, the aim of this article is to define the level of business activity in the Visegrad Four in the pre-crisis, during-crisis, and post-crisis periods of the COVID-19 pandemic.
In addition, the bibliometric analysis was realised by VOSviewer version 1.6.20 to prove the significance of the solved issue. The method is used to provide quantitative analysis of published documents (). This search query was used in Web of Science: “business efficiency” (Topic) or “business activity” (Topic) or “activity ratio” (Topic) and Economics (Web of Science Categories) or Business (Web of Science Categories) or Management (Web of Science Categories) or Business Finance (Web of Science Categories) and Article (Document Types). The targeted issue yielded 1385 related articles. Figure 1 represents a bibliometric map of 32 dominant countries involved in this issue (each country published at least 15 articles). This led to the creation of four clusters of cooperating countries within business efficiency. Hungary, as a part of the Visegrad Four, is not included, but Slovakia, Czechia, and Poland are included. The red cluster dominates the map, connecting the USA, China, Australia, Germany, Canada, Brazil, Portugal, South Korea, Switzerland, Finland, Japan, and Russia. The green cluster includes the remaining developed European countries that are historically or economically connected to themselves or with others from the cluster, including England, France, Italy, Spain, Scotland, New Zealand, India, and Pakistan. Malaysia, Indonesia, Vietnam, and Taiwan represent close Asian cooperation in the yellow cluster. Slovakia, Czechia, and Poland, along with Ukraine, Lithuania, Croatia, Serbia, and Bosnia and Herzegovina, form a blue cluster of post-Soviet cooperation.
Figure 1.
Bibliometric map of cooperating countries. Own processing.
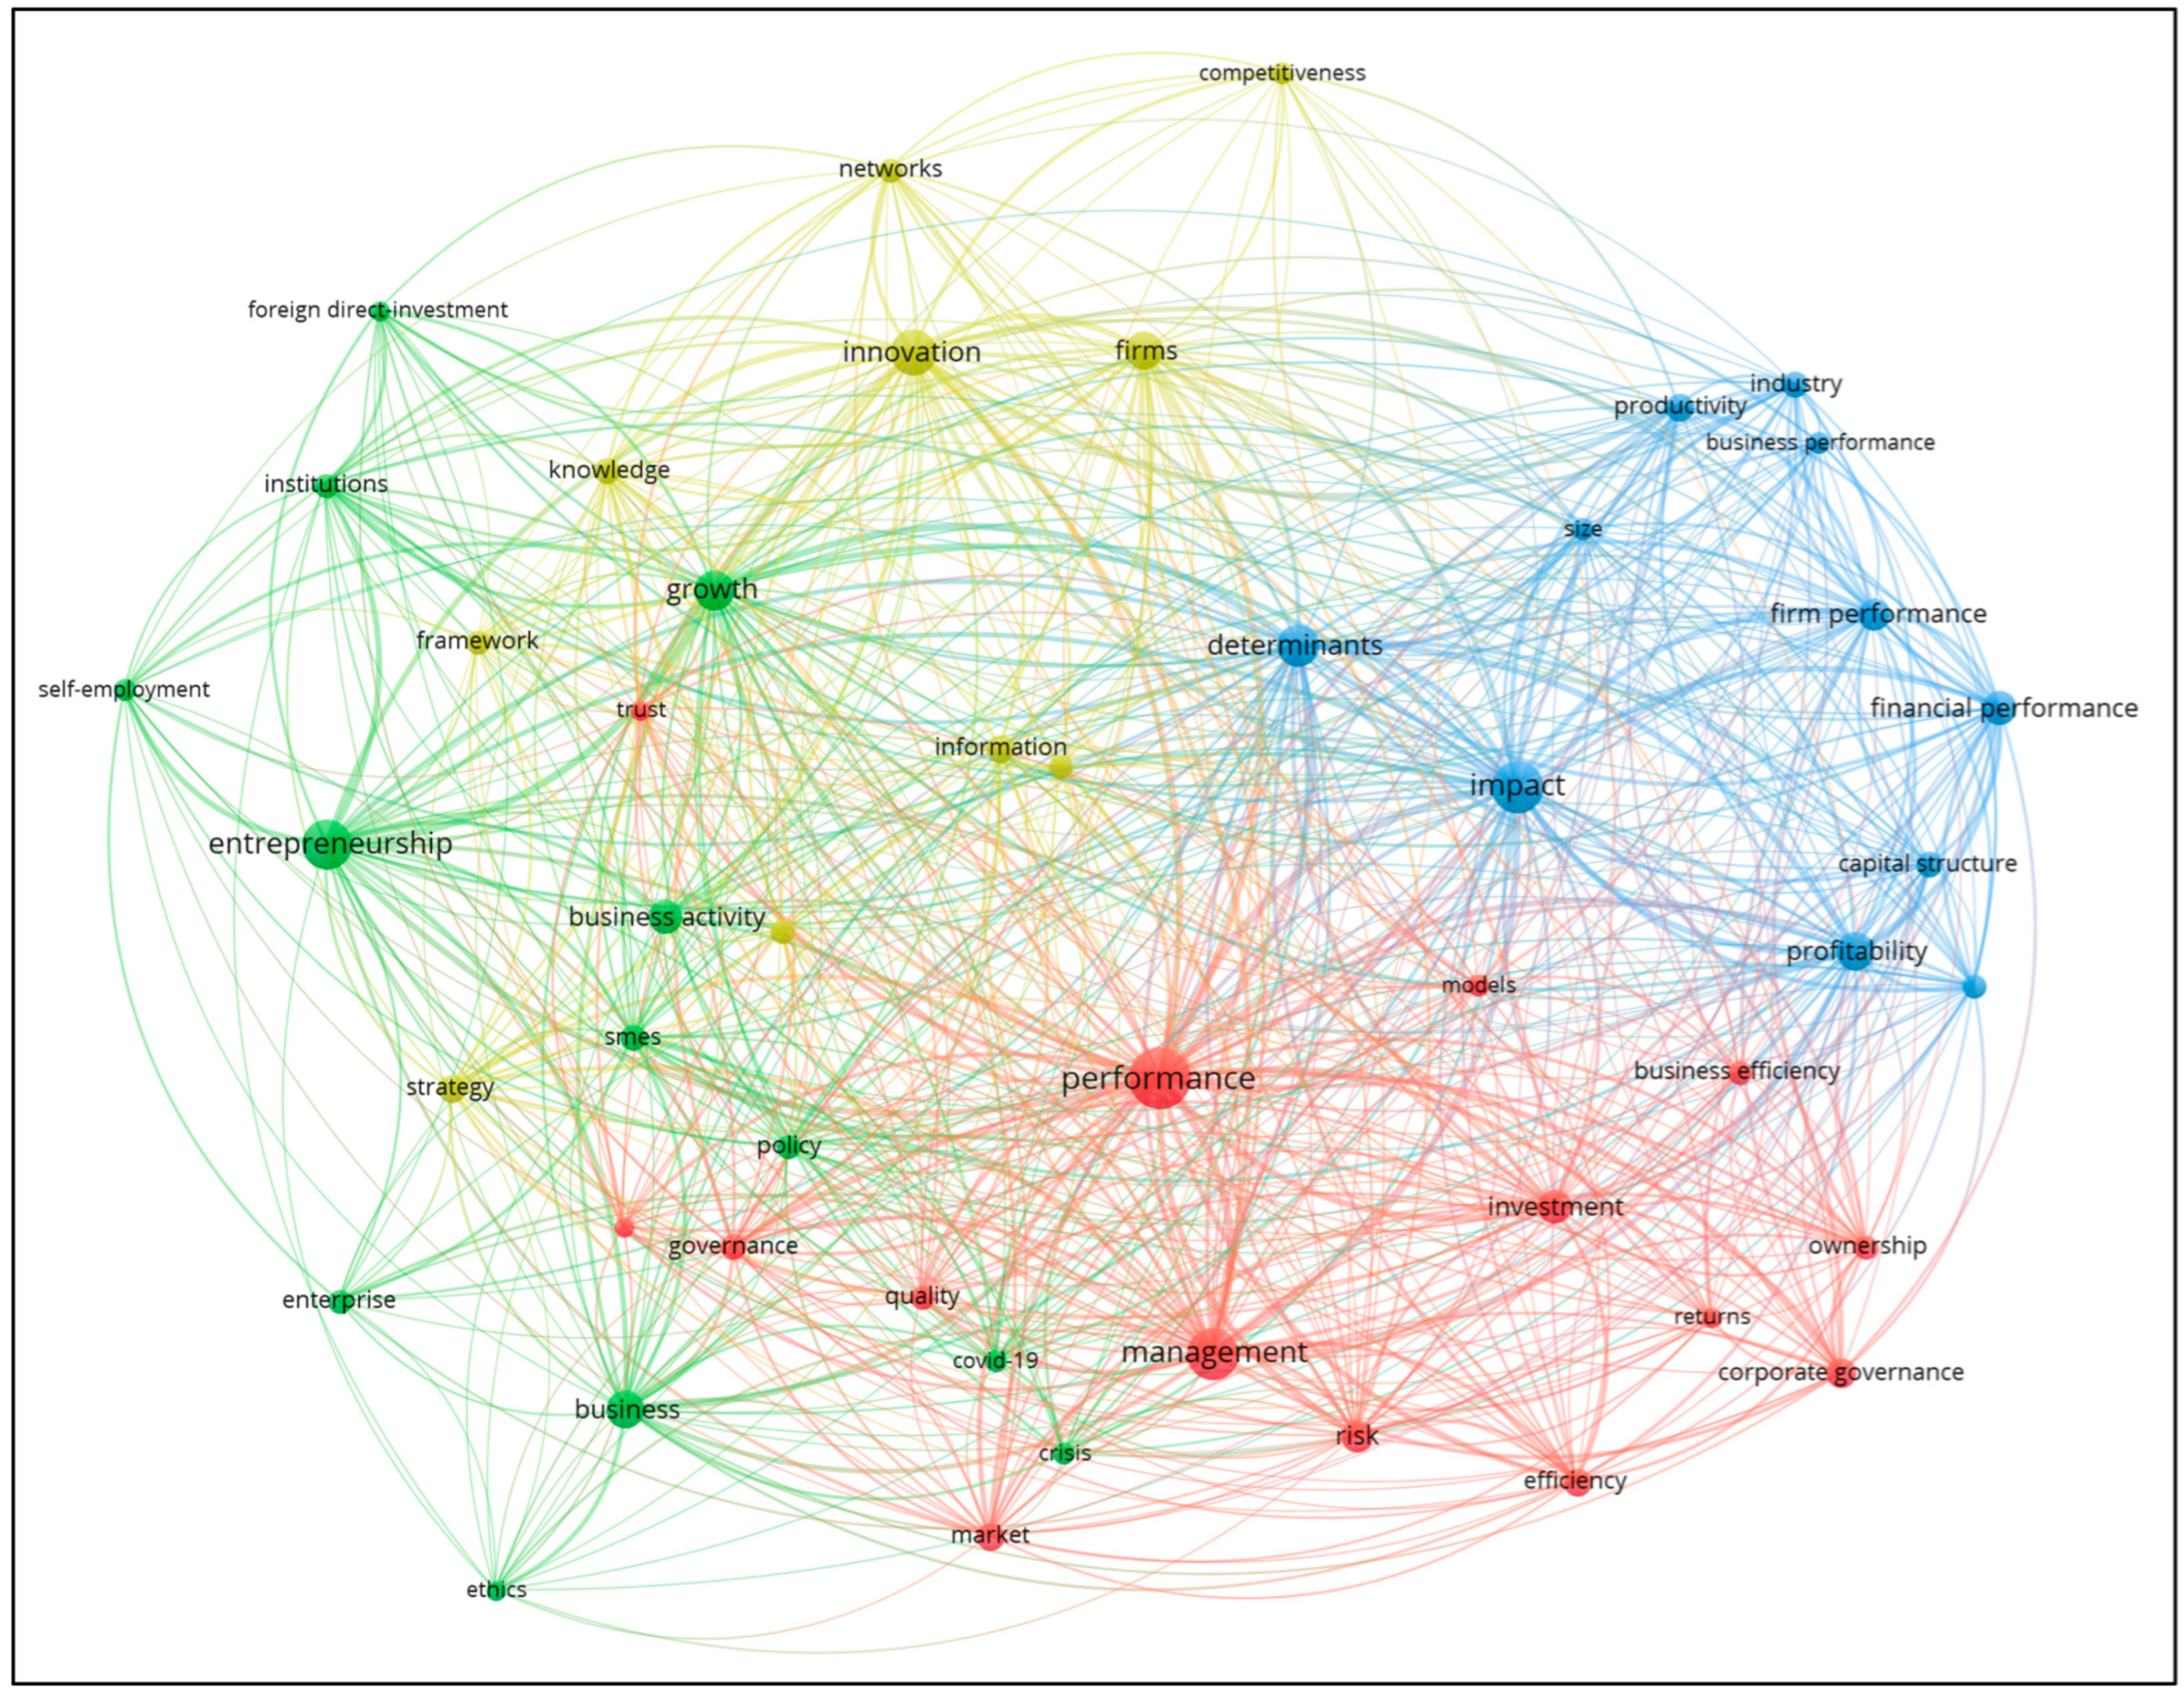
VOSviewer also created the bibliometric map of keyword occurrence (Figure 2). Each keyword must be marked at least 20 times in used articles. Four clusters were detected. The red cluster concentrates on the overall management and performance of business efficiency, encompassing aspects such as returns, governance, models, risk, and market. The blue one illustrates the financial aspect of business efficiency, encompassing factors such as profitability, financial performance, capital structure, and productivity. Business potential is defined by a yellow cluster that includes strategy, innovation, knowledge, sustainability, technology, etc. The last cluster is the green one that is related to this article and maps business activity through entrepreneurship, the effect of economic growth, foreign direct investments, and crisis periods, as well as COVID-19 consequences.
Figure 2.
Bibliometric map of co-occurrence of keywords. Own processing.
The article is organised as follows: A literature review covers the theoretical background of business efficiency. The paper then proceeds to explain the creation of the sample from V4, calculate activity ratios, and identify the preferred tests. The results illustrate the median values of eleven ratios and test the set hypotheses. The discussion compares the results. The conclusions outline potential focuses for future research and identify the limitations of the current study.
2. Literature Review
(); () define seven initial goals, which are as follows: evaluation of the impact of internal and external factors on the existence of the company, assessment of changes in the management of the business entity, sectoral comparison of financial indicators, monitoring of mutual relationships between the analysed indicators, creation of a relevant information source for the needs of managerial decision-making, prediction of the future financial situation of the enterprise in various variations, and defining recommendations for planning and management ().
() consider information available from financial statements to be the primary element of financial analysis. This statement is further supplemented by (), who describe the financial statement as a source of information about the business activity of the accounting unit. (); () state that each financial statement contains specific data. In the case of the profit and loss statement, it is mainly a display of the achieved performance of the business entity during a defined period. On the other hand, the balance sheet captures the state of the company’s financial situation as of a specified date. Notes are also an important part. The last part of the financial statements is supplementary to the previous statements. It also presents changes in cash flows, which are found in the cash flow statement ().
() and () consider the method of ratio analysis, which is based on the quantification of ratios of selected data from accounting statements, to be the main method of assessing the financial health of a company. This method consists of indicators aimed at assessing the profitability, liquidity, indebtedness, activity, and market value of the company (). According to (), ratio indicators are considered important metrics for determining the performance but also the growth of the company. () further highlight the importance of ratio indicators in investment decision making but also in taking measures to improve the financial performance of the company ().
Activity indicators monitor the company’s ability to use assets (its assets)—they indicate how efficiently the company uses its individual assets, i.e., whether the company has enough productive assets or not (). It is important for a business to find a reasonable ratio between the assets the business has acquired to achieve its sales and the sales of the business. If the company has high assets compared to sales, it can be said that the company is using its assets economically (). If, on the other hand, it has a lack of assets, it prepares itself for the revenues that would arise from potential orders. In other words, the acceleration of asset turnover is a positive trend because it means higher sales for businesses. However, excessive acceleration of turnover can threaten the flow of production and sales ().
() characterise the meaning of the quantification of activity indicators as the ability to define the level of asset efficiency in the operational process. The contribution of selected asset items in the process of revenue generation is also assessed, as is the number of investments in current and non-current assets. To determine the competitiveness of the analysed entity, the activity indicators are also used to compare companies within the respective industries. As individual branches of the national economy are characterised by a different structure of assets and, consequently, turnover, () draw attention to the diversity of the results of activity indicators depending on the characteristics of the branch.
For this reason, they consider it important to adequately adapt and improve the applied methods and procedures of financial analysis in view of the specific circumstances of the business activity of the analysed entity (). The authors subsequently state in their article that effective management of corporate assets will be reflected in the growth of turnover indicators but also in the growth of the company’s competitiveness (). According to (), among the most used activity indicators that we can include are accounts receivable turnover, asset turnover, and inventory turnover.
Information on the collection of receivables from corporate customers can be determined using the receivables turnover indicator. To evaluate the proportionality of assets in relation to sales production, on the other hand, the turnover of total assets is used, which, according to (), is considered one of the most important indicators of company evaluation. The last indicator of activity is inventory turnover, which () perceives as a tool for determining the number of conversions of inventory sales during the year. () claim that a high inventory turnover will ensure a faster process of revenue generation but also a lower probability of depreciation of the company’s inventory.
In several studies, we record the analysis of activity indicators in connection with the assessment of the impact of property items on the profitability of the company (; ). While () concluded that there is a positive relationship between receivables turnover time, inventory turnover time, liability maturity period, and profitability, (), on the contrary, identified the inverse nature of the mutual connection between the mentioned activity indicators and profitability. Different results were also achieved by (), who, based on the evaluation of 127 companies in the textile industry, confirmed the existence of a negative relationship between receivables turnover time and profitability.
On the other hand, they established a positive relationship between profitability and the turnover period of liabilities and the turnover period of receivables. Activity indicators are also included in the analysis of bankruptcy models as variables involved in predicting the future financial situation of the company. One of the studies focused on the issue was also published by (), who dealt with prediction models of transitive economies. The result of the investigation was the identification of financial indicators with the greatest frequency of occurrence in the given models. Out of a set of 917 indicators, asset turnover ranked third. A similar study was carried out by (), in which they used constructed bankruptcy prediction models in the territory of the Visegrad Four countries. From the group of activity indicators, the ratio of sales to total assets was also most often used, but it was part of only the Czech and Polish prediction models. In the case of the Slovak Republic and Hungary, the occurrence of the indicator is zero (; ).
We can also identify the use of activity indicators when assessing the financial performance of selected business entities (). For example, () deal with the mentioned issue, whose aim was to determine the financial performance of Indian telecommunication service providers. () compared the financial situation of companies from the IT sector. Selected activity indicators can also be found in the article by (), who analysed the impact of mergers and acquisitions on the financial performance of technology companies. In their conclusions, they stated that it was based on activity indicators that they identified the significant effects of the mentioned forms of direct foreign investment on the financial performance of business entities. In the company’s management system, the evaluation of the company’s efficiency occupies a prominent place, since the adoption of strategically important managerial decisions depends on its results.
Since business efficiency is a multidimensional phenomenon, its evaluation involves the use of many indicators, which complicates management (). The integrated approach as a modern, progressive, methodical apparatus makes it possible to systematise indicators into sub-indices and thus obtain one integrated indicator of the business efficiency of enterprises ().
Activity indicators, together with recommendations arising from the achieved results, represent an important part of the analysis of the company’s financial health. Ultimately, the form of asset management has a major impact on growth, but also on profit decline (; ). It also indicates the company’s position in the environment of market competition. Business efficiency of a business is the most important sign of its viability. Business efficiency is primarily the ability of a business to generate income and profit even under the most adverse external and internal conditions.
In this case, there are also external conditions that do not directly depend on the company’s actions, especially market demand, business conditions, the overall state of the company, and the state of the financial and credit system (). There are also internal conditions that are created because of the enterprise, especially value-added production, resource potential, production capacity, innovation, etc. In this regard, the assessment of the business efficiency of the enterprise is a multifaceted component of management, which includes a significant number of absolute or monetary indicators and indicators, their dynamics, and criteria ().
The results from the Visegrad Four region assessing efficiency are as follows: () emphasised that structural economic factors heavily influence asset efficiency and financial health. Similarly, () highlighted the role of divergent national policies in shaping financial health indicators across industries.
Analysing the efficiency of corporate assets and fixed assets utilization highlights notable regional differences among Visegrad Group countries. Indicators analysing asset efficiency recorded the best results in Polish and Czech companies. However, (), who analysed financial data from 400 Slovak firms, argue that insufficient reinvestment in capital assets significantly contributes to inefficiency in Slovak companies. Despite these shortcomings, Slovak firms demonstrate exceptional performance in managing warehouse stocks. This finding aligns with (), who analysed 469 Slovak agricultural enterprises and emphasised the importance of inventory management in mitigating financial instability. () notes that success in optimization in collection period ratio can be gained through the implementation of strict credit management policies.
() add that they applied multicriteria evaluation methods (MCEM) and nonmetric multidimensional scaling (NMDS) to assess hospital performance in Slovakia during pre-crisis, crisis, and post-crisis periods. Their research demonstrates how temporal changes in performance rankings can highlight strengths and weaknesses in operational and financial strategies.
() further expand the scope by examining the role of intellectual capital in determining profitability. Their analysis of 24,351 Slovak SMEs highlights the positive relationship between intellectual capital and profitability before the pandemic, as well as the challenges faced during the crisis. Restrictions primarily affected sectors like tourism and gastronomy, where structural capital and capital-employed efficiencies had a negative impact on profitability. This sector-specific vulnerability highlights the broader theme of the pandemic’s disproportionate impact on industries with limited adaptability.
() contribute to the understanding of how corporate debt influences financial health and resilience. Using the Friedman test to analyse Slovak firms from 2018 to 2021, they identified significant shifts in financial indicators, particularly in self-financing and equity leverage ratios. Their findings underscore the pandemic’s adverse effects on corporate indebtedness while emphasizing the need for robust debt policies to ensure long-term financial stability.
In the service sector, () examined 585 hotel businesses across the V4 region to investigate the impact of industry characteristics on financial stability and activity indicators. Their study revealed that Polish firms outperformed their Slovak counterparts in generating consistent returns from fixed assets, attributed to better capital utilization strategies. Similarly, () analysed healthcare SMEs across the V4 countries and noted that Polish and Czech firms showcased superior asset management efficiency compared to Slovak enterprises, which face challenges in reinvestment.
Between 2020 and 2021, activity indicators across the V4 countries demonstrated a predominantly negative trend. () observe that the adoption of digital tools during the COVID-19 pandemic improved financial performance in key sectors across the V4 region, particularly in Poland and Hungary.
3. Materials and Methods
The origin data were gained from Database Orbis, provided by Moody’s (). The sample after removing missing values consisted of 48,650 enterprises from the Visegrad Group. This group of countries represents the political grouping of Central European states, specifically the regional cooperation of Slovakia (SK), the Czech Republic (CZ), Hungary (HU), and Poland (PL). The largest number of assessed business entities have Polish nationality. In total, the sample comprises 20,479 Polish enterprises, accounting for a 42.09% share. Furthermore, 16,901 business entities, holding a 34.74% share, represent the Slovak Republic. The sample also includes 5,354 enterprises from the Czech Republic and 5,916 enterprises from Hungary that are analysed. It was evaluated over seven years (2017–2023), covering the period before (2017–2019), during (2020–2021), and after (2022–2023) the COVID-19 pandemic.
Table 1 shows the structure of the final sample according to the NACE (statistical classification of economic activities in the European community).
Table 1.
Structure of the sample according to NACE.
There are three groups into which the activity ratios fall. Turnover ratios (Equations (1)–(3) determine the number of conversions of a particular asset over the year. Then, the inverted values of these ratios express the level of commitment (Equations (4)–(6). Finally, the turnover period ratios (Equations (7)–(11) represent the duration of a single conversion in days (). The coefficients of commitment are based on the same principle as for the turnover period ratios, but the difference is in the use of a time interval (). The calculation of ratios is as follows, and it is based on (); (); (); (); ().
Verification of a normal distribution is the basic premise of the application of several statistical methods. It involves testing the normal distribution of the analysed set. If the sample of the data set includes at least 50 measurements, the Kolmogorov–Smirnov test is preferred (). Based on pre-processing, the final sample of all calculated ratios for each year in this research cannot confirm the normal distribution of data.
That is why non-parametric tests were applied for testing. The Friedman test, the first mentioned statistical procedure, identifies differences between dependent samples. The rejection of the null hypothesis indicates significant differences between the distributions. In addition, it was necessary to run pairwise comparisons (). The following hypotheses were tested:
H0a.
The distributions of activity ratios (asset turnover, fixed asset turnover, inventory turnover, asset to sales ratio, fixed asset to sales ratio, inventory to sales ratio, asset turnover period, fixed asset turnover period, inventory turnover period, collection period ratio) are not influenced by the specific year.
H1a.
The distributions of activity ratio (asset turnover, fixed asset turnover, inventory turnover, asset to sales ratio, fixed asset to sales ratio, inventory to sales ratio, asset turnover period, fixed asset turnover period, inventory turnover period, collection period ratio) are influenced by the specific year. The activity ratio differs between at least one pair of years.
Secondly, the Kruskal–Wallis test was also used to compare at least three independent samples. As with the Friedman test, we also perform a post-hoc analysis when rejecting the null hypothesis with the Kruskal–Wallis test. Multiple comparisons are made using the Dunn–Bonferroni corrections. The mentioned method identifies files that show significant differences between distributions (). The following hypotheses were tested for each year (2016, 2017, 2018, 2019, 2020, 2021, 2022, 2023):
H0b.
The distributions of activity ratios (asset turnover, fixed asset turnover, inventory turnover, asset to sales ratio, fixed asset to sales ratio, inventory to sales ratio, asset turnover period, fixed asset turnover period, inventory turnover period, collection period ratio) are not influenced by the country.
H1b.
The distributions of activity ratios (asset turnover, fixed asset turnover, inventory turnover, asset to sales ratio, fixed asset to sales ratio, inventory to sales ratio, asset turnover period, fixed asset turnover period, inventory turnover period, collection period ratio) are influenced by country. The activity ratio differs between at least one pair of countries.
All hypotheses were tested on a significant level of alpha 0.05 by IBM SPSS Statistics version 28.0.
4. Results
Firstly, this chapter provides a description of the median values of the analysed activity ratios, both from the perspective of the assessed country and each individual year. The assessment of the development per individual indicator and per country during pandemic years is presented below according to three groups: turnover ratios (Table 2), asset to sales ratios (Table 3), and turnover period ratios (Table 4).
Table 2.
Median values of turnover ratios according to countries.
Table 3.
Median values of asset to sales ratios according to countries.
Table 4.
Median values of turnover period ratios according to countries.
4.1. Turnover Ratios
The asset turnover ratio in Slovakia decreased to 0.80 in 2020, a significant decrease compared to previous years (2017–2019, where it was around 0.86–0.87). In 2021, it increased slightly to 0.83, indicating some stabilization after the initial decline. In the Czech Republic, the ratio decreased to 1.27 in 2020 (from 1.35 in 2019), which is a significant decrease in performance. However, in 2021, there was a partial improvement to 1.31, indicating some return to pre-pandemic values. In Poland, there was a decrease to 1.27 in 2020 from 1.38 in 2019, which is a similar trend to the Czech Republic. In 2021, it increased to 1.33, showing signs of recovery in Poland. This indicator decreased to 1.17 in Hungary in 2020, which represents a significant decrease from the previous value of 1.27. In 2021, it remained at the same level of 1.17, indicating the absence of a significant recovery during this period.
The value of the fixed asset turnover indicator in Slovakia decreased to 2.52 in 2020 (compared to 2.72 in 2019), which indicates a less efficient use of fixed assets. The increase in 2021 to 2.70 indicates an improvement in efficiency, which may be associated with the recovery of sales and better adaptation of enterprises to pandemic conditions. In 2020, the fixed asset turnover indicator decreased to 3.66 (compared to 3.85 in 2019), which signals a temporary weakening of revenue generation from fixed assets. Enterprises were able to increase the efficiency of using their fixed assets in 2021, as evidenced by an increase to 3.92, surpassing the pre-pandemic level. In 2020, the fixed asset turnover decreased to 4.12 from 4.35 in 2019 in Poland, indicating a weakening of performance. The increase to 4.52 in 2021 indicates a significant recovery and even better performance than before the pandemic in Poland. The median value of fixed asset turnover in Hungary decreased in 2020 to 3.20 (compared to 3.47 in 2019), indicating a significant weakening of the efficiency of the use of fixed assets. We identify an increase to 3.36 in 2021, suggesting a slight recovery, but the value remains below the pre-pandemic level, indicating a lack of full efficiency restoration.
Slovakia in 2020 reported a decrease in inventory turnover to 6.45 (compared to 6.91 in 2019), indicating a slowdown in inventory turnover, which may be a result of reduced demand or distribution issues during the pandemic. In 2021, there was a further decrease to 6.34, indicating continued challenges in inventory management and maintaining efficiency. In 2020, the Czech Republic recorded a decrease in inventory turnover to 7.73 from 7.95 in 2019, indicating a slight weakening of turnover. A further decrease in 2021 to 7.43 indicates that the challenges associated with effective inventory management persisted into the second year of the pandemic. In 2020, Poland also recorded a decrease to 9.07 (compared to 9.36 in 2019), indicating a slowdown in inventory turnover. A further decline in 2021 to 8.64 suggests that problems with effective inventory management persisted into the second year of the pandemic. Hungary identified a decline in 2020 to 8.27 (from 8.56 in 2019) and shows a slight decrease in inventory turnover efficiency. The value fell to 7.95 in 2021, indicating a continued weakening of inventory management, likely due to ongoing restrictions and reduced demand.
4.2. Asset to Sales Ratios
The asset to sales ratio in Slovakia in 2020 increased to 1.25 (compared to 1.17 in 2019), indicating reduced efficiency of asset use. In 2021, the value decreased to 1.21, indicating a partial improvement in efficiency. In the Czech Republic in 2020, the indicator increased to 0.79 (compared to 0.74 in 2019), reflecting a weakening of the efficiency of asset use. In 2021, it decreased to 0.76, indicating a slight improvement in efficiency. The analysed indicator increased in Poland in 2020 to 0.79 from the pre-pandemic 0.73, indicating lower efficiency of asset use. In 2021, it decreased to 0.75. In Hungary, the asset to sales ratio increased to 0.85 in 2020 (compared to 0.79 in 2019). In 2021, another slight increase to 0.86 signals that the efficiency of asset use has not continued to improve.
The fixed asset to sales ratio in Slovakia increased to 0.35 in 2020 from 0.33 in 2019, reflecting lower efficiency. The decrease to 0.33 indicates a slight improvement in 2021. In the Czech Republic, the fixed asset to sales ratio recorded a slight increase to 0.26 in 2020, signalling a temporary weakening of efficiency. The value of 0.24 in 2021 indicates an improvement and a return to pre-pandemic values. In Poland, there was an increase to 0.24 in 2020 from 0.23 in 2019. In 2021, there was a decrease to 0.21, indicating a significant recovery in fixed asset efficiency. In Hungary, there was an increase to 0.30 in 2020, indicating lower efficiency. In 2021, a drop to 0.28 signals a slight improvement but not a return to pre-pandemic levels.
The median values of the inventory to sales ratio remained unchanged throughout the analysed period: in Slovakia, 0.03; in the Czech Republic, 0.06; in Poland, 0.05; and in Hungary, 0.06.
4.3. Turnover Period Ratios
The asset turnover period in Slovakia increased from 426 to 455 days in 2020. In 2021, there was an improvement to 440 days, which indicates a partial recovery of economic activity. In the Czech Republic in 2020, there was also an increase from 270 to 287 days. In 2021, there was an improvement to 277 days, which indicates a recovery of efficiency but still slightly below the pre-pandemic level. In Poland, the asset turnover period in 2020 increased from 265 to 289 days, indicating temporary difficulties with asset turnover. In 2021, there was a decrease to 273 days, which signals a faster return to pre-crisis levels compared to other countries. In Hungary, the indicator increased from 287 to 312 days in 2020, which indicates a significant deterioration in the efficiency of asset use. Stagnation at 312 days in 2021 points to ongoing problems in the economy.
The fixed asset turnover period in Slovakia in 2020 extended from 120 to 129 days, reflecting a decline in the efficiency of fixed asset use. In 2021, there was an improvement to 119 days, indicating a return to the pre-crisis level. In the Czech Republic, there was an extension from 90 to 95 days in 2020. In 2021, there was a significant improvement, reaching 87 days, the highest efficiency in the V4. In Poland, there was an extension from 82 to 87 days in 2020, indicating a temporary decline in efficiency. In 2021, there was a significant improvement to 78 days, indicating the most efficient use of fixed assets in the region. In Hungary, there was an extension from 102 to 111 days in 2020, indicating significant efficiency problems. The situation improved to 104 days in 2021, yet it remained worse than before the pandemic.
The inventory turnover period in Slovakia in 2020 increased from 10 to 11 days. In 2021, there was an additional rise to 12 days. In 2020, there was a noted increase from 21 to 22 days in the Czech Republic, and this trend continued in 2021 with an increase to 23 days. In Poland, we detected stability at 18 days in 2020, indicating a smaller impact of the pandemic on inventory turnover. However, 2021 saw an increase to 20 days. In Hungary, we observed a decrease from 22 to 21 days in 2020, suggesting more effective inventory management during the pandemic. In 2021, the inventory returned to its pre-crisis level, returning to 22 days.
The collection period ratio decreased compared to pre-pandemic values. This ratio was stable at 43 days in 2020 and 2021, indicating that companies effectively manage receivables. The Czech Republic also shows stability at 39 days in 2020. In 2021, there was an enhancement to 38 days, which validates efficient management of receivables. In Poland, a decrease from 45 to 44 days occurred in 2020, indicating a slight improvement in receivables management. In 2021, the value remained consistent at 44 days. Receivables management in Hungary improved from 28 to 27 days in 2020, making it the best in the V4 region. In 2021, there was an additional enhancement to 26 days, which remains the lowest value for the analysed countries.
The credit period ratio for Slovakia in 2020 is stable at 35 days, indicating consistency in payment terms, the same in 2021. In the Czech Republic in 2020, the stability value was 26 days, the shortest credit terms in the V4. In 2021, there was a slight increase to 27 days, reflecting flexibility in credit terms. In Poland, we identified a decrease from 26 to 24 days in 2020, indicating stricter credit terms during the pandemic. The return to 26 days in 2021 signifies the relaxation of terms following the economic stabilization. In Hungary in 2020, there was a decrease from 20 to 19 days. In 2021, we recorded a 20-day credit period ratio.
Secondly, to comprehensively explain the issue of business activity and provide the possibility of international cross-sectoral benchmark median values of asset turnover (Table A1), the fixed asset turnover (Table A2), inventory turnover (Table A3), asset to sales ratio (Table A4), fixed asset to sales ratio (Table A5), inventory to sales ratio (Table A6), asset turnover period (Table A7), fixed asset turnover period (Table A8), inventory turnover period (Table A9), collection period ratio (Table A10), credit period ratio (Table A11) according to NACE are provided in Appendix A.
5. Discussion
The Friedman test was run to identify differences between the years for all activity ratios. If the computed p-value is lower than the significance level alpha (Table 5), one should reject the null hypothesis and accept that all activity ratios (asset turnover, fixed asset turnover, inventory turnover, asset to sales ratio, fixed asset to sales ratio, inventory to sales ratio, asset turnover period, fixed asset turnover period, inventory turnover period, collection period ratio) are different over the analysed period of years.
Table 5.
Friedman test.
We also ran a post hoc (ph) test of pairwise comparison between the years.
Hph0a.
There is not a difference between two selected years in specific activity ratios.
Hph1a.
There is a difference between two selected years in specific activity ratios.
If the computed p-value is higher than the significance level alpha (Table 6), one cannot reject the null hypothesis. This explains why only the years listed in Table 6 did not exhibit significant differences in activity ratios. In summary, there is no significant difference in inventory turnover, inventory to sales ratio, or inventory turnover period between the pre-crisis and post-crisis years (2017, 2018, 2019, 2022, and 2023). Additionally, the credit period ratio does not significantly differ between pandemic years (2020 and 2021). In all other pairwise comparisons over the years, significant differences have occurred.
Table 6.
Pairwise comparison of years for activity ratios.
The Kruskal–Wallis test was run to detect that the activity ratios are influenced by the country for each year of investigation. If the computed p-value is lower than the significance level alpha (Table 7), one should reject the null hypothesis and accept that all activity ratios (asset turnover, fixed asset turnover, inventory turnover, asset to sales ratio, fixed asset to sales ratio, inventory to sales ratio, asset turnover period, fixed asset turnover period, inventory turnover period, collection period ratio) are different within the countries. Each year, there are differences in the activity ratios between countries.
Table 7.
Kruskal–Wallis test.
We also ran a post hoc test of pairwise comparison between the countries.
Hph0b.
There is not a difference between two selected countries in specific activity ratios.
Hph1b.
There is a difference between two selected countries in specific activity ratios.
If the computed p-value is higher than the significance level alpha (Table 8), one cannot reject the null hypothesis. This explains why only the countries listed in Table 8 did not exhibit significant differences in activity ratios.
Table 8.
Pairwise comparison of countries for activity ratios.
The Czech Republic and Poland have similar developments throughout the analysed period (2017–2023) in asset turnover, asset to sales ratio, asset turnover period, and collection period ratio.
The fixed asset to sales ratio and fixed asset turnover period show no differences between the Czech Republic and Poland, except for in the year 2021.
The Czech Republic and Poland have no differences in inventory to sales ratio and inventory turnover period in the years 2017, 2018, 2022, and 2023.
The Czech Republic and Hungary have the same values during each year (2017–2023) analysed for inventory turnover, inventory to sales ratio and inventory turnover period.
There are no differences in the fixed asset turnover ratio values between the Czech Republic and Hungary, except for in the year 2021.
The Czech Republic and Hungary also have similar developments in asset turnover, asset to sales ratio, fixed asset to sales ratio, asset turnover period, and fixed asset turnover period, except for the pandemic years 2020 and 2021.
The values of the inventory to sales ratio and inventory turnover period do not differ in the pandemic years for Poland and Hungary.
The credit period ratio does not differ in the pandemic years for Poland and Slovakia.
In all other pairwise comparisons of countries, significant differences have occurred.
6. Conclusions
The aim of this article was to define the level of business activity in the Visegrad Four in the pre-crisis, during-crisis, and post-crisis periods of the COVID-19 pandemic. The analysis covered the period from 2017 to 2023. Eleven activity ratios (asset turnover, fixed asset turnover, inventory turnover, asset to sales ratio, fixed asset to sales ratio, inventory to sales ratio, asset turnover period, fixed asset turnover period, inventory turnover period, collection period ratio, credit period ratio) were computed for 48,650 enterprises.
Median values for all activity ratios according to countries were set. All V4 countries experienced a decline in asset turnover, fixed asset turnover, and inventory turnover and an increase in asset to sales ratio, fixed asset to sales ratio, and inventory to sales ratio during the pandemic, reflecting a lower ability to generate revenue from assets due to restrictions and the economic downturn. Slovakia and the Czech Republic had a partial recovery in 2021 in increasing asset turnover, fixed asset turnover, and inventory turnover, which they attributed to growing sales or asset optimization. Poland noted an upward trend in asset turnover and fixed asset turnover. In contrast, Hungary showed stagnation, indicating more persistent difficulties in increasing asset turnover, fixed asset turnover, and a downward trend in asset to sales ratio, fixed asset to sales ratio, and inventory to sales ratio. Asset to sales ratio and fixed asset ratio increased in all countries in 2020, reflecting lower sales and lower asset utilization efficiency. There was an improvement in 2021, although some countries (e.g., Hungary) still showed weaker results. The asset turnover period and fixed asset turnover period increased in all V4 countries during the pandemic. During the asset turnover period, Slovakia and Hungary experienced the most significant fluctuations, while the Czech Republic and Poland showed a smaller deterioration. In the post-pandemic period, the situation in Slovakia, Czechia, and Poland improved, while Hungary stagnated. After the pandemic subsided, the Czech Republic and Poland recovered quickly, while Hungary showed a slower return and Slovakia returned to the pre-crisis level. In the Czech Republic and Slovakia, the inventory turnover period increased during the pandemic. On the other hand, Poland and Hungary maintained stability, while Hungary showed a slight improvement. During the second year of the pandemic and the post-pandemic period, Hungary and Poland experienced stability in their values, whereas Slovakia and Czechia experienced further deterioration, with an increase in these values during the post-pandemic period. The collection period ratio remained relatively stable in all countries during the pandemic. Slovakia, the Czech Republic, and Poland showed only minimal changes, while Hungary maintained the most efficient receivables management. Hungary maintained the best results in the V4. The credit period ratio remained largely stable during the pandemic, with a slight decrease in Poland and Hungary, indicating tighter credit conditions. The values of credit period ratio remained stable, with no significant changes in Slovakia and Czechia.
The Friedman test proved the significant differences in development over the period for all ratios, but in addition, pairwise comparison detected similarities between pre-crisis and post-crisis periods within inventory turnover, inventory to sales ratio, and inventory turnover period. The credit period ratio did not show differences between the two pandemic years. The Kruskal–Wallis test detected significant differences between all ratios throughout all involved countries.
Theoretical implications of the research may be derived as follows. We confirmed that the pandemic significantly impacted business efficiency. The COVID-19 pandemic significantly impacted business activity across several countries. The article develops knowledge about economic crises and their impact on business activity indicators, thereby improving the understanding of the dynamics of business activity in times of crisis. We also identified differences between economically and politically related countries. The analysis reveals that the impact of the pandemic varied among the V4 countries (Slovakia, the Czech Republic, Poland, and Hungary), potentially serving as a foundation for future research on the diverse responses of economies and sectors to the crisis. Several performance-related indicators have demonstrated sensitivity to economic shifts, making them valuable tools for evaluating the crisis resilience of enterprises. Future research could also focus on disclosure of specific business tools that caused similarities between 2017, 2018, 2019, 2022, and 2023 within inventory turnover, inventory to sales ratio, and inventory turnover period and similarities between credit period ratio in 2020 and 2021 in general.
Practical implications of the research may be set as follows. Findings on differences between countries and sectors can be useful for governments and policymakers in designing support for businesses during future crises to support economic policy. Businesses can use this knowledge to better prepare for crises. Findings on the importance of inventory optimization and efficient asset utilization can serve as a guide for managers to improve financial stability and performance. Businesses can use the indicators as tools for monitoring their own financial performance and benchmarking. Businesses can use the values as reference points to compare their own developments and pinpoint areas for enhancing their business efficiency. The next investigation could analyse the sizes of enterprises, expanding the scope from the V4 region to the Bucharest Nine (B9) and incorporating all ratios related to liquidity, profitability, and indebtedness.
We address the limitations by using no-balance samples based on countries and NACE and include ratios with zero values to maintain the robustness of the samples. We calculate the ratios annually, but monitoring data quarterly or monthly could potentially capture development, trends, and seasonality more systematically. This approach could have led to a smaller sample size, but it would have yielded more accurate results. This paves the way for future collaborations between governments, municipalities, business agencies, and enterprises to comprehensively monitor business activity, thereby enhancing the efficiency of policymakers and recipients of these decisions.
Author Contributions
Conceptualization, P.D. and K.B.; methodology, P.D.; software, K.B.; validation, R.B. and E.K.; formal analysis, R.B. and E.K.; investigation, R.B. and E.K.; resources, R.B. and K.B.; data curation, P.D.; writing—original draft preparation, E.K.; writing—review and editing, R.B.; visualization, E.K.; supervision, P.D.; project administration, P.D.; funding acquisition, P.D. All authors have read and agreed to the published version of the manuscript.
Funding
This research received no external funding.
Institutional Review Board Statement
Not applicable.
Informed Consent Statement
Not applicable.
Data Availability Statement
The data presented in this study are available upon request from the corresponding author.
Acknowledgments
This research was financially supported by the Slovak Research and Development Agency—Grant VEGA 1/0677/22: Quo Vadis, Bankruptcy Models? Prospective Longitudinal Cohort Study with Emphasis on Changes Determined by COVID 19.
Conflicts of Interest
Author Klaudia Bicanovska was employed by the company Sungwoo Hitech Slovakia s.r.o. The remaining authors declare that the research was conducted in the absence of any commercial or financial relationships that could be construed as a potential conflict of interest.
Appendix A
Table A1.
Median values of asset turnover according to NACE.
Table A1.
Median values of asset turnover according to NACE.
| Asset Turnover [Coefficient] | ||||||||
|---|---|---|---|---|---|---|---|---|
| Sector | Country | 2017 | 2018 | 2019 | 2020 | 2021 | 2022 | 2023 |
| A | SK | 0.65 | 0.65 | 0.65 | 0.64 | 0.71 | 0.70 | 0.68 |
| CZ | 0.62 | 0.62 | 0.60 | 0.60 | 0.61 | 0.61 | 0.62 | |
| PL | 0.58 | 0.58 | 0.57 | 0.59 | 0.62 | 0.61 | 0.61 | |
| HU | 0.82 | 0.80 | 0.82 | 0.78 | 0.80 | 0.80 | 0.81 | |
| B | SK | 0.94 | 1.50 | 0.82 | 0.80 | 0.80 | 0.84 | 0.87 |
| CZ | 0.78 | 0.79 | 0.74 | 0.73 | 0.79 | 0.79 | 0.77 | |
| PL | 1.20 | 0.97 | 1.4 | 0.97 | 0.94 | 1.00 | 1.02 | |
| HU | 0.92 | 1.1 | 1.3 | 0.79 | 0.92 | 0.92 | 0.96 | |
| C | SK | 1.33 | 1.31 | 1.3 | 1.19 | 1.23 | 1.31 | 1.33 |
| CZ | 1.55 | 1.49 | 1.47 | 1.40 | 1.46 | 1.49 | 1.53 | |
| PL | 1.50 | 1.49 | 1.48 | 1.37 | 1.46 | 1.44 | 1.49 | |
| HU | 1.39 | 1.39 | 1.35 | 1.22 | 1.25 | 1.26 | 1.31 | |
| D | SK | 0.41 | 0.40 | 0.40 | 0.42 | 0.46 | 0.45 | 0.43 |
| CZ | 0.55 | 0.55 | 0.57 | 0.58 | 0.63 | 0.60 | 0.58 | |
| PL | 0.68 | 0.68 | 0.73 | 0.70 | 0.77 | 0.74 | 0.72 | |
| HU | 0.91 | 0.87 | 0.97 | 0.86 | 0.96 | 0.92 | 0.90 | |
| E | SK | 0.79 | 0.83 | 0.82 | 0.76 | 0.86 | 0.82 | 0.82 |
| CZ | 1.19 | 1.28 | 1.25 | 1.29 | 1.18 | 1.20 | 1.18 | |
| PL | 0.57 | 0.60 | 0.62 | 0.63 | 0.68 | 0.64 | 0.62 | |
| HU | 1.19 | 1.14 | 1.15 | 1.18 | 1.21 | 1.17 | 1.18 | |
| F | SK | 1.12 | 1.13 | 1.1 | 0.98 | 0.96 | 0.99 | 1.01 |
| CZ | 1.50 | 1.54 | 1.45 | 1.43 | 1.44 | 1.46 | 1.51 | |
| PL | 1.33 | 1.43 | 1.39 | 1.21 | 1.25 | 1.28 | 1.31 | |
| HU | 1.21 | 1.39 | 1.41 | 1.25 | 1.24 | 1.21 | 1.23 | |
| G | SK | 1.25 | 1.26 | 1.2 | 1.13 | 1.15 | 1.18 | 1.21 |
| CZ | 1.96 | 1.93 | 1.93 | 1.81 | 1.93 | 1.91 | 1.91 | |
| PL | 2.13 | 2.13 | 2.10 | 1.94 | 2.70 | 2.03 | 2.07 | |
| HU | 1.97 | 1.98 | 2.00 | 1.90 | 1.86 | 1.91 | 1.99 | |
| H | SK | 1.38 | 1.41 | 1.33 | 1.31 | 1.31 | 1.36 | 1.34 |
| CZ | 1.88 | 1.85 | 1.84 | 1.73 | 1.67 | 1.78 | 1.81 | |
| PL | 1.93 | 1.90 | 1.84 | 1.69 | 1.77 | 1.81 | 1.88 | |
| HU | 1.31 | 1.36 | 1.34 | 1.25 | 1.32 | 1.33 | 1.33 | |
| I | SK | 0.39 | 0.39 | 0.42 | 0.32 | 0.31 | 0.33 | 0.34 |
| CZ | 0.45 | 0.47 | 0.49 | 0.32 | 0.33 | 0.34 | 0.36 | |
| PL | 0.74 | 0.75 | 0.76 | 0.46 | 0.59 | 0.62 | 0.72 | |
| HU | 0.77 | 0.74 | 0.69 | 0.48 | 0.59 | 0.63 | 0.71 | |
| J | SK | 1.50 | 1.50 | 1.00 | 0.94 | 0.94 | 1.04 | 1.05 |
| CZ | 1.47 | 1.51 | 1.67 | 1.49 | 1.49 | 1.46 | 1.51 | |
| PL | 1.31 | 1.31 | 1.33 | 1.24 | 1.32 | 1.31 | 1.31 | |
| HU | 1.33 | 1.29 | 1.25 | 1.22 | 1.17 | 1.20 | 1.23 | |
| K | SK | 0.71 | 0.74 | 0.78 | 0.88 | 0.87 | 0.84 | 0.78 |
| CZ | 1.11 | 1.16 | 1.20 | 1.15 | 1.21 | 1.18 | 1.17 | |
| PL | 0.86 | 0.91 | 1.50 | 0.93 | 0.98 | 0.94 | 0.92 | |
| HU | 0.63 | 0.60 | 0.69 | 0.63 | 0.64 | 0.63 | 0.63 | |
| L | SK | 0.15 | 0.15 | 0.15 | 0.14 | 0.15 | 0.15 | 0.15 |
| CZ | 0.12 | 0.12 | 0.13 | 0.12 | 0.13 | 0.13 | 0.13 | |
| PL | 0.27 | 0.28 | 0.28 | 0.29 | 0.32 | 0.31 | 0.30 | |
| HU | 0.18 | 0.19 | 0.19 | 0.20 | 0.18 | 0.18 | 0.18 | |
| M | SK | 0.43 | 0.42 | 0.43 | 0.42 | 0.43 | 0.42 | 0.43 |
| CZ | 1.25 | 1.17 | 1.20 | 1.11 | 1.16 | 1.20 | 1.23 | |
| PL | 1.25 | 1.30 | 1.30 | 1.22 | 1.18 | 1.18 | 1.23 | |
| HU | 0.97 | 0.97 | 1.00 | 0.91 | 0.95 | 0.97 | 0.98 | |
| N | SK | 0.55 | 0.54 | 0.56 | 0.50 | 0.54 | 0.54 | 0.55 |
| CZ | 1.74 | 1.77 | 1.71 | 1.53 | 1.49 | 1.60 | 1.69 | |
| PL | 1.83 | 1.89 | 1.82 | 1.52 | 1.51 | 1.69 | 1.78 | |
| HU | 1.47 | 1.48 | 1.70 | 1.38 | 1.24 | 1.42 | 1.49 | |
| O | SK | 1.39 | 1.45 | 1.70 | 1.75 | 1.32 | 1.42 | 1.44 |
| CZ | 1.70 | 0.83 | 0.50 | 0.59 | 0.31 | 0.52 | 0.80 | |
| PL | 0.90 | 0.86 | 0.84 | 0.87 | 0.79 | 0.79 | 0.93 | |
| HU | 0.79 | 0.57 | 0.76 | 0.52 | 0.59 | 0.60 | 0.63 | |
| P | SK | 0.41 | 0.48 | 0.45 | 0.32 | 0.31 | 0.36 | 0.40 |
| CZ | 0.83 | 0.77 | 0.85 | 0.85 | 0.80 | 0.84 | 0.82 | |
| PL | 0.66 | 0.67 | 0.68 | 0.64 | 0.64 | 0.65 | 0.66 | |
| HU | 1.41 | 0.52 | 0.66 | 0.52 | 1.50 | 1.46 | 1.26 | |
| Q | SK | 1.80 | 1.12 | 1.50 | 1.50 | 1.14 | 1.12 | 1.14 |
| CZ | 1.21 | 1.50 | 1.37 | 1.40 | 1.53 | 1.49 | 1.46 | |
| PL | 1.16 | 1.14 | 1.23 | 1.17 | 1.33 | 1.28 | 1.26 | |
| HU | 1.62 | 1.55 | 1.37 | 1.34 | 1.36 | 1.49 | 1.58 | |
| R | SK | 0.46 | 0.42 | 0.41 | 0.35 | 0.34 | 0.40 | 0.43 |
| CZ | 0.92 | 0.97 | 1.70 | 0.91 | 1.30 | 1.05 | 1.02 | |
| PL | 0.68 | 0.67 | 0.66 | 0.57 | 0.53 | 0.62 | 0.66 | |
| HU | 1.11 | 0.95 | 1.00 | 0.78 | 0.77 | 0.80 | 0.84 | |
| S | SK | 0.72 | 0.69 | 0.69 | 0.58 | 0.73 | 0.72 | 0.72 |
| CZ | 1.27 | 1.80 | 1.21 | 1.13 | 1.10 | 0.99 | 1.01 | |
| PL | 1.40 | 0.98 | 1.50 | 0.97 | 0.94 | 0.96 | 1.02 | |
| HU | 0.82 | 0.89 | 1.30 | 0.74 | 0.81 | 0.83 | 0.87 | |
Source: own processing.
Table A2.
Median values of fixed asset turnover according to NACE.
Table A2.
Median values of fixed asset turnover according to NACE.
| Fixed Asset Turnover [Coefficient] | ||||||||
|---|---|---|---|---|---|---|---|---|
| Sector | Country | 2017 | 2018 | 2019 | 2020 | 2021 | 2022 | 2023 |
| A | SK | 1.80 | 1.14 | 1.12 | 1.10 | 1.27 | 1.31 | 1.26 |
| CZ | 1.00 | 1.10 | 0.94 | 0.96 | 0.97 | 1.01 | 1.03 | |
| PL | 0.75 | 0.73 | 0.72 | 0.80 | 0.91 | 0.88 | 0.85 | |
| HU | 1.39 | 1.37 | 1.35 | 1.31 | 1.34 | 1.36 | 1.38 | |
| B | SK | 1.59 | 1.82 | 1.38 | 1.44 | 1.46 | 1.49 | 1.53 |
| CZ | 1.39 | 1.59 | 1.37 | 1.30 | 1.49 | 1.51 | 1.58 | |
| PL | 1.74 | 2.20 | 1.95 | 1.76 | 1.98 | 2.03 | 1.91 | |
| HU | 1.96 | 2.19 | 1.97 | 1.79 | 1.94 | 1.95 | 1.95 | |
| C | SK | 3.60 | 3.59 | 3.59 | 3.31 | 3.70 | 3.69 | 3.69 |
| CZ | 3.60 | 3.51 | 3.52 | 3.32 | 3.71 | 3.55 | 3.69 | |
| PL | 3.98 | 3.88 | 3.90 | 3.72 | 4.13 | 3.98 | 3.83 | |
| HU | 3.10 | 3.20 | 2.90 | 2.70 | 2.89 | 3.02 | 3.11 | |
| D | SK | 0.49 | 0.51 | 0.58 | 0.66 | 0.69 | 0.71 | 0.70 |
| CZ | 0.61 | 0.64 | 0.63 | 0.63 | 0.74 | 0.79 | 0.77 | |
| PL | 0.82 | 0.82 | 0.86 | 0.84 | 0.93 | 0.90 | 0.89 | |
| HU | 1.26 | 1.15 | 1.23 | 1.16 | 1.48 | 1.44 | 1.36 | |
| E | SK | 1.81 | 1.83 | 1.99 | 1.97 | 2.55 | 2.43 | 2.26 |
| CZ | 2.79 | 2.53 | 2.70 | 2.43 | 2.65 | 2.62 | 2.84 | |
| PL | 0.61 | 0.62 | 0.64 | 0.68 | 0.71 | 0.69 | 0.69 | |
| HU | 2.28 | 2.53 | 2.63 | 2.75 | 2.82 | 2.62 | 2.55 | |
| F | SK | 5.92 | 5.74 | 5.55 | 5.12 | 4.77 | 5.85 | 6.22 |
| CZ | 6.47 | 7.15 | 6.91 | 6.24 | 6.70 | 7.11 | 7.11 | |
| PL | 7.33 | 7.74 | 7.39 | 6.82 | 6.90 | 7.11 | 7.65 | |
| HU | 6.55 | 6.58 | 6.80 | 5.69 | 6.15 | 6.63 | 7.11 | |
| G | SK | 7.27 | 7.30 | 7.19 | 6.52 | 6.96 | 8.29 | 8.29 |
| CZ | 10.87 | 10.87 | 10.53 | 10.71 | 11.56 | 12.44 | 12.44 | |
| PL | 12.58 | 12.90 | 12.67 | 11.99 | 13.16 | 14.21 | 12.44 | |
| HU | 11.84 | 11.84 | 12.8 | 11.35 | 11.79 | 12.44 | 12.44 | |
| H | SK | 3.39 | 3.60 | 3.55 | 3.73 | 4.10 | 4.33 | 4.15 |
| CZ | 4.63 | 4.60 | 4.80 | 4.51 | 4.16 | 4.74 | 5.24 | |
| PL | 5.22 | 5.28 | 5.18 | 4.92 | 5.43 | 5.85 | 5.53 | |
| HU | 2.42 | 2.54 | 2.65 | 2.81 | 2.86 | 2.69 | 2.76 | |
| I | SK | 0.44 | 0.44 | 0.47 | 0.34 | 0.34 | 0.40 | 0.43 |
| CZ | 0.59 | 0.64 | 0.73 | 0.58 | 0.69 | 0.74 | 0.72 | |
| PL | 0.69 | 0.74 | 0.75 | 0.45 | 0.61 | 0.64 | 0.73 | |
| HU | 0.63 | 0.56 | 0.63 | 0.44 | 0.52 | 0.60 | 0.61 | |
| J | SK | 6.45 | 5.56 | 5.62 | 5.16 | 4.73 | 6.63 | 7.65 |
| CZ | 12.20 | 13.68 | 11.45 | 12.31 | 13.68 | 14.21 | 14.21 | |
| PL | 7.52 | 8.27 | 7.78 | 7.58 | 7.40 | 8.29 | 7.65 | |
| HU | 7.68 | 7.68 | 6.72 | 5.97 | 5.89 | 6.63 | 7.65 | |
| K | SK | 4.44 | 3.76 | 3.46 | 2.88 | 2.52 | 5.24 | 6.63 |
| CZ | 1.22 | 3.24 | 2.37 | 1.69 | 2.10 | 2.21 | 2.62 | |
| PL | 3.30 | 3.81 | 3.70 | 2.95 | 3.14 | 3.98 | 3.98 | |
| HU | 2.11 | 1.52 | 2.60 | 1.59 | 1.70 | 2.21 | 2.26 | |
| L | SK | 0.18 | 0.18 | 0.19 | 0.18 | 0.18 | 0.19 | 0.19 |
| CZ | 0.13 | 0.14 | 0.15 | 0.14 | 0.15 | 0.15 | 0.15 | |
| PL | 0.25 | 0.27 | 0.27 | 0.27 | 0.31 | 0.32 | 0.33 | |
| HU | 0.20 | 0.21 | 0.21 | 0.21 | 0.20 | 0.22 | 0.22 | |
| M | SK | 1.27 | 1.20 | 1.13 | 1.14 | 1.16 | 1.66 | 1.69 |
| CZ | 7.20 | 6.63 | 7.30 | 5.88 | 6.11 | 7.11 | 8.29 | |
| PL | 6.24 | 6.44 | 6.40 | 6.14 | 6.76 | 7.11 | 6.63 | |
| HU | 4.90 | 3.89 | 3.98 | 4.24 | 4.16 | 4.52 | 4.33 | |
| N | SK | 1.55 | 1.35 | 1.37 | 1.23 | 1.25 | 2.12 | 2.12 |
| CZ | 6.72 | 5.80 | 6.37 | 5.76 | 4.81 | 8.29 | 7.65 | |
| PL | 11.53 | 11.44 | 11.30 | 10.69 | 10.23 | 12.44 | 12.44 | |
| HU | 4.68 | 5.11 | 5.17 | 3.96 | 3.73 | 4.74 | 5.24 | |
| O | SK | 9.73 | 9.46 | 12.97 | 10.22 | 5.42 | 8.29 | 9.05 |
| CZ | 2.81 | 1.36 | 1.65 | 1.80 | 0.53 | 0.80 | 1.02 | |
| PL | 2.59 | 2.45 | 2.58 | 2.79 | 2.63 | 2.76 | 2.76 | |
| HU | 1.99 | 2.20 | 2.23 | 1.44 | 2.00 | 1.88 | 2.03 | |
| P | SK | 0.76 | 0.72 | 1.11 | 0.92 | 0.91 | 1.00 | 1.09 |
| CZ | 2.60 | 1.46 | 1.26 | 1.20 | 1.23 | 1.18 | 1.28 | |
| PL | 0.69 | 0.75 | 0.70 | 0.77 | 0.81 | 0.75 | 0.72 | |
| HU | 8.77 | 8.48 | 8.95 | 6.4 | 12.37 | 9.95 | 8.29 | |
| Q | SK | 3.61 | 3.91 | 3.77 | 3.82 | 4.39 | 3.98 | 4.33 |
| CZ | 2.38 | 2.67 | 2.85 | 2.96 | 3.33 | 3.32 | 3.02 | |
| PL | 2.67 | 2.75 | 2.86 | 2.68 | 3.28 | 2.69 | 2.84 | |
| HU | 2.68 | 2.42 | 2.90 | 3.13 | 3.51 | 3.32 | 3.11 | |
| R | SK | 0.61 | 0.51 | 0.47 | 0.37 | 0.44 | 0.48 | 0.56 |
| CZ | 2.17 | 2.10 | 3.9 | 3.53 | 3.43 | 3.43 | 3.69 | |
| PL | 0.57 | 0.58 | 0.62 | 0.52 | 0.54 | 0.56 | 0.63 | |
| HU | 1.77 | 1.84 | 2.13 | 1.54 | 1.76 | 2.07 | 2.26 | |
| S | SK | 2.71 | 2.54 | 3.28 | 2.23 | 2.34 | 2.49 | 2.84 |
| CZ | 6.54 | 7.12 | 5.42 | 7.42 | 6.98 | 6.63 | 7.11 | |
| PL | 1.85 | 1.96 | 1.94 | 1.69 | 1.88 | 1.84 | 1.91 | |
| HU | 0.64 | 1.40 | 0.78 | 0.60 | 0.54 | 0.60 | 0.65 | |
Source: own processing.
Table A3.
Median values of inventory turnover according to NACE.
Table A3.
Median values of inventory turnover according to NACE.
| Inventory Turnover [Coefficient] | ||||||||
|---|---|---|---|---|---|---|---|---|
| Sector | Country | 2017 | 2018 | 2019 | 2020 | 2021 | 2022 | 2023 |
| A | SK | 3.75 | 3.79 | 3.53 | 3.58 | 3.99 | 4.09 | 4.12 |
| CZ | 3.53 | 3.72 | 3.55 | 3.46 | 3.62 | 3.65 | 3.70 | |
| PL | 3.33 | 3.28 | 3.27 | 3.36 | 3.31 | 3.33 | 3.38 | |
| HU | 4.18 | 3.98 | 4.20 | 4.58 | 4.21 | 4.26 | 4.30 | |
| B | SK | 15.20 | 15.76 | 15.63 | 18.18 | 14.42 | 14.59 | 14.98 |
| CZ | 14.24 | 17.30 | 13.94 | 12.54 | 13.29 | 14.05 | 14.33 | |
| PL | 14.48 | 14.72 | 12.85 | 12.28 | 12.49 | 13.02 | 14.07 | |
| HU | 9.51 | 10.57 | 10.70 | 7.93 | 9.10 | 9.45 | 10.15 | |
| C | SK | 9.50 | 9.10 | 9.26 | 8.66 | 7.76 | 8.10 | 8.86 |
| CZ | 7.83 | 7.77 | 7.76 | 7.25 | 6.47 | 6.74 | 7.12 | |
| PL | 8.75 | 8.72 | 8.8 | 8.32 | 7.46 | 7.89 | 8.11 | |
| HU | 7.76 | 7.53 | 7.56 | 7.36 | 6.70 | 7.12 | 7.62 | |
| D | SK | 10.87 | 11.99 | 12.63 | 11.32 | 14.31 | 13.15 | 12.66 |
| CZ | 26.59 | 23.87 | 20.92 | 23.33 | 33.18 | 28.17 | 27.54 | |
| PL | 13.85 | 11.90 | 11.70 | 13.84 | 15.57 | 14.96 | 13.59 | |
| HU | 24.43 | 24.30 | 24.15 | 31.49 | 26.17 | 25.53 | 24.93 | |
| E | SK | 42.05 | 42.78 | 42.05 | 39.29 | 44.50 | 43.08 | 44.20 |
| CZ | 44.53 | 52.74 | 51.37 | 45.61 | 47.82 | 48.86 | 49.77 | |
| PL | 75.42 | 76.27 | 72.67 | 75.29 | 73.97 | 74.62 | 74.98 | |
| HU | 44.81 | 45.28 | 47.79 | 50.8 | 53.53 | 50.13 | 49.11 | |
| F | SK | 16.00 | 16.94 | 17.78 | 15.35 | 12.18 | 13.13 | 14.87 |
| CZ | 15.50 | 18.20 | 19.28 | 19.46 | 15.17 | 16.25 | 17.84 | |
| PL | 12.83 | 13.70 | 14.00 | 12.41 | 10.77 | 11.27 | 12.98 | |
| HU | 14.25 | 14.72 | 16.47 | 22.25 | 21.66 | 18.22 | 20.14 | |
| G | SK | 7.66 | 7.56 | 7.51 | 6.98 | 7.21 | 7.26 | 7.54 |
| CZ | 7.84 | 7.66 | 7.50 | 7.33 | 7.80 | 7.80 | 7.76 | |
| PL | 8.89 | 8.85 | 8.74 | 8.70 | 8.58 | 8.81 | 8.85 | |
| HU | 8.91 | 8.80 | 9.90 | 8.86 | 8.81 | 8.87 | 9.03 | |
| H | SK | 59.14 | 66.49 | 74.76 | 64.84 | 66.32 | 66.87 | 64.15 |
| CZ | 56.03 | 57.56 | 62.45 | 60.73 | 57.04 | 57.19 | 59.81 | |
| PL | 42.02 | 44.36 | 45.20 | 43.02 | 42.30 | 44.77 | 45.38 | |
| HU | 98.14 | 94.74 | 91.76 | 100.61 | 99.04 | 100.93 | 100.04 | |
| I | SK | 39.03 | 36.85 | 42.02 | 34.73 | 32.52 | 34.55 | 36.89 |
| CZ | 49.44 | 73.44 | 74.60 | 60.42 | 52.98 | 56.48 | 58.93 | |
| PL | 71.89 | 77.51 | 79.14 | 66.52 | 66.31 | 69.11 | 72.57 | |
| HU | 73.61 | 76.72 | 71.13 | 52.60 | 68.15 | 72.24 | 74.63 | |
| J | SK | 11.56 | 11.70 | 9.92 | 9.22 | 7.68 | 8.44 | 10.17 |
| CZ | 17.00 | 15.53 | 17.15 | 18.73 | 19.45 | 18.14 | 18.99 | |
| PL | 17.19 | 19.16 | 15.42 | 16.11 | 14.42 | 16.42 | 18.31 | |
| HU | 11.40 | 5.75 | 6.66 | 7.51 | 5.60 | 5.74 | 6.22 | |
| K | SK | 0 | 0 | 0 | 0 | 0 | 0 | 0 |
| CZ | 0 | 0 | 0 | 0 | 0 | 0 | 0 | |
| PL | 0 | 0 | 0 | 0 | 0 | 0 | 0 | |
| HU | 0 | 0 | 0 | 0 | 0 | 0 | 0 | |
| L | SK | 0 | 0 | 0 | 0 | 0 | 0 | 0 |
| CZ | 0 | 0 | 0 | 0 | 0 | 0 | 0 | |
| PL | 0 | 0 | 0 | 0 | 0 | 0 | 0 | |
| HU | 0 | 0 | 0 | 0 | 0 | 0 | 0 | |
| M | SK | 0 | 0 | 0.04 | 0.12 | 0.19 | 0.17 | 0.13 |
| CZ | 7.54 | 6.60 | 6.69 | 6.71 | 6.72 | 6.76 | 6.69 | |
| PL | 3.34 | 3.37 | 2.82 | 1.67 | 2.97 | 3.36 | 3.32 | |
| HU | 3.51 | 4.16 | 3.86 | 2.35 | 2.49 | 2.67 | 3.11 | |
| N | SK | 0.52 | 0.85 | 1.23 | 0.92 | 1.13 | 0.96 | 1.05 |
| CZ | 10.40 | 22.20 | 14.59 | 12.20 | 15.47 | 16.13 | 14.65 | |
| PL | 11.90 | 13.57 | 12.40 | 14.10 | 12.41 | 13.52 | 14.03 | |
| HU | 20.98 | 23.60 | 20.63 | 17.33 | 17.13 | 19.48 | 20.36 | |
| O | SK | 103.09 | 46.67 | 295.46 | 391.47 | 180.77 | 195.45 | 130.11 |
| CZ | 2.56 | 4.67 | 5.12 | 2.32 | 1.62 | 2.94 | 4.06 | |
| PL | 0.18 | 0 | 0.05 | 0 | 0.48 | 0 | 0 | |
| HU | 11.49 | 11.52 | 12.26 | 10.67 | 13.44 | 12.68 | 11.97 | |
| P | SK | 7.10 | 7.60 | 8.58 | 5.66 | 6.54 | 7.16 | 7.90 |
| CZ | 44.82 | 18.53 | 9.69 | 2.83 | 10.26 | 19.67 | 13.52 | |
| PL | 84.78 | 84.24 | 67.88 | 76.7 | 85.54 | 86.88 | 84.29 | |
| HU | 36.61 | 87.19 | 71.31 | 95.06 | 35.82 | 36.51 | 74.10 | |
| Q | SK | 50.78 | 49.43 | 50.10 | 34.31 | 41.51 | 45.13 | 50.23 |
| CZ | 59.53 | 60.13 | 62.83 | 52.61 | 60.25 | 60.54 | 61.57 | |
| PL | 80.16 | 84.63 | 89.25 | 54.86 | 68.38 | 77.16 | 80.97 | |
| HU | 93.93 | 99.05 | 90.09 | 58.75 | 56.75 | 90.35 | 93.20 | |
| R | SK | 41.76 | 67.01 | 65.46 | 52.09 | 26.50 | 41.86 | 54.46 |
| CZ | 133.97 | 119.33 | 102.77 | 77.88 | 89.94 | 90.96 | 102.37 | |
| PL | 103.51 | 102.28 | 98.93 | 75.57 | 70.17 | 84.27 | 97.21 | |
| HU | 102.56 | 90.03 | 114.53 | 69.37 | 88.47 | 91.40 | 98.67 | |
| S | SK | 20.61 | 16.60 | 18.18 | 13.11 | 18.91 | 19.12 | 18.30 |
| CZ | 18.94 | 25.20 | 14.20 | 20.72 | 19.96 | 20.04 | 22.57 | |
| PL | 22.98 | 21.55 | 18.15 | 19.46 | 17.84 | 19.46 | 21.07 | |
| HU | 63.71 | 61.65 | 59.56 | 51.78 | 71.16 | 62.49 | 61.23 | |
Source: own processing.
Table A4.
Median values of asset to sales ratio according to NACE.
Table A4.
Median values of asset to sales ratio according to NACE.
| Asset to Sales Ratio [Coefficient] | ||||||||
|---|---|---|---|---|---|---|---|---|
| Sector | Country | 2017 | 2018 | 2019 | 2020 | 2021 | 2022 | 2023 |
| A | SK | 1.53 | 1.53 | 1.53 | 1.55 | 1.42 | 1.43 | 1.46 |
| CZ | 1.60 | 1.63 | 1.67 | 1.66 | 1.64 | 1.64 | 1.61 | |
| PL | 1.71 | 1.73 | 1.75 | 1.69 | 1.60 | 1.63 | 1.64 | |
| HU | 1.22 | 1.24 | 1.22 | 1.29 | 1.25 | 1.24 | 1.23 | |
| B | SK | 1.70 | 0.96 | 1.22 | 1.26 | 1.25 | 1.19 | 1.15 |
| CZ | 1.29 | 1.26 | 1.35 | 1.36 | 1.26 | 1.26 | 1.29 | |
| PL | 0.98 | 1.30 | 0.96 | 1.30 | 1.70 | 1.00 | 0.98 | |
| HU | 1.90 | 0.99 | 0.97 | 1.26 | 1.80 | 1.08 | 1.04 | |
| C | SK | 0.75 | 0.77 | 0.77 | 0.84 | 0.81 | 0.76 | 0.75 |
| CZ | 0.65 | 0.67 | 0.68 | 0.71 | 0.68 | 0.67 | 0.65 | |
| PL | 0.67 | 0.67 | 0.68 | 0.73 | 0.69 | 0.69 | 0.67 | |
| HU | 0.72 | 0.72 | 0.74 | 0.82 | 0.80 | 0.79 | 0.76 | |
| D | SK | 2.44 | 2.52 | 2.48 | 2.38 | 2.17 | 2.21 | 2.34 |
| CZ | 1.83 | 1.83 | 1.77 | 1.73 | 1.58 | 1.66 | 1.71 | |
| PL | 1.47 | 1.48 | 1.37 | 1.42 | 1.31 | 1.34 | 1.38 | |
| HU | 1.10 | 1.15 | 1.30 | 1.16 | 1.40 | 1.08 | 1.10 | |
| E | SK | 1.27 | 1.21 | 1.23 | 1.32 | 1.17 | 1.21 | 1.22 |
| CZ | 0.84 | 0.78 | 0.80 | 0.78 | 0.85 | 0.83 | 0.84 | |
| PL | 1.74 | 1.68 | 1.62 | 1.58 | 1.48 | 1.55 | 1.60 | |
| HU | 0.84 | 0.88 | 0.87 | 0.85 | 0.83 | 0.85 | 0.84 | |
| F | SK | 0.89 | 0.88 | 0.91 | 1.20 | 1.50 | 1.01 | 0.99 |
| CZ | 0.66 | 0.65 | 0.69 | 0.70 | 0.69 | 0.68 | 0.66 | |
| PL | 0.75 | 0.70 | 0.72 | 0.82 | 0.80 | 0.78 | 0.76 | |
| HU | 0.83 | 0.72 | 0.71 | 0.80 | 0.80 | 0.82 | 0.81 | |
| G | SK | 0.80 | 0.80 | 0.84 | 0.88 | 0.87 | 0.84 | 0.82 |
| CZ | 0.51 | 0.52 | 0.52 | 0.55 | 0.52 | 0.52 | 0.52 | |
| PL | 0.47 | 0.47 | 0.48 | 0.51 | 0.48 | 0.49 | 0.48 | |
| HU | 0.51 | 0.51 | 0.5 | 0.53 | 0.54 | 0.52 | 0.50 | |
| H | SK | 0.72 | 0.71 | 0.75 | 0.76 | 0.76 | 0.73 | 0.74 |
| CZ | 0.53 | 0.54 | 0.54 | 0.58 | 0.60 | 0.56 | 0.55 | |
| PL | 0.52 | 0.53 | 0.54 | 0.59 | 0.56 | 0.55 | 0.53 | |
| HU | 0.76 | 0.73 | 0.74 | 0.80 | 0.76 | 0.75 | 0.75 | |
| I | SK | 2.59 | 2.55 | 2.37 | 3.15 | 3.18 | 3.03 | 2.89 |
| CZ | 2.23 | 2.13 | 2.60 | 3.13 | 3.20 | 2.91 | 2.73 | |
| PL | 1.35 | 1.33 | 1.32 | 2.17 | 1.69 | 1.60 | 1.38 | |
| HU | 1.29 | 1.35 | 1.44 | 2.70 | 1.69 | 1.57 | 1.41 | |
| J | SK | 0.95 | 0.95 | 1.00 | 1.60 | 1.60 | 0.96 | 0.95 |
| CZ | 0.68 | 0.66 | 0.60 | 0.67 | 0.67 | 0.68 | 0.66 | |
| PL | 0.76 | 0.76 | 0.75 | 0.81 | 0.76 | 0.76 | 0.76 | |
| HU | 0.75 | 0.78 | 0.80 | 0.82 | 0.85 | 0.83 | 0.81 | |
| K | SK | 1.41 | 1.24 | 1.27 | 1.14 | 1.14 | 1.19 | 1.27 |
| CZ | 0.90 | 0.87 | 0.83 | 0.87 | 0.83 | 0.84 | 0.85 | |
| PL | 1.16 | 1.80 | 0.94 | 1.70 | 1.10 | 1.06 | 1.08 | |
| HU | 1.58 | 1.67 | 1.44 | 1.58 | 1.57 | 1.57 | 1.58 | |
| L | SK | 6.47 | 6.57 | 6.56 | 6.99 | 6.84 | 6.72 | 6.57 |
| CZ | 8.11 | 8.2 | 7.49 | 7.94 | 7.52 | 7.67 | 7.74 | |
| PL | 3.69 | 3.59 | 3.52 | 3.41 | 3.13 | 3.24 | 3.29 | |
| HU | 5.56 | 5.13 | 5.33 | 5.70 | 5.47 | 5.48 | 5.47 | |
| M | SK | 2.34 | 2.36 | 2.34 | 2.35 | 2.35 | 2.36 | 2.33 |
| CZ | 0.80 | 0.85 | 0.83 | 0.90 | 0.86 | 0.83 | 0.81 | |
| PL | 0.80 | 0.77 | 0.77 | 0.82 | 0.85 | 0.84 | 0.81 | |
| HU | 1.30 | 1.30 | 1.00 | 1.10 | 1.60 | 1.03 | 1.02 | |
| N | SK | 1.83 | 1.87 | 1.77 | 2.10 | 1.83 | 1.83 | 1.81 |
| CZ | 0.58 | 0.56 | 0.58 | 0.65 | 0.67 | 0.62 | 0.59 | |
| PL | 0.55 | 0.53 | 0.55 | 0.66 | 0.66 | 0.59 | 0.56 | |
| HU | 0.68 | 0.68 | 0.59 | 0.72 | 0.81 | 0.70 | 0.67 | |
| O | SK | 0.72 | 0.69 | 0.59 | 0.57 | 0.76 | 0.70 | 0.69 |
| CZ | 0.93 | 1.21 | 2.00 | 1.70 | 3.21 | 1.93 | 1.25 | |
| PL | 1.80 | 1.10 | 0.96 | 1.15 | 1.27 | 1.26 | 1.07 | |
| HU | 1.54 | 2.45 | 2.92 | 2.40 | 1.82 | 1.66 | 1.57 | |
| P | SK | 2.42 | 2.70 | 2.21 | 3.80 | 3.20 | 2.76 | 2.48 |
| CZ | 1.23 | 1.30 | 1.18 | 1.18 | 1.25 | 1.18 | 1.22 | |
| PL | 1.51 | 1.48 | 1.47 | 1.57 | 1.55 | 1.54 | 1.51 | |
| HU | 0.71 | 1.93 | 1.51 | 1.93 | 0.67 | 0.68 | 0.79 | |
| Q | SK | 0.93 | 0.89 | 0.95 | 0.95 | 0.87 | 0.89 | 0.87 |
| CZ | 0.83 | 0.67 | 0.73 | 0.71 | 0.65 | 0.67 | 0.68 | |
| PL | 0.86 | 0.88 | 0.81 | 0.85 | 0.75 | 0.78 | 0.79 | |
| HU | 0.62 | 0.64 | 0.73 | 0.75 | 0.73 | 0.67 | 0.63 | |
| R | SK | 2.16 | 2.39 | 2.42 | 2.87 | 2.92 | 2.48 | 2.33 |
| CZ | 1.80 | 0.99 | 0.90 | 1.30 | 0.92 | 0.95 | 0.98 | |
| PL | 1.46 | 1.50 | 1.53 | 1.76 | 1.88 | 1.61 | 1.50 | |
| HU | 0.90 | 1.50 | 1.00 | 1.28 | 1.31 | 1.24 | 1.18 | |
| S | SK | 1.39 | 1.46 | 1.44 | 1.75 | 1.39 | 1.39 | 1.38 |
| CZ | 0.80 | 1.20 | 0.83 | 0.92 | 1.00 | 1.01 | 0.99 | |
| PL | 0.96 | 1.20 | 0.95 | 1.30 | 1.70 | 1.04 | 0.98 | |
| HU | 1.22 | 1.13 | 0.97 | 1.36 | 1.24 | 1.20 | 1.15 | |
Source: own processing.
Table A5.
Median values of fixed asset to sales ratio according to NACE.
Table A5.
Median values of fixed asset to sales ratio according to NACE.
| Fixed Asset to Sales Ratio [Coefficient] | ||||||||
|---|---|---|---|---|---|---|---|---|
| Sector | Country | 2017 | 2018 | 2019 | 2020 | 2021 | 2022 | 2023 |
| A | SK | 0.90 | 0.87 | 0.88 | 0.90 | 0.78 | 0.76 | 0.79 |
| CZ | 1.00 | 0.98 | 1.60 | 1.50 | 1.40 | 0.99 | 0.97 | |
| PL | 1.33 | 1.36 | 1.38 | 1.24 | 1.10 | 1.13 | 1.17 | |
| HU | 0.72 | 0.73 | 0.74 | 0.76 | 0.74 | 0.73 | 0.72 | |
| B | SK | 0.63 | 0.55 | 0.72 | 0.69 | 0.69 | 0.67 | 0.65 |
| CZ | 0.72 | 0.63 | 0.73 | 0.77 | 0.67 | 0.66 | 0.63 | |
| PL | 0.58 | 0.5 | 0.51 | 0.56 | 0.49 | 0.49 | 0.52 | |
| HU | 0.51 | 0.46 | 0.51 | 0.56 | 0.52 | 0.51 | 0.51 | |
| C | SK | 0.27 | 0.27 | 0.27 | 0.29 | 0.26 | 0.27 | 0.27 |
| CZ | 0.27 | 0.28 | 0.28 | 0.3 | 0.27 | 0.28 | 0.27 | |
| PL | 0.25 | 0.26 | 0.26 | 0.27 | 0.24 | 0.25 | 0.26 | |
| HU | 0.32 | 0.33 | 0.34 | 0.37 | 0.34 | 0.33 | 0.32 | |
| D | SK | 2.4 | 1.96 | 1.70 | 1.49 | 1.41 | 1.40 | 1.43 |
| CZ | 1.51 | 1.45 | 1.53 | 1.51 | 1.25 | 1.26 | 1.29 | |
| PL | 1.21 | 1.21 | 1.16 | 1.17 | 1.70 | 1.10 | 1.12 | |
| HU | 0.79 | 0.87 | 0.81 | 0.86 | 0.64 | 0.69 | 0.73 | |
| E | SK | 0.52 | 0.54 | 0.48 | 0.5 | 0.39 | 0.41 | 0.44 |
| CZ | 0.34 | 0.38 | 0.36 | 0.41 | 0.37 | 0.38 | 0.35 | |
| PL | 1.65 | 1.6 | 1.57 | 1.47 | 1.4 | 1.45 | 1.44 | |
| HU | 0.43 | 0.4 | 0.38 | 0.36 | 0.35 | 0.38 | 0.39 | |
| F | SK | 0.16 | 0.16 | 0.17 | 0.18 | 0.19 | 0.17 | 0.16 |
| CZ | 0.15 | 0.14 | 0.14 | 0.15 | 0.15 | 0.14 | 0.14 | |
| PL | 0.13 | 0.13 | 0.13 | 0.14 | 0.14 | 0.14 | 0.13 | |
| HU | 0.15 | 0.14 | 0.14 | 0.17 | 0.16 | 0.15 | 0.14 | |
| G | SK | 0.12 | 0.12 | 0.12 | 0.13 | 0.12 | 0.12 | 0.12 |
| CZ | 0.08 | 0.08 | 0.09 | 0.09 | 0.08 | 0.08 | 0.08 | |
| PL | 0.08 | 0.08 | 0.08 | 0.08 | 0.07 | 0.07 | 0.08 | |
| HU | 0.08 | 0.08 | 0.08 | 0.08 | 0.08 | 0.08 | 0.08 | |
| H | SK | 0.27 | 0.26 | 0.27 | 0.26 | 0.23 | 0.23 | 0.24 |
| CZ | 0.19 | 0.21 | 0.19 | 0.19 | 0.22 | 0.21 | 0.19 | |
| PL | 0.19 | 0.18 | 0.19 | 0.19 | 0.17 | 0.17 | 0.18 | |
| HU | 0.41 | 0.39 | 0.38 | 0.36 | 0.35 | 0.37 | 0.36 | |
| I | SK | 2.23 | 2.22 | 1.99 | 2.8 | 2.84 | 2.50 | 2.34 |
| CZ | 1.68 | 1.57 | 1.37 | 1.71 | 1.39 | 1.34 | 1.38 | |
| PL | 1.44 | 1.35 | 1.33 | 2.22 | 1.59 | 1.56 | 1.36 | |
| HU | 1.57 | 1.61 | 1.47 | 2.19 | 1.88 | 1.66 | 1.64 | |
| J | SK | 0.12 | 0.14 | 0.15 | 0.15 | 0.16 | 0.15 | 0.13 |
| CZ | 0.08 | 0.07 | 0.08 | 0.07 | 0.07 | 0.07 | 0.07 | |
| PL | 0.13 | 0.12 | 0.13 | 0.13 | 0.12 | 0.12 | 0.13 | |
| HU | 0.13 | 0.13 | 0.14 | 0.16 | 0.16 | 0.15 | 0.13 | |
| K | SK | 0.12 | 0.11 | 0.17 | 0.17 | 0.22 | 0.19 | 0.15 |
| CZ | 0.30 | 0.31 | 0.42 | 0.41 | 0.5 | 0.45 | 0.38 | |
| PL | 0.27 | 0.23 | 0.23 | 0.25 | 0.26 | 0.25 | 0.25 | |
| HU | 0.46 | 0.59 | 0.45 | 0.54 | 0.46 | 0.45 | 0.44 | |
| L | SK | 5.34 | 5.38 | 5.5 | 5.44 | 5.24 | 5.21 | 5.27 |
| CZ | 7.57 | 7.23 | 6.80 | 6.90 | 6.53 | 6.49 | 6.73 | |
| PL | 3.86 | 3.68 | 3.60 | 3.62 | 3.14 | 3.08 | 3.02 | |
| HU | 5.30 | 4.76 | 4.72 | 4.46 | 4.54 | 4.49 | 4.60 | |
| M | SK | 0.60 | 0.66 | 0.63 | 0.70 | 0.62 | 0.60 | 0.59 |
| CZ | 0.12 | 0.12 | 0.14 | 0.14 | 0.14 | 0.14 | 0.12 | |
| PL | 0.16 | 0.15 | 0.15 | 0.15 | 0.13 | 0.14 | 0.15 | |
| HU | 0.24 | 0.24 | 0.23 | 0.22 | 0.20 | 0.22 | 0.23 | |
| N | SK | 0.44 | 0.52 | 0.49 | 0.47 | 0.45 | 0.47 | 0.47 |
| CZ | 0.13 | 0.13 | 0.11 | 0.13 | 0.14 | 0.12 | 0.13 | |
| PL | 0.08 | 0.08 | 0.09 | 0.09 | 0.09 | 0.08 | 0.08 | |
| HU | 0.18 | 0.18 | 0.18 | 0.24 | 0.23 | 0.21 | 0.19 | |
| O | SK | 0.10 | 0.11 | 0.08 | 0.10 | 0.18 | 0.12 | 0.11 |
| CZ | 0.36 | 0.73 | 0.60 | 0.56 | 1.89 | 1.25 | 0.98 | |
| PL | 0.37 | 0.36 | 0.38 | 0.36 | 0.38 | 0.36 | 0.36 | |
| HU | 0.54 | 0.59 | 0.48 | 0.72 | 0.51 | 0.53 | 0.49 | |
| P | SK | 0.92 | 0.89 | 0.89 | 0.82 | 1.10 | 1.00 | 0.91 |
| CZ | 0.49 | 0.73 | 0.83 | 0.83 | 0.81 | 0.84 | 0.78 | |
| PL | 1.45 | 1.32 | 1.42 | 1.29 | 1.24 | 1.33 | 1.38 | |
| HU | 0.11 | 0.12 | 0.11 | 0.16 | 0.08 | 0.10 | 0.12 | |
| Q | SK | 0.27 | 0.25 | 0.27 | 0.26 | 0.23 | 0.25 | 0.23 |
| CZ | 0.42 | 0.37 | 0.35 | 0.34 | 0.30 | 0.30 | 0.33 | |
| PL | 0.37 | 0.36 | 0.35 | 0.37 | 0.30 | 0.37 | 0.35 | |
| HU | 0.37 | 0.41 | 0.35 | 0.32 | 0.29 | 0.30 | 0.32 | |
| R | SK | 1.56 | 1.88 | 1.98 | 2.55 | 2.22 | 2.08 | 1.79 |
| CZ | 0.43 | 0.46 | 0.29 | 0.27 | 0.26 | 0.29 | 0.27 | |
| PL | 1.76 | 1.72 | 1.62 | 1.93 | 1.86 | 1.79 | 1.59 | |
| HU | 0.45 | 0.53 | 0.44 | 0.56 | 0.53 | 0.48 | 0.44 | |
| S | SK | 0.37 | 0.33 | 0.29 | 0.39 | 0.38 | 0.40 | 0.35 |
| CZ | 0.15 | 0.14 | 0.19 | 0.14 | 0.14 | 0.15 | 0.14 | |
| PL | 0.54 | 0.51 | 0.51 | 0.59 | 0.53 | 0.54 | 0.52 | |
| HU | 1.56 | 0.97 | 1.29 | 1.67 | 1.85 | 1.65 | 1.54 | |
Source: own processing.
Table A6.
Median values of inventory to sales ratio according to NACE.
Table A6.
Median values of inventory to sales ratio according to NACE.
| Inventory to Sales Ratio [Coefficient] | ||||||||
|---|---|---|---|---|---|---|---|---|
| Sector | Country | 2017 | 2018 | 2019 | 2020 | 2021 | 2022 | 2023 |
| A | SK | 0.23 | 0.24 | 0.25 | 0.25 | 0.23 | 0.23 | 0.24 |
| CZ | 0.26 | 0.25 | 0.26 | 0.26 | 0.25 | 0.25 | 0.25 | |
| PL | 0.28 | 0.27 | 0.27 | 0.25 | 0.27 | 0.27 | 0.27 | |
| HU | 0.24 | 0.25 | 0.24 | 0.22 | 0.23 | 0.23 | 0.24 | |
| B | SK | 0.06 | 0.06 | 0.06 | 0.05 | 0.06 | 0.06 | 0.06 |
| CZ | 0.07 | 0.06 | 0.07 | 0.08 | 0.08 | 0.07 | 0.07 | |
| PL | 0.05 | 0.04 | 0.04 | 0.05 | 0.04 | 0.04 | 0.05 | |
| HU | 0.08 | 0.09 | 0.08 | 0.08 | 0.08 | 0.08 | 0.09 | |
| C | SK | 0.08 | 0.09 | 0.09 | 0.09 | 0.10 | 0.10 | 0.09 |
| CZ | 0.12 | 0.12 | 0.12 | 0.13 | 0.15 | 0.12 | 0.13 | |
| PL | 0.11 | 0.11 | 0.11 | 0.11 | 0.12 | 0.11 | 0.12 | |
| HU | 0.12 | 0.13 | 0.12 | 0.13 | 0.14 | 0.13 | 0.13 | |
| D | SK | 0 | 0 | 0 | 0 | 0 | 0 | 0 |
| CZ | 0 | 0 | 0 | 0 | 0 | 0 | 0 | |
| PL | 0.05 | 0.07 | 0.06 | 0.06 | 0.05 | 0.05 | 0.05 | |
| HU | 0.01 | 0.01 | 0.01 | 0.01 | 0.01 | 0.01 | 0.01 | |
| E | SK | 0.01 | 0.01 | 0.01 | 0.01 | 0.01 | 0.01 | 0.01 |
| CZ | 0.02 | 0.02 | 0.02 | 0.02 | 0.02 | 0.02 | 0.02 | |
| PL | 0.01 | 0.01 | 0.01 | 0.01 | 0.01 | 0.01 | 0.01 | |
| HU | 0.02 | 0.02 | 0.02 | 0.02 | 0.02 | 0.02 | 0.02 | |
| F | SK | 0.01 | 0.01 | 0.01 | 0.02 | 0.02 | 0.01 | 0.01 |
| CZ | 0.04 | 0.04 | 0.04 | 0.04 | 0.05 | 0.04 | 0.04 | |
| PL | 0.04 | 0.03 | 0.03 | 0.04 | 0.05 | 0.04 | 0.03 | |
| HU | 0.04 | 0.04 | 0.04 | 0.02 | 0.02 | 0.04 | 0.04 | |
| G | SK | 0.08 | 0.08 | 0.09 | 0.09 | 0.09 | 0.08 | 0.08 |
| CZ | 0.10 | 0.10 | 0.10 | 0.10 | 0.10 | 0.10 | 0.10 | |
| PL | 0.10 | 0.10 | 0.10 | 0.10 | 0.10 | 0.10 | 0.10 | |
| HU | 0.10 | 0.10 | 0.10 | 0.10 | 0.10 | 0.10 | 0.10 | |
| H | SK | 0 | 0 | 0 | 0 | 0 | 0 | 0 |
| CZ | 0 | 0 | 0 | 0 | 0 | 0 | 0 | |
| PL | 0 | 0 | 0 | 0 | 0 | 0 | 0 | |
| HU | 0 | 0 | 0 | 0 | 0.01 | 0.01 | 0.01 | |
| I | SK | 0.02 | 0.02 | 0.01 | 0.01 | 0.02 | 0.02 | 0.02 |
| CZ | 0.01 | 0.01 | 0.01 | 0.01 | 0.01 | 0.01 | 0.01 | |
| PL | 0.01 | 0.01 | 0.01 | 0.01 | 0.01 | 0.01 | 0.01 | |
| HU | 0.01 | 0.01 | 0.01 | 0.01 | 0.01 | 0.01 | 0.01 | |
| J | SK | 0 | 0 | 0 | 0 | 0 | 0 | 0 |
| CZ | 0 | 0 | 0 | 0 | 0 | 0 | 0 | |
| PL | 0 | 0 | 0 | 0 | 0 | 0 | 0 | |
| HU | 0 | 0 | 0 | 0 | 0 | 0 | 0 | |
| K | SK | 0 | 0 | 0 | 0 | 0 | 0 | 0 |
| CZ | 0 | 0 | 0 | 0 | 0 | 0 | 0 | |
| PL | 0 | 0 | 0 | 0 | 0 | 0 | 0 | |
| HU | 0 | 0 | 0 | 0 | 0 | 0 | 0 | |
| L | SK | 0 | 0 | 0 | 0 | 0 | 0 | 0 |
| CZ | 0 | 0 | 0 | 0 | 0 | 0 | 0 | |
| PL | 0 | 0 | 0 | 0 | 0 | 0 | 0 | |
| HU | 0 | 0 | 0 | 0 | 0 | 0 | 0 | |
| M | SK | 0 | 0 | 0 | 0 | 0 | 0 | 0 |
| CZ | 0.01 | 0 | 0 | 0 | 0 | 0 | 0.01 | |
| PL | 0 | 0 | 0 | 0 | 0 | 0 | 0 | |
| HU | 0 | 0 | 0 | 0 | 0 | 0 | 0 | |
| N | SK | 0 | 0 | 0 | 0 | 0 | 0 | 0 |
| CZ | 0 | 0 | 0 | 0 | 0 | 0 | 0 | |
| PL | 0 | 0 | 0 | 0 | 0 | 0 | 0 | |
| HU | 0 | 0 | 0 | 0 | 0 | 0 | 0 | |
| O | SK | 0 | 0 | 0 | 0 | 0 | 0 | 0 |
| CZ | 0.07 | 0.05 | 0.06 | 0.02 | 0.42 | 0.07 | 0.08 | |
| PL | 0 | 0 | 0 | 0 | 0 | 0 | 0 | |
| HU | 0.09 | 0.09 | 0.09 | 0.09 | 0.08 | 0.09 | 0.09 | |
| P | SK | 0 | 0 | 0 | 0 | 0 | 0 | 0 |
| CZ | 0 | 0 | 0 | 0 | 0 | 0 | 0 | |
| PL | 0 | 0 | 0 | 0 | 0 | 0 | 0 | |
| HU | 0.01 | 0.01 | 0.01 | 0 | 0 | 0 | 0.01 | |
| Q | SK | 0.01 | 0.01 | 0.01 | 0.01 | 0.01 | 0.01 | 0.01 |
| CZ | 0.01 | 0.02 | 0.01 | 0.02 | 0.01 | 0.02 | 0.01 | |
| PL | 0 | 0 | 0 | 0.01 | 0 | 0.01 | 0.01 | |
| HU | 0.01 | 0.01 | 0.01 | 0.01 | 0.01 | 0.01 | 0.01 | |
| R | SK | 0 | 0 | 0 | 0.01 | 0 | 0 | 0 |
| CZ | 0 | 0 | 0 | 0 | 0 | 0.01 | 0.01 | |
| PL | 0.01 | 0.01 | 0 | 0.01 | 0.01 | 0.01 | 0.01 | |
| HU | 0 | 0 | 0 | 0 | 0 | 0 | 0 | |
| S | SK | 0.01 | 0.01 | 0.02 | 0.01 | 0.01 | 0.01 | 0.01 |
| CZ | 0.03 | 0.03 | 0.04 | 0.03 | 0.03 | 0.04 | 0.03 | |
| PL | 0 | 0 | 0 | 0.01 | 0.01 | 0 | 0 | |
| HU | 0.01 | 0.01 | 0.01 | 0.02 | 0.01 | 0.01 | 0.01 | |
Source: own processing.
Table A7.
Median values of asset turnover period according to NACE.
Table A7.
Median values of asset turnover period according to NACE.
| Asset Turnover Period [Day] | ||||||||
|---|---|---|---|---|---|---|---|---|
| Sector | Country | 2017 | 2018 | 2019 | 2020 | 2021 | 2022 | 2023 |
| A | SK | 560 | 558 | 559 | 567 | 517 | 522 | 534 |
| CZ | 586 | 593 | 608 | 607 | 600 | 598 | 588 | |
| PL | 625 | 630 | 637 | 616 | 584 | 594 | 598 | |
| HU | 447 | 454 | 446 | 469 | 456 | 452 | 448 | |
| B | SK | 389 | 349 | 447 | 459 | 455 | 433 | 420 |
| CZ | 471 | 461 | 492 | 498 | 461 | 460 | 472 | |
| PL | 357 | 374 | 349 | 375 | 390 | 366 | 359 | |
| HU | 396 | 360 | 355 | 461 | 395 | 395 | 381 | |
| C | SK | 275 | 279 | 280 | 307 | 296 | 278 | 274 |
| CZ | 236 | 244 | 249 | 260 | 250 | 246 | 237 | |
| PL | 243 | 245 | 247 | 267 | 251 | 251 | 244 | |
| HU | 263 | 264 | 271 | 299 | 292 | 290 | 276 | |
| D | SK | 892 | 918 | 905 | 868 | 792 | 805 | 854 |
| CZ | 667 | 667 | 645 | 630 | 578 | 606 | 624 | |
| PL | 536 | 539 | 501 | 520 | 476 | 488 | 502 | |
| HU | 402 | 419 | 375 | 424 | 379 | 396 | 401 | |
| E | SK | 465 | 442 | 447 | 481 | 426 | 441 | 447 |
| CZ | 307 | 285 | 291 | 284 | 310 | 302 | 305 | |
| PL | 637 | 613 | 592 | 576 | 538 | 567 | 583 | |
| HU | 306 | 320 | 317 | 310 | 301 | 309 | 306 | |
| F | SK | 326 | 322 | 330 | 371 | 382 | 370 | 363 |
| CZ | 240 | 238 | 250 | 256 | 253 | 247 | 242 | |
| PL | 274 | 255 | 263 | 301 | 291 | 286 | 279 | |
| HU | 302 | 263 | 259 | 292 | 293 | 300 | 296 | |
| G | SK | 292 | 290 | 305 | 322 | 318 | 305 | 299 |
| CZ | 186 | 189 | 189 | 202 | 189 | 189 | 189 | |
| PL | 172 | 172 | 174 | 188 | 176 | 180 | 174 | |
| HU | 186 | 184 | 183 | 192 | 196 | 190 | 184 | |
| H | SK | 264 | 258 | 274 | 278 | 279 | 268 | 271 |
| CZ | 194 | 197 | 199 | 211 | 218 | 205 | 199 | |
| PL | 189 | 192 | 198 | 216 | 206 | 200 | 193 | |
| HU | 278 | 268 | 272 | 291 | 277 | 274 | 272 | |
| I | SK | 946 | 930 | 864 | 1148 | 1159 | 1106 | 1054 |
| CZ | 813 | 776 | 751 | 1143 | 1104 | 1063 | 998 | |
| PL | 494 | 486 | 481 | 790 | 617 | 584 | 502 | |
| HU | 471 | 492 | 525 | 757 | 619 | 573 | 516 | |
| J | SK | 349 | 347 | 363 | 386 | 388 | 350 | 347 |
| CZ | 248 | 241 | 219 | 246 | 245 | 249 | 240 | |
| PL | 279 | 279 | 275 | 294 | 276 | 279 | 279 | |
| HU | 274 | 283 | 291 | 298 | 311 | 304 | 295 | |
| K | SK | 514 | 451 | 465 | 417 | 415 | 433 | 462 |
| CZ | 329 | 316 | 303 | 318 | 302 | 308 | 310 | |
| PL | 422 | 395 | 342 | 391 | 370 | 387 | 396 | |
| HU | 578 | 609 | 527 | 576 | 572 | 572 | 578 | |
| L | SK | 2361 | 2396 | 2394 | 2552 | 2497 | 2453 | 2397 |
| CZ | 2960 | 2928 | 2734 | 2898 | 2746 | 2798 | 2824 | |
| PL | 1347 | 1312 | 1283 | 1246 | 1142 | 1182 | 1201 | |
| HU | 2029 | 1872 | 1945 | 1850 | 1998 | 2002 | 1996 | |
| M | SK | 852 | 863 | 856 | 859 | 857 | 860 | 852 |
| CZ | 291 | 310 | 303 | 329 | 312 | 303 | 296 | |
| PL | 291 | 282 | 282 | 300 | 309 | 306 | 294 | |
| HU | 377 | 376 | 365 | 401 | 386 | 377 | 373 | |
| N | SK | 667 | 681 | 647 | 735 | 669 | 667 | 659 |
| CZ | 210 | 206 | 213 | 238 | 245 | 228 | 217 | |
| PL | 200 | 193 | 201 | 239 | 242 | 216 | 205 | |
| HU | 249 | 247 | 215 | 265 | 295 | 255 | 243 | |
| O | SK | 262 | 251 | 215 | 209 | 277 | 254 | 251 |
| CZ | 340 | 441 | 731 | 621 | 1171 | 705 | 456 | |
| PL | 394 | 401 | 349 | 418 | 463 | 460 | 390 | |
| HU | 562 | 895 | 1064 | 874 | 666 | 605 | 574 | |
| P | SK | 884 | 754 | 805 | 1124 | 1169 | 1006 | 904 |
| CZ | 448 | 476 | 430 | 431 | 458 | 430 | 446 | |
| PL | 551 | 541 | 535 | 572 | 567 | 562 | 550 | |
| HU | 259 | 704 | 552 | 704 | 244 | 249 | 288 | |
| Q | SK | 339 | 325 | 347 | 347 | 319 | 325 | 319 |
| CZ | 302 | 243 | 266 | 260 | 238 | 246 | 248 | |
| PL | 313 | 320 | 296 | 311 | 275 | 284 | 287 | |
| HU | 225 | 235 | 267 | 273 | 268 | 243 | 231 | |
| R | SK | 787 | 874 | 884 | 1048 | 1066 | 907 | 851 |
| CZ | 396 | 363 | 327 | 375 | 336 | 348 | 359 | |
| PL | 534 | 546 | 557 | 642 | 685 | 589 | 547 | |
| HU | 328 | 384 | 365 | 468 | 476 | 453 | 432 | |
| S | SK | 507 | 533 | 527 | 637 | 508 | 508 | 505 |
| CZ | 291 | 371 | 304 | 334 | 366 | 370 | 361 | |
| PL | 350 | 371 | 347 | 375 | 390 | 378 | 356 | |
| HU | 444 | 412 | 356 | 495 | 452 | 437 | 421 | |
Source: own processing.
Table A8.
Median values of fixed asset turnover period according to NACE.
Table A8.
Median values of fixed asset turnover period according to NACE.
| Fixed Asset Turnover Period [Day] | ||||||||
|---|---|---|---|---|---|---|---|---|
| Sector | Country | 2017 | 2018 | 2019 | 2020 | 2021 | 2022 | 2023 |
| A | SK | 330 | 319 | 322 | 329 | 284 | 276 | 289 |
| CZ | 364 | 359 | 387 | 382 | 378 | 362 | 353 | |
| PL | 486 | 497 | 505 | 453 | 402 | 412 | 428 | |
| HU | 262 | 266 | 270 | 277 | 270 | 265 | 261 | |
| B | SK | 230 | 200 | 264 | 253 | 250 | 243 | 236 |
| CZ | 262 | 229 | 267 | 281 | 244 | 240 | 231 | |
| PL | 210 | 181 | 187 | 204 | 180 | 180 | 189 | |
| HU | 186 | 167 | 186 | 204 | 188 | 186 | 186 | |
| C | SK | 100 | 100 | 100 | 107 | 97 | 100 | 100 |
| CZ | 100 | 102 | 102 | 109 | 97 | 102 | 98 | |
| PL | 92 | 94 | 93 | 98 | 87 | 93 | 94 | |
| HU | 118 | 120 | 125 | 135 | 125 | 120 | 116 | |
| D | SK | 745 | 715 | 620 | 542 | 516 | 510 | 523 |
| CZ | 551 | 528 | 559 | 549 | 456 | 460 | 472 | |
| PL | 443 | 441 | 424 | 427 | 391 | 402 | 410 | |
| HU | 290 | 317 | 296 | 315 | 232 | 253 | 268 | |
| E | SK | 191 | 197 | 174 | 182 | 142 | 148 | 162 |
| CZ | 125 | 139 | 131 | 148 | 133 | 137 | 129 | |
| PL | 602 | 582 | 572 | 536 | 512 | 530 | 526 | |
| HU | 157 | 144 | 139 | 133 | 129 | 137 | 141 | |
| F | SK | 58 | 58 | 62 | 66 | 70 | 63 | 57 |
| CZ | 55 | 49 | 52 | 56 | 54 | 52 | 50 | |
| PL | 48 | 47 | 48 | 52 | 51 | 52 | 49 | |
| HU | 54 | 52 | 52 | 61 | 57 | 55 | 52 | |
| G | SK | 43 | 44 | 45 | 48 | 44 | 42 | 42 |
| CZ | 30 | 30 | 31 | 31 | 28 | 30 | 28 | |
| PL | 29 | 28 | 28 | 30 | 27 | 27 | 28 | |
| HU | 30 | 30 | 29 | 31 | 29 | 30 | 29 | |
| H | SK | 100 | 95 | 99 | 93 | 85 | 84 | 88 |
| CZ | 71 | 76 | 70 | 69 | 79 | 75 | 70 | |
| PL | 69 | 67 | 69 | 70 | 63 | 63 | 67 | |
| HU | 150 | 141 | 138 | 130 | 128 | 135 | 130 | |
| I | SK | 814 | 811 | 727 | 1023 | 1035 | 912 | 854 |
| CZ | 614 | 573 | 499 | 624 | 506 | 490 | 502 | |
| PL | 524 | 494 | 485 | 810 | 579 | 569 | 498 | |
| HU | 572 | 587 | 536 | 798 | 686 | 606 | 597 | |
| J | SK | 45 | 50 | 53 | 55 | 58 | 55 | 48 |
| CZ | 29 | 25 | 29 | 27 | 26 | 26 | 24 | |
| PL | 47 | 44 | 46 | 48 | 44 | 44 | 46 | |
| HU | 47 | 46 | 52 | 60 | 59 | 56 | 49 | |
| K | SK | 44 | 40 | 62 | 62 | 81 | 69 | 55 |
| CZ | 109 | 113 | 154 | 150 | 182 | 165 | 139 | |
| PL | 97 | 84 | 84 | 93 | 94 | 90 | 93 | |
| HU | 168 | 215 | 164 | 196 | 167 | 164 | 160 | |
| L | SK | 1949 | 1962 | 1844 | 1987 | 1913 | 1902 | 1923 |
| CZ | 2763 | 2639 | 2483 | 2519 | 2382 | 2368 | 2457 | |
| PL | 1409 | 1342 | 1313 | 1323 | 1145 | 1124 | 1102 | |
| HU | 1838 | 1736 | 1722 | 1629 | 1657 | 1638 | 1678 | |
| M | SK | 218 | 242 | 230 | 254 | 225 | 220 | 217 |
| CZ | 44 | 45 | 50 | 51 | 50 | 50 | 44 | |
| PL | 57 | 56 | 55 | 56 | 49 | 52 | 55 | |
| HU | 87 | 88 | 85 | 79 | 74 | 79 | 83 | |
| N | SK | 159 | 189 | 178 | 173 | 165 | 170 | 173 |
| CZ | 47 | 47 | 40 | 47 | 50 | 45 | 47 | |
| PL | 29 | 31 | 31 | 33 | 33 | 30 | 31 | |
| HU | 67 | 65 | 67 | 86 | 85 | 77 | 68 | |
| O | SK | 38 | 39 | 28 | 36 | 67 | 43 | 39 |
| CZ | 130 | 268 | 221 | 203 | 692 | 456 | 357 | |
| PL | 133 | 131 | 138 | 131 | 139 | 131 | 133 | |
| HU | 195 | 216 | 174 | 262 | 185 | 195 | 179 | |
| P | SK | 336 | 325 | 326 | 298 | 400 | 365 | 331 |
| CZ | 177 | 266 | 302 | 305 | 297 | 305 | 284 | |
| PL | 530 | 484 | 518 | 471 | 452 | 487 | 503 | |
| HU | 42 | 43 | 41 | 57 | 29 | 35 | 42 | |
| Q | SK | 99 | 93 | 97 | 94 | 83 | 90 | 85 |
| CZ | 153 | 137 | 128 | 123 | 110 | 110 | 121 | |
| PL | 135 | 133 | 128 | 134 | 110 | 135 | 128 | |
| HU | 136 | 151 | 126 | 117 | 104 | 109 | 115 | |
| R | SK | 570 | 686 | 723 | 932 | 811 | 758 | 654 |
| CZ | 157 | 169 | 105 | 100 | 93 | 105 | 100 | |
| PL | 642 | 628 | 593 | 704 | 678 | 652 | 581 | |
| HU | 163 | 192 | 162 | 205 | 195 | 174 | 160 | |
| S | SK | 135 | 120 | 106 | 143 | 137 | 145 | 127 |
| CZ | 56 | 51 | 69 | 49 | 52 | 55 | 50 | |
| PL | 197 | 186 | 188 | 216 | 194 | 197 | 188 | |
| HU | 571 | 352 | 471 | 611 | 674 | 602 | 563 | |
Source: own processing.
Table A9.
Median values of inventory turnover period according to NACE.
Table A9.
Median values of inventory turnover period according to NACE.
| Inventory Turnover Period [Day] | ||||||||
|---|---|---|---|---|---|---|---|---|
| Sector | Country | 2017 | 2018 | 2019 | 2020 | 2021 | 2022 | 2023 |
| A | SK | 86 | 87 | 92 | 92 | 84 | 85 | 87 |
| CZ | 93 | 90 | 94 | 94 | 91 | 90 | 90 | |
| PL | 101 | 97 | 98 | 92 | 98 | 100 | 97 | |
| HU | 87 | 92 | 87 | 79 | 85 | 83 | 88 | |
| B | SK | 23 | 22 | 21 | 19 | 21 | 22 | 21 |
| CZ | 26 | 21 | 25 | 29 | 27 | 25 | 24 | |
| PL | 18 | 15 | 16 | 17 | 14 | 15 | 17 | |
| HU | 31 | 33 | 29 | 30 | 31 | 30 | 33 | |
| C | SK | 31 | 32 | 32 | 34 | 38 | 36 | 32 |
| CZ | 45 | 45 | 45 | 48 | 53 | 45 | 46 | |
| PL | 39 | 39 | 39 | 40 | 45 | 41 | 43 | |
| HU | 45 | 47 | 46 | 47 | 51 | 47 | 49 | |
| D | SK | 0 | 0 | 0 | 0 | 0 | 0 | 0 |
| CZ | 1 | 1 | 1 | 2 | 1 | 1 | 1 | |
| PL | 18 | 24 | 22 | 21 | 17 | 18 | 20 | |
| HU | 4 | 4 | 4 | 4 | 4 | 4 | 4 | |
| E | SK | 4 | 5 | 4 | 5 | 4 | 5 | 5 |
| CZ | 6 | 5 | 6 | 6 | 6 | 6 | 6 | |
| PL | 4 | 4 | 4 | 4 | 4 | 4 | 4 | |
| HU | 6 | 6 | 7 | 6 | 6 | 6 | 6 | |
| F | SK | 4 | 4 | 5 | 5 | 7 | 5 | 4 |
| CZ | 14 | 14 | 13 | 14 | 17 | 14 | 14 | |
| PL | 14 | 13 | 12 | 13 | 17 | 13 | 12 | |
| HU | 15 | 16 | 13 | 8 | 9 | 14 | 15 | |
| G | SK | 31 | 31 | 31 | 32 | 32 | 31 | 31 |
| CZ | 35 | 36 | 36 | 37 | 35 | 36 | 36 | |
| PL | 37 | 37 | 38 | 38 | 39 | 37 | 37 | |
| HU | 36 | 37 | 36 | 36 | 36 | 36 | 36 | |
| H | SK | 1 | 1 | 1 | 1 | 1 | 1 | 1 |
| CZ | 1 | 1 | 2 | 1 | 1 | 1 | 1 | |
| PL | 1 | 1 | 1 | 1 | 1 | 1 | 1 | |
| HU | 1 | 2 | 2 | 2 | 2 | 2 | 2 | |
| I | SK | 6 | 6 | 5 | 5 | 6 | 6 | 6 |
| CZ | 4 | 4 | 3 | 5 | 4 | 5 | 5 | |
| PL | 4 | 4 | 4 | 4 | 4 | 4 | 4 | |
| HU | 4 | 4 | 4 | 4 | 4 | 4 | 4 | |
| J | SK | 0 | 0 | 0 | 0 | 0 | 0 | 0 |
| CZ | 2 | 1 | 1 | 1 | 1 | 1 | 1 | |
| PL | 1 | 1 | 1 | 1 | 1 | 1 | 1 | |
| HU | 1 | 1 | 0 | 0 | 0 | 1 | 1 | |
| K | SK | 0 | 0 | 0 | 0 | 0 | 0 | 0 |
| CZ | 0 | 0 | 0 | 0 | 0 | 0 | 0 | |
| PL | 0 | 0 | 0 | 0 | 0 | 0 | 0 | |
| HU | 0 | 0 | 0 | 0 | 0 | 0 | 0 | |
| L | SK | 0 | 0 | 0 | 0 | 0 | 0 | 0 |
| CZ | 0 | 0 | 0 | 0 | 0 | 0 | 0 | |
| PL | 0 | 0 | 0 | 0 | 0 | 0 | 0 | |
| HU | 0 | 0 | 0 | 0 | 0 | 0 | 0 | |
| M | SK | 0 | 0 | 0 | 0 | 0 | 0 | 0 |
| CZ | 2 | 1 | 2 | 2 | 2 | 1 | 2 | |
| PL | 0 | 0 | 0 | 0 | 0 | 0 | 0 | |
| HU | 1 | 0 | 0 | 0 | 0 | 0 | 0 | |
| N | SK | 0 | 0 | 0 | 0 | 0 | 0 | 0 |
| CZ | 0 | 0 | 0 | 0 | 1 | 0 | 0 | |
| PL | 0 | 0 | 0 | 0 | 0 | 0 | 0 | |
| HU | 1 | 1 | 1 | 1 | 1 | 1 | 1 | |
| O | SK | 1 | 0 | 0 | 0 | 0 | 0 | 0 |
| CZ | 27 | 19 | 22 | 6 | 153 | 25 | 31 | |
| PL | 0 | 0 | 0 | 0 | 0 | 0 | 0 | |
| HU | 34 | 34 | 32 | 34 | 31 | 34 | 34 | |
| P | SK | 0 | 1 | 0 | 1 | 0 | 1 | 0 |
| CZ | 1 | 1 | 0 | 0 | 0 | 0 | 0 | |
| PL | 1 | 1 | 1 | 1 | 1 | 1 | 1 | |
| HU | 3 | 3 | 2 | 1 | 1 | 1 | 2 | |
| Q | SK | 2 | 3 | 3 | 4 | 3 | 3 | 3 |
| CZ | 5 | 6 | 5 | 6 | 5 | 6 | 5 | |
| PL | 2 | 2 | 2 | 2 | 2 | 2 | 2 | |
| HU | 3 | 2 | 2 | 4 | 4 | 3 | 2 | |
| R | SK | 1 | 1 | 1 | 2 | 1 | 1 | 1 |
| CZ | 1 | 2 | 2 | 2 | 2 | 2 | 2 | |
| PL | 2 | 2 | 2 | 2 | 2 | 2 | 2 | |
| HU | 1 | 1 | 1 | 1 | 1 | 1 | 1 | |
| S | SK | 3 | 4 | 6 | 4 | 4 | 4 | 4 |
| CZ | 13 | 12 | 14 | 11 | 12 | 13 | 12 | |
| PL | 1 | 1 | 2 | 2 | 1 | 1 | 1 | |
| HU | 5 | 5 | 5 | 6 | 5 | 5 | 5 | |
Source: own processing.
Table A10.
Median values of collection period ratio according to NACE.
Table A10.
Median values of collection period ratio according to NACE.
| Collection Period Ratio [Day] | ||||||||
|---|---|---|---|---|---|---|---|---|
| Sector | Country | 2017 | 2018 | 2019 | 2020 | 2021 | 2022 | 2023 |
| A | SK | 31 | 29 | 30 | 29 | 29 | 30 | 31 |
| CZ | 32 | 30 | 28 | 28 | 30 | 28 | 28 | |
| PL | 61 | 63 | 61 | 53 | 47 | 51 | 56 | |
| HU | 21 | 22 | 23 | 21 | 18 | 22 | 22 | |
| B | SK | 47 | 43 | 38 | 36 | 40 | 41 | 42 |
| CZ | 44 | 40 | 39 | 40 | 39 | 39 | 39 | |
| PL | 55 | 51 | 49 | 47 | 47 | 48 | 50 | |
| HU | 24 | 26 | 22 | 19 | 21 | 21 | 22 | |
| C | SK | 49 | 45 | 42 | 42 | 43 | 42 | 44 |
| CZ | 44 | 43 | 40 | 42 | 41 | 44 | 43 | |
| PL | 54 | 52 | 50 | 48 | 49 | 50 | 53 | |
| HU | 35 | 34 | 32 | 31 | 31 | 33 | 34 | |
| D | SK | 35 | 40 | 41 | 36 | 40 | 40 | 39 |
| CZ | 21 | 21 | 19 | 17 | 20 | 22 | 21 | |
| PL | 52 | 53 | 53 | 52 | 56 | 54 | 56 | |
| HU | 19 | 20 | 18 | 17 | 14 | 18 | 20 | |
| E | SK | 46 | 50 | 45 | 47 | 49 | 49 | 48 |
| CZ | 34 | 33 | 30 | 31 | 33 | 34 | 34 | |
| PL | 43 | 43 | 43 | 42 | 39 | 41 | 43 | |
| HU | 59 | 58 | 57 | 50 | 47 | 55 | 56 | |
| F | SK | 75 | 72 | 73 | 74 | 74 | 74 | 74 |
| CZ | 65 | 59 | 58 | 57 | 58 | 60 | 53 | |
| PL | 68 | 60 | 63 | 62 | 61 | 62 | 65 | |
| HU | 60 | 53 | 50 | 46 | 50 | 50 | 54 | |
| G | SK | 40 | 38 | 35 | 35 | 34 | 36 | 36 |
| CZ | 39 | 36 | 36 | 34 | 35 | 35 | 36 | |
| PL | 40 | 39 | 37 | 35 | 34 | 35 | 35 | |
| HU | 29 | 30 | 28 | 24 | 25 | 28 | 30 | |
| H | SK | 57 | 56 | 54 | 57 | 54 | 56 | 57 |
| CZ | 27 | 28 | 23 | 27 | 25 | 27 | 28 | |
| PL | 60 | 58 | 55 | 57 | 55 | 59 | 55 | |
| HU | 44 | 45 | 41 | 41 | 42 | 42 | 41 | |
| I | SK | 20 | 21 | 17 | 20 | 19 | 20 | 20 |
| CZ | 19 | 17 | 15 | 15 | 20 | 19 | 50 | |
| PL | 22 | 19 | 16 | 21 | 17 | 22 | 20 | |
| HU | 11 | 10 | 10 | 5 | 8 | 10 | 11 | |
| J | SK | 69 | 62 | 63 | 58 | 56 | 59 | 63 |
| CZ | 54 | 55 | 51 | 48 | 48 | 50 | 50 | |
| PL | 69 | 66 | 62 | 60 | 59 | 62 | 66 | |
| HU | 36 | 40 | 40 | 33 | 36 | 40 | 40 | |
| K | SK | 39 | 39 | 38 | 40 | 37 | 39 | 39 |
| CZ | 41 | 37 | 40 | 37 | 31 | 35 | 37 | |
| PL | 50 | 47 | 50 | 49 | 46 | 50 | 49 | |
| HU | 11 | 10 | 10 | 16 | 18 | 16 | 16 | |
| L | SK | 38 | 36 | 36 | 39 | 41 | 38 | 39 |
| CZ | 30 | 29 | 26 | 32 | 27 | 29 | 31 | |
| PL | 32 | 30 | 29 | 28 | 27 | 27 | 30 | |
| HU | 14 | 14 | 11 | 10 | 9 | 11 | 14 | |
| M | SK | 64 | 62 | 61 | 60 | 60 | 60 | 60 |
| CZ | 59 | 62 | 58 | 53 | 55 | 58 | 60 | |
| PL | 73 | 72 | 72 | 71 | 69 | 74 | 71 | |
| HU | 39 | 39 | 36 | 32 | 29 | 35 | 29 | |
| N | SK | 51 | 51 | 51 | 53 | 48 | 50 | 51 |
| CZ | 44 | 47 | 48 | 45 | 43 | 46 | 46 | |
| PL | 60 | 58 | 54 | 55 | 55 | 57 | 55 | |
| HU | 32 | 31 | 28 | 27 | 30 | 30 | 32 | |
| O | SK | 62 | 72 | 66 | 63 | 89 | 75 | 77 |
| CZ | 25 | 42 | 43 | 59 | 72 | 66 | 60 | |
| PL | 31 | 31 | 34 | 36 | 39 | 36 | 35 | |
| HU | 13 | 13 | 18 | 6 | 7 | 10 | 14 | |
| P | SK | 44 | 37 | 33 | 33 | 32 | 35 | 35 |
| CZ | 23 | 22 | 18 | 24 | 18 | 20 | 22 | |
| PL | 11 | 11 | 11 | 12 | 11 | 11 | 11 | |
| HU | 23 | 23 | 38 | 24 | 27 | 23 | 24 | |
| Q | SK | 41 | 36 | 32 | 42 | 41 | 40 | 41 |
| CZ | 30 | 28 | 28 | 28 | 26 | 28 | 28 | |
| PL | 34 | 34 | 33 | 35 | 36 | 33 | 34 | |
| HU | 40 | 34 | 36 | 33 | 21 | 29 | 30 | |
| R | SK | 25 | 24 | 28 | 30 | 26 | 25 | 25 |
| CZ | 19 | 14 | 12 | 16 | 12 | 16 | 14 | |
| PL | 17 | 16 | 15 | 17 | 18 | 17 | 17 | |
| HU | 5 | 6 | 4 | 2 | 4 | 5 | 4 | |
| S | SK | 50 | 57 | 57 | 42 | 39 | 45 | 50 |
| CZ | 27 | 30 | 34 | 37 | 28 | 30 | 29 | |
| PL | 24 | 26 | 25 | 27 | 28 | 28 | 25 | |
| HU | 21 | 16 | 14 | 7 | 12 | 13 | 19 | |
Source: own processing.
Table A11.
Median values of credit period ratio according to NACE.
Table A11.
Median values of credit period ratio according to NACE.
| Credit Period Ratio [Day] | ||||||||
|---|---|---|---|---|---|---|---|---|
| Sector | Country | 2017 | 2018 | 2019 | 2020 | 2021 | 2022 | 2023 |
| A | SK | 46 | 46 | 49 | 48 | 44 | 46 | 46 |
| CZ | 25 | 27 | 28 | 26 | 29 | 27 | 28 | |
| PL | 21 | 20 | 21 | 16 | 19 | 20 | 21 | |
| HU | 19 | 22 | 23 | 20 | 18 | 20 | 20 | |
| B | SK | 30 | 27 | 24 | 18 | 23 | 25 | 24 |
| CZ | 34 | 28 | 29 | 27 | 27 | 27 | 30 | |
| PL | 27 | 24 | 21 | 22 | 21 | 21 | 22 | |
| HU | 12 | 24 | 20 | 15 | 19 | 20 | 18 | |
| C | SK | 39 | 38 | 35 | 35 | 37 | 35 | 38 |
| CZ | 30 | 29 | 27 | 27 | 31 | 30 | 30 | |
| PL | 32 | 31 | 29 | 28 | 31 | 30 | 31 | |
| HU | 25 | 25 | 23 | 24 | 26 | 25 | 25 | |
| D | SK | 29 | 33 | 32 | 32 | 32 | 33 | 32 |
| CZ | 16 | 15 | 17 | 14 | 13 | 15 | 15 | |
| PL | 30 | 29 | 31 | 26 | 30 | 29 | 30 | |
| HU | 19 | 21 | 17 | 17 | 15 | 15 | 17 | |
| E | SK | 34 | 31 | 28 | 29 | 26 | 29 | 30 |
| CZ | 24 | 24 | 22 | 22 | 23 | 24 | 24 | |
| PL | 18 | 17 | 17 | 17 | 18 | 18 | 18 | |
| HU | 29 | 33 | 32 | 28 | 29 | 30 | 32 | |
| F | SK | 53 | 52 | 51 | 46 | 48 | 50 | 50 |
| CZ | 41 | 39 | 36 | 36 | 36 | 36 | 36 | |
| PL | 41 | 35 | 35 | 33 | 35 | 35 | 35 | |
| HU | 47 | 47 | 40 | 38 | 39 | 40 | 38 | |
| G | SK | 41 | 39 | 36 | 35 | 36 | 35 | 36 |
| CZ | 31 | 31 | 28 | 28 | 29 | 30 | 31 | |
| PL | 32 | 31 | 30 | 27 | 28 | 28 | 31 | |
| HU | 20 | 20 | 17 | 16 | 16 | 20 | 20 | |
| H | SK | 32 | 32 | 30 | 29 | 29 | 30 | 29 |
| CZ | 51 | 51 | 48 | 51 | 49 | 51 | 51 | |
| PL | 28 | 29 | 26 | 25 | 27 | 27 | 28 | |
| HU | 22 | 23 | 20 | 19 | 22 | 23 | 22 | |
| I | SK | 31 | 30 | 28 | 30 | 30 | 30 | 30 |
| CZ | 13 | 14 | 13 | 8 | 12 | 13 | 13 | |
| PL | 17 | 15 | 14 | 16 | 17 | 15 | 16 | |
| HU | 18 | 16 | 16 | 18 | 19 | 18 | 16 | |
| J | SK | 34 | 35 | 34 | 31 | 30 | 33 | 34 |
| CZ | 22 | 22 | 21 | 19 | 21 | 20 | 20 | |
| PL | 28 | 26 | 24 | 24 | 24 | 24 | 26 | |
| HU | 21 | 18 | 20 | 17 | 18 | 17 | 20 | |
| K | SK | 33 | 25 | 25 | 21 | 20 | 25 | 22 |
| CZ | 23 | 17 | 17 | 15 | 16 | 17 | 17 | |
| PL | 20 | 20 | 17 | 17 | 18 | 17 | 18 | |
| HU | 9 | 8 | 9 | 7 | 10 | 10 | 10 | |
| L | SK | 40 | 36 | 35 | 36 | 32 | 35 | 37 |
| CZ | 16 | 16 | 13 | 13 | 15 | 16 | 16 | |
| PL | 26 | 26 | 24 | 23 | 24 | 26 | 24 | |
| HU | 11 | 12 | 11 | 9 | 10 | 11 | 11 | |
| M | SK | 40 | 39 | 35 | 35 | 32 | 33 | 35 |
| CZ | 21 | 22 | 21 | 19 | 23 | 20 | 22 | |
| PL | 24 | 24 | 23 | 21 | 21 | 21 | 23 | |
| HU | 18 | 15 | 14 | 15 | 15 | 15 | 15 | |
| N | SK | 31 | 30 | 28 | 31 | 29 | 30 | 30 |
| CZ | 20 | 22 | 20 | 19 | 16 | 17 | 16 | |
| PL | 15 | 14 | 13 | 13 | 14 | 14 | 14 | |
| HU | 14 | 12 | 11 | 11 | 12 | 11 | 11 | |
| O | SK | 12 | 12 | 11 | 7 | 6 | 10 | 12 |
| CZ | 35 | 27 | 17 | 57 | 40 | 35 | 32 | |
| PL | 14 | 13 | 18 | 32 | 27 | 24 | 26 | |
| HU | 18 | 17 | 22 | 27 | 30 | 25 | 24 | |
| P | SK | 27 | 20 | 24 | 23 | 18 | 20 | 19 |
| CZ | 14 | 16 | 13 | 13 | 9 | 11 | 15 | |
| PL | 7 | 7 | 6 | 6 | 7 | 6 | 7 | |
| HU | 11 | 18 | 20 | 19 | 17 | 18 | 20 | |
| Q | SK | 18 | 17 | 16 | 15 | 13 | 16 | 16 |
| CZ | 17 | 15 | 15 | 13 | 14 | 15 | 13 | |
| PL | 17 | 17 | 17 | 17 | 17 | 17 | 17 | |
| HU | 13 | 13 | 15 | 11 | 10 | 14 | 12 | |
| R | SK | 27 | 32 | 27 | 29 | 34 | 30 | 28 |
| CZ | 15 | 14 | 17 | 16 | 19 | 18 | 16 | |
| PL | 11 | 11 | 10 | 8 | 10 | 11 | 10 | |
| HU | 11 | 11 | 9 | 8 | 13 | 10 | 11 | |
| S | SK | 26 | 21 | 21 | 21 | 25 | 26 | 24 |
| CZ | 15 | 17 | 18 | 18 | 17 | 15 | 15 | |
| PL | 8 | 6 | 6 | 5 | 8 | 6 | 6 | |
| HU | 16 | 21 | 23 | 23 | 25 | 22 | 23 | |
Source: own processing.
References
- Adamowicz, M. (2022). COVID-19 pandemic as a change factor in the labour market in Poland. Sustainability, 14(15), 9197. [Google Scholar] [CrossRef]
- Amoa-Gyarteng, K. (2021). Corporate financial distress: The impact of profitability, liquidity, asset productivity, activity and solvency. Journal of Accounting, Business and Management (JABM), 28(2), 104–115. [Google Scholar] [CrossRef]
- Aqil, M., Ahmed, R. R., Vveinhardt, J., & Streimikiene, D. (2019). Factors influencing the profitability of heavy vehicle industry: A case of Pakistan. Montenegrin Journal of Economics, 15(1), 61–72. [Google Scholar] [CrossRef]
- Atayah, O. F., Dhiaf, M. M., Najaf, K., & Frederico, G. F. (2022). Impact of COVID-19 on financial performance of logistics firms: Evidence from G–20 countries. Journal of Global Operations and Strategic Sourcing, 15(2), 172–196. [Google Scholar] [CrossRef]
- Bacik, R., Fedorko, R., Gavurova, B., Ivankova, V., & Rigelsky, M. (2020). Differences in financial performance between various categories of hotels in the Visegrad Group countries. Journal of International Studies, 13(2), 279–290. [Google Scholar] [CrossRef]
- Balaniuk, I. F., Shelenko, D. I., Biloshkurskyi, M. V., Povorozniuk, I. M., & Slatvinska, L. A. (2020). An integrated approach to the enterprises’ business efficiency assessment. Management Theory and Studies for Rural Business and Infrastructure Development, 42(4), 486–495. [Google Scholar] [CrossRef]
- Bărbuță-Mișu, N., Madaleno, M., & Ilie, V. (2019). Analysis of risk factors affecting firms’ financial performance—Support for managerial decision-making. Sustainability, 11(18), 4838. [Google Scholar] [CrossRef]
- Bartos, V., Vochozka, M., & Skopkova, K. (2022). Assessment of financial health of service sector companies in the Central European region. Entrepreneurship and Sustainability Issues, 10(2), 375–393. [Google Scholar] [CrossRef] [PubMed]
- Bartosova, V., & Kral, P. (2016, September 21–23). A methodological framework of financial analysis results objectification in the Slovak Republic. BE-ci 2016: 3rd International Conference on Business and Economics (pp. 189–197), Mara, Malaysia. [Google Scholar] [CrossRef]
- Batrancea, L. (2021). The influence of liquidity and solvency on performance within the healthcare industry: Evidence from publicly listed companies. Mathematics, 9(18), 2231. [Google Scholar] [CrossRef]
- Belas, J., Gavurova, B., Dvorsky, J., Cepel, M., & Durana, P. (2022). The impact of the COVID-19 pandemic on selected areas of a management system in SMEs. Economic Research-Ekonomska Istrazivanja, 35(1), 3754–3777. [Google Scholar] [CrossRef]
- Bizjak, J. M., Kalpathy, S. L., Mihov, V. T., & Ren, J. (2024). COVID-19 vaccinations, business activity, and firm value. Journal of Financial and Quantitative Analysis, 1–29. [Google Scholar] [CrossRef]
- Capestro, M., Rizzo, C., Kliestik, T., Peluso, A. M., & Pino, G. (2024). Enabling digital technologies adoption in industrial districts: The key role of trust and knowledge sharing. Technological Forecasting and Social Change, 198, 123003. [Google Scholar] [CrossRef]
- Chambost, I., & Praquin, N. (2021). Spotlights and shadows of financial analysis: History of the making of one of its devices: The funds-flow statement. Comptablite Controle Audit, 27(3), 41–69. [Google Scholar] [CrossRef]
- Chatterjee, S., Chaudhari, R., & Shams, R. (2024). Applications of Industry 4.0 for pandemic responses and business continuity: A TOE-DCV integrated approach. IEEE Transactions on Engineering Management, 71, 13240–13250. [Google Scholar] [CrossRef]
- Demirhan, H. G., & Anwar, W. (2014). Factors affecting the financial performance of the firms during the financial crisis: Evidence from Turkey. Ege Strategic Research Journal, 5(2), 65–80. [Google Scholar] [CrossRef]
- Derco, J. (2022). The impacts of the COVID-19 pandemic on the tour operator market: The case of Slovakia. Journal of Risk and Financial Management, 15(10), 466. [Google Scholar] [CrossRef]
- Eger, L., & Žižka, M. (2024). Industry 4.0, digital transformation and human resource management: Emerging themes and research trends in the context of the Visegrad countries. Oeconomia Copernicana, 15(3), 1021–1065. [Google Scholar] [CrossRef]
- Farooq, U. (2018). Impact of inventory turnover on the profitability of non-financial sector firms in Pakistan. Journal of Finance and Accounting Research, 1(1), 34–51. [Google Scholar] [CrossRef]
- Fitriani, F. (2023). Analysis of the effect of financial ratios on firm value in pharmaceutical sector companies listed on the Indonesia Stock Exchange 2016–2021. Journals of Economics and Business, 3(1), 43–52. [Google Scholar] [CrossRef]
- Gajdosikova, D., & Pavic Kramaric, T. (2023). Debt structure and its impact on financial performance: An empirical study on the enterprises operating in the Visegrad Group countries. Ekonomicko-manazerske spektrum, 17(2), 107–124. [Google Scholar]
- Gajdosikova, D., Valaskova, K., Kliestik, T., & Machova, V. (2022). COVID-19 pandemic and its impact on challenges in the construction sector: A case study of Slovak enterprises. Mathematics, 10(7), 3130. [Google Scholar] [CrossRef]
- Gazi, M. A. I., Nahiduzzaman, M., Harymawan, I., Masud, A. A., & Dhar, B. K. (2022). Impact of COVID-19 on financial performance and profitability of banking sector in special reference to private commercial banks: Empirical evidence from Bangladesh. Sustainability, 14(10), 6260. [Google Scholar] [CrossRef]
- Goldmann, K. (2020). Use of financial analysis in operational and strategic management in practise of Polish business. Eurasian Business Perspectives, 12(2), 115–125. [Google Scholar] [CrossRef]
- Gonchar, O. I. (2016). Increasing of business activity in management of innovative and investment potential of the company. Scientific Bulletin of Polissia, 4(8), 262–267. Available online: http://ir.stu.cn.ua/123456789/15092 (accessed on 11 November 2024).
- Gundova, P., & Medvedova, M. (2016, May 17). Methods of financial analysis in Slovak companies as a tool for increasing of competitiveness. 8th Annual International Scientific Conference on Competition 2016 (pp. 130–143), Jihlava, Czech Republic. [Google Scholar]
- Harantova, V., Kalasova, A., Skrivanek Kubikova, S., Mazanec, J., & Jordova, R. (2022). The impact of mobility on shopping preferences during the COVID-19 Pandemic: The evidence from the Slovak Republic. Mathematics, 10(9), 1394. [Google Scholar] [CrossRef]
- Hiadlovsky, V., Rybovicova, I., & Vinczeova, M. (2016). Importance of liquidity analysis in the process of financial management of companies operating in the tourism sector in Slovakia: An empirical study. International Journal for Quality Research, 10(4), 799–812. [Google Scholar] [CrossRef]
- Hunjra, A. I., Niazi, G. S. K., Majid, N. R., Akbar, S. W., & Akhtar, M. N. (2011). Practices of working capital policy and performance assessment financial ratios and their relationship with organization performance. World Applied Sciences Journal, 12(10), 1967–1973. [Google Scholar]
- Hyrslova, J., Beckova, H., & Beranova, K. (2017, September 14–16). Financial analysis of urban transport companies. 11th International Days of Statistics and Economics 2017 (pp. 548–556), Prague, Czech Republic. [Google Scholar]
- Istok, M., & Kanderova, M. (2019). Debt/asset ratio as evidence of profit-shifting behaviour in the Slovak Republic. Technological and Economic Development of Economy, 25(6), 1293–1308. [Google Scholar] [CrossRef]
- Jencova, S., Vasanicova, P., & Miskufova, M. (2024). Comprehensive assessment of Slovakian hospitals using financial and non-financial criteria in the COVID-19 context. Economies, 12(9), 255. [Google Scholar] [CrossRef]
- Jones, A. S., & Godday, O. O. (2015). Accounting ratios as a veritable tool for corporate Investment decisions: A study of selected organizations in Delta State. Journal of Policy and Development Studies, 9(5), 38–49. [Google Scholar] [CrossRef]
- Kliestik, T., Valaskova, K., Lazaroiu, G., Kovacova, M., & Vrbka, J. (2020). Remaining financially healthy and competitive: The role of financial predictors. Journal of Competitiveness, 12(1), 74–92. [Google Scholar] [CrossRef]
- Kovacova, M., Kliestik, T., Valaskova, K., Durana, P., & Juhaszova, Z. (2019). Systematic review of variables applied in bankruptcy prediction models of Visegrad group countries. Oeconomia Copernicana, 10(4), 743–772. [Google Scholar] [CrossRef]
- Kovalchuk, T., & Verhun, A. (2019). Improvement of the method of analysis of asset management efficiency. Baltic Journal of Economic Studies, 5(5), 61–66. [Google Scholar] [CrossRef]
- Kramolis, J., & Dobes, K. (2020). Debt as a financial risk factor in SMEs in the Czech Republic. Equilibrium. Quarterly Journal of Economics and Economic Policy, 15(1), 87–105. [Google Scholar] [CrossRef]
- Kristof, T., & Virag, M. (2022). What drives financial competitiveness of industrial sectors in Visegrad Four countries? Evidence by use of machine learning techniques. Journal of Competitiveness, 14(4), 117–136. [Google Scholar] [CrossRef]
- Kwak, J. K. (2019). Analysis of inventory turnover as a performance measure in manufacturing industry. Processes, 7(10), 760. [Google Scholar] [CrossRef]
- Lian, Z., Su, Z., & Zheng, T. (2021, December 3–5). Analysis and research on credit risk factors of listed companies in China based on CVM-MLP. 3rd International Conference on Machine Learning, Big Data and Business Intelligence (MLBDBI) (pp. 542–547), Taiyuan, China. [Google Scholar] [CrossRef]
- Linares-Mustaros, S., Farreras-Noguer, M. A., Arimany-Serrat, N., & Coenders, G. (2022). New financial ratios based on the compositional data methodology. Axioms, 11(12), 694. [Google Scholar] [CrossRef]
- Liu, J., & Xu, Y. B. (2022). T-Friedman test: A new statistical test for multiple comparison with an adjustable conservativeness measure. International Journal of Computational Intelligence Systems, 15, 29. [Google Scholar] [CrossRef]
- Lukac, J., Oleova, C., & Kudlova, Z. (2022). Factors predicting companies’ crisis in the engineering industry from the point of view of financial analysis. Plos One, 17(2), e0264016. [Google Scholar] [CrossRef] [PubMed]
- Makoji, E. E., Orugun, F. I., & Adelakun, A. (2021). Exploration of cash flow management for enterprise’s business performance. Asian Journal of Economics Business and Accounting, 21(10), 97–105. [Google Scholar] [CrossRef]
- Mazanec, J. (2022). Working capital management as a crucial tool for corporate performance in the transport sector: A case study of Slovakia and the Czech Republic. Mathematics, 10(15), 2584. [Google Scholar] [CrossRef]
- Mia, M. A., Uddin, M. S., & Chowdhury, M. A. I. (2014). Evaluation of operational performance-A case study on Summit Power Limited (SPL). IOSR Journal of Business and Management, 16(9), 45–51. [Google Scholar] [CrossRef]
- Michalkova, L., Kovacova, M., Cepel, M., & Belas, J. (2022). Insolvency prediction and corporate bankruptcy model in Visegrad group countries. Transformations in Business & Economics, 21(2A), 529–548. [Google Scholar]
- Mijoc, I. (2024). Determinants of profitability of the IT industry in Croatia. Ekonomski Vjesnik, 37(1), 45–62. [Google Scholar] [CrossRef]
- Moody’s. (2024). Orbis. Available online: https://www.moodys.com/web/en/us/capabilities/company-reference-data/orbis.html (accessed on 1 October 2022).
- Mirza, N., Rahat, B., Naqvi, B., & Rizvi, S. K. A. (2020). Impact of COVID-19 on corporate solvency and possible policy responses in the EU. Quarterly Review of Economics and Finance, 87, 181–190. [Google Scholar] [CrossRef] [PubMed]
- Papikova, L., & Papik, M. (2022). Intellectual capital and its impacts on SMEs profitability during COVID-19 Pandemic. Journal of Eastern European and Central Asian Research, 9(3), 521–531. [Google Scholar] [CrossRef]
- Pech, M., Prazakova, J., & Pechova, L. (2020). The evaluation of the success rate of corporate failure prediction in a five-year period. Journal of Competitiveness, 12(1), 108–124. [Google Scholar] [CrossRef]
- Pham, K. X., Nguyen, Q. N., & Nguyen, C. V. (2020). Effect of working capital management on the profitability of steel companies on Vietnam Stock Exchanges. The Journal of Asian Finance, Economics and Business, 7(10), 741–750. [Google Scholar] [CrossRef]
- Podhorska, I., & Siekelova, A. (2020). Enterprises financial performance in a globalized world. SHS Web of Conferences, 74, 05018. [Google Scholar] [CrossRef]
- Priya, P., & Sharma, C. (2023). COVID-19 related stringencies and financial market volatility: Sectoral evidence from India. Journal of Financial Economic Policy, 15(1), 16–34. [Google Scholar] [CrossRef]
- Purwanto, A., & Bina, C. R. (2016). Analysis of Financial ratio towards earning growth in mining companies. Universal Journal of Industrial and Business Management, 4(3), 81–87. [Google Scholar] [CrossRef]
- Rafaqat, S., & Rafaqat, S. (2020). The impact of merge and acquisition on the financial performance of the NASDAQ listed small size technology company. Economics and Finance Letters, 7(2), 200–217. [Google Scholar] [CrossRef]
- Rahman, A., & Sharma, R. B. (2020). Cash flows and financial performance in the industrial sector of Saudi Arabia: With special reference to Insurance and Manufacturing Sectors. Investment Management & Financial Innovations, 17(4), 76. [Google Scholar] [CrossRef]
- Rep, A. (2021). Notes to the financial statements: Current state and improvement. Business Systems Research Journal, 12(2), 60–78. [Google Scholar] [CrossRef]
- Rezai, M., & Pourali, M. R. (2015). The relationship between working capital management components and profitability: Evidence from Iran. European Online Journal of Natural and Social Sciences, 4(1), 342–351. Available online: https://european-science.com/eojnss_proc/article/view/4237/1959 (accessed on 11 November 2024).
- Sacer, I. M., Deccan, N., & Rep, A. (2018, May 24–26). Practical problems in understanding accounting terminology used in the preparation of general purpose financial statements—Evidence from Croatia. 7th International Scientific Symposium on Economy of Eastern Croatia—Vision And Growth (pp. 1077–1085), Osijek, Croatia. [Google Scholar]
- Shukla, S., & Roopa, T. N. (2017). Financial behaviour of selected telecom companies in India: A comparative analysis. International Journal of Indian Culture and Business Management, 14(2), 141–161. [Google Scholar] [CrossRef]
- Simionescu, M., Wojciechowski, A., Tomczyk, A., & Rabe, M. (2021). Revised environmental Kuznets curve for V4 countries and Baltic states. Energies, 14(11), 3302. [Google Scholar] [CrossRef]
- Susellawati, Sari, D. P., Nabella, S. D., & Fadlilah, A. H. (2022). The effect of profitability, liquidity, leverage, and activity ratios on dividend policy in manufacturing companies in the food and beverage industry sector listed on the Indonesia Stock Exchange in the 2016–2020 period. Jurnal Mantik, 6(2), 1365–1375. [Google Scholar]
- Svabova, L., Valaskova, K., Durana, P., & Kliestik, T. (2020). Dependency analysis between various profit measures and corporate total assets for Visegrad group’s business entities. Organizacija, 53(1), 80–90. [Google Scholar] [CrossRef]
- Svabova, L., Kramarova, K., & Chabadova, D. (2022). Impact of the COVID-19 pandemic on the business environment in Slovakia. Economies, 10(10), 244. [Google Scholar] [CrossRef]
- Svabova, L., Stefunova, D., Kramarova, K., Durica, M., & Gabrikova, B. (2024). Would it have been cheaper to let them become unemployed? Costs and benefits of First Aid intervention for companies in Slovakia during the COVID-19 pandemic. Equilibrium. Quarterly Journal of Economics and Economic Policy, 19(1), 139–169. [Google Scholar] [CrossRef]
- Tahir, M., & Anuar, M. B. A. (2016). The determinants of working capital management and firms performance of textile sector in Pakistan. Quality & Quantity, 50(2), 605–618. [Google Scholar] [CrossRef]
- Tian, J. Y., & He, S. J. (2016, August 27–28). Financial analysis: Current situation and development trend-review and evaluation of corporate financial analysis. International Conference on Education, E-learning and Management Technology (EEMT) 2016 (pp. 77–81), Xi’an, China. [Google Scholar] [CrossRef]
- Valaskova, K., Lazaroiu, G., Olah, J., Siekelova, A., & Lancova, B. (2019). How capital affects business valuation: A case study of Slovakia. Central European Business Review, 8(3), 1–17. [Google Scholar] [CrossRef]
- Valaskova, K., Kliestik, T., & Gajdosikova, D. (2021). Distinctive determinants of financial indebtedness: Evidence from Slovak and Czech enterprises. Equilibrium. Quarterly Journal of Economics and Economic Policy, 16(3), 639–659. [Google Scholar] [CrossRef]
- Valaskova, K., Gajdosikova, D., & Belas, J. (2023a). Bankruptcy prediction in the post-pandemic period: A case study of Visegrad Group countries. Oeconomia Copernicana, 14(1), 253–293. [Google Scholar] [CrossRef]
- Valaskova, K., Gajdosikova, D., & Lazaroiu, G. (2023b). Has the COVID-19 pandemic affected the corporate financial performance? A case study of Slovak enterprises. Equilibrium. Quarterly Journal of Economics and Economic Policy, 18(4), 1133–1178. [Google Scholar] [CrossRef]
- Vavrek, R., Kravcakova Vozarova, I., & Kotulic, R. (2021). Evaluating the financial health of agricultural enterprises in the conditions of the Slovak Republic using bankruptcy models. Agriculture, 11(3), 242. [Google Scholar] [CrossRef]
- Vitéz-Durgula, J., Dunay, A., Thalmeiner, G., Vajai, B., & Pataki, L. (2023). Financial analysis and survival research of the Visegrad countries’ health industries. Sustainability, 15(16), 12360. [Google Scholar] [CrossRef]
- Welc, J. (2016). Empirical safety thresholds for liquidity and indebtedness ratios on the Polish capital market. European Financial and Accounting Journal, 11(3), 37–50. Available online: https://ssrn.com/abstract=2876477 (accessed on 11 November 2024). [CrossRef]
- Yousaf, M., Bris, P., & Haider, I. (2021). Working capital management and firm’s profitability: Evidence from Czech certified firms from the EFQM excellence model. Cogent Economics & Finance, 9(1), 1–16. [Google Scholar] [CrossRef]
- Zagita, T., Novalia, N., & Suhada, S. (2024). Analysis of solvency ratio and activity ratio in the financial performance of Pt Bukit Asam Tbk. Jemasi: Jurnal Ekonomi Manajemen Dan Akuntansi, 20(1), 28–38. [Google Scholar] [CrossRef]
- Zisoudis, N., Karelakis, C., Theodossiou, C., & Loizou, E. (2020). Financial analysis of major retail chains within a turbulent economic environment. Studies in Business and Economics, 15(3), 208–222. [Google Scholar] [CrossRef]
Disclaimer/Publisher’s Note: The statements, opinions and data contained in all publications are solely those of the individual author(s) and contributor(s) and not of MDPI and/or the editor(s). MDPI and/or the editor(s) disclaim responsibility for any injury to people or property resulting from any ideas, methods, instructions or products referred to in the content. |
© 2025 by the authors. Licensee MDPI, Basel, Switzerland. This article is an open access article distributed under the terms and conditions of the Creative Commons Attribution (CC BY) license (https://creativecommons.org/licenses/by/4.0/).