Abstract
Being a crucial barometer of labour market stability, employment successfully predicts changes in business cycles, becoming a relevant indicator to policymakers and economists worldwide. The scope of this paper is to investigate the impact of socioeconomic and demographic factors on the employment rate in the European Union through a spatial approach, as well as to compare pre- and post-pandemic characteristics of European labour markets. A persistent North–South divide in employment was observed among the main findings, with Southern regions having lower employment rates and being more vulnerable to the pandemic shocks than Northern regions. Furthermore, the comparison between the spatial econometric models estimated for 2019 and 2022 showed a significant change in the influences of regional employment performance. These discoveries could be of interest to both governments and corporate decision-makers in order to elaborate knowledgeable policies and strategies regarding the labour force.
1. Introduction
Employment has always been a key barometer of labour market stability that effectively predicts changes in business cycles worldwide. In general, increasing employment signals economic expansion when businesses are spending and hiring more to meet rising demand in goods and services, while decreasing employment is associated with economic contractions when businesses reduce their workforce to adjust to weaker demand. Since changes in a nation’s labour force are extremely relevant for policymakers and economists to track economic performance and sustainable development, it becomes essential to constantly investigate employment and unemployment shifts to predict future downturns or upturns at both national and regional levels.
Factors like changes in labour market structure, employees’ compensation, and real labour productivity, along with demographic factors, could all speed up or slow down the unemployment shifts, providing valuable insights for government, business representatives, and researchers in the labour market field. The academic community can investigate and predict future trajectories and regional divergences when studying regional employment patterns, business representatives can estimate the severity of economic cycles and better adjust to those changes, while public policy decision-makers can formulate more appropriate and informed policies, such as skills development programmes, fiscal stimuli, or monetary adjustments to limit the impact of increasing unemployment. Furthermore, exposure to crisis, in general, hits labour market stability even harder and provokes more repercussions on financial stability and on employment worldwide (Malousis et al., 2023).
In particular, the most recent COVID-19 crisis heavily affected both society and the economies worldwide, leading to an unprecedented collapse in hours worked on the labour market. According to Anderton et al. (2021) and OECD (2021), work hours fell by about 15% in 2020, but with job-retention schemes (like Kurzarbeit implemented in Germany, or activité partielle in France) mostly cushioning the total number of layoffs. Eurostat (2022) reported a drop of approximately 0.9 percentage points in the EU-27 employment rate (20–64) in 2020, along with an employment income drop of 4.8% due to reduced working time. However, the employment rate was nearly fully recovered by 2021 in Europe, reaching an average in 2022 higher than pre-crisis levels (Eurostat, 2021). The governments had to tailor the public policies and to cooperate with major economic sectors that were most severely hit, including healthcare (Müller et al., 2023), tourism (Baum et al., 2022; Liu et al., 2023), and many others.
Studying how employment behaves during a crisis and its aftermath provides valuable insights to better predict the trajectory of an economy and its potential for socioeconomic recovery or ability to adapt to current challenges worldwide. Regional analysis, in particular, can spot growth disparities and lagging regions at risk, providing crucial insights for decision-makers in targeting economic policies, designing effective strategies to foster economic resilience, and promoting balanced and sustainable development.
Moreover, spatial analysis can help researchers track regional shifts in occupational structures, identify drivers of regional economic growth or decline, and understand changes in regions’ specializations due to technological advancements or shifts in global production, which lead to more informed strategies for economic resilience.
Despite significant advances in modelling regional labour market dynamics in Europe, important gaps remain that motivate our research. Most existing studies focus on long-run spatial dependence or sectoral composition, but devote less attention to the North and South Europe labour market divide. Moreover, while the COVID-19 pandemic highlighted new structural vulnerabilities, systematic spatial econometric analyses comparing pre- and post-pandemic periods are still scarce. Building on this literature, the present study contributes by integrating richer explanatory variables, including migration and high-tech human resources as proxy to digital skills, into a spatial framework at the NUTS 2 level, and by explicitly contrasting employment dynamics before and after the pandemic and between the North and South European regions. This approach provides fresh insights into both the persistence of regional disparities and the evolving geography of resilience in European labour markets.
The following set of research questions are therefore formulated to be answered through this paper:
- RQ1: Is there a regional employment divergence in North–South Europe?
This paper will investigate the presence of a North–South divide in employment outcomes in Europe in the pre- and post-pandemic times, using spatial modelling. Considering also the massive wave of migrants triggered by the war in Ukraine, some of whom took up employment, usually in low-level positions, and given the previous regional studies on employment dynamics in the European labour markets, we formulate the first hypothesis that will be tested in the paper:
Hypothesis 1 (H1).
There is a significant North–South divide in employment rates that persists even after the COVID-19 pandemic, with Southern European regions showing lower employment rates and being more intensively exposed to the pandemic shock.
- RQ2: What is the impact of socioeconomic and demographic factors (including migration and high-tech human resources) on employment in the pre- and post-pandemic period?
Through this question, the paper will investigate how changes in both the labour market and demographic structures, employee compensation, productivity, and migration flows significantly influence regional employment in Europe. Given the expectations from regional growth frameworks and the dynamics for both socioeconomic and demographic determinants of employment during the pandemic time span, we formulate the second hypothesis that will be tested in the paper:
Hypothesis 2 (H2).
There is a notable shift in the main determinants of regional employment performance (considering the crude rate of net migration, fertility rate, human resources in science and technology, old age dependency, and particularly labour productivity) during the pre- and post-pandemic time span between the North and South regimes in Europe.
The structure of the paper is the following. Section 2 is dedicated to a brief literature review in the field of regional employment studies, while Section 3 outlines the methodology and data considered in our analysis. Next, the main results are presented in Section 4, while the main implications of our findings, along with the paper’s contributions to the theoretical research, are discussed in Section 5 by connecting our findings to the research questions and main hypothesis. Finally, the conclusions are summarized in the last section.
2. Literature Review
Recent studies have investigated regional clustering and spillovers that shape employment dynamics in the European labour markets. Spatial econometric models, in particular, have consistently indicated a positive spatial autocorrelation of employment rates at the NUTS 2 level across European regions, with prosperous regions clustering together apart from the lagging regions cluster (Kivi & Paas, 2021).
In general, regional employment shocks tend to spill over to neighbours, creating clusters of resilience or vulnerability (Chocholatá & Furková, 2018, 2023; Piribauer et al., 2023). Spatio-temporal models of macro relations, such as Okun’s law, show that not only local growth but also an improvement in the economic performance of neighbouring regions can help reduce unemployment (Jankiewicz, 2023). Moreover, Chocholatá and Furková (2023) argue that heterogeneity matters, as coefficients in the models differ across regions because of structural and institutional differences.
The COVID-19 pandemic further revealed structural vulnerabilities, reinforcing differences in tourism-dependent areas, while capital regions and knowledge-intensive economies with teleworking capacity were more resilient and able to recover quickly (Eurofound, 2024; Brussevich et al., 2020). Also, regions with better absorption of EU cohesion and recovery funds were found to experience smaller employment declines, with neighbouring regions also benefitting from these outcomes (Arbolino et al., 2021).
The literature highlights a persistent North–South divide in employment outcomes, with Southern European regions showing lower employment rates and being more intensively exposed to the pandemic shocks, due to the reliance on tourism and a larger share of small firms (Doerr & Gambacorta, 2020). Moreover, Piribauer et al. (2023) argue that lagging regions often remained more vulnerable during the 2019–2022 period, risking structural divergence unless countered by policy. Northern regions, however, were more resilient due to diversified economies, teleworking potential, and stronger policy buffers (Eurofound, 2020; Plzáková & Smeral, 2022). Doerr and Gambacorta (2020) also argue that employment in Southern regions and Mediterranean tourism regions has higher exposure to risk, while Northern Europe has lower risks and Eastern and Central European regions keep intermediate risks. The authors evaluated regional employment risk through regional indices that reflect the share of jobs under threat from the pandemic and regional incidence of small firms. The same vulnerability mapping is also empirically supported by Plzáková and Smeral (2022), who show that tourism collapse was a decisive factor, with Southern Europe experiencing severe employment losses, while Northern service hubs handled shocks relatively better. Saputra (2023) strengthens these findings with spatial econometric evidence, arguing that shocks in one tourist destination spilled over into neighbouring regions, producing regional contagion effects concentrated in the South.
In terms of methodology, the research on regional employment mapping spans from cross-section spatial econometrics applied to single years to panel and dynamic spatial frameworks that allow for common EU-wide shocks and structural breaks (Lottmann, 2012; Elhorst, 2019; Smaal & Elhorst, 2025; Jankiewicz, 2023). For COVID-19, some studies also introduced period dummies and interaction terms, such as “teleworkability × pandemic” to model structural breaks (Eurofound, 2024).
Strong positive spatial autocorrelation on employment rates across EU NUTS 2 regions is also found by Chocholatá and Furková (2023). Using spatial autoregressive (SAR/SARAR) models, the authors conclude that regional employment conditions were highly interdependent in the pre-pandemic period across the EU. Building on this, Piribauer et al. (2023) propose a Bayesian estimation of spatial weights that moves beyond geographic contiguity and includes sectoral and trade linkages. Their findings suggest that some non-geographic connections, like tourism flows, could explain spillovers, which are especially relevant to cluster Northern trade-oriented hubs apart from Southern tourism economies. Giannakis (2021) contributes to this perspective by linking regional connectivity to resilience, arguing that strong pre-crisis networks can either amplify or buffer shocks depending on their nature.
Regarding the policy implications of regional employment divergency, Eurofound (2020) survey data show that Northern regions benefit from higher telework adoption and more job-retention schemes, leading to faster employment recovery. Similarly, Drahokoupil and Müller (2021) demonstrate that countries with generous short-time work schemes (such as Germany, the Netherlands, and France) handled the labour market shocks better, with lower employment losses. By contrast, Southern countries, where short-time work was less extensively used, faced sharper employment declines. Having weaker institutional capacity to effectively absorb the EU fund, was also a factor that hindered employment recovery in Southern Europe. Arbolino et al. (2021) stress the importance of EU cohesion and recovery funds, finding that regions with stronger absorption capacity showed more resilience and generated spillover benefits for neighbours.
To conclude, the existing literature converges on two points. First, Southern Europe suffered disproportionate employment losses, primarily due to reliance on tourism and the high share of small firms, while Northern regions were more resilient due to diversified economies, telework capacity, and stronger policy buffers (Doerr & Gambacorta, 2020; Eurofound, 2020; Plzáková & Smeral, 2022). Second, positive spatial autocorrelation exists, as employment shocks do not stop at administrative borders but spill over across neighbouring regions (Chocholatá & Furková, 2023; Saputra, 2023).
The literature highlights several lessons in terms of policy implications, too. First, investment in telework capacity and digital infrastructure are key factors to enhance resilience (Brussevich et al., 2020; Eurofound, 2020), along with the absorption of EU cohesion to mitigate employment shocks better (Arbolino et al., 2021). Second, active labour market policies and reskilling are needed to avoid long-term unemployment, particularly in the most vulnerable Eastern and Southern peripheries (OECD, 2021), while place-based targeting is also needed, since employment shocks tend to cluster spatially (Chocholatá & Furková, 2018).
While the literature confirms the importance of spatial dependence in European labour markets, several gaps remain. First, most studies rely on a relatively narrow set of structural variables (GDP, education level, sectoral mix, compensation of employees), leaving less attention paid to factors like migration and high-tech human resources, as digitalization has recently become a key factor to sustainable economic development. Second, although dynamic spatial panels and common-factor approaches represent important methodological progress (Elhorst, 2019; Smaal & Elhorst, 2025), causal inference is still limited, with much of the evidence identifying the correlation rather than disentangling underlying mechanisms. Third, North–South convergence has been documented, but the role of cross-border spillovers in accelerating or delaying catch-up remains underexplored, especially on a before and after the pandemic comparison across the European regions. Addressing these gaps by integrating distinct explanatory variables, applying robust identification strategies, and explicitly comparing pre- and post-pandemic periods could provide new insights into the resilience and transformation of European labour markets.
3. Data and Methodology
When choosing the variables to be included in the model, it is of the utmost importance that the data needed are available and come from reliable sources. A set of seven indicators was chosen for the EU regions. The main data source used was the Eurostat database.
The seven variables were collected for 217 NUTS 2 regions of the EU, excluding Portugal and the Netherlands (due to missing data) and overseas territories for France and Spain (considering alteration of the spatial models), for the years 2019 and 2022. The chosen years are important to compare the pre- and post-pandemic characteristics regarding the European labour markets. A short description of the chosen indicators can be found in Table 1.

Table 1.
Main indicators considered in the analysis.
The indicator HRST was chosen as an indirect measure of the level of digitalization of labour markets. Even though it does not represent the full spectrum of digitalization, it may be useful as a proxy since individuals employed in the field of science and technology require higher levels of digital proficiency. In the case of labour productivity, this variable is expressed as percentage change on the previous period. This implies that it comprises a short-term dynamic in regional economic performance, namely 2018–2019 and 2021–2022, reflecting relative changes rather than absolute levels.
The descriptive statistics for the variables included in the model are presented in Table 2. Due to the large range in the compensation of employees, a logarithmic transformation was applied.
Table 2.
Descriptive statistics of the variables included in the analysis.
The models used in this study are closely related to concepts such as spatial randomness, Moran’s I, spatial autocorrelation, spatial lag and spatial error, LISA cluster map, and Local Moran, which led to exploring spatial regimes. The analysis was conducted using the applications GeoDa and GeoDa Space.
As a starting point, spatial randomness is assumed to be the null hypothesis. This means that the location of the observations included has no significant meaning, so there is no systematic spatial structure detected. Spatial randomness is going to be statistically tested; the main goal being to reject the null hypothesis (Anselin, 2024).
To test this randomness, Moran’s I statistic was used. Moran’s I is partly similar to Pearson’s correlation coefficient, the difference between them being that Pearson’s is a bivariate statistic, whereas Moran’s is univariate. Testing Moran’s I allegedly implies creating a spatial weights matrix since the magnitude of the statistic depends on it. It is essential to mention that the values of Moran’s I statistic cannot be compared unless they are based on the same spatial weights matrix (Anselin, 2024).
Moran’s I statistic can be written as follows:
where n is the number of regions, and are the values of the analyzed variable in the regions and , is the mean of the variable x for all the regions, and wij is a binary weighting factor, taking the value 1 if the regions are neighbouring. Moran’s I statistic can only have values between −1 and 1.
To reject the null hypothesis of spatial randomness, through permutation inference, a pseudo p-value is calculated, representing a summary of the results from the reference distribution:
where m represents the number of times the computed values of Moran’s I are equal to or greater than the actual value, while R is the number of permutations.
Spatial autocorrelation shows that the values of a random variable are more or less similar regarding the distance between them. When Moran’s I is close to 1, then the values tend to form clusters. Otherwise, they tend to disperse and look like a chessboard.
Moran’s I rejects the null hypothesis when the pseudo p-value is lower than the chosen significance level.
A distance-based spatial weights matrix is used to avoid the isolation of the regions, especially when it comes to islands, so that each region has at least one neighbour. However, this may not be an appropriate option when the density of the regions is unevenly distributed across the territory since some of them are clustered, while others are more spread out (Anselin, 2024).
While Moran’s I is designed to detect spatial autocorrelation in the entire territory, a local analysis is also needed to discover the relationships between each region and its neighbours or spatial heterogeneity. For this, the concept of local indicators of spatial association (LISA) is introduced (Anselin, 2024). A local indicator of spatial association can take the following generic form:
where wij represents the spatial weights, while f(xi, xj) is the attribute similarity between a pair of observations.
The map through which Local Moran can be illustrated is the LISA cluster map. It is used to detect the clusters formed between high–high regions (regions with high values surrounded by other regions with high values) and low–low regions (regions with low values surrounded by other regions with low values), as well as the outliers such as high–low regions (regions with high values surrounded by other regions with low values) and low–high regions (regions with low values surrounded by other regions with high values). A LISA significance map can be created to visualize the significance level of each region from the four categories mentioned before using permutation inference (LeSage, 1999).
A classic OLS model was first applied to the dataset to estimate a linear relationship between the employment rate and the socioeconomic and the considered demographic factors:
where y is the dependent variable (employment rate), X are the explanatory variables (compensation of employees, crude rate of net migration, fertility rate, human resources in science and technology, old age dependency ratio, labour productivity), β are the coefficients of explanatory variables, and ε is the error. In this way, it is used to find the matches between the predicted and the observed values of the dependent variable and the significant relationships between the dependent variable and the explanatory ones (Woolridge, 2012).
The classic hypotheses of an OLS estimation were also conducted. This implies performing some tests to check multicollinearity, normal distribution of errors, and heteroskedasticity. For multicollinearity, a condition number is calculated. If this number exceeds 30, there is a high chance of multicollinearity among the explanatory variables. For the normal distribution of errors, the Jarque–Bera test was performed on the errors to check if the skewness and kurtosis match the ones of a normal distribution. Finally, for heteroskedasticity, three tests were used: Breusch–Pagan, Koenker–Bassett, and White. While the first two tests need the specification of heteroskedasticity, the White test can be applied to any unspecified form of heteroskedasticity, thus being more appropriate to be used.
To determine which spatial model is suitable, a couple of tests were performed. Lagrange Multiplier (LM) tests for lag and error were conducted to discover whether a spatial lag model and/or a spatial error model would be worth considering. It is essential to mention that these tests efficiently detect spatial autocorrelation more for large datasets. If neither LM lag nor LM error tests reject the null hypothesis of spatial randomness, then the OLS model is the most appropriate to use (Matthews, 2006). But if one or both do, spatial autocorrelation is present.
The concept of spatial autocorrelation, also known as spatial dependence, is the opposite of spatial randomness and derives from Tobler’s first law of geography which states that there is an influence between everything, yet closer places have a more powerful influence on one another (Tobler, 1970). Therefore, there is a similarity in the values observed in neighbouring areas (Anselin, 2024).
The spatial lag and spatial error models originate from the Manski model, which comprises all spatial lags. The form of the Manski model can be written as follows:
where y is the dependent variable, Wy is the lag of y, Wx is the lag of the explanatory variables, Wu is the lag of errors, while ρ, θ, and λ are the coefficients of the different types of lags expressing the intensity of the spatial dependence.
In the spatial lag model, the value of y in a chosen region may have an influence on the value of y in a neighbouring region. The equation of the spatial lag model is as follows:
In the spatial error model, the errors present in a region may influence the errors in a neighbouring region; thus, the variables not included in the regression are spatially autocorrelated. The equation of the spatial error model is as follows:
When both LM tests reject the null hypothesis of spatial randomness, the robust LM tests should be compared. Usually, the one which has the lowest p-value and the largest value of the test statistic, respectively, is going to be more appropriate to choose (Matthews, 2006).
The spatial lag and spatial error models are based on maximum likelihood estimation. These two can be compared to the OLS using the Likelihood Ratio Test, having the null hypothesis which states that the OLS model is more suitable. To compare the spatial lag and spatial error models with one another, three criteria are calculated: log likelihood, Akaike information criterion (AIC), and Schwarz criterion (SC). The best model is the one which has the highest log likelihood or the lowest AIC or SC (Matthews, 2006).
To establish if the spatial model is suitable for the entire territory included in the analysis or if some regimes are needed, it is useful to take a glimpse of the LISA cluster map mentioned before. If there are clustered high–high regions and low–low regions over the territory, then a spatial regimes model should be applied. In this study, a split by countries between the Northern and the Southern European Union was performed based on the clustering of the regions according to the dependent variable employment rate.
The Chow test was conducted to determine if there is a structural instability of the coefficients within the spatial regimes. The null hypothesis of this test assumes that there is no significant difference between the spatial clusters. If the test rejects the null hypothesis, different models are going to be estimated. The formula for the test is (Anselin, 2007)
where eR represents the vector of residuals from the regression with constant coefficients, while eU represents the vector of residuals from the regression in the case of spatial regimes. The test is distributed as an F statistic with k and N − 2k degrees of freedom.
As stated above, if the null hypothesis of the Chow test is rejected, it becomes mandatory that different models will be estimated for each spatial regime. In our case, this estimation will depend on the separation of high–high/high–low and low–low/low–high regions indicated by the LISA cluster map. Two regimes will be created, one containing high–high and high–low regions, while the other has low–low and low–high regions. For each of the regimes, the steps will be the same as in the case of the whole territory: OLS regression with spatial dependence tests; then, depending on these, spatial lag and/or spatial error models will be estimated.
4. Results
4.1. Spatial Autocorrelation
The evaluation of spatial autocorrelation through Moran’s I statistics showed strong spatial correlation for the variables employment rate, HRST, fertility rate, and compensation of employees, indicating important regional clustering for these indicators (see Table 3). In contrast, weak spatial dependencies are reported for labour productivity and net migration, suggesting that these variables are more spatially dispersed and likely influenced by localized factors. The spatial autocorrelation patterns of the analyzed variables remain relatively stable from 2019 to 2022, supporting the inclusion of the spatial dimension in the subsequent regression analyses and thus the use of spatial econometric models.
Table 3.
Spatial autocorrelation results for 2019 and 2022.
4.2. Global Regression Models
First, we estimate the classical OLS regression models including all factors having as a dependent variable the employment rate. Results depicted in Table 4 show several variations in the factors influencing employment rate in 2019 and 2022, respectively. In 2019, all variables are highly statistically significant, except for the compensation of employees. Model II for 2019 is re-estimated after dropping compensation of employees. We notice that net migration, fertility rate, HRST, old age dependency ratio, and labour productivity all have a positive and significant impact on employment. However, in 2022, besides compensation of employees, we observe that labour productivity, as well as net migration, become insignificant factors. This fact may find its explanation in the structural changes in European labour markets after the shock of the pandemic, as well as in the omission of spatial effects. According to Lindsay (2024), migration flows, especially immigration from outside of the EU, were affected by lockdowns and restrictions imposed by the authorities. On the other hand, labour markets showed great resilience regarding employment levels, despite the discouraging pre-pandemic forecasts. Hence, the year 2022 was marked by a high increase in job creation and employment growth (Caselli et al., 2024). In addition, migration is, by default, a spatial process with significant spillover effects across regions, as shown by Chen (2025). Thus, considering a spatial approach would be the correct way of capturing the interaction between migration and employment.
Table 4.
Estimation of OLS regression models for 2019 and 2022.
Model II is re-estimated after dropping the highly non-significant factors, respectively, compensation of employees and labour productivity. Both in 2019 and 2022, R-squared is reported moderately at about 30–35%. Lack of multicollinearity and homoscedasticity are validated by the appropriate statistical tests (Table 4).
Spatial dependence tests for the re-estimated models (Table 5) suggest the existence of significant spatial effects; thus, we proceed further with the estimation of both spatial lag and spatial error models. Our results are consistent with previous studies which consistently confirm the positive spatial autocorrelation of employment rates at the NUTS 2 level across European regions (Kivi & Paas, 2021).
Table 5.
Robustness check for the OLS regression models and spatial dependence tests (for 2019 and 2022).
4.3. Spatial Regression Models
The results of the spatial lag and spatial error models for 2019 and 2022 are reported in Table 6. We have excluded from the predictors the compensation of employees since it was not significant in any of the global OLS models.
Table 6.
Estimation of spatial regression models for 2019 and 2022.
In 2019, both spatial lag and spatial error (lambda) coefficients are highly significant (p-value < 0.001), with the spatial error model recording slightly better goodness-of-fit indicators (R-squared, AIC, LR Test). However, all factors are significant in the spatial lag model, while in the spatial error models the labour productivity becomes insignificant. Considering also the increase in R-squared compared to the global regression (from 35% to 60%), we consider the spatial lag model to be the best fit for the 2019 data.
In 2022, labour productivity was not included in the models since it was not significant in any of the models; however, the crude rate of net migration becomes significant in both spatial models, suggesting that the inclusion of spatial effects in the regression model improves the estimation results. In accordance with this, Gebremariam et al. (2012) highlighted the importance of spatial tests when conducting an analysis of employment and migration. They stated that ignoring spatial dependencies or simultaneities leads to biased or inefficient estimates because of the regional spillover effects. All other predictors have a positive significant impact on the employment rate. The spatial error model shows marginally better goodness-of-fit metrics (R-squared, AIC, LR Test); however, the differences are not substantial and both spatial models provide improvements compared to the OLS regression, with an increase in R-squared from approximatively 32% in the OLS regression to 57% in the spatial models.
For all spatial models, Moran’s I values for the residuals have been added to verify the presence of residual spatial correlation. The Moran’s I values are very low (below 0.1 in absolute value), indicating that the spatial models capture correctly the spatial dependence and that the remaining residual spatial autocorrelation is not substantial.
The results confirm that the spatial spillover effects existing among neighbouring regions in the EU must be considered when analyzing the employment rate. The highly significant spatial lag coefficient (W.Empl_rate) suggests the strong dependence between the employment rate in one region and the employment rates in neighbouring regions, both in 2019 and in 2022; thus, spatial dependencies are consistent in time. Our findings are in line with those of Chocholatá and Furková (2023) and Piribauer et al. (2023), confirming the spillover effect of regional employment shocks over neighbouring regions. Spatial regression models are better fit than OLS models, as shown by the R-squared and LR Test. This highlights the importance of including space dependencies in the employment rate analysis, since ignoring the spatial factor might lead to biased estimations.
Regarding variable influence, 2019 reports stronger effects and contributions from the crude rate of net migration, fertility rate, human resources in science and technology, old age dependency, and particularly labour productivity. By 2022, the labour productivity becomes insignificant, suggesting a change in the dynamics of regional employment.
The weakening relationship between labour productivity and employment after the COVID-19 pandemic can be explained by the fact that the rapid diffusion of teleworking practices since the COVID-19 pandemic diminished the role of physical proximity in shaping productivity spillovers. The pandemic has accelerated digitalization and the shift towards a low carbon economy, with remote work potentially reshaping the spatial employment dependence structure (OECD, 2020). In parallel, the shift in labour toward service-oriented and essential sectors, typically low in productivity but high in labour intensity, has weakened the explanatory power of productivity measures in accounting for regional employment patterns. Policy interventions such as job-retention schemes and fiscal transfers could also have temporarily constrained the spatial expression of productivity effects, reducing the usual spatial autocorrelation of productivity-based indicators. Within this framework, the continued significance of demographic and human capital factors—such as migration patterns, fertility rates, and the concentration of human resources in science and technology—suggests a transition from output-driven to demographically anchored spatial dynamics. This aligns with evidence of post-pandemic spatial restructuring, where regional resilience increasingly depends on human capital mobility and institutional adaptability rather than static productivity advantages (Bourdin & Levratto, 2023).
4.4. North vs. South Models of the Employment Rate
The employment rate exhibits significant geographical variation, as shown by the map in Figure 1. Moreover, we can observe that higher values of the employment rate are clustered in the Northern regions, while lower values can be found in Southern parts of Europe. The LISA cluster map depicted in Figure 2 confirms the significant spatial dependencies (suggested by high–high and low–low clusters) which further supports the estimation of different models for the North and South European regions. Starting with the two main clusters identified in the LISA cluster map (Figure 2), we define the two regimes as shown in Figure 3.
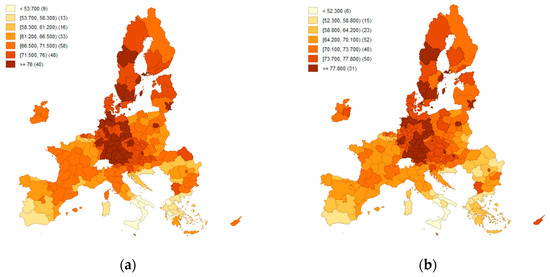
Figure 1.
Employment rate map for 2019 (a) and 2022 (b). Source: authors’ own representation based on Eurostat data.
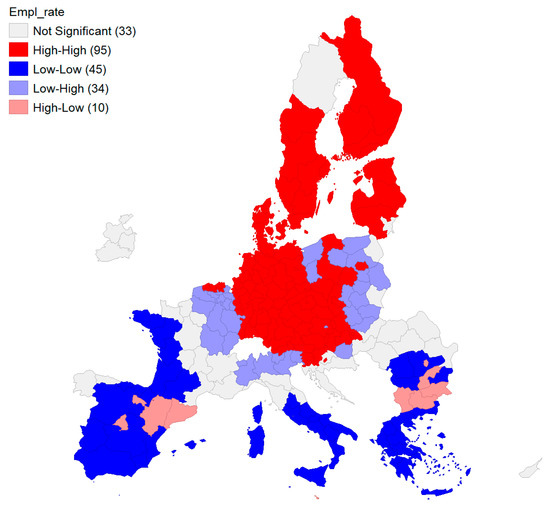
Figure 2.
LISA cluster map—employment rate. Source: authors’ own representation based on Eurostat data.
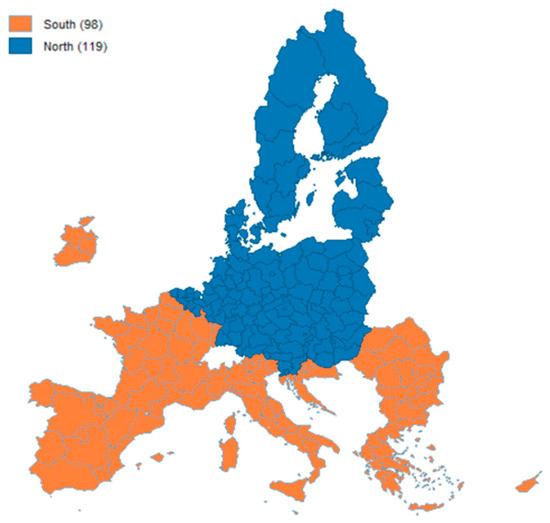
Figure 3.
Distribution of NUTS 2 regions on the two regimes (North and South). Source: authors’ own representation based on Eurostat data.
In our analysis, we assigned all NUTS 2 regions of a given country to a single regime, in order to enhance the interpretability and consistency of the results. Thus, the LISA cluster map was employed only as a spatial guide to identify the general North–South patterns in the employment rate and establish if a country should be classified in the North or in the South regime. This country-level approach was used to avoid having regions of the same country in different regimes, considering that labour market outcomes are shaped by national institutions (such as labour regulations or taxation).
Therefore, the North regime includes 119 regions from countries with generally higher employment rates: Austria, Belgium, Czech Republic, Denmark, Germany, Estonia, Finland, Hungary, Lithuania, Latvia, Poland, Sweden, Slovenia, and Slovakia, while the South regime includes 98 regions from countries with relatively lower employment rates: Bulgaria, Greece, Italy, Spain, France, Romania, Ireland, Luxembourg, Malta, Croatia, and Cyprus.
This simplified approach has its limitations as it might not capture entirely the heterogeneity of employment rates. For instance, in the LISA cluster map, out of the 21 NUTS2 regions of Italy, 10 regions were classified in the low–low cluster, 6 regions in the low–high cluster, 1 region was in the high–high cluster, while the remaining 4 regions were not significant (Figure 2). Since the low–high cluster was determined mainly by the proximity with countries having higher employment rates (Slovenia, Austria), we considered the entire country in the South regime with generally lower employment rates. Luxembourg was included also in the South regime considering it was classified in the low–high cluster with employment rates relatively lower than those of the neighbouring German regions.
There is an approximately 11 percentage point difference between the average employment rate of the two regimes. The average employment rate in the South is 63% (2019) and 64.4% in 2022, while the average employment rate in the North is 73% in 2019 and 74.4% in 2022.
These findings support the first hypothesis, H1, tested, confirming that there is a significant North–South divide on employment rate that persists even after the COVID-19 pandemic, with Southern European regions showing lower employment rates and being more intensively exposed to the pandemic shock.
The Chow test results (Table 7) suggest that the coefficients of the predictors are significantly different between the two regimes (North and South), both in 2019 and in 2022. This is supported by the global test (highly significant in both years with p-values < 0.001), confirming structural instability within the general regression model. For instance, the variables HRST, net migration, and fertility rate show statistically significant differences in their coefficients between the two regions.
Table 7.
Results of Chow test for 2019 and 2022.
Consequently, the results of the structural stability test support the estimation of separate regression models for North and South in both years, since the relationship between the factors and the employment rate is not stable across the two regimes.
In the regression model estimated for the North regime (Table 8), we notice that the variables compensation of employees and old age dependency ratio are the ones consistently significant both in 2019 and 2022, while net migration has a significant impact only in 2019. Our findings are also supported by Schmidt and Mitze (2023) who brought empirical evidence to argue that wage compensations reduce regional unemployment among Danish municipalities not only through a direct local effect, but also through indirect spatial spillovers. On the contrary, fertility rate, HRST, and labour productivity remain statistically insignificant across both periods. The R-squared indicates a moderate model fit at 41% in 2019. However, in 2022, it is very modest, at only 17%, suggesting that other unaccounted factors might have a greater impact on the employment rate in 2022.
Table 8.
Estimation of OLS regression models for 2019 and 2022—NORTH.
The spatial models (Table A1, see Appendix A) indicate the same predictors as significant variables, when accounting for spatial dependencies. The Likelihood Ratio Test (LR Test) confirms that the spatial models outperform the OLS regression, identifying significant spatial dependencies in the Northern regions. Moreover, the R-squared in the spatial models are approximately 10 percentage points higher both in 2019 and 2022, supporting the superior explanatory power of the spatial estimations.
The estimation results for the Southern regime (Table 9) indicate that net migration, fertility rate, HRST, and old age dependency ratio are all significant predictors for employment rate in both 2019 and 2022. The labour productivity, however, is significant only in 2019 and loses its explanatory power in 2022. Compensation of employees is insignificant for the Southern regions in both periods. R-squared levels range from 40% to 58%, suggesting a better explanatory power of the variables in Southern regions compared to the Northern ones.
Table 9.
Estimation of OLS regression models for 2019 and 2022—SOUTH.
These findings support the second hypothesis, H2, tested, confirming that there is a notable shift in the main determinants of regional employment performance (considering the crude rate of net migration, fertility rate, human resources in science and technology, old age dependency, and particularly labour productivity) during the pre- and post-pandemic time span between the North and South regimes in Europe.
Spatial dependencies are also confirmed in this case. The spatial regression models (Table A2, see Appendix A) identify the same significant predictors. When including explicitly the spatial effects in the models, the explanatory power is higher by about 5 percentage points. The significance of the spatial lag of employment (W.Empl_rate) and the spatial error coefficient (Lambda) further confirms the presence of regional spillovers and spatial interactions.
5. Discussion
In terms of theoretical contribution, we developed a spatial framework at the NUTS 2 level by explicitly contrasting employment dynamics before and after the pandemic and between the North and South European regions. Our findings provide fresh insights into the existing literature into both the persistence of regional disparities and the evolving geography of resilience in European labour markets.
By connecting findings to RQ, the two research questions were addressed and answered by this research, while the main hypotheses formulated in this paper were also tested and confirmed.
Considering RQ1, we first tested and confirmed the existence of significant spatial effects among European regions. Next, our results confirm the strong dependence between employment rate in one region and the employment rates in neighbouring regions, both in 2019 and in 2022, indicating that spatial dependencies are consistent in time. Finally, our empirical findings support the first hypothesis, H1, confirming that there is a significant North–South divide on employment rate that persists even after the COVID-19 pandemic, with Southern European regions showing lower employment rates and being more intensively exposed to the pandemic shock, because of lower telework adoption benefits and fewer job-retention schemes as compared to Northern Europe. Our results are in line with previous studies which confirm the positive spatial autocorrelation of employment rates across European regions (Kivi & Paas, 2021) and the spillover effect of regional employment shocks over neighbouring regions (Chocholatá & Furková, 2023; Piribauer et al., 2023), highlighting the importance of including space dependencies in the employment rate analysis.
Regarding RQ2, we further investigated how changes in both the labour market and demographic structures, employee compensation, productivity, and migration flows significantly influence regional employment in Europe in the pre- and post-pandemic period.
The comparative spatial econometric models estimated for 2019 and 2022 revealed a notable shift in the determinants of regional employment performance. In the pre-pandemic specification, variables such as the crude rate of net migration, fertility rate, human resources in science and technology, old age dependency, and particularly labour productivity exerted strong and spatially significant effects. These results were consistent with expectations derived from agglomeration theory and regional growth frameworks, wherein productivity differences capture both localized spillovers and the efficiency of regional production systems. However, the post-pandemic model for 2022 indicates a marked attenuation of these effects, with labour productivity becoming statistically insignificant. This suggests that the spatial mechanisms linking productivity to employment have been disrupted, reflecting structural adjustments in both the spatial organization of work and the sectoral composition of regional economies.
Among the main structural North–South divergences highlighted through the spatial econometric analysis, we first noticed that the explanatory power of the compensation of employees is notable only for the North regime, while being statistically insignificant for the South regime. These findings are not surprising, considering previous results in the field. According to Belman and Wolfson (2016), compensation of employees has a controversial effect on employment, being country- and time-specific, as well as sensitive to the work force qualification and wage level. Moreover, Chocholatá and Furková (2023) found a lower and negative impact of compensation of employees on employment for the South regime, while having a positive impact for the North regime. Second, regarding the impact of labour productivity on employment, our findings suggest that for the South regime productivity loses its explanatory power in 2022, being significant only in 2019. The post-pandemic drop in the explanatory power of labour productivity can be explained by a shift in labour toward service-oriented sectors, which are typically low in productivity but high in labour intensity. The collapse of tourism was also a decisive factor driving Southern Europe’s employment decline, with spillover effects amplifying regional disparities (Piribauer et al., 2023; Saputra, 2023).
Third, our findings also suggest that the employment rate in the South regime is better explained by demographic factors, with fertility rate and old age dependency ratio, along with net migration and human resources in science and technology, being all significant predictors for employment rate in both 2019 and 2022. All these findings pinpoint towards a transition from output-driven to demographically anchored spatial dynamics in the South regime, being in line with the findings of Bourdin and Levratto (2023). Also, geopolitical factors, such as the eruption of the war in Ukraine in 2022, triggered massive changes in migration flows, some of whom took up employment, usually in low-level positions. However, the North regime is characterized by stronger resilience to crisis, economic diversification, higher teleworking potential, and more robust policy support (Eurofound, 2020). Thus, other unaccounted explanatory factors might have a greater impact on the employment rate, as indicated by our spatial model statistics as well.
All these findings support the second hypothesis, H2, tested, confirming that there is a notable shift in the main determinants of regional employment performance (considering the crude rate of net migration, fertility rate, human resources in science and technology, old age dependency, and particularly labour productivity) during the pre- and post-pandemic time span between the North and South regimes in Europe.
Our main results have several policy implications. First, they highlight the most vulnerable labour market European regions to employment shocks. Thus, policymakers can design more targeted and timely interventions like active labour market policies and skill development programmes, or even regionally tailored fiscal measures, to mitigate potential unemployment risks. For instance, by identifying regions with strong spatial spillovers, it allows governments to prioritize investments in digital infrastructure—particularly broadband, 5G, and digital public services—in territories that function as regional hubs. In Northern regions, such investments can reinforce existing high-productivity clusters, while in Southern regions they can mitigate digital divides. Moreover, policymakers can design mobility schemes, retraining programmes, and job-matching platforms that account for cross-border labour shortages. The allocation and absorption of EU Cohesion Policy funds can also be improved as policymakers can target funds toward regions where improvements will diffuse to surrounding territories.
Second, for business representatives, we provide a framework to anticipate cyclical adjustments and rescale workforce strategies effectively. Spatial analysis can identify vulnerable clusters in Southern Europe where crises—such as COVID-19—are likely to generate rapid cross-border employment declines. For managers, these insights support more informed decisions on site location, recruitment strategies, and supply chain adjustments by signalling which regions are most exposed to spillover risks and which benefit from robust growth clusters.
Third, we bring empirical evidence to the academic field to underscore how external shocks can amplify spatial disparities in employment and reaffirm the need for data-driven, regionally differentiated policies to enhance labour market stability.
6. Conclusions
Monitoring and assessing employment shifts in national and regional labour markets is crucial for understanding economic performance and promoting sustainable development. Shifts in unemployment are shaped by changes in labour market structure, employee compensation, real labour productivity, and demographic dynamics, all of which offer important insights for policymakers, employers, and labour market scholars. Periods of crisis typically trigger labour market instability and generate broader repercussions for financial systems and employment outcomes. The COVID-19 pandemic, in particular, severely disrupted social and economic activity worldwide, resulting in substantial increases in unemployment. Analyzing employment patterns during crises and their aftermath is therefore essential for anticipating economic trajectories and assessing prospects for socioeconomic recovery and adaptation. A regional perspective of the investigation is especially valuable, as it reveals spatial disparities in growth and identifies vulnerable lagging areas, thereby informing targeted policy interventions aimed at strengthening economic resilience and promoting balanced and sustainable development.
Despite significant empirical findings in spatial dependence in European labour markets, several gaps were spotted and tackled through this paper. First, empirical studies typically rely on a limited set of structural indicators, giving insufficient attention to drivers such as migration flows and high-tech human capital—factors that have become increasingly important in the context of digitalisation. Second, methodological advances in dynamic spatial panels and common-factor models have improved estimations, yet causal identification remains limited, with most evidence focused on correlation. While North–South convergence has been observed, the influence of cross-border spillovers on regional catch-up, particularly in a pre- versus post-pandemic perspective, is still poorly explored.
Building on this literature, the novelty of the paper is therefore twofold. First, the present study contributes by integrating richer explanatory variables, including migration and high-tech human resources as a proxy to digital skills, into a spatial framework at the NUTS 2 level. Second, it investigates regional employment divergences by explicitly contrasting employment dynamics before and after the pandemic and between the North and South European regions. By broadening the range of explanatory variables, strengthening identification strategies, and explicitly analyzing pandemic-induced discontinuities, the paper offers a novel contribution to understanding the resilience and structural transformation of European labour markets.
Through our spatial modelling approach, we were able to map the regional pre- and post-pandemic dynamics of employment in Europe. Thus, we observed a persistent North–South divide in employment, with Southern regions having lower employment rates. Furthermore, we pinpoint towards the main structural North–South divergences highlighted through the spatial econometric analysis. First, the explanatory power of the compensation of employees was notable only for the North regime, while being statistically insignificant for the South regime. Second, for the South regime, labour productivity loses its explanatory power in 2022, being significant only in 2019. Finally, the employment rate in the South regime is better explained by demographic factors such as fertility rate and old age dependency ratio, along with net migration and human resources in science and technology, which pinpoint towards a transition from output-driven to demographically anchored spatial dynamics in the South regime.
This paper provides empirical evidence to support the fact that changes in both the labour market and demographic structures, employee compensation, productivity, and migration flows significantly influence regional employment trajectories, shaping both short-term resilience and long-term growth potential.
In terms of research limitations, our analysis is constrained by the availability of data regarding the NUTS 2 regions of the EU for the years taken into consideration. Due to missing data, Portugal and Netherlands have been excluded from the models, a fact which may affect the cross-region comparability. Since spatial models rely on a high number of spatial units, in our case, regions, eliminating some of them may distort spatial autocorrelation measures, spatial regimes, and, implicitly, patterns of employment or socioeconomic conditions. Moreover, regions from Portugal and the Netherlands may present different socioeconomic profiles from the others included, with their omission meaning a less diverse overall regional picture of the EU labour market. Also, the limited number of variables with NUTS 2 granulation available on Eurostat restricts the inclusion of certain socioeconomic factors which may have an impact on the employment rate. Some of the variables used in the models, namely HRST, serve only as proxies for larger socioeconomic processes, i.e., the digitalization of labour markets.
Future directions of research could include extending the analysis to NUTS 3 regions to explore with finer detail the spatial patterns of employment in the EU. Furthermore, adding a temporal dimension to the models could be another direction, thus revealing how spatial spillovers vary over time and how policies or socioeconomic shocks may affect employment.
Author Contributions
Conceptualization, M.B.B., S.C., M.E.P. and A.C.; methodology, M.B.B. and S.C.; software, M.B.B. and S.C.; validation, M.B.B. and S.C.; formal analysis, M.B.B., S.C. and M.E.P.; investigation, M.B.B., S.C. and M.E.P.; resources, M.B.B.; data curation, M.B.B. and S.C.; writing—original draft preparation, M.B.B., S.C., M.E.P. and A.C.; writing—review and editing, M.B.B., S.C., M.E.P. and A.C.; visualization, M.B.B. and M.E.P.; supervision, M.E.P.; project administration, A.C.; funding acquisition, A.C. All authors have read and agreed to the published version of the manuscript.
Funding
This work was supported by the NUCLEU Program funded by the Romanian Ministry of Research, Innovation, and Digitalization, Project PN 22100104.
Institutional Review Board Statement
Not applicable.
Informed Consent Statement
Not applicable.
Data Availability Statement
The data presented in this study are openly available in Final_Data_2022.csv at https://drive.google.com/file/d/1JCl9GwOHbXSiT0K4ARM_DwBapXyd6xr8/view?usp=sharing (accessed on 15 October 2025), and in Final_Data_2019.csv at https://drive.google.com/file/d/1NIw0_CLHClX2svm9liLWOMkdRw7tZeV3/view?usp=sharing (accessed on 15 October 2025).
Conflicts of Interest
The authors declare no conflicts of interest.
Abbreviations
The following abbreviations are used in this manuscript:
| AIC | Akaike information criterion |
| EU | European Union |
| GDP | Gross domestic product |
| HRST | Human resources in science and technology |
| LISA | Local indicators of spatial association |
| LM | Lagrange Multiplier |
| LR Test | Likelihood Ratio Test |
| NUTS | Nomenclature of Territorial Units for Statistics |
| OECD | Organisation for Economic Co-operation and Development |
| OLS | Ordinary least squares |
| SAR | Spatial autoregressive |
| SARAR | Spatial autoregressive-autoregressive |
| SC | Schwarz criterion |
Appendix A
Table A1.
Estimation of spatial regression models for 2019 and 2022—NORTH.
Table A1.
Estimation of spatial regression models for 2019 and 2022—NORTH.
| Variable | 2019 | 2022 | ||||||
|---|---|---|---|---|---|---|---|---|
| Spatial Lag | Spatial Error | Spatial Lag | Spatial Error | |||||
| Coefficients | p-Value | Coefficients | p-Value | Coefficients | p-Value | Coefficients | p-Value | |
| Intercept | 8.9872 (6.7540) | 0.1833 | 47.578 (4.8648) | 0.0000 | 14.9654 (9.2303) | 0.1049 | 55.4204 (5.5884) | 0.0000 |
| LN(Cmp_empl) | 1.0725 (0.4086) | 0.0086 | 1.2807 (0.4114) | 0.0018 | 0.9672 (0.4273) | 0.0236 | 1.1101 (0.4602) | 0.0158 |
| CRN_migr | 0.4180 (0.1010) | 0.0000 | 0.5026 (0.1005) | 0.0000 | ||||
| Old_age_dp | 0.2869 (0.0744) | 0.0001 | 0.3420 (0.0775) | 0.0000 | 0.2251 (0.0753) | 0.0028 | 0.2318 (0.0805) | 0.0040 |
| W.Empl_rate | 0.5889 (0.1018) | 0.0000 | 0.5671 (0.1262) | 0.0000 | ||||
| Lambda | 0.7255 (0.0984) | 0.0000 | 0.5454 (0.1435) | 0.0001 | ||||
| R-squared | 0.5030 | 0.5282 | 0.2721 | 0.2554 | ||||
| AIC | 663.028 | 657.77 | 681.064 | 681.434 | ||||
| Likelihood Ratio Test | 17.7464 | 0.0000 | 21.0048 | 0.0000 | 12.4751 | 0.0004 | 10.1051 | 0.0014 |
| Moran’s I for Residuals | 0.075 | 0.014 | −0.008 | −0.016 | ||||
Source: authors’ own research results. Standard errors are reported in parentheses.
Table A2.
Estimation of spatial regression models for 2019 and 2022—SOUTH.
Table A2.
Estimation of spatial regression models for 2019 and 2022—SOUTH.
| Variable | 2019 | 2022 | ||||||
|---|---|---|---|---|---|---|---|---|
| Spatial Lag | Spatial Error | Spatial Lag | Spatial Error | |||||
| Coefficients | p-Value | Coefficients | p-Value | Coefficients | p-Value | Coefficients | p-Value | |
| Intercept | 7.2733 (8.4297) | 0.3882 | 35.0766 (6.5579) | 0.0000 | 8.8415 (8.0025) | 0.2692 | 29.6444 (5.7030) | 0.0000 |
| CRN_migr | 0.3135 (0.0753) | 0.0000 | 0.2909 (0.0720) | 0.0000 | 0.5015 (0.0788) | 0.0000 | 0.5471 (0.0762) | 0.0000 |
| Fert_rate | 7.3351 (2.1254) | 0.0005 | 7.3709 (2.5034) | 0.0032 | 10.622 (1.9699) | 0.0000 | 8.7011 (2.2885) | 0.0001 |
| HRST | 0.1525 (0.0642) | 0.0175 | 0.2512 (0.0687) | 0.0002 | 0.2358 (0.0554) | 0.0000 | 0.2782 (0.0584) | 0.0000 |
| Old_age_dp | 0.1585 (0.0876) | 0.0705 | 0.1814 (0.1007) | 0.0715 | 0.2645 (0.0749) | 0.0004 | 0.2028 (0.1215) | 0.0119 |
| Lab_prod | 0.5523 (0.2216) | 0.0126 | 0.3969 (0.2258) | 0.0788 | ||||
| W.Empl_rate | 0.5111 (0.1418) | 0.0003 | 0.2795 (0.1294) | 0.0308 | ||||
| Lambda | 0.6617 (0.1357) | 0.0000 | 0.7083 (0.1215) | 0.0000 | ||||
| R-squared | 0.4642 | 0.4720 | 0.5918 | 0.6309 | ||||
| AIC | 618.713 | 617.043 | 586.314 | 578.407 | ||||
| Likelihood Ratio Test | 9.2787 | 0.0023 | 8.9480 | 0.0027 | 3.6673 | 0.0554 | 9.5741 | 0.0019 |
| Moran’s I for Residuals | 0.032 | 0.030 | 0.079 | 0.024 | ||||
Source: authors’ own research results. Standard errors are reported in parentheses.
References
- Anderton, R., Botelho, V., Consolo, A., Da Silva, A. D., Foroni, C., Mohr, M., & Vivian, L. (2021). The impact of the COVID-19 pandemic on the euro area labour market. In Economic bulletin articles (Vol. 8). European Central Bank. Available online: https://www.ecb.europa.eu/press/economic-bulletin/articles/2021/html/ecb.ebart202008_02~bc749d90e7.en.html (accessed on 24 September 2025).
- Anselin, L. (2007). Spatial regression analysis in R: A workbook. Available online: https://dces.wisc.edu/wp-content/uploads/sites/128/2013/08/W14_Anselin2007.pdf (accessed on 24 September 2025).
- Anselin, L. (2024). An introduction to spatial data science with GeoDa. Volume 1: Exploring spatial data. Available online: https://lanselin.github.io/introbook_vol1/ (accessed on 24 September 2025).
- Arbolino, R., De Simone, L., & Di Caro, P. (2021). Can EU funds promote regional resilience at time of COVID-19? Journal of Policy Modeling, 43(5), 1019–1038. [Google Scholar] [CrossRef]
- Baum, T., Solnet, D., Robinson, R., & Yan, H. (2022). Tourism work, media and COVID-19: A changed narrative? Annals of Tourism Research, 97, 103492. [Google Scholar] [CrossRef]
- Belman, D., & Wolfson, P. (2016). What does the minimum wage do in developing countries? A review of studies and methodologies. In Conditions of work and employment series, No. 62. International Labour Organization. Available online: https://www.ilo.org/publications/what-does-minimum-wage-do-developing-countries-review-studies-and (accessed on 24 September 2025).
- Bourdin, S., & Levratto, N. (2023). The spatial footprint of COVID-19 and local policy answers. Regional Studies, 58(2), 255–262. [Google Scholar] [CrossRef]
- Brussevich, M., Dabla-Norris, E., & Khalid, S. (2020). Who will bear the brunt of lockdown policies? Evidence from Tele-workability measures across countries. In IMF working papers (Vol. 2020). International Monetary Fund. Available online: https://www.elibrary.imf.org/view/journals/001/2020/088/001.2020.issue-088-en.xml (accessed on 24 September 2025).
- Caselli, F., Lin, H., Toscani, F., & Yao, J. (2024). Migration into the EU: Stocktaking of recent developments and macroeconomic implications. In IMF working papers (Vol. 2024). International Monetary Fund. Available online: https://www.imf.org/en/Publications/WP/Issues/2024/09/27/Migration-into-the-EU-Stocktaking-of-Recent-Developments-and-Macroeconomic-Implications-555578 (accessed on 24 September 2025).
- Chen, X. (2025). Migration spillover: Spatial panel analysis on small areas in Europe. Spatial Demography, 13, 10. [Google Scholar] [CrossRef]
- Chocholatá, M., & Furková, A. (2018). The analysis of employment rates in the context of spatial connectivity of the EU regions. Equilibrium: Quarterly Journal of Economics and Economic Policy, 13(2), 181–213. [Google Scholar] [CrossRef]
- Chocholatá, M., & Furková, A. (2023). Spatial heterogeneity and spillovers of employment in the EU regions. Zagreb International Review of Economics and Business, 26(2), 163–182. [Google Scholar] [CrossRef]
- Doerr, S., & Gambacorta, L. (2020). COVID-19 and regional employment in Europe. In BIS bulletin, No. 16. Bank for International Settlements. Available online: https://www.bis.org/publ/bisbull16.pdf (accessed on 24 September 2025).
- Drahokoupil, J., & Müller, T. (2021). Job retention schemes in Europe: A lifeline during the COVID-19 pandemic. In ETUI working paper 2021.07. European Trade Union Institute. Available online: https://www.etui.org/sites/default/files/2021-09/Job%20retention%20schemes%20in%20Europe%20-%20A%20lifeline%20during%20the%20Covid-19%20pandemic_2021_0.pdf (accessed on 24 September 2025).
- Elhorst, J. P. (2019). Spatial panel models and common factors. In M. Fischer, & P. Nijkamp (Eds.), Handbook of regional science. Springer. Available online: https://www.rug.nl/staff/j.p.elhorst/spatial-panel-models-common-factors-improved-feb2022.pdf (accessed on 24 September 2025).
- Eurofound. (2020). Living, working and COVID-19: First findings. Available online: https://www.eurofound.europa.eu/en/publications/all/living-working-and-covid-19-first-findings-april-2020 (accessed on 24 September 2025).
- Eurofound. (2024). Regional employment change and telework resilience post-COVID-19. Available online: https://www.eurofound.europa.eu/en/publications/all/regional-employment-change-and-geography-telework-europe (accessed on 24 September 2025).
- Eurostat. (2021). COVID-19 labour market impact. statistics explained. Available online: https://ec.europa.eu/eurostat/statistics-explained (accessed on 24 September 2025).
- Eurostat. (2022). Labour market and labour force survey statistics-2021 review. Available online: https://ec.europa.eu/eurostat (accessed on 24 September 2025).
- Gebremariam, G. H., Gebremedhin, T. G., Schaeffer, P. V., Phipps, T. T., & Jackson, R. W. (2012). Employment, income, migration and public services: A simultaneous spatial panel data model of regional growth. Papers in Regional Science, 91(2), 275–298. [Google Scholar] [CrossRef]
- Giannakis, E. (2021). Spatial connectivity and regional economic resilience in the EU. Sustainability, 13(20), 11289. [Google Scholar] [CrossRef]
- Jankiewicz, M. (2023). Regional economic growth and unemployment in the European Union—A spatio-temporal analysis at the NUTS-2 level (2013–2019). Hungarian Geographical Bulletin, 72(2), 179–192. [Google Scholar] [CrossRef]
- Kivi, L. H., & Paas, T. (2021). Spatial interactions of employment in European labour markets [Special Issue]. Eastern Journal of European Studies, 12, 196–211. [Google Scholar] [CrossRef]
- LeSage, J. P. (1999). The Theory and practice of spatial econometrics. Available online: https://www.spatial-econometrics.com/html/sbook.pdf (accessed on 24 September 2025).
- Lindsay, F. (2024). Coordination breakdown: The impacts of COVID-19 on migration in Europe. Migration Policy Institute. Available online: https://www.migrationpolicy.org/sites/default/files/publications/mpi_covid-mobility-europe_final.pdf (accessed on 24 September 2025).
- Liu, H., Tan, Q., & Mai, H. (2023). Stress-buffering effects of social support on tourism employees during the COVID-19 Pandemic: A moderated mediation model. International Journal of Environmental Research and Public Health, 20(3), 2342. [Google Scholar] [CrossRef] [PubMed]
- Lottmann, F. (2012). Explaining regional unemployment differences in Germany: A spatial panel data analysis. In SFB 649 discussion paper 2012(26). Humboldt University of Berlin. Available online: https://www.econstor.eu/bitstream/10419/56702/1/688826695.pdf (accessed on 24 September 2025).
- Malousis, A. T., Zefkilis, P. N., & Daglis, T. (2023). Employment in the 21st century: Pre- and post-COVID-19 changes. Encyclopedia, 3(3), 853–869. [Google Scholar] [CrossRef]
- Matthews, S. A. (2006). GeoDa and spatial regression modeling. Available online: https://ibis.geog.ubc.ca/~brian/workshop/GeoDa_Spatial_Regression.pdf (accessed on 24 September 2025).
- Müller, K., Poppele, I., Ottiger, M., Zwingmann, K., Berger, I., Thomas, A., Wastlhuber, A., Ortwein, F., Schultz, A.-L., Weghofer, A., Wilhelm, E., Weber, R.-C., Meder, S., Stegbauer, M., & Schlesinger, T. (2023). Impact of rehabilitation on physical and neuropsychological health of patients who acquired COVID-19 in the workplace. International Journal of Environmental Research and Public Health, 20(2), 1468. [Google Scholar] [CrossRef] [PubMed]
- OECD. (2020). The Territorial impact of COVID-19: Managing the crisis across levels of government. OECD Publishing. [Google Scholar] [CrossRef]
- OECD. (2021). OECD employment outlook 2021: Navigating the COVID-19 crisis and recovery. OECD Publishing. [Google Scholar] [CrossRef]
- Piribauer, P., Glocker, C., & Krisztin, T. (2023). Beyond distance: The spatial relationships of European regional economic growth. Journal of Economic Dynamics and Control, 155, 104735. [Google Scholar] [CrossRef]
- Plzáková, L., & Smeral, E. (2022). Impact of the COVID-19 crisis on European tourism. Tourism Economics, 28(1), 91–109. [Google Scholar] [CrossRef]
- Saputra, P. M. A. (2023). COVID-19 and tourism industry: An investigation of spatial dependence in Europe. Cogent Social Sciences, 9(2), 2282413. [Google Scholar] [CrossRef]
- Schmidt, T. D., & Mitze, T. (2023). Epidemic–economic complexity of COVID-19 policies across skill groups and geographies. Regional Studies, 58(2), 322–335. [Google Scholar] [CrossRef]
- Smaal, B., & Elhorst, J. P. (2025). Seventy Years of dutch regional unemployment from a spatiotemporal perspective. De Economist, 173, 277–298. [Google Scholar] [CrossRef]
- Tobler, W. R. (1970). A computer movie simulating urban growth in the detroit region. Economic Geography, 46, 234–240. [Google Scholar] [CrossRef]
- Woolridge, J. M. (2012). Introductory econometrics: A modern approach. Cengage Learning. [Google Scholar]


Disclaimer/Publisher’s Note: The statements, opinions and data contained in all publications are solely those of the individual author(s) and contributor(s) and not of MDPI and/or the editor(s). MDPI and/or the editor(s) disclaim responsibility for any injury to people or property resulting from any ideas, methods, instructions or products referred to in the content. |
© 2025 by the authors. Licensee MDPI, Basel, Switzerland. This article is an open access article distributed under the terms and conditions of the Creative Commons Attribution (CC BY) license (https://creativecommons.org/licenses/by/4.0/).