1. Introduction
South Africa is a young, democratic republic operating on a multilevel fiscal system that decentralizes the national public services and responsibilities amongst the nine sub-national/provincial entities as stipulated in the Constitution. Since the democratic transition in 1994, South Africa has been undergoing arduous economic recertification from a system of inherited inequality to a system of the efficient collection and transfer of fiscal revenue to provide equal services to all. Unlike some countries which adopt a federalist system, South Africa sources a considerable portion of its revenue through the national collecting agency, The South African Revenue Service (SARS), and disseminates revenue through the Division of Revenue Act (DORA) to individual provinces, enabling them to carry out their fiscal duties, government functions, and deliver public services. The portion of this intergovernmental transfer system that deals with the revenue delivered to each province is the Provincial Equitable Share (PES), which is a formula-based allocation system that divides the nationally raised scarce revenue equitably and objectively among the provinces to meet provincial government and its departments’ expenditure needs (
Sour 2013). Although individual provinces are allowed to exploit their taxable capacity and raise revenue through receipts, the portion is negligible compared to the national transfers.
Between the fiscal years of 1999 and 2020, expenditures implemented by provinces constitute about 44 percent of total government expenditure incurred at all levels, only 1.3 percent of which was raised through the local provinces’ receipts (Western Cape at roughly 4 percent). On average, nearly 90 percent of the provincial expenditure is financed through transfers from the national government via the PES.
The design and calculation of the Provincial Equitable Share (PES) formula implemented for allocating the nationally raised scarce revenue to the individual provinces are crucial determinants for the appropriate and effective delivery of public goods and services. There are at least four reasons why a formula-based determination of the division of revenue is preferred over its counterpart—a discretion-based transfer system: Firstly, at the institutional level, the formula-based approach promotes systems transparency. This includes informing the sub-national governments of the derivations that dictate the budget constraints each province must face, as well as the perceived national priority agendas. Secondly, the formula-based approach ensures the relative consistency and objectivity of the revenue allocation. Thirdly, it is much easier to project future revenue trends based on a formula approach than trying to subjectively forecast the allocations. Fourthly, the systematic approach of the formula method helps enforce the future adjustments of the formula impartially and scientifically. Since the implementation of the formula approach, all adjustments were based on rigorously researched arguments and updates of datasets to amend the existing formula.
Despite these merits of the formula approach, the more vexing challenge remains to identify the optimal formula for gaining the highest efficiency for the fiscal allocation of equitable share revenue. More specifically, this paper asks the following question: what variable(s) should be utilized for deciding the shares to which individual provinces are entitled? Underlying this enquiry is also to examine the underlying data used in the intergovernmental transfer model. This is crucial, as the over-allocation of resources to provinces that do not have the underlying demand base creates inefficiency collectively at the national level. Misplacements of unutilized equitable share resources also lead to deadweight cost as the fund lies unproductive and idle, surreptitiously eroded by the advancing inflation. On the other hand, under-allocation hampers public service delivery, hollows public morale, and causes civil discontentment and strife. Ultimately, though there is little doubt that the objective dissemination of revenue provisions through the formula-based funding model is superior to the discretion-based funding method, and is one of the vital pillars for objective intergovernmental transfers in a multilevel fiscal system, the issue of discovering a potentially newer and better distribution formula—one that both services the expenditure needs of the individual provinces adequately and is geared towards the national priorities—remains a constant query.
This paper examines the equitable share portion of South Africa’s intergovernmental transfer structure. The sections include a top-down descriptive overview, as well as a historical trend analysis of the component weights for dividing the equitable share revenue pool decided by the National Treasury as spending priorities from 1999 to the present. Focus is also placed on the Provincial Equitable Share (PES) formula and the equation’s evolution since its inception. The paper then uses the enrolment–survival rate as a point of demonstration to inject a dose of incentive structure into the formula without comprising the inclusivity of the current formula.
Section 2 of the paper provides a detailed overview of the intergovernmental transfer system in South Africa methodology, with special attention paid to the equitable share (ES) component trends decided by the National Treasury of South Africa as unconditional grants, as well as the Provincial Equitable Share (PES) formula for education.
Section 3 presents an overview of the historical formulas for education PES and provides critiques on the current state of calculating the education component share in the PES formula.
Section 4 takes a different stance by means of incorporating the Enrolment Survival Rate (ESR) measure, as well as other potential measures to stimulate a meaningful discussion around improving the underlying incentive structure and encouraging the allocation efficiency of the education equitable share in the formula.
Section 5 provides concluding remarks.
2. Literature Review
Equitable Share (ES)—An Overview
Section 214 of the Constitution of South Africa, Act 108 of 1996 (referred to as “the Constitution” henceforth), mandates the vertical dissemination of the nationally raised revenue between the national, municipal/local, and provincial spheres of government in an objective and unbiased manner. Included in this constitutional mandate is the PES formula that determines each province’s equitable revenue share (
Barati and Szalai 2000).
In turn, Section 227(1) of the Constitution requires each province that received their equitable resources to perform their basic services using the fiscal powers that are constitutionally bestowed on them (
Khan and Agrawal 2016;
Fenge and Meier 2001). Each year, a Division of Revenue Act is published to inform all major governing bodies of the division of equitable revenue shares to be delivered to each sphere of the government between the nine provinces (horizontal dissemination), as well as detailed schedules of all other special allocations, such as the conditional grants from the National Department of Treasury to the respective provinces and local governments (
Sour 2013).
There are two major transfers from the national revenue fund allocated to the provincial governments: equitable shares and conditional grants. The conditional grants are given under certain economic criteria and fiscal objectives that are linked to the national spheres. This allows the national departments to increase their oversight of policy objectives carried out by the local provinces and municipalities (
Panao 2020). Most of the literature on conditional grants in South Africa focuses on the division of equitable revenue shares to be delivered to each sphere of the government between the nine provinces (
Rodden et al. 2003;
Kornai et al. 2003;
Crivelli et al. 2010). This study, however, joins previous work. Contrary to the conditional grants are the unconditional transfers (or the equitable shares), which are the focus of this paper. These are given to each province to carry out its prerogatives and be held directly accountable for the spending purposes of these funds. Individual provinces’ own revenues are not included in the calculation of equitable shares.
It is noteworthy that changes in the economy and the policy environment have a mandatory influence on the fiscal envelope and resources available in the fiscus for transfers to all layers of government revenues (
Kjaergaard 2015). Price fluctuations such as inflation and exchange rates not only play a significant role in the movement of the fiscus available for allocation but also the future risks of the fiscus, especially factors relating to the values of external debts (
Shotton and Gankhuyag 2019).
Major public policy alterations such as income taxes, fiscal targets, and rate of borrowing requirements also affect the total revenue available for transfers (
Breton 1998). These considerations are beyond this research; however, it is important to appreciate the multi-varying factors that could affect the fiscal space in which the allocation of PES maneuvers.
Many studies have examined the vertical fiscal imbalance (
Breton 1998;
Shah 2007;
Aldasoro and Seiferling 2014;
Bird and Smart 2002).
McLure (
1994) says that different authors define the vertical fiscal imbalance differently. For
Broadway and Tremblay (
2005), the vertical fiscal imbalance is characterized as any deviation, whether negative or positive, from the ideal vertical financial gap. However, few studies have provided a detailed overview of the intergovernmental transfer system in South Africa’s methodology, and little attention has been paid to the equitable share (ES) component trends decided by the National Treasury of South Africa as unconditional grants, nor to the Provincial Equitable Share (PES) formula for education. Therefore, this article will fill this gap in the literature. This paper examines the equitable share portion of South Africa’s intergovernmental transfer structure.
3. Methodology
Figure 1 presents the shares of the national revenue space transferred to provinces between 1999 and 2013 in terms of conditional grants (CGs) and equitable shares (ESs). According to the balanced data available, the average ESs for the decade leading up to 2013 accounts for a major share of the transfers from the national department to the provincial at 88.4%, while the CGs was at 11.6%. The provincial fiscal framework for the 2005 MTEF showed a significant increase in conditional grant budgets. This is due to the shift in the security grant function from provinces to the national sphere of government. This affected the composition of the provincial transfers as well as the ratio of the ESs to CGs. As the national transfers in the 2005 MTEF showed, 64.4% of revenue was allocated to ESs, and 35.6% was allocated to CGs. The 2006 MTEF indicates that as of 1 April 2006, the South African Social Security Agency (SASSA) would be able to fund social assistance completely through the Department of Social Development; therefore, social security assistance would no longer be administered as a conditional grant.
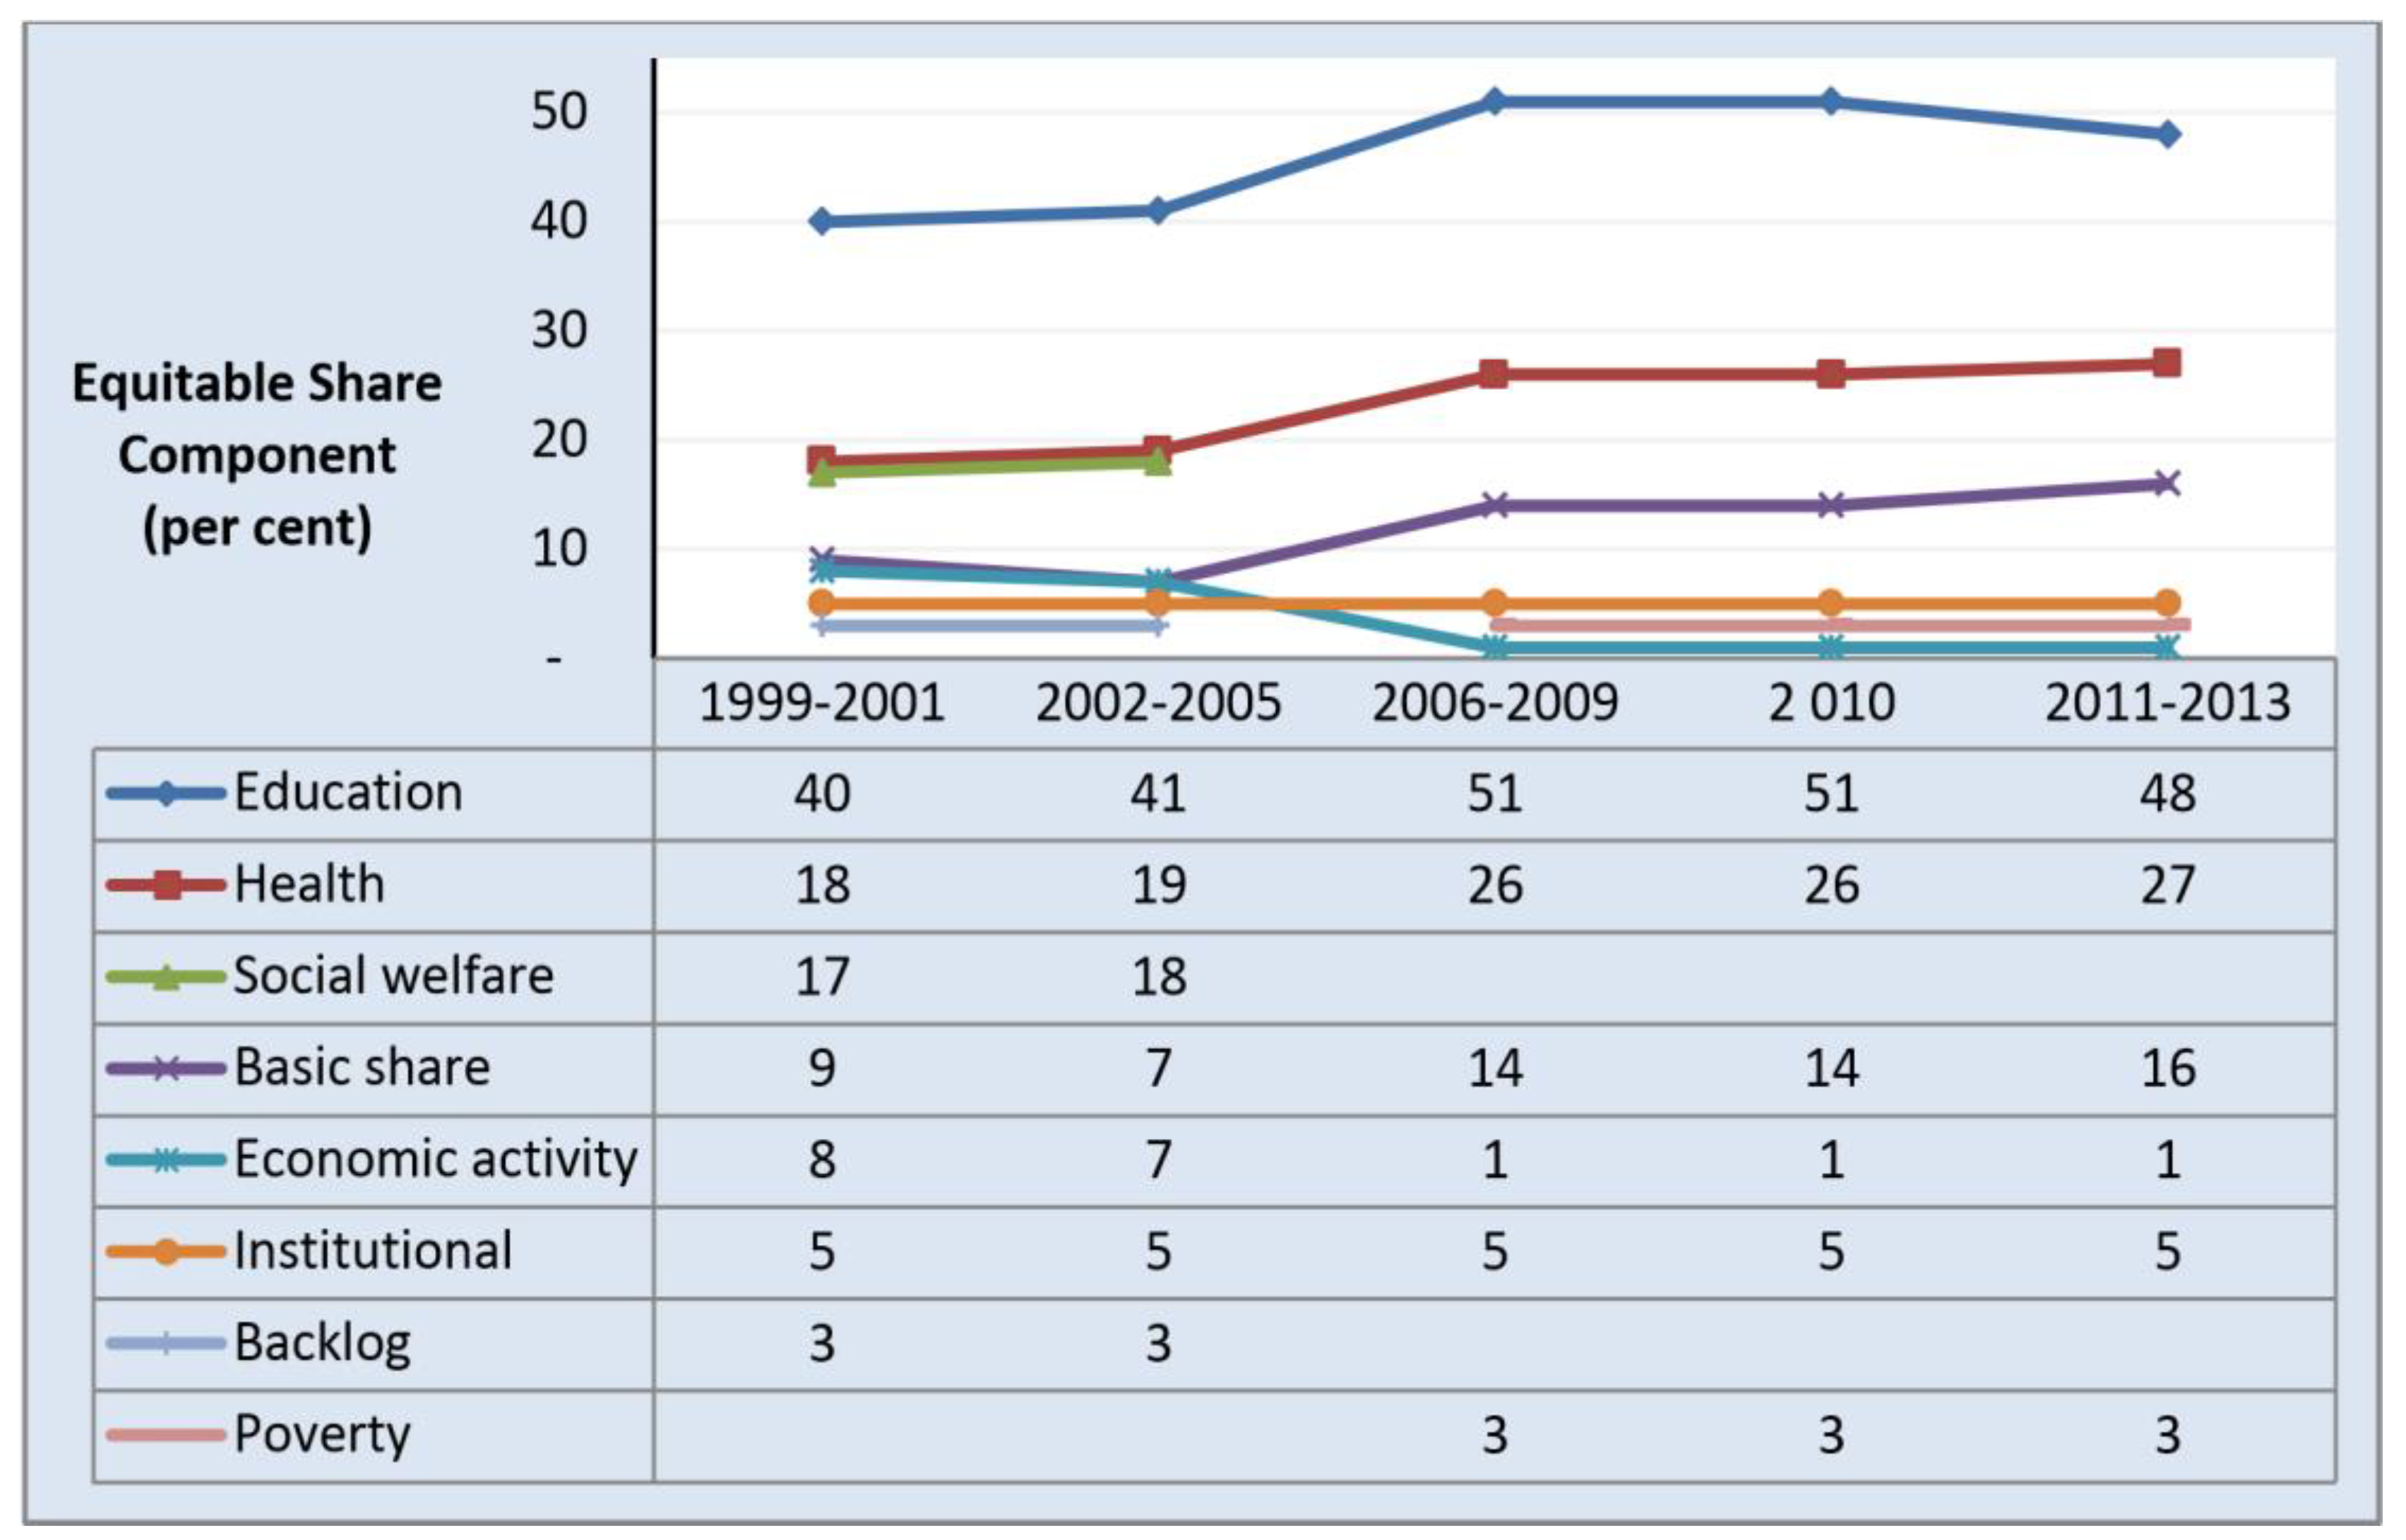
Within the provided revenue space of the equitable share, the national governing body decides on a suite of key priorities for dividing the fund according to specific purposes as components. Each component has an assigned percentage of the weight of the ES transfers. These decisions were based on the historical trends of aggregate expenditures incurred and revised periodically to take into account the changes in the service priorities.
Figure 2 presents the ES component weights in terms of shares assigned to all provinces for the period under review. The main spending components of the ES, albeit minor alterations, are education, health, and social welfare/basic shares. Data suggests that the education component stands the highest in terms of share relative to other components, as it receives shares between 50 and 51 percent of the total revenue bundle. The second highest share is the health component, which increased from 18 percent of the ES in 1999 to 27 percent since 2011. The third highest share was the component of social welfare between 1999 and 2005, and basic share from 2006 onwards. Together, the three largest components accounted for 75–78 percent of the ES allocation between 1999 and 2005, and 91 percent in the years following.
The institutional component provides resources for provinces to create and maintain administrations and institutions of governance and was allocated to provinces on an equal proportion basis. The economic activity component recognizes the correlation between economic infrastructures and activities to maintain, expand, and initiate new public services; hence, the economic component allocation was implemented (
FFC 2002). The component of backlog acknowledged that due to South Africa’s history of the unequal distribution of welfare based on race, some provinces, especially in rural areas, require additional assistance to develop services. This allocation was reversed in 2006.
It is noteworthy that these components are subject to changes based on the perceived economic priorities and policy agenda of the National Treasury. Notably, the removal of the social welfare and backlog components and the introduction of the poverty component resulted in the upward shifts in the share of major priority components (education, health, and basic shares) since 2006. At the same time, the component for economic activity also dropped from between 7 and 8 percent to only 1 percent. These changes were most likely due to the consideration that providing financial accommodations to provinces based on the strengths of the local economy may lead to a biased allocation for provinces of metropolitan and city regions with vibrant economic hubs, therefore disobeying the laws of inclusive growth policies. The reason for this adjustment was also that provinces had been given additional taxation and borrowing powers. This intention of adopting inclusive policies was made doubly clear by the fact that component shares of “backlog” were specifically reorganized as the “poverty” component, where poverty measures are used to calculate the PES allocations. The aim of the poverty component, introduced with a weighting of 3 percent, was obviously to allocate additional funds to the poorer regions of the provinces.
The National Cabinet must make informed policy decisions in preparing the appropriate budgets of the components each year to support the sub-national governments in their functions. Due to budget constraints, these decisions are ultimately trade-off choices that necessitate scientific knowledge, political judgement, and intuition of the socio-economic consequences.
Once the component shares are finalized by the Division of Revenue Act (DoRA), each province is entitled to receive the entitled portion of the ES revenue via the Provincial Equitable Share (PES) formula, based on a given set of provincial indicators. These indicators in the formula are largely demographic measures seeking to reflect the appropriate and objective revenue needs of the provinces while satisfying the criteria of inclusive service delivery to all provinces. Like the component shares of the ES, the PES formula can also be modified according to the evolving nature of the policy environment and the need for a better intergovernmental transfer system led by the National Treasury.
The Provincial Equitable Share (PES)
The PES for allocating the provincial shares of the equitable revenue of the components is a formula-based funding model designed to divide the national revenue in an appropriate, efficient, and unbiased manner.
The objectiveness and social inclusivity of the formula are captured by way of a pre-determined, static population shares addition formula. The calculation seeks to direct available funds appropriately across the provinces based on each province’s potential demand for services as represented by the demographics of the provinces, observed socio-economic circumstances, and requirements, while remaining within the budget constraint of the fiscus as well as following the prudent fiscal principles for good intergovernmental transfer system set out below (
FFC 2002):
Promotion of fiscal autonomy and allocative efficiency of recipients (usually sub-national government);
Provision of adequate revenue to sub-national governments to fulfil national and provincial responsibilities;
Minimizing wastage in the intergovernmental system;
Responding to long-term returns on social and capital investments;
Promoting positive fiscal incentives when objectives are met;
Enhancing equity and fairness;
Promoting stability, simplicity, and transparency.
4. Data
An important aspect of the PES allocation formula is its heavy reliance on objective data to determine the shares. Up to 60% of the observed changes in the equitable share allocation to the provinces are determined by provincial population data of some kind (
National Treasury 2013). These calculations are reviewed and updated with newly available datasets on an annual basis. Since the PES formula is largely data-driven, any changes in the data about the estimated population would ultimately cause significant changes to a province’s share in various components of the ES shares. To cushion provinces against these significant impacts due to the updating of data, changes to the PES are normally phased in over the 3-year MTEF period (
Schwab and World Economic Forum 2013). The most recent and significant modification to the allocation outcomes occurred in 2013, when the 2011 census data was used to update the PES formula; these data contain the most recent and accurate provincial population estimates.
Table A2 illustrates the phase-in effect of the PES over the MTEF period due to the census data of 2011 for provinces.
Other datasets used to update the PES formulas for the component shares include school enrolment data from the School Realities Survey; the General Household Survey for medical aid coverage; GDP-R data from the Gross Domestic Product by Region Survey (GDP-R); and the 2010/11 Income and Expenditure Survey for poverty, among others.
Table A3 in the
Appendix A presents the key variables for the PES formula for each component, as well as the datasets used to calculate each equitable share revenue allocated to each province. This paper’s focus is on the education component, which involves two major variables: school-age population and school enrolments. Both variables can be measured at the provincial level and used for the PES allocation calculation. The school-age population variable is defined as individuals between the ages of 6 to 17 in the pre-2003 PES calculation, (and ages 5 to 17 for the post-2003 PES), derived from the latest census data available at the time. There have been three censuses conducted by Statistics South Africa (StatsSA) so far since 1994: The 1996, 2001, and 2011 censuses.
It is worth noting that the 2011 census data revealed discernable differences with the original mid-year population estimates. The most significant discrepancy was the underestimation of the total population in the country by roughly 1.2 million individuals, bringing the total population to 51.67 million in South Africa in 2013. Notably, Gauteng, Mpumalanga, and Western Cape had much larger population sizes than previously anticipated; hence, a significant gap in the PES formula’s allocation of the ES revenue is realized.
Table 1 shows the difference in population between the original mid-year estimates and the updated 2011 census, as well as the impact on the PES’s phase-in targets for the MTEFs for unconditional grants to the individual provinces. Data suggest that the populations of Kwazulu-Natal, Eastern Cape, and Limpopo were underestimated by 1.6% (or roughly 552,000 in total), 0.8% (268,000) and 0.5% (150,000), respectively. Meanwhile, Gauteng and Western Cape together gained more than 1.4 million extra individuals than formerly considered in the PES calculation. These shifts necessitated the adjustment of the PES revenue to be transferred to the provinces to ensure the province’s service delivery.
To safeguard the functional stability of the existing provincial budget, apart from the phase-in period, the government also granted extra provisions for this adjustment to ensure a smooth transfer of resources from provinces that have fewer needs to those requiring service. This ultimately created a trade-off between optimal allocative efficiency and the desired institutional stability of the provincial governments.
In sum, the Provincial Equitable Share (PES) formula divides the equitable share revenue among provinces according to a set of province-specific demographic indicators. The indicators are used to account for the relative demands of resource provision required by each province to deliver and satisfy the service needs of the population. Considerations are spared to pre-existing or historical expenditure patterns in the province. In times of change, a phase-in period of approximately three years is adopted.
The most important determinant for the PES is unquestionably the accuracy and timeliness of new data for updating the formula to allocate appropriate provisions of unconditional grants to each province. It is worth underscoring that although the division of the nationally raised revenue is decided centrally by the national government, once allocated, the provincial executive councils have the discretion over the departmental allocations of the unconditional grants. This decision was made from the perspective that the unique circumstances which the individual provinces face are best addressed locally, while receiving oversight by the National Department of Treasury.
5. Education Component of the PES
Since the education component has the highest weighting relative to other components (see
Figure 2), it naturally has an important bearing on the overall distribution of the unconditional transfers for the province. This section of the paper provides a detailed discussion of the variables used in the education component of the PES formula, as well as the history of the formula used to calculate the education component of the unconditional grant allocations to each province.
As previously mentioned, the education component of the PES formula relies on two variables: school-age population and enrolment. Both of these variables are population turned share variables represented at the provincial level (this will be elaborated below). The school-age population variables essentially measure the potential beneficiaries who are entitled to the education component of the ES grant for the basic educational services, irrespective of whether they are enrolled in school.
The other key variable is the enrolment variable. Unlike the schooling-age population, enrolment denotes the actual beneficiaries accessing service, which reflects the actual cost and demand for education services. From the viewpoint of providing service grants, enrolment is a superior predictor and more accurate measure of educational service needs than the school-age population. Furthermore, enrolment also carries with it incentives for provinces to increase school enrolments. The main drawback of the enrolment variable is that it lacks sensitivity to educational quality in the PES outcomes.
5.1. A Historical Literature Review of the PES
From its inception in 1997/98, the education component of the PES formula (48–51% of the ES) remained largely the same, except for the relative weights. The equitable shares formula remained largely the same. Between 1999 and 2003, the general formula for calculating the PES for individual provinces was defined as follows:
where
, and
.
It is worth noting that
Govinda Rao and Khumalo’s (
2004) paper “Sharing the Cake: A Review of Provincial Equitable Share Formula in South Africa” defined the formula mistakenly as follows:
while
.
The division should be performed separately from the sums to achieve 100% coverage of the ES education component total to all the provinces.
refers to the primary and secondary school learners enrolled in public ordinary schools for the past 3 years;
refers to the average school-age population between the ages 6 and 17;
refers to the education component of the ES. It is worth noting that this formula of the PES places double the weight or importance on the school-age population proportion relative to the enrolment data used to calculate the PES shares. The PES formula is a sum of weighted shares formula. The individual shares are determined by the school-age population relative to the national school-age population, as well as the learners enrolled in the province relative to the national total enrolment. As such, the sum of all PESs should be equal to the national allocation of the ES for the education component, or a one hundred percent share of the provision allocation to the provinces (
Bird and Smart 2002).
In 2003, the Budget Council thought that every five years, a detailed review of the structure of the formula should be conducted to provide better certainty and relevance of the PES and allow for the phasing in of any changes. To this end, a comprehensive review of the PES formula was undertaken in early 2004. This review mainly dealt with the following enquiries:
The extent to which the equitable share formula supported the government’s objective of effecting redistribution of resources among provinces;
The modalities of shifting funding of social security grants to the national sphere;
Whether the formula should continue to have explicit components for social services functions such as education and health;
How the formula could be used or complemented by other mechanisms so that it addresses broader policy challenges such as economic development, poverty, and so on.
In part, the issues studied by the council that eventually led the charge to change the relative weight in the formula were as follows:
Determining whether the weights in the formula (which should reflect policy priorities) are still equitable given changes in policy, demographic patterns, and economic changes;
Evaluating the frequency of the data for the different components of the formula and the possible updating of data in the formula.
Given these considerations, the education component of the PES formula was revised because data for the school-age population was hard to come by for the timeous updating of the transfers. In addition, to improve early child development, the age band for the school-age population was also expanded downward to include 5-year-olds.
The PES formula for education since 2005 has therefore become as follows:
where
and
.
refers to the primary and secondary school learners enrolled in the public ordinary schools for the past 3 years;
is the average school-age population between the ages 5 and 17; and
refers to the equitable share for the education component. Most crucially, the weights for both the school-age population and enrolment of students in the calculation are no longer of the ratio 2:1; these variables are now of equal weight. A numerical example of how the Provincial Equitable Share (PES) allocation method is used is presented in
Appendix A.1 of the
Appendix A.
5.2. PES for All Provinces in South Africa
Figure 3 below presents the shared outcomes for the education component of the PES allocated to each province in South Africa since 1999. The province that received the highest share is KwaZulu-Natal, which has the highest proportions of school-age students as well as students enrolled in public schools in the whole country at above 20 percent for the period under review (see
Table 2).
Limpopo and Eastern Cape were the next provinces receiving the highest shares of the education component of the PES at the beginning of the new century. However, this changed in 2007 when both the school-age population and enrolment in Gauteng expanded; at this time, Gauteng received a portion of the Limpopo province’s shares. In 2013, Gauteng became the second province receiving the highest share in terms of the PES. Western Cape received a relatively stable share of the education component in its PES from the national revenue ES for the period under review, as the school-age and enrolment shares both grew at a marginal 1.15% over the 14 years included in the review.
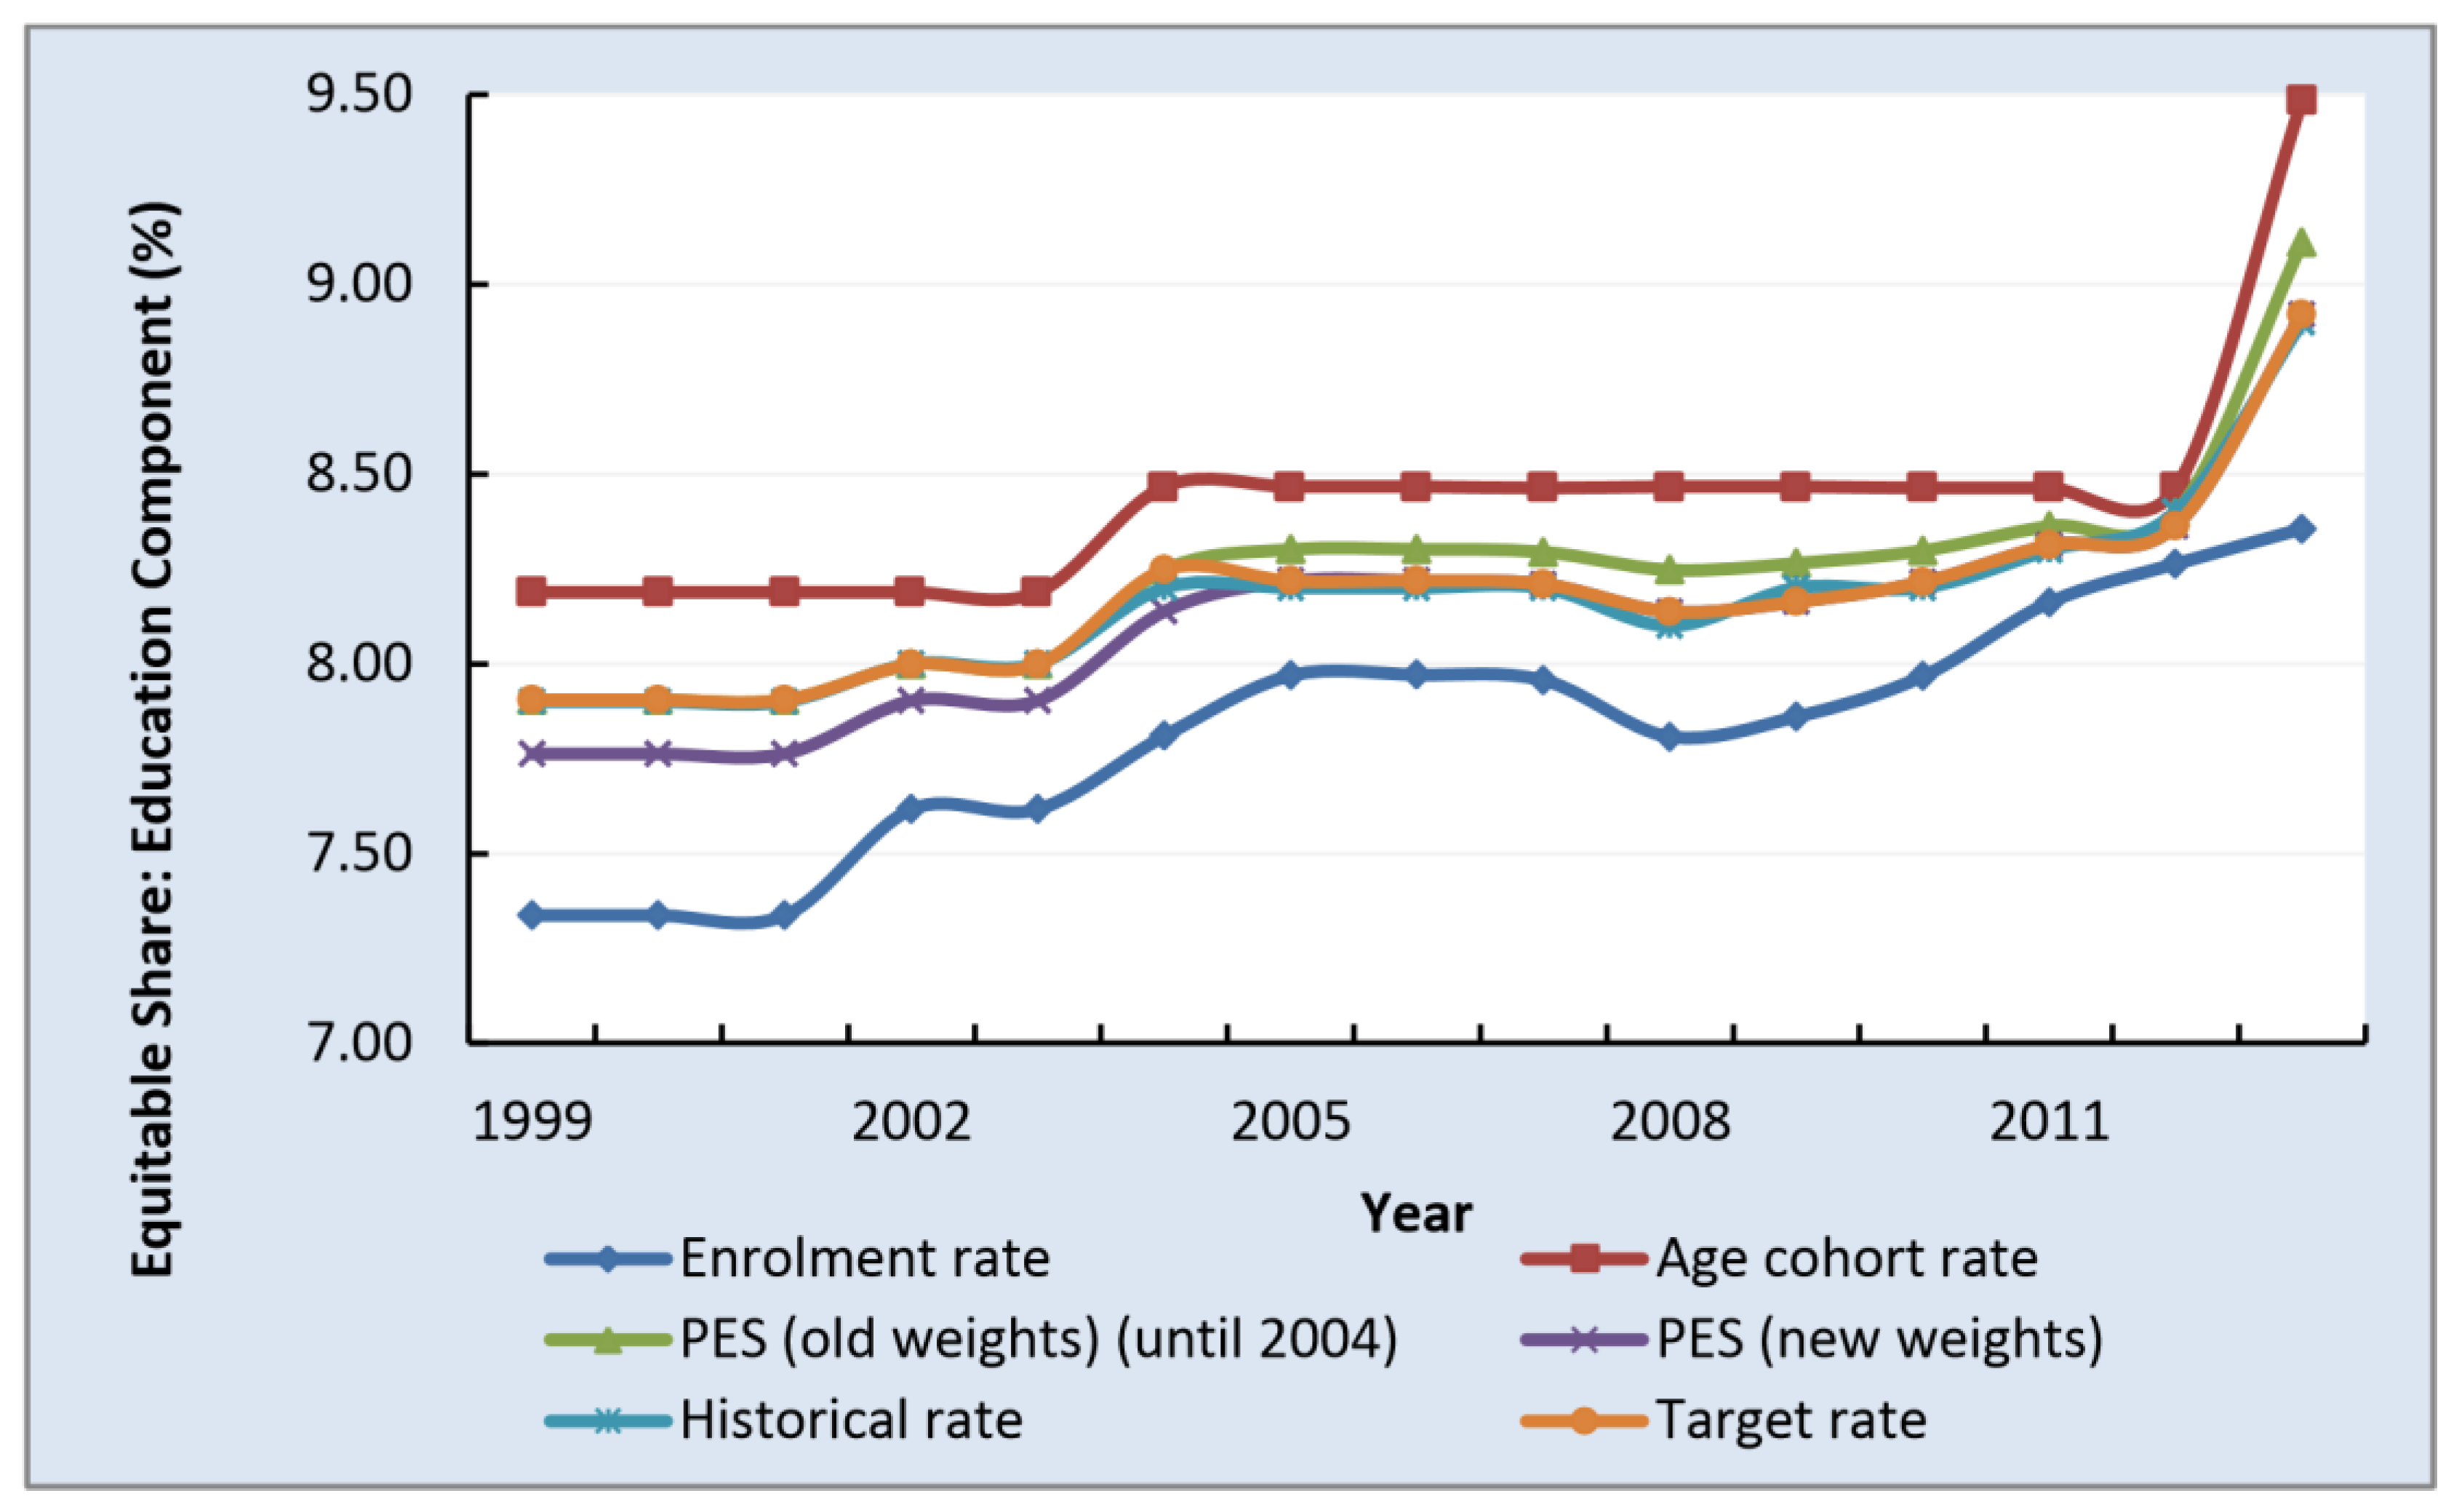
Data in
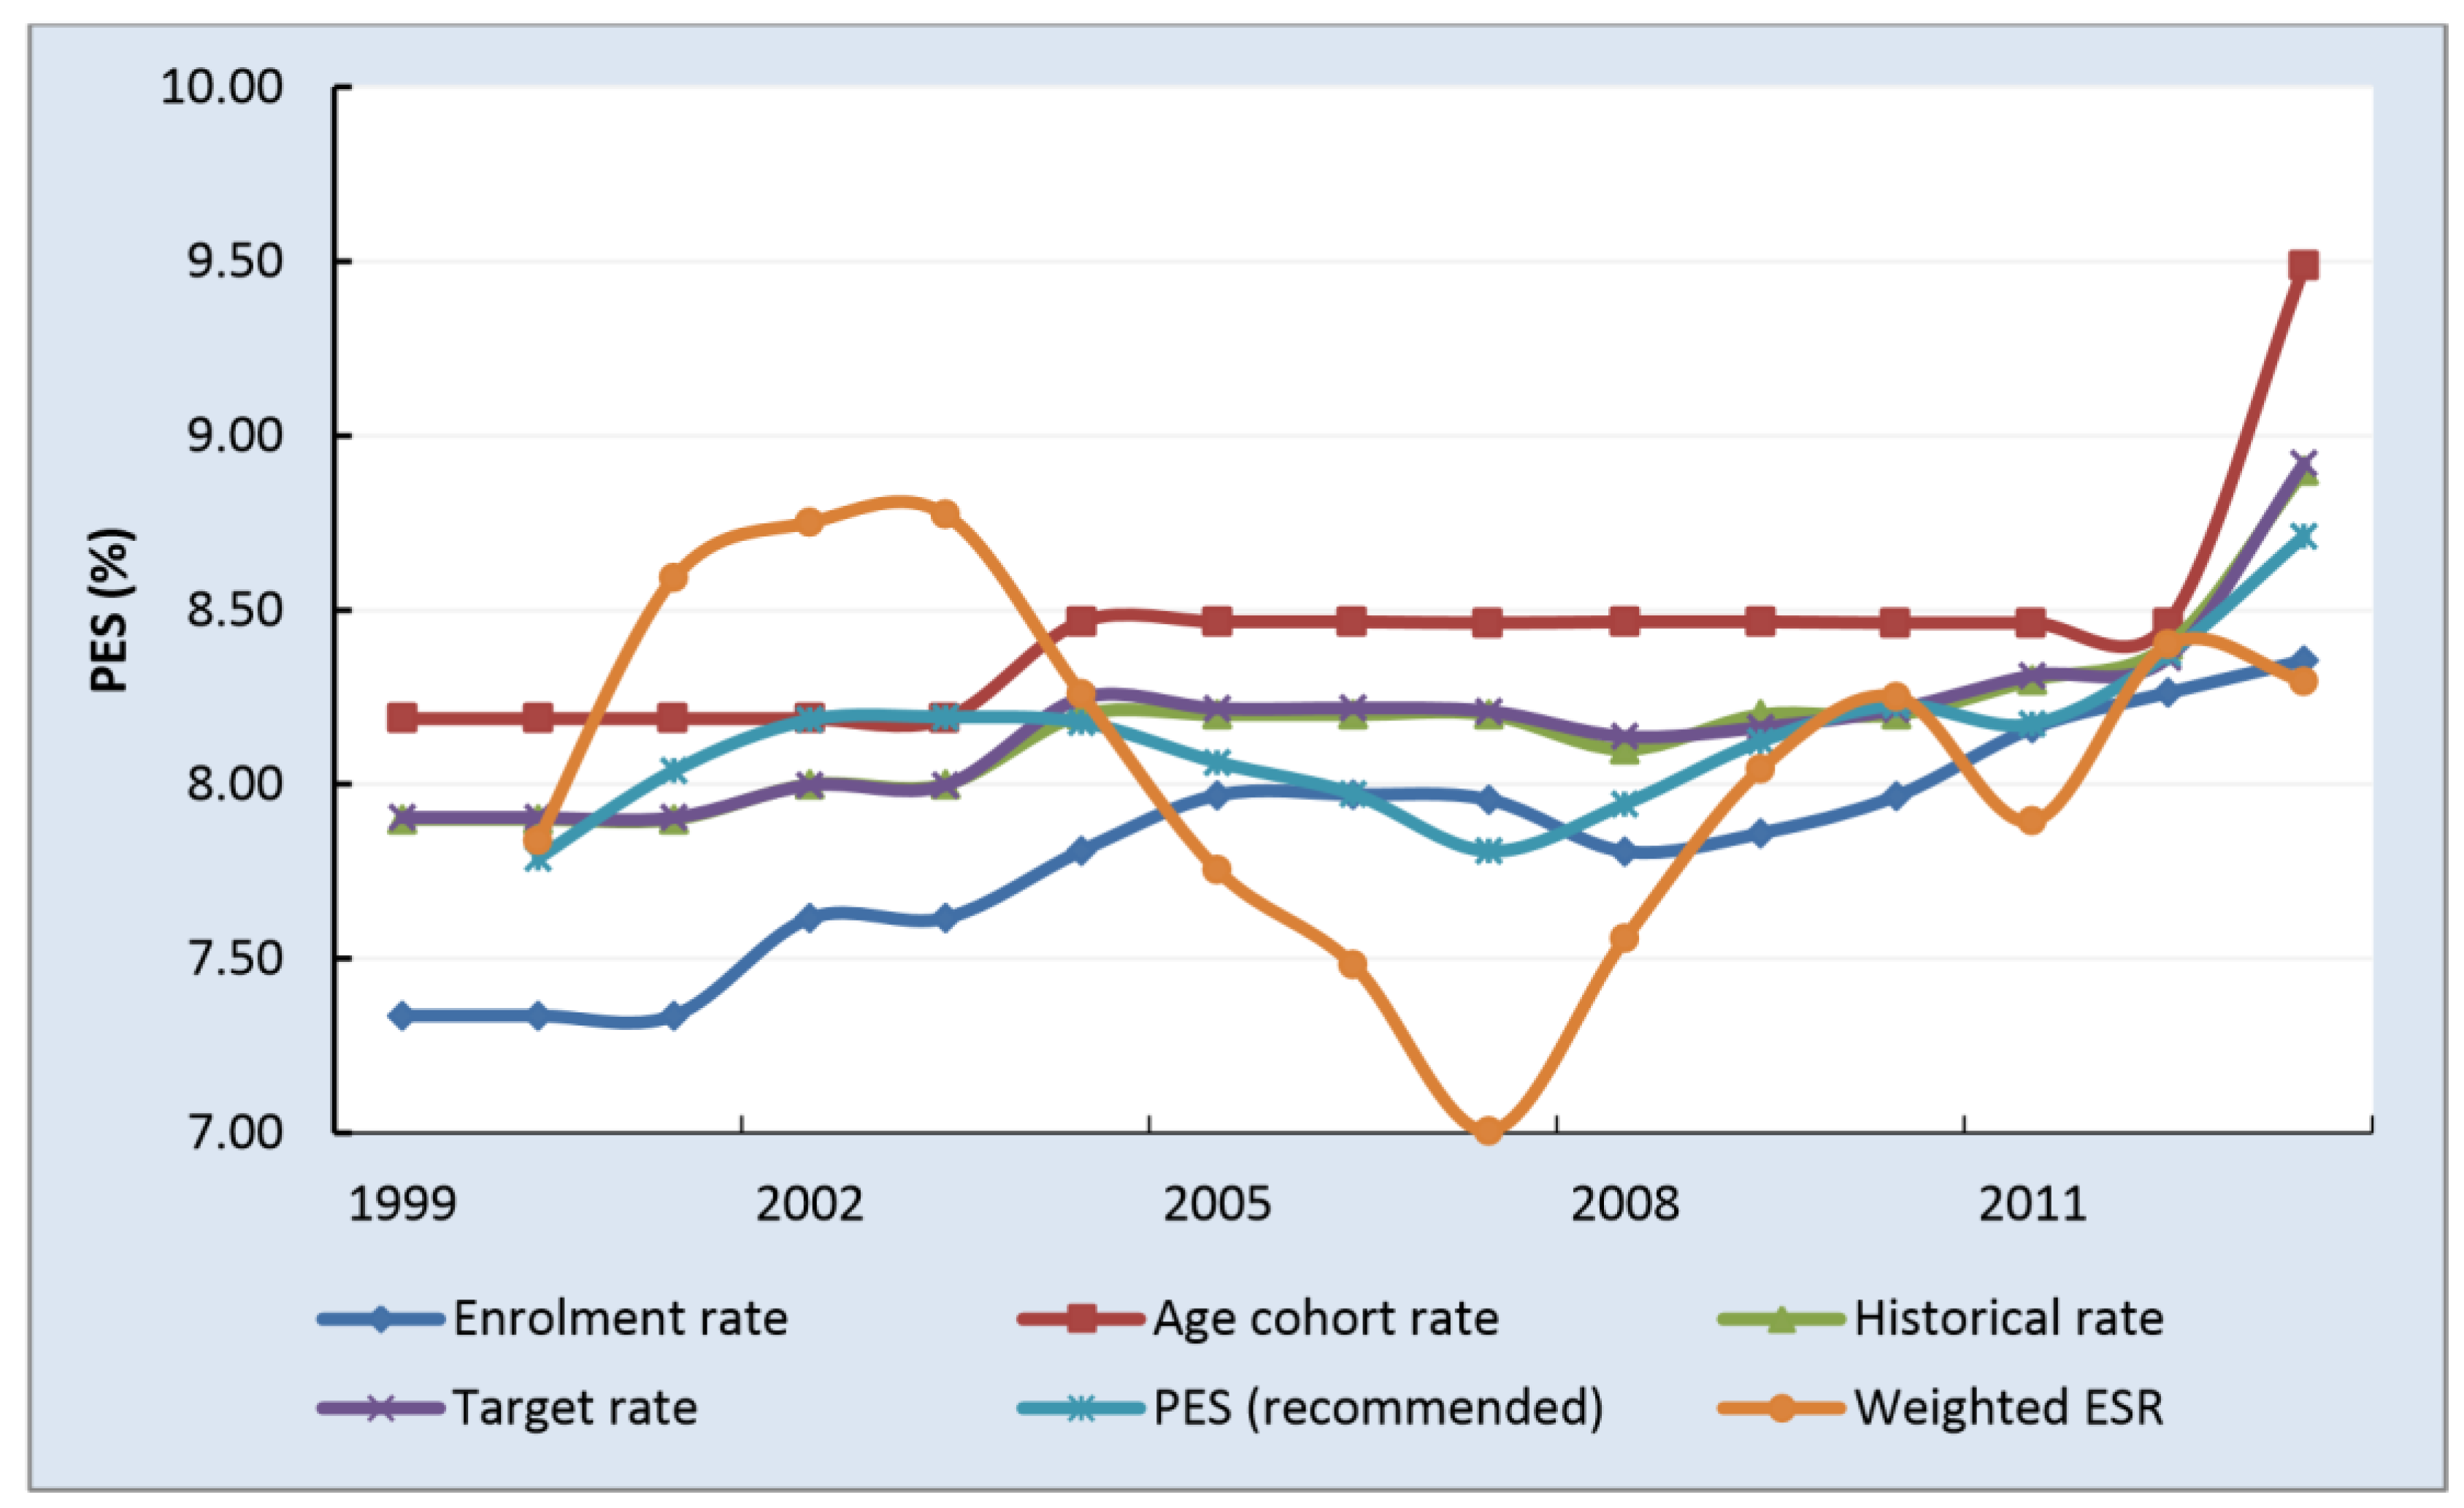
Figure 4 show the enrolment rate, and school-age cohort rate, as well as the Provincial Equitable Shares for the Western Cape province from 1999 to 2013, using both the old and new weights as a comparison.
The target rate is the normative PES rate which should have been used according to the National Treasury’s method of calculation—without the adjustment of phasing-in. The historical rate is the actual PES received by the province, or, essentially, the target rate plus the phase-in effect. These rates are juxtaposed as references of comparison for the PES revenue received by Western Cape.
In terms of the PES formula, Western Cape has a higher age–cohort rate than the enrolment rate used for calculating the PES. This means that for the province, the age–cohort rate is the major contributor to a higher share outcome in the PES calculation for receiving the education component of the unconditional grants. The relative weight for the province has a higher age–cohort rate than the enrolment rate used for calculating the PES. The relative weight for the age–cohort variable to enrolment is therefore crucial for determining the outcome shares allocated to Western Cape. As the comparison between the PESs using the new and the old weights shows, before 2005, where the weights for the two variables were the ratio 2:1 (school age population to enrolment), Western Cape received a higher share in terms of the outcome PES. This is because more emphasis (weight) was attached to the school-age population variable for the calculation of the shares. In the post-2005 period, however, Western Cape received relatively less compared to the pre-2005 period for its PES shares, as the weights for the two variables were equalized.
5.3. Issues with the PES Formula
Despite the objectiveness of the formula-based approach to divide the ES revenue among provinces, there are some imperfections embedded in the PES system that could interfere with the accuracy and sensitivity of the transfer outcomes. At its outset, no clear linkages are bonding the National Development Plan (NDP) objectives, Provincial Strategic Objectives (PSO) and other inclusive growth targets, with the PES formula. Hence, the formula may be lacking direction for the desired economic state in its allocation (see
Appendix A.2 in the
Appendix A for both the PSO and NDP objectives. This section describes these identified weaknesses in the PES system in two main types: inadequacies of the variables and misconceptions about the PES formula. Each is in turn discussed in full.
5.4. Inadequacies of the Variables
The enrolment and age–cohort population variables are both stock measures of the population. The enrolment variable can be seen as the need variable, as it captures the number of students who are participating in the schooling system, therefore requiring the state’s unconditional grant transfers for educational services. The age–cohort population variable specifically targets those who fall within the school ages between 5 (and 6 for some previous years) and 17 and are eligible for receiving basic educational services through the ES allocation.
Although these simple and direct measures are useful for calculating the required shares for transfer, they are not flow measures, which are useful for identifying trends such as the quality of education. Published research has shown that the sheer volume of enrolment does not lead to sustainable employment or growth outcomes as much as the quality of education. Put differently, there is very little correlation—if any—between the allocations based on formalized enrolment and age–cohort population, and the target that harnesses inclusive growth. Inclusivity in the economic trend of education necessitates a balanced and quality enrolment, backed by a sustainable environment for future quality enrolments, to generate a flowing supply of labor with the skillsets required to compete and fulfil work duties. Ultimately, a flow, rather than a stock measure, should be included to create incentives in the PES formula to muster the targeted transfer process that leads to an inclusive growth process.
The current definition of the enrolment variable is too broad and unspecific to achieve these inclusive targets in the PES formula. The variable for the enrolment could include school repeaters, temporary dropouts, and over-age returnees, which dilutes the real needs of the target population that requires service. From the state’s perspective, this also causes allocative inefficiencies in delivering the needed resources. Although the age–cohort population variable in some way serves as a way of controlling the enrolment variable and focuses the resource allocation formula on those that are eligible for schooling, this control only applies at the limits of the age band (five and 17 years old). Pupils that continuously repeat and return after dropouts within the age band would still be mistakenly classified as eligible for enrolment in the PES formula.
The school-age cohort variable also retains some weaknesses, although of a different kind: infrequent data and inconsistencies in the series. The information on the school-age population is only updated once the national population census is conducted, which could take between five years to a decade. This is far too scarce and inconsistent to form a reliable source for determining annual provisions to be delivered to the provinces, not to mention the movements (migration) and changing growth patterns of the age cohorts within different provinces. Census data also stands the risk of numerous survey data issues such as non-response, subject fatigue, and input errors. In contrast, the administrated dataset would have none of these truncation data issues and defects.
These issues of the variables are possible to resolve. Firstly, by refining the definition of the enrolment stock variable, the PES formula would no longer be influenced by academic repeats and dropouts. As for the issues of age–cohort population and data timeliness, these can be resolved by using administrative data instead of the census. One potential product is the “school-age enrolment” variable, which shall be discussed later.
Other issues that deserve consideration with respect to the variables used are the geographical and price-specific factors. Specifically, there is a potential risk for the migrant population who are moving between provinces seeking work and suitable services that are not reflected in the ES calculation. This issue of the PES formula failing to take migrants into account applies to all components of the ES allocation. Furthermore, the formula does not take into account the cost differentials between provinces in terms of providing services. Individual provinces may be significantly different in terms of the cost required to provide services depending on, among other things, the supply and demand of teachers, access to educational facilities and internet, and general infrastructure.
5.5. Misconception about the Formula
There is a misconception about the equitable share formula amongst sub-national governments that provinces can gain a higher share by having higher formula variables (enrolment and school-age population for education). However, this is a gross misapprehension of the PES formula’s mathematical construct and a false incentive for provinces to increase their measures in an attempt to gain a higher PES share. In other words, there is a false incentive for provinces to manipulate the variables to reflect more beneficiaries than there are. Alternatively, the system may be reluctant to pass through individuals as the enrolment would decrease. The PES formula is a multi-variant dependent function whose outcome shares for a province are ultimately a function of the shares of other provinces combined. This means that there is no stationary maximum in the ES formula to be exploited in terms of gaining the most shares by manipulating the variables; in addition, further population increases may be unproductive and create future socio-economic burdens for the province.
To formalize this fact, below is a hypothetical setting where two provinces, 1 and 2, have populations
and
, respectively. In this simplified, two-province nation, the equitable share allocation for province 1 will ultimately be determined by some form of a population share calculated using the following function:
are both positive absolute numbers (i.e., populations).
Differentiating
, the function with respect to province 1 through the quotient rule
yields the following:
This first derivative of the function
with respect to
(via chain rule) is a negative function:
This means that the additional share of increasing the population for province 1 or is increasing at a decreasing rate (the second derivative of function , the rate-of-rate function, is negative). Simply put, the additional share values gained from a higher population (or enrolment and school-age population in the formal PES formula) are reducing for every additional increase in the population variables. Furthermore, it is interesting to note that to achieve the maximum allocation of the revenue e-share outcome for province 1, the first derivative of function with respect to must be equal to zero, which means the population for province 2 (or ) must be zero.
In sum, then, the main drivers for a province’s ES allocation are not only the variables of the province but also the variables of other provinces. Increasing the variables in search of a higher share is, however, both economically and politically dangerous to gauge real benefits, as this may lead to all sorts of socio-economic implications in both the short-term as well as long-term periods. Provinces should instead be aware of these functional properties of the ES formula. This would ameliorate any misconceptions about the biasedness towards large provinces for the distribution of revenue. Further, this would form a mutual understanding about the inherent inter-dependency of sharing the equitable share revenue.
In the interim, at the individual, and provincial levels, the optimal level of equitable share revenue and the formula debate for more revenue should be based on long-term desired social and economic visions and unique circumstances, substantiated by cogent researched facts and hypotheses within the province. Factors supported by information must be taken into account when determining and shaping an economic trajectory on a balanced and sustainable new-growth path.
With these insights, the next section is dedicated to suggesting a set of potential variables that could be used to improve the current PES formula.
6. Improving the PES Formula
There is very little debate among economists that the quality and access to education have a profound impact on the future supply of labor as input productivity for economic growth. Indeed, countries with a supply shortage of labor and/or an abundant labor supply but low-quality skilled laborers are often associated with tepid growth rates, high rates of structural unemployment, and a general deficiency of market readiness for competition (
Roos 2020). As the world economy continues to modernize in the new century, it will increasingly demand more skilled laborers who are capable of working with sophisticated technologies and developing new ideas while shunning those who are uneducated and unskilled (
Grossman and Krueger 1995). Workers without quality basic education or training will ultimately become undesirable in the marketplace. Any growth opportunities, no matter how inclusive, will be inaccessible to them.
South Africa is classified as an upper-middle income country by the World Bank. Between 1994 and 2013, South Africa spent an average of more than 5.46% of its GDP public spending on education each year, which is more than East, Pacific, and Central Asia, as well as Europe (
Hanushek and Wößmann 2007). However, South Africa ranks 132 out of 144 countries in the world for primary education, 140th for the quality of its general educational system, and 143rd for the quality of maths and science education—amongst the lowest tenth percentile of nations in the world according to the World Bank’s Global Competitive Report 2012/13. There is a mismatch between state spending on education and the educational outcomes through the allocation of resources in the design of the PES formula to sub-national government and quality outcomes of education in South Africa (
Mincer 1974).
This section of the paper turns from a positive description of the (Provincial) Equitable Share allocation formula, its history, the mathematical construct, and outcome, to a normative analysis. It takes a bolder view of the defects of the current formula of the PES and seeks to improve it by introducing a new variable: the Enrolment Survival Rate. The section shall end with a list of suggested variables that require further investigation and extrapolation in the PES formula.
6.1. Enrolment Survival Rate
The school-age population and enrolment variables used in the PES formula to calculate the equitable share revenue have a significant drawback in terms of incentives. As discussed, both variables are merely stock measures that are useful for capturing scales of the population in terms of quantity, not quality. Being overly dependent on these stock measures in a revenue-sharing formula such as the PES will only create incentives to increase the number or size of that measure, and not the underlying meaning or quality. Measures for quality are generally measured by rates; more specifically, in economic terms, they are measured by flow rates. A flow rate places more emphasis on the speed at which the stock measure grows and survives, and therefore, the quality of the stock. Flow rates are frequently used in economics to measure the underlying value of all goods and services, or in other words, their inputs and outputs. For instance, the quality of an economy is not represented by the aggregate stock of GDP, but more importantly, its (seasonally adjusted) GDP growth rates in a time series. In health economics, quality is not captured by the sheer size of the population, but by survival rates and mortality rates (e.g., Infant-Mortality Rate (IMR)). In the same vein, and in the context of education, the PES formula should incorporate a flow-rate measure to increase its emphasis on quality and incentives instead of the scale or size of the population. One of the potential measures that satisfy such quality-dependent requirements while not undermining the inclusive principles, is the Enrolment Survival Rate.
The Enrolment Survival Rate is calculated as the number of students enrolled in the grade, divided by the number of students enrolled in the previous grade in the previous year. More formally, for a province, this is calculated as follows:
where
Essentially, the Enrolment Survival Rate measures the proportion of students that survived grade t at time ; hence, the pupil’s effective learning outcomes, as well as the efficiency of the educational system in bringing academically eligible students to future studies, are measured. For example, the Enrolment Survival Rate for grade 12 pupils this year is represented as the ratio of grade 12 pupils over the grade 11 pupils enrolled last year.
To incorporate the Enrolment Survival Rate (ESR) into the revenue-sharing formula as one of the variables for calculating the PES rates, it must be weighted according to the population weight of the enrolment for grade
t in the base year (denominator). The general form for the weighted ESR of a particular province
is as follows:
where
This measure has numerous advantages. Firstly, data for the province-grade-specific enrolments can be sourced from the Education Management Information Systems (
EMIS n.d.) of the National Department of Education itself. There are at least four further advantages in this measure that are in line with the PES objective in delivering the appropriate amounts of resources to its targets. Firstly, it is updated annually with the grade-specific enrolment information contained in the data to achieve frequent updating of information in the PES revenue formula.
This prevents sudden miscalculations that were witnessed in the medium-term allocation of unconditional grants witnessed in the census for the school-age population.
Secondly, embedded in this survival measure is of course the satisfying of the inclusive criterion, which is captured by the enrolment population weight variable , for province i. This population weight ensures that the survival rate measure still has the whole population of pupil enrolment in view. Thirdly, unlike other crude measures such as the matric pass rate or set educational board exams, the survival rate is accommodating in that it does not discriminate against those provinces that are disadvantaged in educational infrastructure, resulting in low pass rates as their initial conditions.
Fourthly, and perhaps the most powerful advantage of using the Enrolment Survival Rate, is the utilization of the administrative data on province-grade-specific enrolment in the EMIS n. d. Hence, the advantages in the administrative data, such as a 100% response rate, data accuracy, etc., are all included as the ESR’s strengths as a measure.
Notwithstanding the rich wealth and the level of detailed information it can provide, there is a potential for turning the administrative database of the students into a panel with the place of residence, therefore making the monitoring of individuals’ academic progress, place of study, and migration history over time, possible.
6.2. Calibrating the Enrolment Survival Rate Variable
This subsection provides a demonstration of incorporating the survival rate variable in the PES calculation using the grade 11 and 12 enrolment data provided in the EMIS from the year 1999 to 2013. It should be noted that the decision to use these two grades is merely a coincidence. The aim is to present a sense of the implication of adding a survival measure in the PES revenue division calculation and how such flow-rate measures that capture aspects of stock quality would impact the revenue-sharing outcome. The measure should be augmented to incorporate all grades in basic education in future calibration studies.
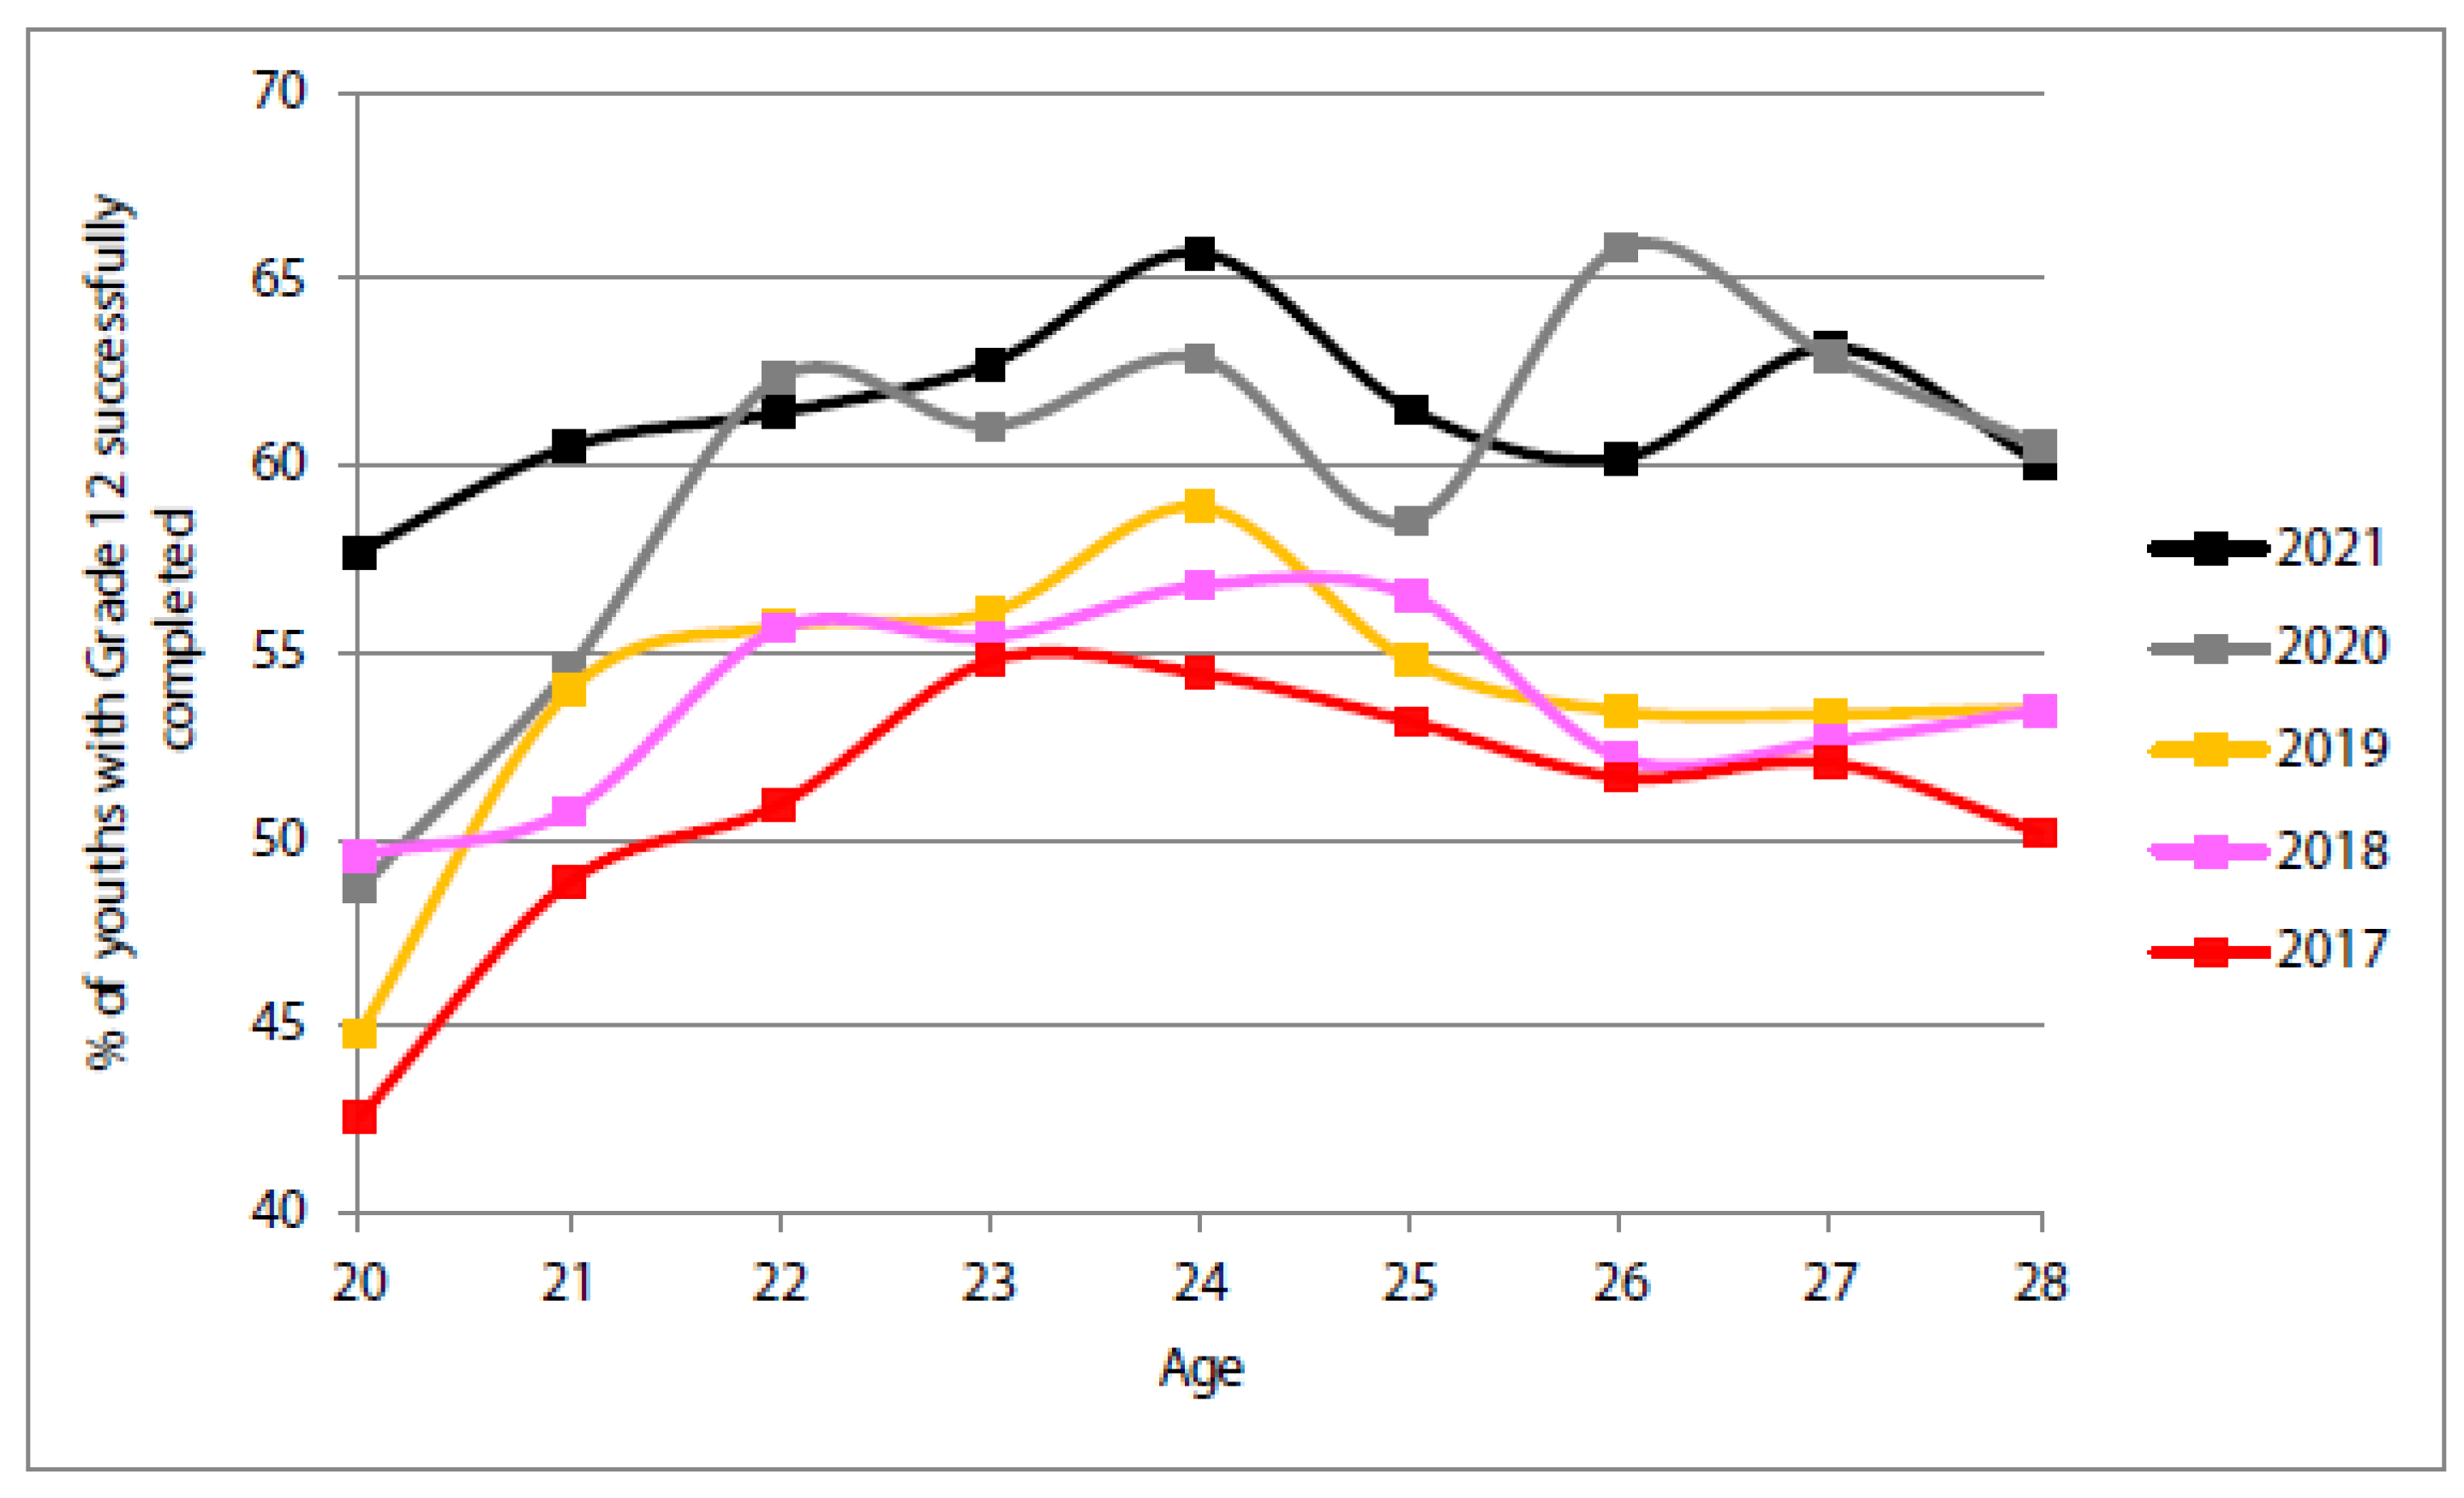
Figure 5 presents the Enrolment Survival Rate (ESR) (Grades 12) expressed in terms of the percentage of youth successfully completing Grade 12. Current survival, measured by an NSC pass 2022 report, reflects a ‘survival rate’ (in South Africa the term ‘throughput rate’ is frequently used) of 62%. Based on Stats SA household data, the survival rate was confirmed via a cohort analysis using DBE EMIS n.d. data.
Stats SA data collected from households confirm the rise in the number of youths obtaining the NSC. Specifically, the percentage of youths successfully completing grade 12 has increased from about 45 percent in 2005 to over 55 percent in 2018 (very similar statistics are obtained from the National Income Dynamics study data of the Department of Planning, Monitoring, and Evaluation (
Levin 2020)).
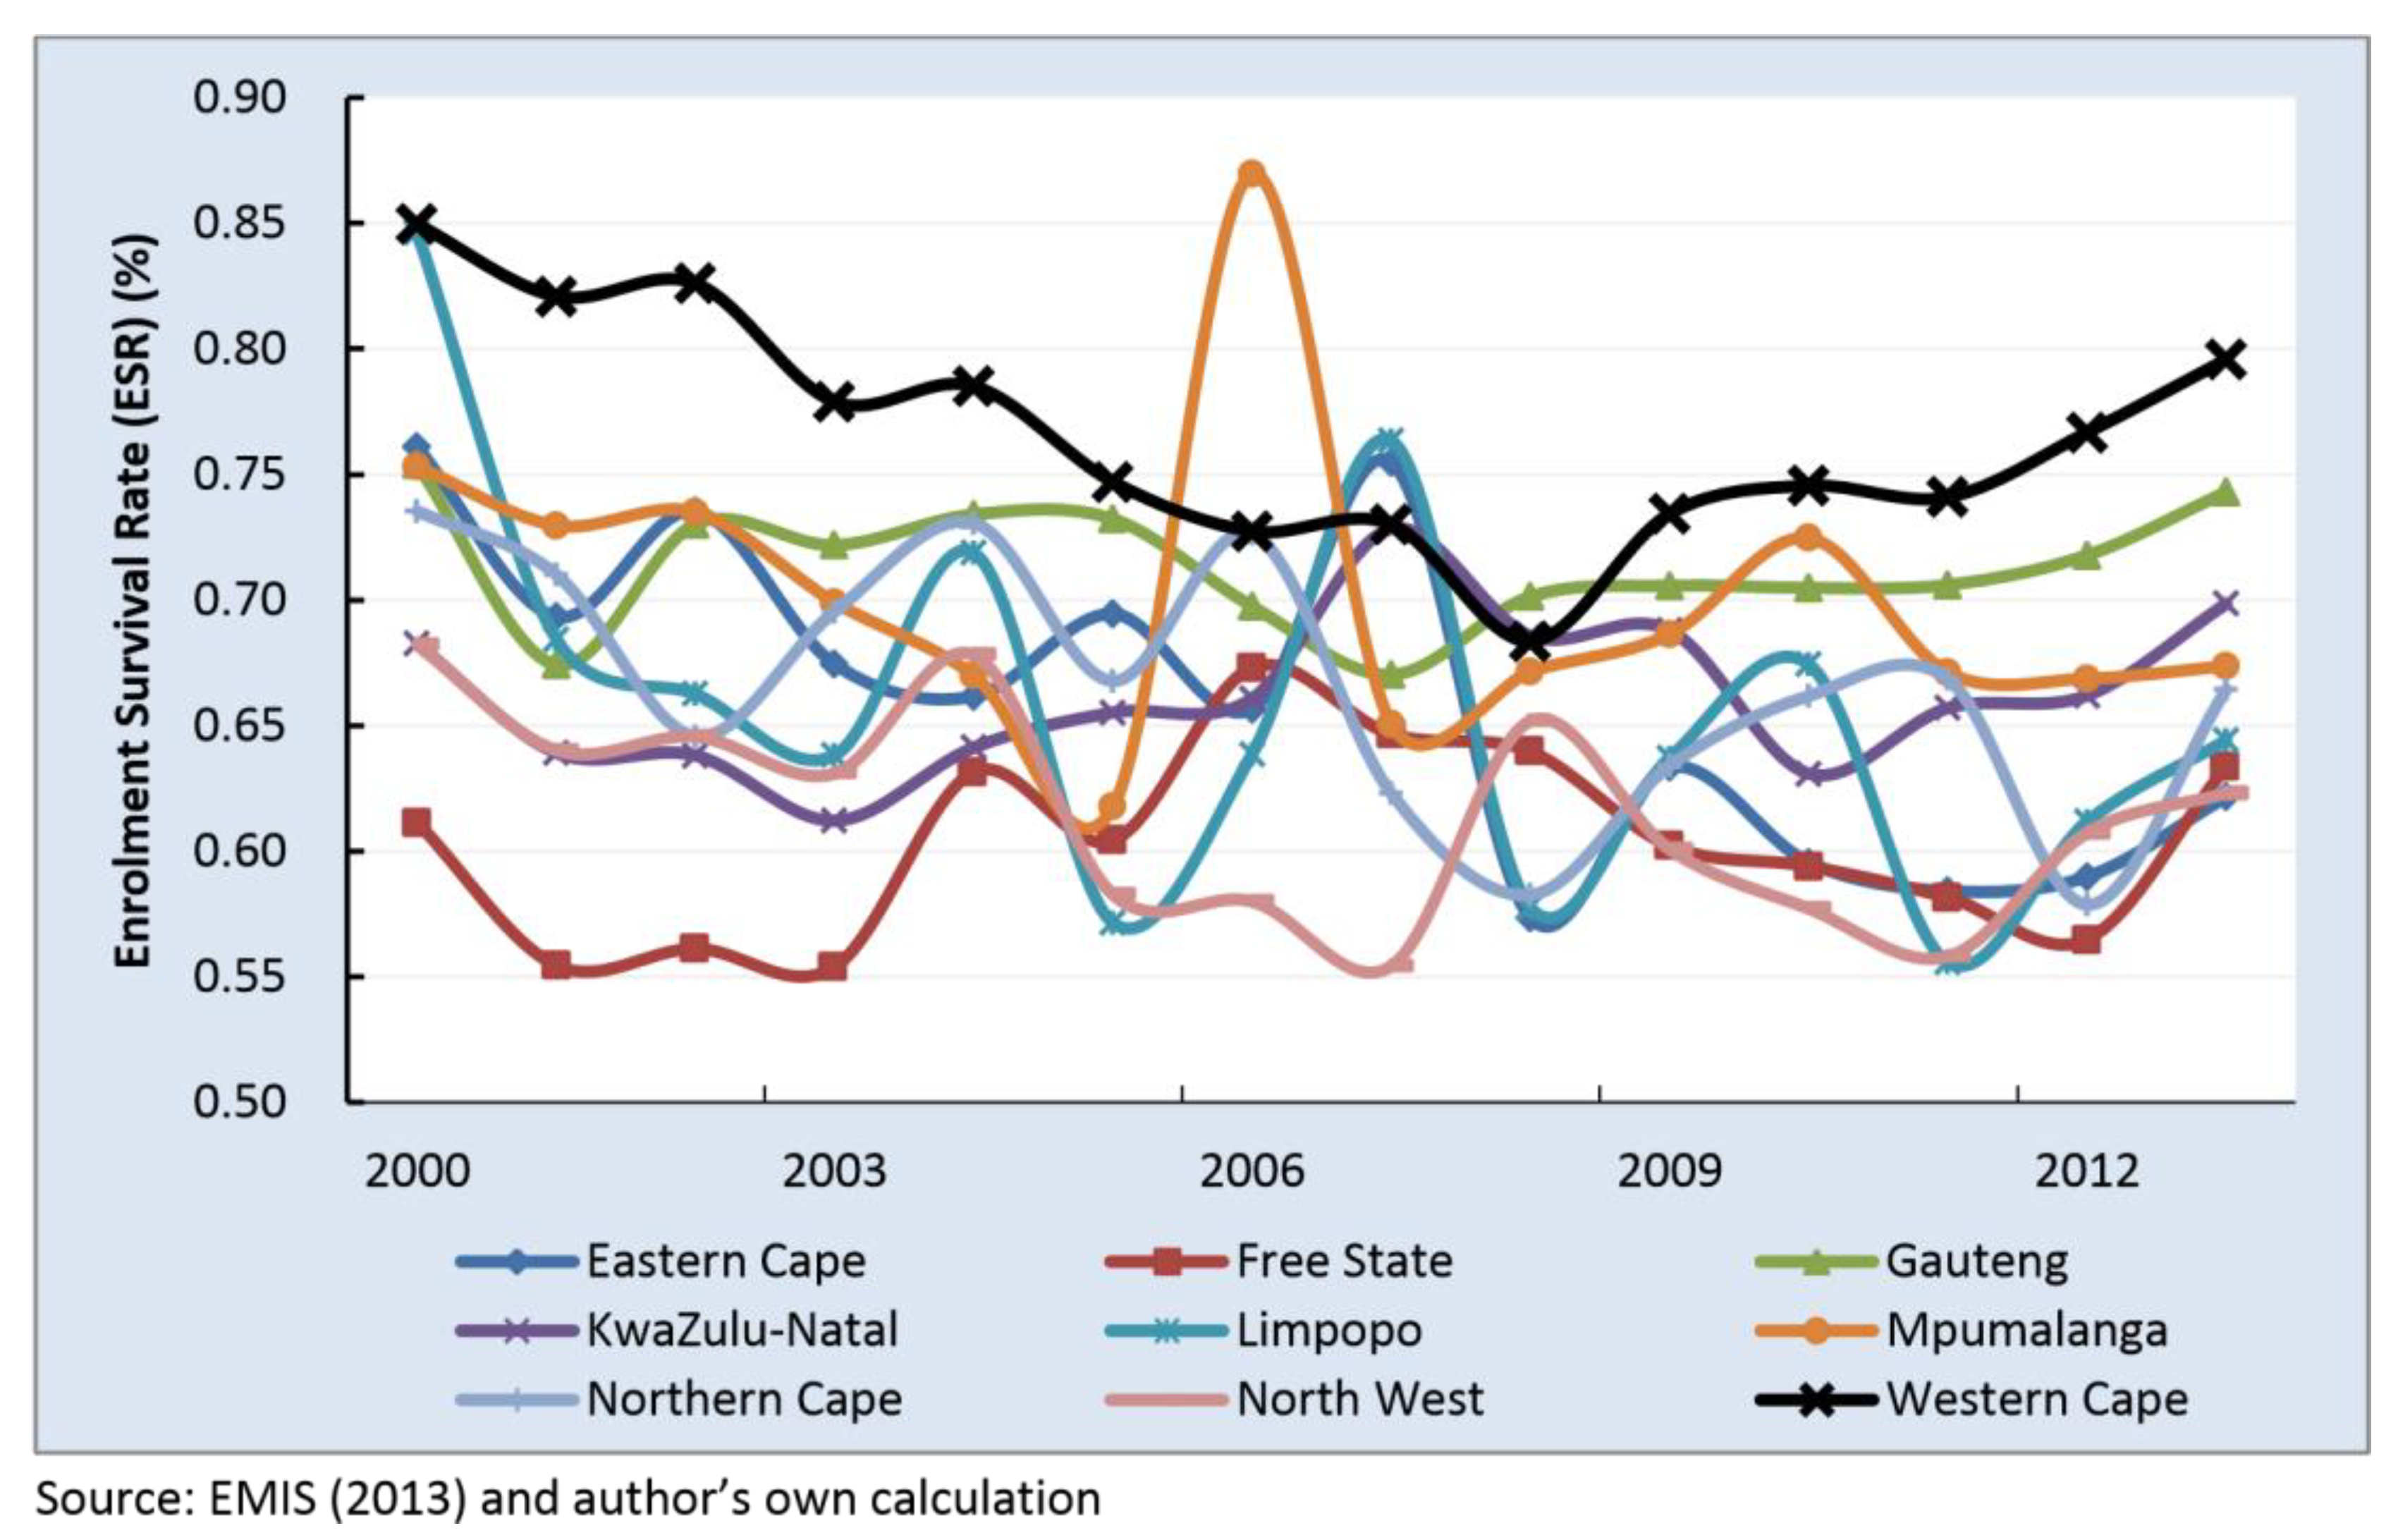
Figure 6 above presents the Enrolment Survival Rate (ESR) (Grades 11 to 12) of the provinces from 1999 to 2013 in South Africa. Clearly, since 2009, Western Cape has, for the most part, maintained the highest ESR compared to other provinces, reaching a survival rate of 80 percent in 2013. More specifically, in 2013, of the 62 260 pupils enrolled in Grade 11, approximately 80 percent are expected to enroll in 2013 as Grade 12 pupils (including potential student migrations and mobility factors of sorts). Before 2009, however, the same survival rate in the province declined considerably from its previous high of above 85 percent to below 70 percent in 2008, mainly due to the brisk increases in the enrolments. In present years, North West, Limpopo, and Free State provinces are among the lowest for Grade 11 to Grade 12 Enrolment Survival Rate, at roughly 63 percent in 2013.
Figure 7 shows the weighted Enrolment Survival Rate, the original PESs and rates for comparison (as in
Figure 4), the proposed new PES rate that incorporated the Enrolment Survival Rate for Grades 11–12, the original enrolment share, as well as the school-age population share on equal shares for Western Cape. According to the data, the weighted ESR increased dramatically between 2000 and 2003 and deteriorated in the following four years. Since 2008, however, the weighted rate has been increasing, albeit with some degrees of cyclicality.
Using this method of calculating the PES shares for the division of the unconditional grant as equitable shares to individual provinces suggests that Western Cape would have gained a higher share between the periods of 1999 and 2004. However, the brisk increase in enrolment population in the provinces, coupled with the increases in enrolment of other provinces, suggest that the PES with the ESR would have decreased to below 8 percent between 2004 and 2007. The current share for the proposed PES is roughly in line with the current PES outcome. It is worth emphasizing again that this is only a demonstration of incorporating an incentive variable. Further research is needed to explore other similar rates in the PES calculation.
Other measures that could also be explored and considered in the PES formula are listed below and discussed briefly:
Student migration between provinces creates major financial and planning uncertainties for the budget constraint of the PES and should be considered in the division of state revenue’s calculus. To ameliorate this risk, administrative data on student’s study history and location must be available and consolidated into a panel to reflect their movements. Using this powerful migration panel data, one can ascertain the required share of the equitable share that the province is entitled to with increased reliability and accuracy.
The importance of mathematics and science as school subjects hardly requires more emphasis. Widely published statistics and documents in the literature suggest clear patterns of the associative relationship between low earning potentials and employment probabilities, and lack of achievement in science and mathematics as school subjects. These patterns are becoming increasingly worrying as the economic base shifts toward favoring technology and cognitive abilities. It is therefore imperative to build in an incentive in the formula whereby provinces that allocated a higher share of its ES on maths and science subjects should gain a higher share in the allocation. It is important to note that it should not be the maths and science outcomes of the students to be used as variables in the PES formula, but rather through supply allocation. This is to avoid being discriminatory towards provinces that may have poor initial conditions of maths and science outcomes, which would violate the noble pursuit of the PES formula being inclusive.
The third potential variable is the administrative enrolment school-age data. These data will diversify away the shortfalls in the definition of the current total enrolment variable, as well as the infrequent updates of the school-age population in the census. By using more timeous and detailed administrative data on the school attendant’s age distribution, the data will be able to address the infrequent availability and accuracy of the current, surveyed variables of enrolment and school-age population.
7. Conclusions
The paper sets out to evaluate and analyze the current education component of the PES formula to divide the national raised revenue across provinces. This was achieved by investigating the many changes in the formula since its implementation, as well as providing a thorough mathematical enquiry into the functional form of the PES formula. Furthermore, the paper investigated the possibility of incorporating additional variables to the equation, by using the Enrolment Survival Rate (ESR). The next phase of the research should involve statistical simulations on the national administrative database of all enrolments to identify appropriate incentive variables to be included in the PES formula. A major milestone for this endeavour is to initiate a dialogue between both provincial and national departments and buy-ins to collect and compile detailed administrative unit records on all school attendants in the country.
Further research and data are required to assess the outcomes of incorporating these suggested stock and flow variables to increase the incentives of quality in the education component of the PES while remaining inclusive in the process, and introduce some kind of comparison with other national models of central distribution (f.i. federal or regional states).


