Article

Evaluating the Liquidity Response of South African Exchange-Traded Funds to Country Risk Effects

School of Accounting, Economics and Finance, University of KwaZulu-Natal, Durban 4000, South Africa
Economies 2022, 10(6), 130; https://doi.org/10.3390/economies10060130
Submission received: 29 March 2022 / Revised: 13 May 2022 / Accepted: 13 May 2022 / Published: 2 June 2022
(This article belongs to the Special Issue Nexus between Politics and Economics in the Emerging Countries)

Abstract

:
Liquidity is important for the stability of financial markets and the growth of national economies. However, the liquidity of financial markets may be influenced by country risk shocks through informational asymmetry, funding constraints, and portfolio rebalancing activities. Therefore, the objective of this study is to investigate the effects of disaggregated country risk components on the liquidity of the South African Exchange-Traded Fund (ETF) market. The sample employed segregates South African ETFs based on their benchmarking styles—particularly, ETFs with domestic benchmarks and ETFs with international benchmarks. The results from the panel Autoregressive Distributed Lag (ARDL) model suggest that the liquidity of ETFs tracking domestic benchmarks is influenced positively by all country risk components in the long run, although only political and financial risks positively influence its short-run liquidity. Similarly, political and economic risk shocks positively influence the liquidity of ETFs tracking international benchmarks in the long-run; however, financial risk negatively influences its liquidity in both the long and short run. These findings suggest that investors can improve the overall performance and liquidity of their portfolios by taking into account the stability of political, financial, and economic risks.

1. Introduction

Liquidity, by virtue of its nature, is important for the stability of financial markets. In financial markets, liquidity1 relates to how quickly and easily investors can buy or sell securities without creating significant changes in their price (Huberman and Halka 2001). This being so, a financial market is regarded as highly liquid when investors can easily and quickly execute transactions whilst having a minimal effect on security prices. As such, increased liquidity promotes market stability, because large transactions do not create significant price deviations in a market that is liquid (O’Hara 2004). Furthermore, more liquid markets tend to exhibit greater market efficiency, because return predictability is less pronounced due to a higher presence of arbitrageurs (Chordia et al. 2008). For investors, liquidity provides several benefits, including the ability to respond to changes in risk aversion, undertake marking timing strategies, reconfigure existing portfolios to take advantage of new opportunities, and meet capital calls (Kinlaw et al. 2013). As such, investors require higher compensation for holding illiquid assets (Ma et al. 2020). Whilst there are various sources of liquidity, an increase in risk and uncertainty is one of the main sources of a liquidity dry-up.
Country risk relates to the economic and financial abilities and political willingness of a country to fulfil its obligations toward foreign lenders and/or investors (Lee and Lee 2018). Assessments of country risk are issued by rating agencies and are segregated into three components—political risk, economic risk, and financial risk. Accordingly, country risk assessments reflect important fundamentals about a country’s political, economic, and financial stability from a forward-looking perspective, which local and foreign investors consider when making investment decisions. As a result, ratings of country risk are important for countries seeking foreign investment, as well as for multi-national enterprises and international financial institutions making lending and investment decisions (Hoti 2005). Country risk and its components can, therefore, influence the level of trading in markets for various asset classes, including the market for Exchange-Traded Funds (ETFs).
An exchange-traded fund (ETF) is a pooled investment fund in which the underlying securities are selected to replicate the risk and return characteristics of a specific benchmark or index (Kunjal et al. 2021). ETFs offer several advantages over alternative asset classes and, therefore, their popularity continues to soar globally and in South Africa. it is noteworthy that investors’ preference for trade flexibility leads to them enjoying the high levels of ETF liquidity. However, Smales and Lucey (2019) find that higher levels of aggregate country risk are associated with lower levels of liquidity in ETFs tracking gold and silver indices on the New York Stock Exchange (NYSE). There is also evidence that political, economic, and financial factors could influence ETF markets. For instance, Rompotis (2017) finds that terrorism impacts the returns and volatility of Islamic ETFs trading on the London Stock Exchange. Sakarya and Ekinci (2020) find that flows to Turkish ETFs are significantly influenced by exchange rate volatility. In addition, Lee and Chen (2021) find that economic policy uncertainty negatively influences the returns of country ETFs trading in the United States (US). However, research into the effects of political, economic, and financial risks on the liquidity of ETF markets remains scanty, especially in emerging markets. Therefore, the objective of this study is to investigate the effects of country risk components (that is, political, economic, and financial risks) on the liquidity of the South African ETF market.
The motivation for exploring the effects of country risk components on ETF liquidity stems from the high levels of liquidity, that is, present in ETF markets. One of the main benefits of ETFs is that they offer intraday liquidity, and, thus, liquidity levels in ETF markets are relatively high (Pham et al. 2021b). Furthermore, ETFs tend to exhibit greater liquidity than their underlying securities, because security-specific information asymmetry is reduced in a pooled fund (Subrahmanyam 1991), subsequently resulting in lower adverse selection costs, which drives liquidity traders towards ETFs (Pham et al. 2021b). According to Ben-David et al. (2018), ETFs accounted for approximately 35 percent of the trading volume in US equity markets in 2018, thus making these funds one of the most traded asset classes in the US. ETFs also make up a large portion of the trading activity in South Africa, with an average daily volume of approximately R600 million (IOL 2020). However, liquidity levels in ETF markets could be significantly impacted by risks and uncertainties.
For instance, the unstable political, economic, and financial conditions in South Africa arising from the high levels of corruption and civil unrest, weak economic growth, lack of structural reforms, and poor financial development among other issues (Vengesai and Muzindutsi 2020) could significantly impact the liquidity of the South African ETF market. On one hand, an increase in political, economic, or financial risk could lead to an increase in the liquidity of South African ETFs if investors regard ETFs as safe havens due to their diversification benefits, thereby, causing an increase in ETF trading activities, and liquidity during heightened risk. On the other hand, an increase in political, economic, or financial risk could lead to a decrease in the liquidity of South African ETFs if investors exhibit uncertainty aversion. Investors who are averse to uncertainty prefer to “play it safe” during heightened uncertainty and, therefore, may opt to exit the market and stop trading completely, resulting in a decrease in liquidity (O’Hara 2004). Although Smales and Lucey (2019) explore the effects of country risk on ETF liquidity, this is completed at an aggregate level. The effects of individual country risk components have not been established for ETF markets, thus necessitating the need to explore the effects of disaggregated country risk on the liquidity of the South African ETF market.
To the knowledge of the author, this is the first study to explore the effects of disaggregated country risk components on market liquidity. Accordingly, this study is a major contribution to the existing literature for the following reasons. Firstly, this study provides insight into the effects of disaggregated country risk components on the liquidity of financial markets. While Al Mustofa et al. (2020) assess the effects of country risk components on the trading volume of Indonesian stocks, trading volume does not adequately measure liquidity, because it captures neither the investors’ ability to trade immediately, nor the costs associated with trading immediately (Aitken and Comerton-Forde 2003). Instead, this study employs two popular measures of liquidity which capture the essence of liquidity—the Amihud (2002) illiquidity ratio and the Corwin and Schultz (2012) high–low spread estimator. Marshall et al. (2018) found that the high–low and Amihud measures do a good job of capturing ETF liquidity. Furthermore, by employing a disaggregated approach, this study sheds light on which components significantly impact the liquidity of ETF markets. Knowledge of the individual effects of country risk components can then be used to increase the chances of success when engaging in hedging activities.
Secondly, this study sheds light on the sources of ETF liquidity or the lack thereof. Pham et al. (2021b) mention that, despite the rising popularity of ETFs, little is known about their liquidity. Therefore, by contributing to the existing literature on ETF liquidity, this study assists investors in understanding the sources of ETF liquidity, which could increase their confidence in ETF markets, subsequently ensuring that profitable investment decisions are made (Chordia et al. 2001). In addition, studies by Ben-David et al. (2018) and Pham et al. (2021a) found that liquidity shocks in ETF markets can be transmitted to underlying securities through arbitrage mechanisms, thus creating non-fundamental volatility in the underlying securities. This study aims to assess the impact of country risk shocks on the liquidity of South African ETFs, which track various asset classes. The results of this study, therefore, provide an insight into whether country risk shocks could contribute to liquidity shocks which, as a consequence, could lead to instabilities in both ETF markets as well as the markets of underlying securities. An understanding of the relationship between country risk components and liquidity could assist regulators and policymakers in formulating appropriate policies which reduce unnecessary political, economic, and financial risks in order to ensure that there is an adequate amount of liquidity in ETF markets and subsequently fostering efficiency and stability in financial markets.
From a methodological perspective, another contribution of this study is that an improved empirical model which facilitates the estimation of both the short- and long-run dynamics between variables in the system, regardless of whether the variables are stationary at levels, integrated at order one, or mutually cointegrated, is used. This model, therefore, provides insight into whether or not investors react uniformly to shocks in political, economic, and financial risks in the short and long run. Given that market liquidity has implications for the cost of capital, asset pricing, hedging and risk management, and the efficient allocation of capital (Debata and Mahakud 2018), this study has important implications for several decision makers, including investors, investment management companies, fund managers, policymakers, and regulators.
The rest of this paper is structured as follows. Section 2 provides a review of existing theories and empirical research underlying this study. Section 3 discusses the data, and Section 4 outlines the methodology employed. Section 5 presents and discusses the results. Section 6 concludes the study.

2. Literature Review

2.1. Conceptualization of Liquidity

Kyle (1985) notes that liquidity is an elusive concept, because it constitutes of multiple dimensions including ‘depth’, which relates to the ability to liquidate large positions without causing significant changes in prices, ‘tightness’, which relates to the ability to liquidate positions over a short period of time, and ‘resilience’, which relates to the ability of a security’s price to recover quickly from uninformed, random market shocks. The liquidity of ETFs may differ from the liquidity of other securities for several reasons (Marshall et al. 2018). Firstly, Subrahmanyam (1991) notes that basket securities, such as ETFs, have lower adverse selection costs, resulting in lower trading costs, which, subsequently, drives liquidity and reduces trading costs further. Secondly, ETFs tend to attract more demand from active traders, which accentuates the liquidity of these assets (Marshall et al. 2018). Thirdly, in the Dynamic Equilibrium Model of ETFs proposed by Malamud (2016), the market structure for ETFs has two tiers—a stock exchange (representing the secondary market) and a creation/redemption mechanism (representing the primary market), which is operated by authorized participants. Malamud (2016) proposes that the existence of these two tiers increases ETF liquidity, because the primary market serves as an extra source of liquidity for authorized participants. Therefore, increases in the liquidity of the primary market (due to a decrease in the costs charged by ETF sponsors to authorized participants) lead to an increase in the liquidity of the secondary market.
Theoretically, there exist several channels through which political, economic, and financial risks and uncertainties could impact liquidity. The first channel results from asymmetries of information between market participants. An increase in political, economic, and financial uncertainty increases uncertainty about investment prospects, causing investors to intensify their collection of private information (Nagar et al. 2019). As a result, information asymmetry between market participants is worsened, which fosters an increase in transactions costs and thus lower market liquidity (Bartov and Bodnar 1996). On the contrary, there is a possibility that changes in country risk ratings disseminates new information about a particular country, subsequently reducing information asymmetries and increasing liquidity (Lee et al. 2016). The second channel is through funding constraints. Specifically, increases in political, economic, and financial uncertainty exacerbate the volatility of asset prices, which exposes lending institutions to higher credit risk (Lee et al. 2016). As a result, lending institutions raise their collateral requirements, which constrains investors’ capital. These capital constraints cause investors to reduce their positions, thus leading to a reduction in market liquidity (Brunnermeier and Pedersen 2009). The third channel is through portfolio rebalancing activities. A change in country risk ratings may induce portfolio rebalancing activities across borders or asset classes which influence the level of international capital that flows to a country (Kim and Wu 2008). Increased country risk may cause investors to withdraw their investments in a particular asset class or country, resulting in reduced capital inflows and market liquidity; however, decreases in country risk may promote capital inflows, subsequently increasing market liquidity (Kim and Wu 2008; Lee et al. 2013).
Furthermore, country risk impacts the cost of capital, such that an increase in country risk tends to increase the cost of capital (Harvey 2004; Belkhir et al. 2017), subsequently making investments more costly. This increase in borrowing costs decreases trading activity by dissuading traders from taking on positions. As a result, this reduction in trading activity decreases the liquidity of financial markets (Demsetz 1968; Kyle 1985). Additionally, uncertainties about political, economic, and financial conditions could influence investor sentiment in financial markets (Debata and Mahakud 2018). This influence on investor sentiment could impact market liquidity directly, through noise traders or irrational market makers, and/or indirectly, by swaying investors’ confidence in the market (Liu 2015). For instance, political instabilities could lead to a crash in financial markets (Soltani et al. 2017). Therefore, increased political uncertainty causes investors to be pessimistic about the future prospect of their investments, subsequently leading to a reduction in trading activity and liquidity (Debata and Mahakud 2018). Studies by Chiu et al. (2014) and Tseng and Lee (2016) have found that investor sentiment plays a particularly important role in the liquidity of ETFs.

2.2. Review of Empirical Studies

Existing studies of the effects of country risk components on the liquidity of ETF markets are limited; however, inferences can be made from studies related to individual country risk components and the underlying asset markets (equity/bond/commodities). For instance, Huang and Stoll (2001) find that exchange-rate volatility (which is a financial risk factor) exhibits little to no effect on the trading costs and, therefore, the liquidity of stocks in the US. Lesmond (2005) examines the determinants of stock market liquidity in 31 emerging markets using random effects models and reports that higher political risks are associated with higher transactions costs, and thus, lower liquidity. Debata and Mahakud (2018) examine how economic policy uncertainty is related to the liquidity of firms trading in India from 2003 to 2016 by using Vector Autoregressive (VAR) Granger-causality tests, impulse response functions, and variance decomposition analysis. Debata and Mahakud (2018) find that economic policy uncertainty negatively impacts stock market liquidity, such that higher uncertainty regarding the economic policy leads to lower stock market liquidity. Similar findings are reported by Duong et al. (2018) for stocks trading in the US.
With regards to studies that employ country risk ratings, Lee et al. (2013) use panel data regressions to evaluate the influence of country risk on capital inflows in East Asian countries from 2001 to 2007. The results reveal that political and economic risk ratings are positively related to capital inflows of equity and bond markets. Thus, Lee et al. (2013) conclude that lower political and economic risks are associated with higher capital inflows to the East Asian equity and bond markets. Lee et al. (2013) comment that capital providers do not adequately consider the financial risk of the East Asian countries which they invest in. Given that higher capital inflows increase the liquidity of the receiving country’s financial markets (Kim and Yang 2011), country risk may affect a market’s liquidity through its influence on capital flows.
Al Mustofa et al. (2020) analyze the influence of country risk on the trading volume of Indonesia’s stock market. The effect of country risk on trading volume is examined using correlation analysis and multiple regression estimations, and the results reveal that disaggregated country risk factors exhibit a significant influence on the trading volume of Indonesia’s stock market. Specifically, Al Mustofa et al. (2020) report that lower levels of economic and political risks result in lower trading volumes, while lower levels of financial risk lead to higher trading volumes. Whilst trading volume does not adequately capture liquidity, the seminal works of Demsetz (1968), Kyle (1985), and Foster and Viswanathan (1993) suggest that trading volume is related to liquidity. As such, country risk ratings may influence market liquidity through their influence on trading volume; however, this effect remains ambiguous.
In their study of ETF markets, Smales and Lucey (2019) examine the effect of investor sentiment on the liquidity of ETFs tracking gold and silver indices on the NYSE. They utilize panel regression models, with aggregate country risk included as a control variable in the models. Overall, Smales and Lucey (2019) find that aggregate country risk and liquidity are negatively related, such that an increase in aggregate country risk leads to a decrease in the liquidity of the surveyed ETFs. To the authors’ knowledge, there are no studies that explore the effects of country risk components on ETF markets, particularly none using South African data. Therefore, the lack of empirical research on the response of market liquidity to individual country risk components necessitates the need for further research.

3. Data

3.1. Data Sample

The effect of country risk components on the liquidity of the South African ETF market is investigated by dividing all South African ETFs2 into two groups: ETFs tracking domestic benchmarks (representing the market of South African ETFs with domestic benchmarks) and ETFs tracking international benchmarks (representing the market of South African ETFs with international benchmarks). This is completed, because Kunjal and Peerbhai (2021) note that the trading dynamics of ETFs with domestic benchmarks differ from those of ETFs with international benchmarks, due to various reasons, including investors’ confidence levels. Given the difference in trading dynamics, it is plausible to expect differences in their liquidity levels—which may be induced by the differential effects of country risk components.
To avoid the adverse effects of the survivorship bias, ETFs that have been delisted are also included in the sample. However, ETFs included in the sample need to have been listed and traded on the Johannesburg Stock Exchange (JSE) for a minimum of 3 years. This is performed to ensure that each ETF in the panel has at least 36 monthly observations in line with Strydom et al. (2015), who note that 36 monthly observations ensure a large enough dataset to estimate reliable regression parameters. Furthermore, following Amihud (2002) and Liu (2015), only ETFs that are listed at the end of the current month and have trading data for more than 15 days in the current month are included in the sample. Based on the inception dates of the first ETFs in each market, the sample periods for the market of ETFs with domestic benchmarks and the market of ETFs with international benchmarks begin on 1 December 2000 and 10 October 2005, respectively, and end 31 December 2019. Overall, this results in a total sample of 49 ETFs—42 with domestic benchmarks and 7 with international benchmarks3. This study uses secondary ETF data (specifically, daily closing, high, and low prices and trading volumes), which are obtained from the Bloomberg database. Daily ETF data are then used to compute monthly liquidity measures due to the availability of country risk ratings, which are only available in monthly frequencies.

3.2. Liquidity Measures

Following Chung and Zhang (2014), this study employs two popular low-frequency measures of liquidity—Amihud’s (2002) illiquidity measure and Corwin and Schultz’ (2012) high–low spread. Fong et al. (2017) found that, for global research, Corwin and Schultz’ high–low spread is the best monthly percent–cost proxy of liquidity when the closing percent quoted spread is not available, whilst the Amihud’s (2002) illiquidity measure is the best monthly cost-per-dollar-volume proxy of liquidity. Będowska-Sójka (2018) found that, for emerging markets, Amihud’s (2002) illiquidity ratio is the best proxy for liquidity, followed by the high–low spread estimator of Corwin and Schultz (2012). Marshall et al. (2018) also reports that Amihud’s illiquidity ratio and the high–low spread estimator of Corwin and Schultz are good proxies of ETF liquidity. Amihud’s (2002) illiquidity ratio captures the association between price and volume, thereby enabling the evaluation of the change in price for a unit change in volume. The Amihud (2002) illiquidity measure, therefore, captures the depth characteristic of liquidity, because it accounts for the price impact of trades. For each day, Amihud’s illiquidity ratio is computed for each individual ETF as follows:
A m i h u d = | r | V o l u m e
where A m i h u d denotes the daily Amihud’s illiquidity ratio, | r | is the ETF’s absolute daily return, and V o l u m e represents the ETF’s trading volume in ZAR.
The high–low spread measure proposed by Corwin and Schultz (2012) was developed to measure the bid–ask spread of securities using an easy calculation—especially because bid and ask prices are not easily accessible. Corwin and Schultz (2012) argue that daily low prices are most likely due to sell orders, whilst daily high orders are most likely due to buy orders; therefore, the bid–ask spread can be inferred as a function of the high and low prices. As such, Corwin and Schultz’ bid–ask spread estimator using high and low prices captures the tightness characteristic of liquidity, because it relates to the transaction costs (Cannon and Cole 2011) and is computed for each ETF on a daily basis as follows:
S = 2 ( e α 1 ) 1 + e a ,
where S denotes the ETF’s daily high–low spread, and α is computed as follows:
α = 2 β β 3 2 2 γ 3 2 2
β = k = 0 1 [ l n ( H j + k L j + k ) ] 2
γ = [ l n ( H j , j + 1 L j , j + 1 ) ] 2 ,
where H j and L j represent the high and low prices on day j , respectively, and H j , j + 1 and L j , j + 1 denote the high and low prices over two consecutive days ( j and j + 1 ), respectively. Notably, the high–low spread can become negative when the 2-day variance is large (Corwin and Schultz 2012). However, Corwin and Schultz (2012) and Corwin (2014) acknowledge the importance of making an adjustment for negative daily spreads before computing the monthly average of the high–low spreads. Accordingly, negative daily spread values are set to zero before computing monthly averages in line with Corwin and Schultz (2012), who note that this approach produces a more accurate measure of monthly estimates compared with including or deleting negative spread values.
Following Lesmond (2005) and Fong et al. (2017), the monthly high–low spread for each ETF is computed as the average daily spread over all trading days in the month, whilst the monthly Amihud’s illiquidity ratio for each ETF is computed by averaging the daily Amihud’s illiquidity ratio over positive trading volume days only. To provide a common representation across the two liquidity measures, the monthly Amihud’s illiquidity ratio is multiplied by 10 6 as completed by Amihud (2002). Notably, a decrease in the high–low spread is associated with an increase in liquidity, whilst a decrease in Amihud’s illiquidity measure is associated with an increase in liquidity, because low Amihud values suggest that large trading volumes generate a limited price impact (Han and Liang 2017).

3.3. Disaggregated Country Risk Measures

There are three components of country risk: political risk, economic risk, and financial risk (Sari et al. 2013). The political risk rating assesses the stability of a country’s political environment, whilst the economic risk rating assesses a country’s economic strengths and weaknesses, and the financial risk rating assesses a country’s ability to pay back its debt obligations (Mensi et al. 2017). Ratings for South Africa’s country risk components were obtained from the International Country Risk Guide (ICRG), because the ICRG is the only rating agency that provides consistent, monthly country risk ratings which are at a disaggregated level (Sari et al. 2013). The political risk rating varies between 0 to 100 points and is based on 12 factors, whilst the economic and financial risk ratings vary between 0 and 50 points and are based on 5 factors each4. It is noteworthy that, with the ICRG ratings, a higher rating score signifies a lower level of risk.

4. Model Specification

Related studies by Lesmond (2005), Debata and Mahakud (2018), Smales and Lucey (2019), and Al Mustofa et al. (2020) employ methodologies such as VAR and panel data regressions which require the variables to be stationary at levels; therefore, these models are not appropriate for the variables in this study, since they are a combination of variables which are stationary at levels and integrated at order one. Accordingly, the effect of country risk components on the liquidity of the South African ETF market is examined using a panel Autoregressive Distributed Lag (ARDL) approach introduced by Pesaran et al. (1999). The advantage of using the panel ARDL approach is that it captures inherent heterogeneity effects in the coefficient estimates due to cross-sectional differences, while also facilitating the estimation of both the short- and long-run relationships between variables in the system, regardless of whether the variables are stationary at levels, integrated at order one, or mutually cointegrated (Salisu and Isah 2017). Hence, in this study, panel ARDL models are estimated in order to examine the long- and short-run relationships between market liquidity and disaggregated country risk ratings. Notably, there are two popular approaches used to estimate dynamic heterogenous panel data models: the Mean Group (MG) estimator and Pooled Mean Group (PMG) estimator (Salisu and Isah 2017). However, this study uses the PMG estimator, because it has several advantages over the Mean Group estimator, including its ability to account for cross-sectional dependence and allow short-run coefficients to be heterogeneous while long-run coefficients are restricted to being homogeneous (Erdem et al. 2010; Onuoha et al. 2018).
Prior to estimating the panel ARDL models, the stationarity of the variables needs to be examined. However, in order to identify the appropriate panel unit root tests, the data needs to be scrutinized for the presence of cross-sectional dependence. There exist various tests for cross-sectional dependence, the including Breusch and Pagan Lagrange multiplier (LM) (1980), the Pesaran (2004) scaled LM and CD (Cross-sectional Dependence), and the Baltagi et al. (2012) bias-corrected scaled LM tests. To increase the robustness of the results, all of the aforementioned cross-sectional dependence tests are conducted. The general null hypothesis is that there is no cross-sectional dependence. If the null hypothesis is not rejected, the first-generation panel-unit root tests (such as the Hadri (2000), Levin et al. (2002), and Im, Pesaran, and Shin (IPS) (2003) tests) are employed, and if the null hypothesis is rejected, second-generation panel-unit root tests are used. In this study, the second generation panel unit root test employed is Pesaran’s (2007) Cross-sectionally augmented IPS (CIPS) test; however, the truncated version of the CIPS test is used, because it works better when the number of cross-sections is low (such as the sample of ETFs with international benchmarks), since it avoids issues related to extreme outcomes and oversized CIPS statistics in small samples (Pesaran 2007).
Once the order of integration of the variables has been established, the presence of cointegration amongst the variables is examined using the Pedroni (1999, 2004) test. The test provides within-dimension statistics (panel tests) and between-dimension statistics (group tests) (Bidirici and Bohur 2015). Both types of test adopt a null hypothesis of no cointegration against the alternative of cointegration amongst the variables. The presence of cointegration amongst the variables suggests that there is a long run association between the variables in the system, subsequently supporting the estimation of panel ARDL models to evaluate the relationships. Thereafter, the long-run relationships are examined by estimating the following panel ARDL model with a PMG approach:
Δ L L M i , t = α 0 i + z = 1 n β i j Δ L L M i , t z + z = 0 n δ i j Δ L P t z + z = 0 n φ i j Δ L F t z + z = 0 n ϑ i j Δ L E t z + γ 1 i L L M i , t 1 + γ 2 i L P t 1 + γ 3 i L F t 1 + γ 4 i L E t 1 + μ i + ε i , t   ,
where subscript i denotes individual ETFs, subscript t denotes monthly periods of time, and subscript z denotes individual lag lengths. Δ L L M represents the change in the natural logarithm of the market liquidity measure (that is, Amihud’s illiquidity ratio or the high–low spread), and Δ L P , Δ L F , and Δ L E represent the change in the natural logarithm of the political, financial, and economic risk rating scores, respectively. In the panel ARDL model above, β i j , δ i j , φ i j , and ϑ i j represent short-run coefficients, whilst γ 1 i γ 4 i represent long-run coefficients. μ i denotes the cross-sectional fixed effect, whilst α 0 and ε i , t denote the constant and error terms, respectively. The optimal lag lengths for the panel ARDL models are determined using the Akaike Information Criteria (AIC), because it tends to select more lag lengths and, therefore, reveals more features of the data (Lin et al. 2010).
The short-run coefficients are then examined using the error-correction model (ECM) defined below:
Δ L L M i , t = α 0 i + z = 1 n β i j Δ L L M i , t z + z = 0 n δ i j Δ L P t z + z = 0 n φ i j Δ L F t z + z = 0 n ϑ i j Δ L E t z + θ ε i , t 1 + μ i + e i , t   ,
where ε i , t 1 is the error-correction term, θ is the error-correcting speed of adjustment coefficient (which provides insight into how long it takes the system to reach long-run equilibrium after a shock), and e i , t denotes an error term. Notably, the panel ARDL model described above is estimated for both the market of South African ETFs with domestic benchmarks and the market of South African ETFs with international benchmarks.

5. Results and Analysis

5.1. Descriptive Statistics

Table 1 summarizes the descriptive statistics for each variable used in this study. On average, the Amihud ratio for ETFs with domestic benchmarks (0.073) is relatively higher than ETFs with international benchmarks (0.008), thereby suggesting that buying and selling activities exhibit a greater impact on the prices of ETFs with domestic benchmarks. On the contrary, the average high–low spread for ETFs with international benchmarks (0.003) is slightly higher than ETFs with domestic benchmarks (0.002). The higher spread associated with ETFs tracking international benchmarks could be attributed to their higher transaction costs due to different dividend policies, stringent taxation policies, and exchange rate volatility, which contribute to the transaction costs of ETFs with foreign exposures (Steyn 2019). Overall, the average Amihud and high–low spread statistics are not consistent in terms of which category of ETFs exhibit better liquidity on average. However, the maximum statistics indicate that ETFs with domestic benchmarks exhibit the highest Amihud ratio and high–low spread, suggesting that ETFs with domestic benchmarks could be more illiquid during periods of extreme liquidity shocks.
The average monthly political risk, economic risk, and financial risk ratings are 66.341, 34.670, and 38.202, respectively and suggest that, based on ICRG’s methodology as outlined by Howell (2011), South Africa’s political and economic risks were moderate, whilst its financial risk was low from November 2000 to December 2019. Furthermore, the standard deviation associated with each rating suggests that the ratings did not deviate much during the sample period.

5.2. Cross-Dependence and Unit Root Testing

Given that this study uses the natural logarithm of the variables in the panel ARDL model, the tests for cross-dependence and unit roots are conducted using the natural logarithms of the variables. The results are presented in Table 2 and Table 3. The null hypothesis of no cross-sectional dependence is rejected for all variables in all tests at a 1 percent level of significance. This implies that the variables exhibit cross-sectional dependence. This finding is expected, because cross-sectional dependence arises from common shocks (Munir et al. 2020), and ETFs are influenced by common shocks, such as exchange rate volatilities, international financial crises, and even policies governing ETFs among other shocks. The presence of cross-sectional dependence supports the use of the PMG estimator, which is able to account for cross dependence.
Due to the presence of cross-dependence in the variables, the second-generation panel-unit root tests, which accommodate cross-sectional dependence, are employed to assess the order of integration of the variables. The results of the CIPS unit root tests are presented in Table 3. With the exception of the political and economic risk ratings, the null hypothesis of a unit root is rejected at levels for the remaining variables at a 1 percent level of significance. However, the null hypothesis is rejected for political risk and economic risk ratings at first difference. This implies that the natural logarithms of the Amihud ratio, high–low spread, and financial risk rating are stationary at levels (that is, I(0)) whilst the natural logarithm of the political and economic risk ratings are integrated at order one (that is, I(1)).

5.3. Analysis of Long-Run Relationships

The results of the Pedroni (1999, 2004) test for cointegration are presented in Table 4. With the exception of the v-Statistic for ETFs with international benchmarks, the results of all tests (both within- and between-dimension) reject the null hypothesis of no cointegration amongst the variables at a 1 percent level of significance. Overall, the statistics of the Pedroni test suggest that there is a long-run cointegrating relationship between both liquidity measures and country risk components in both markets. This presence of long-run cointegration further supports the use of the ARDL approach, and also provides strong evidence that the long-run estimates are common across all ETFs in the respective panel—further supporting the use of the PMG approach (da Silva et al. 2018).
Given the presence of long-run cointegration amongst the variables in Equation (6), it is important to estimate the long-run coefficients in order to understand the direction of the relationships. As illustrated in Appendix A, the ARDL (3,1,1,1) model minimizes the AIC of the model estimated for ETFs with domestic benchmarks when the Amihud ratio is used, and the ARDL (4,1,1,1) model minimizes the AIC when the high–low spread is used. The ARDL (4,1,1,1) model is also selected as the optimal model for ETFs with international benchmarks, regardless of the liquidity measure. Based on the optimal panel ARDL models, Table 5 presents the long-run results from the panel ARDL models estimated using the PMG estimator.
When interpreting the results in Table 5, it is important to note that an increase in the risk rating signifies a decrease in the respective risk, and an increase in the Amihud ratio or high–low spread signifies a decrease in liquidity. The results in Table 5 suggest that, for ETFs with domestic benchmarks, the political, economic, and financial risk ratings are positively related to the Amihud ratio and the high–low spread, except for the negative effect of the political risk rating on the high–low spread. However, the political risk exhibits a greater effect (as measured by the magnitude of the coefficients) on the Amihud ratio relative to the high–low spread. Therefore, these findings imply that, in the long run, decreases (increases) in political, economic, and financial risks decrease (increase) the liquidity of these ETFs by generating higher (lower) price impacts and higher (lower) transactions costs.
For ETFs with international benchmarks, the political risk ratings exhibit a positive effect on the Amihud ratio but a negative effect on the high–low spread, whilst the opposite is found for the economic risk rating. However, the magnitude of the positive coefficients outweighs the negative coefficients, thereby suggesting that the overall effects of the political and economic risks ratings are positive. This implies that, in the long run, decreases (increases) in political and economic risks decrease (increase) the liquidity of ETFs with international benchmarks. On the contrary, the liquidity of these ETFs displays a negative association with the financial risk rating, a implying that an increase (decrease) in financial risk decreases (increase) their liquidity.
These long-run results provide three key empirical findings. Firstly, the signs of the effects of country risk components on the Amihud ratio and the high–low spread may differ. This difference may be attributed to their relationship with trading volume. Specifically, when the Amihud ratio increases (and depth decreases), it implies a greater price impact over a lower volume, which is usually accompanied by increased spreads (Krinsky and Lee 1996). However, the differential effects may be because a lower volume is accompanied by decreased spreads, and this finding is consistent with Lee et al. (1993), who found that there is a positive relationship between volume and spreads. According to Lee et al. (1993), this positive association is because liquidity providers determine the initial spread based on the forecasted probability of informed traders, and they use trading volume as a signal of informational events; hence, the spread widens after high trading volumes and narrows when the trading volume is low.
The second key empirical finding is that, in the long-run, country risk components are positively related to the liquidity of ETFs, except for the negative effect of financial risk on ETFs with international benchmarks. Theoretically, the positive association between country risk components and ETF liquidity could be attributed to portfolio rebalancing activities. Specifically, when country risk increases, investors may perceive ETFs as safe havens due to their diversification benefits, and, as a result, there is an increase in ETF trading and liquidity. However, when the country risk decreases, investors may become optimistic about the future prospects of alternative asset classes such as stocks, and, as a result, risk-averse investors may shift away from ETFs (which were initially considered less risky) towards securities that were initially considered risky but now offer better risk–return rewards. This shift towards these riskier securities may be fostered by lower funding constraints and reduced information asymmetry as a result of the decrease in country risk. Consequently, the shift towards riskier securities and alternative asset classes may reduce the buying and selling activities that take place in ETF markets, subsequently resulting in lower ETF liquidity whilst the liquidity of other asset classes is improved.
The negative effect of financial risk on ETFs with international benchmarks may be attributed to investor sentiment about the financial prospects of these investments. Specifically, increased financial risk may cause investors to be pessimistic about the financial prospects of their investments in these ETFs and, as a result, investors may reduce their trading activities, leading to a decrease in liquidity (Debata and Mahakud 2018). This contrasting effect of financial risks relative to other risk factors could be attributed to information inefficiencies and herding effects, which hamper the processing of new information about country risk shocks (Ben Nasr et al. 2018). Nevertheless, the negative effect of financial risk on the liquidity of ETFs with international benchmarks coincides with the findings of Smales and Lucey (2019), who report that higher levels of aggregate country risk are associated with lower levels of ETF liquidity. Furthermore, the findings for ETFs with international benchmarks are also in line with the findings of Al Mustofa et al. (2020), who report that lower levels of political and economic risk are associated with lower trading volumes (which may be translated into lower liquidity), whilst lower levels of financial risk are associated with higher trading volumes.
The third key empirical finding is that country risk components exhibit a greater impact on the liquidity of ETFs with international benchmarks, except for the higher impact of economic risk on the Amihud ratio of ETFs with domestic benchmarks. This finding may be because portfolio rebalancing activities cause investors to drift more or less towards ETFs with international exposures based on their sentiments and expectations of investment prospects, subsequently having a greater influence on the liquidity of these ETFs. For investors, this finding implies that ETFs with domestic benchmarks can be used to reduce their long-term exposure to liquidity shocks caused by changes in the political and financial risks. Furthermore, it implies that investors may find it more difficult to liquidate their positions in ETFs with international benchmarks when political risk decreases and financial risk increases. The higher impact of country risk components on the liquidity of ETFs with international benchmarks relative to ETFs with domestic benchmarks is similar to the findings of Kunjal et al. (2022), who report that country risk components have a greater impact on the volatility of South African ETFs with international benchmarks than ETFs with domestic benchmarks.

5.4. Analysis of Short-Run Relationships

Table 6 presents the results of the short-run error-correction models obtained from the panel ARDL models estimated using the PMG estimator. The error correction term in each model is negative and statistically significant and varies between −0.355 and −0.444 for ETFs with domestic benchmarks, suggesting that the liquidity of these ETFs moves from short-run disequilibrium to long-run equilibrium at a speed of 35.5 to 44.4 percent per month (depending on the measure of liquidity used). For ETFs with international benchmarks, the error correction term varies from −0.069 to −0.386, indicating that approximately 6.9 to 38.6 percent of the deviations from equilibrium are eliminated each month.
With regards to the effects of country risk components on ETF liquidity, political risk only exhibits significant short-run implications for the high–low spread of ETFs tracking domestic benchmarks. Specifically, in the short run, a decrease (increase) in political risk leads to an increase (decrease) in the high–low spread and, thus, a decrease (increase) in the liquidity of ETFs with domestic benchmarks. A similar effect of political risk is reported for the long run in Section 5.3, when the overall magnitudes5 are considered. Notably, political risk exhibits no short-run effects on the liquidity of ETFs with international benchmarks. Furthermore, economic risk exhibits no significant short-run effects on the liquidity of both ETFs. On the contrary, Debata and Mahakud (2018) report that economic policy uncertainty negatively and significantly impacts the liquidity of stock markets. Overall, the findings of this study suggest that ETFs tracking domestic benchmarks can be used to mitigate an investor’s short-term exposure to the adverse effects of liquidity shocks caused by economic risk, whilst ETFs tracking international benchmarks can be used to minimize exposure to the adverse effects of liquidity shocks caused by political and economic risks.
Financial risk exhibits significant short-run implications for the liquidity of both ETF categories. Specifically, a significant, negative relationship exists between the financial risk rating and the Amihud ratio. This implies that a decrease in financial risk is associated with an increase in ETF liquidity (as measured by the Amihud ratio) in the short run. However, the significant effect of financial risk on the high–low spread of ETFs with domestic benchmarks also needs to be considered, and, since the magnitude of the effect of financial risk is higher for the high–low spread, the significant, positive relationship between financial risk ratings and the high–low spread implies that a decrease in financial risk ultimately leads to a decrease in the liquidity of ETFs tracking domestic benchmarks. It is noteworthy that this finding does not coincide with the findings of Huang and Stoll (2001), who report that trading costs are not significantly influenced by exchange rate volatility (a component of financial risk).
In summary, the short-run results suggest that political and financial risks are significantly and positively related to the liquidity of ETFs with domestic benchmarks. This positive relationship is also present in the long run and may be attributed to portfolio rebalancing activities and the increased (reduced) attractiveness of ETFs when country risk increases (decreases), as discussed in Section 5.3. Notably, the liquidity ETFs with international benchmarks are only influenced by financial risk—in which case, the relationship is negative. This negative effect of financial risk on the liquidity of ETFs tracking international benchmarks is also present in the long run and may be a result of investor sentiment, as discussed in Section 5.3.
It is noteworthy that, whilst country risk components exhibit a greater impact on the liquidity of ETFs with international benchmarks in the long run, country risk components exhibit a greater impact on the liquidity of ETFs with domestic benchmarks in the short run. This delayed response by ETFs with international benchmarks may be because it is more costly and time consuming to obtain information about the foreign constitutes in these ETFs; therefore, investors would require more time to acquire and process information before trading in these ETFs.

6. Conclusions

The objective of this study was to investigate the effects of disaggregated country risk components on the liquidity of the South African ETF market by analyzing JSE-listed ETFs tracking domestic and international benchmarks. The results of this study suggest that country risk components have significant effects on the liquidity of both ETFs with domestic benchmarks and ETFs with international benchmarks in the long and short run. While the liquidity of ETFs tracking domestic benchmarks is influenced positively by all country risk components in the long run, only political and financial risks positively influence its short-run liquidity. Likewise, political and economic risk shocks positively influence the liquidity of ETFs tracking international benchmarks in the long run; however, financial risk negatively influences its liquidity in both the long and short run.
These findings suggest that, despite the soaring popularity of ETFs due to their high liquidity levels, ETF liquidity may be adversely affected by country risk shocks. Hence, these results have important implications for various stakeholders. These findings imply that investors can improve their forecast of ETF liquidity by considering country risk components, because these factors are significant determinants of ETF liquidity in both the long and short run. Specifically, in the long run, country risk components are positively related to the liquidity of ETFs, except for the negative effect of financial risk on ETFs with international benchmarks. However, in the short run, only the political and financial risks are positively related to the liquidity of ETFs with domestic benchmarks, whilst the liquidity of ETFs with international benchmarks is negatively impacted by financial risk. This being so, investors can improve the overall performance and liquidity of their portfolios by taking into account the stability of political, financial, and economic risks, as well as other determinants of ETF liquidity. Furthermore, investors can use ETFs with different benchmarks styles to reduce their exposure to liquidity shocks caused by changes in political, economic, and financial risks, because these risks have differential effects on ETFs with domestic and international benchmarks. Specifically, ETFs with domestic benchmarks can be included in an investor’s portfolio in order to reduce its long-term exposure to liquidity shocks caused by fluctuations in political and financial risks. However, in the short-run, ETFs with domestic benchmarks only mitigate exposure to liquidity shocks created by economic risk changes, whilst ETFs with international benchmarks mitigate exposure to liquidity shocks generated by political and economic risk fluctuations. These findings highlight the importance of having a diversified portfolio, especially with regard to the benchmarking styles of the ETFs.
For academics, these results show that country risk components are significant sources of market liquidity and, therefore, should be considered when developing asset-pricing models to price liquidity and liquidity risk, which influences the returns that investors require to invest in a particular security. Specifically, these results suggest that economic, financial, and political risks should be considered when predicting and pricing ETF liquidity. For policymakers and regulators, these findings imply that stability in ETF liquidity requires stability in political, economic, and financial country risks. Therefore, it is important for policymakers and regulators to implement governance mechanisms which foster stability in the country’s political, economic, and financial environments. These governance mechanisms and policies can relate to government stability, corruption, inflation rates, GDP per capita, exchange rate volatility, and even foreign debt, amongst other issues.
There are various avenues for future research. Firstly, this study only considers market depth and tightness (measured by the Amihud ratio and high–low spread, respectively); however, considering other dimension of market liquidity (such as, market resilience) may provide greater insight into the response of ETFs to country risk shocks. Secondly, Chen et al. (2021) notes that market liquidity is time-varying and regime-dependent. Therefore, examining the effects of country risk components on ETF liquidity using regime-switching models may shed light on the differential effects of political, economic, and financial risks on ETF liquidity under different market conditions. Thirdly, future research should investigate the effect of country risk components on the liquidity of alternative asset classes in order to determine whether or not liquidity in these markets responds similarly to ETF markets.

Funding

This research received no external funding.

Data Availability Statement

Individual ETF data were obtained from the Bloomberg database, and the country risk ratings for South Africa were obtained from the International Country Risk Guide.

Acknowledgments

This paper forms part of D. K.’s Ph.D. thesis, which is currently being supervised by P. F. Muzindutsi and F. Peerbhai.

Conflicts of Interest

The author declares no conflict of interest.

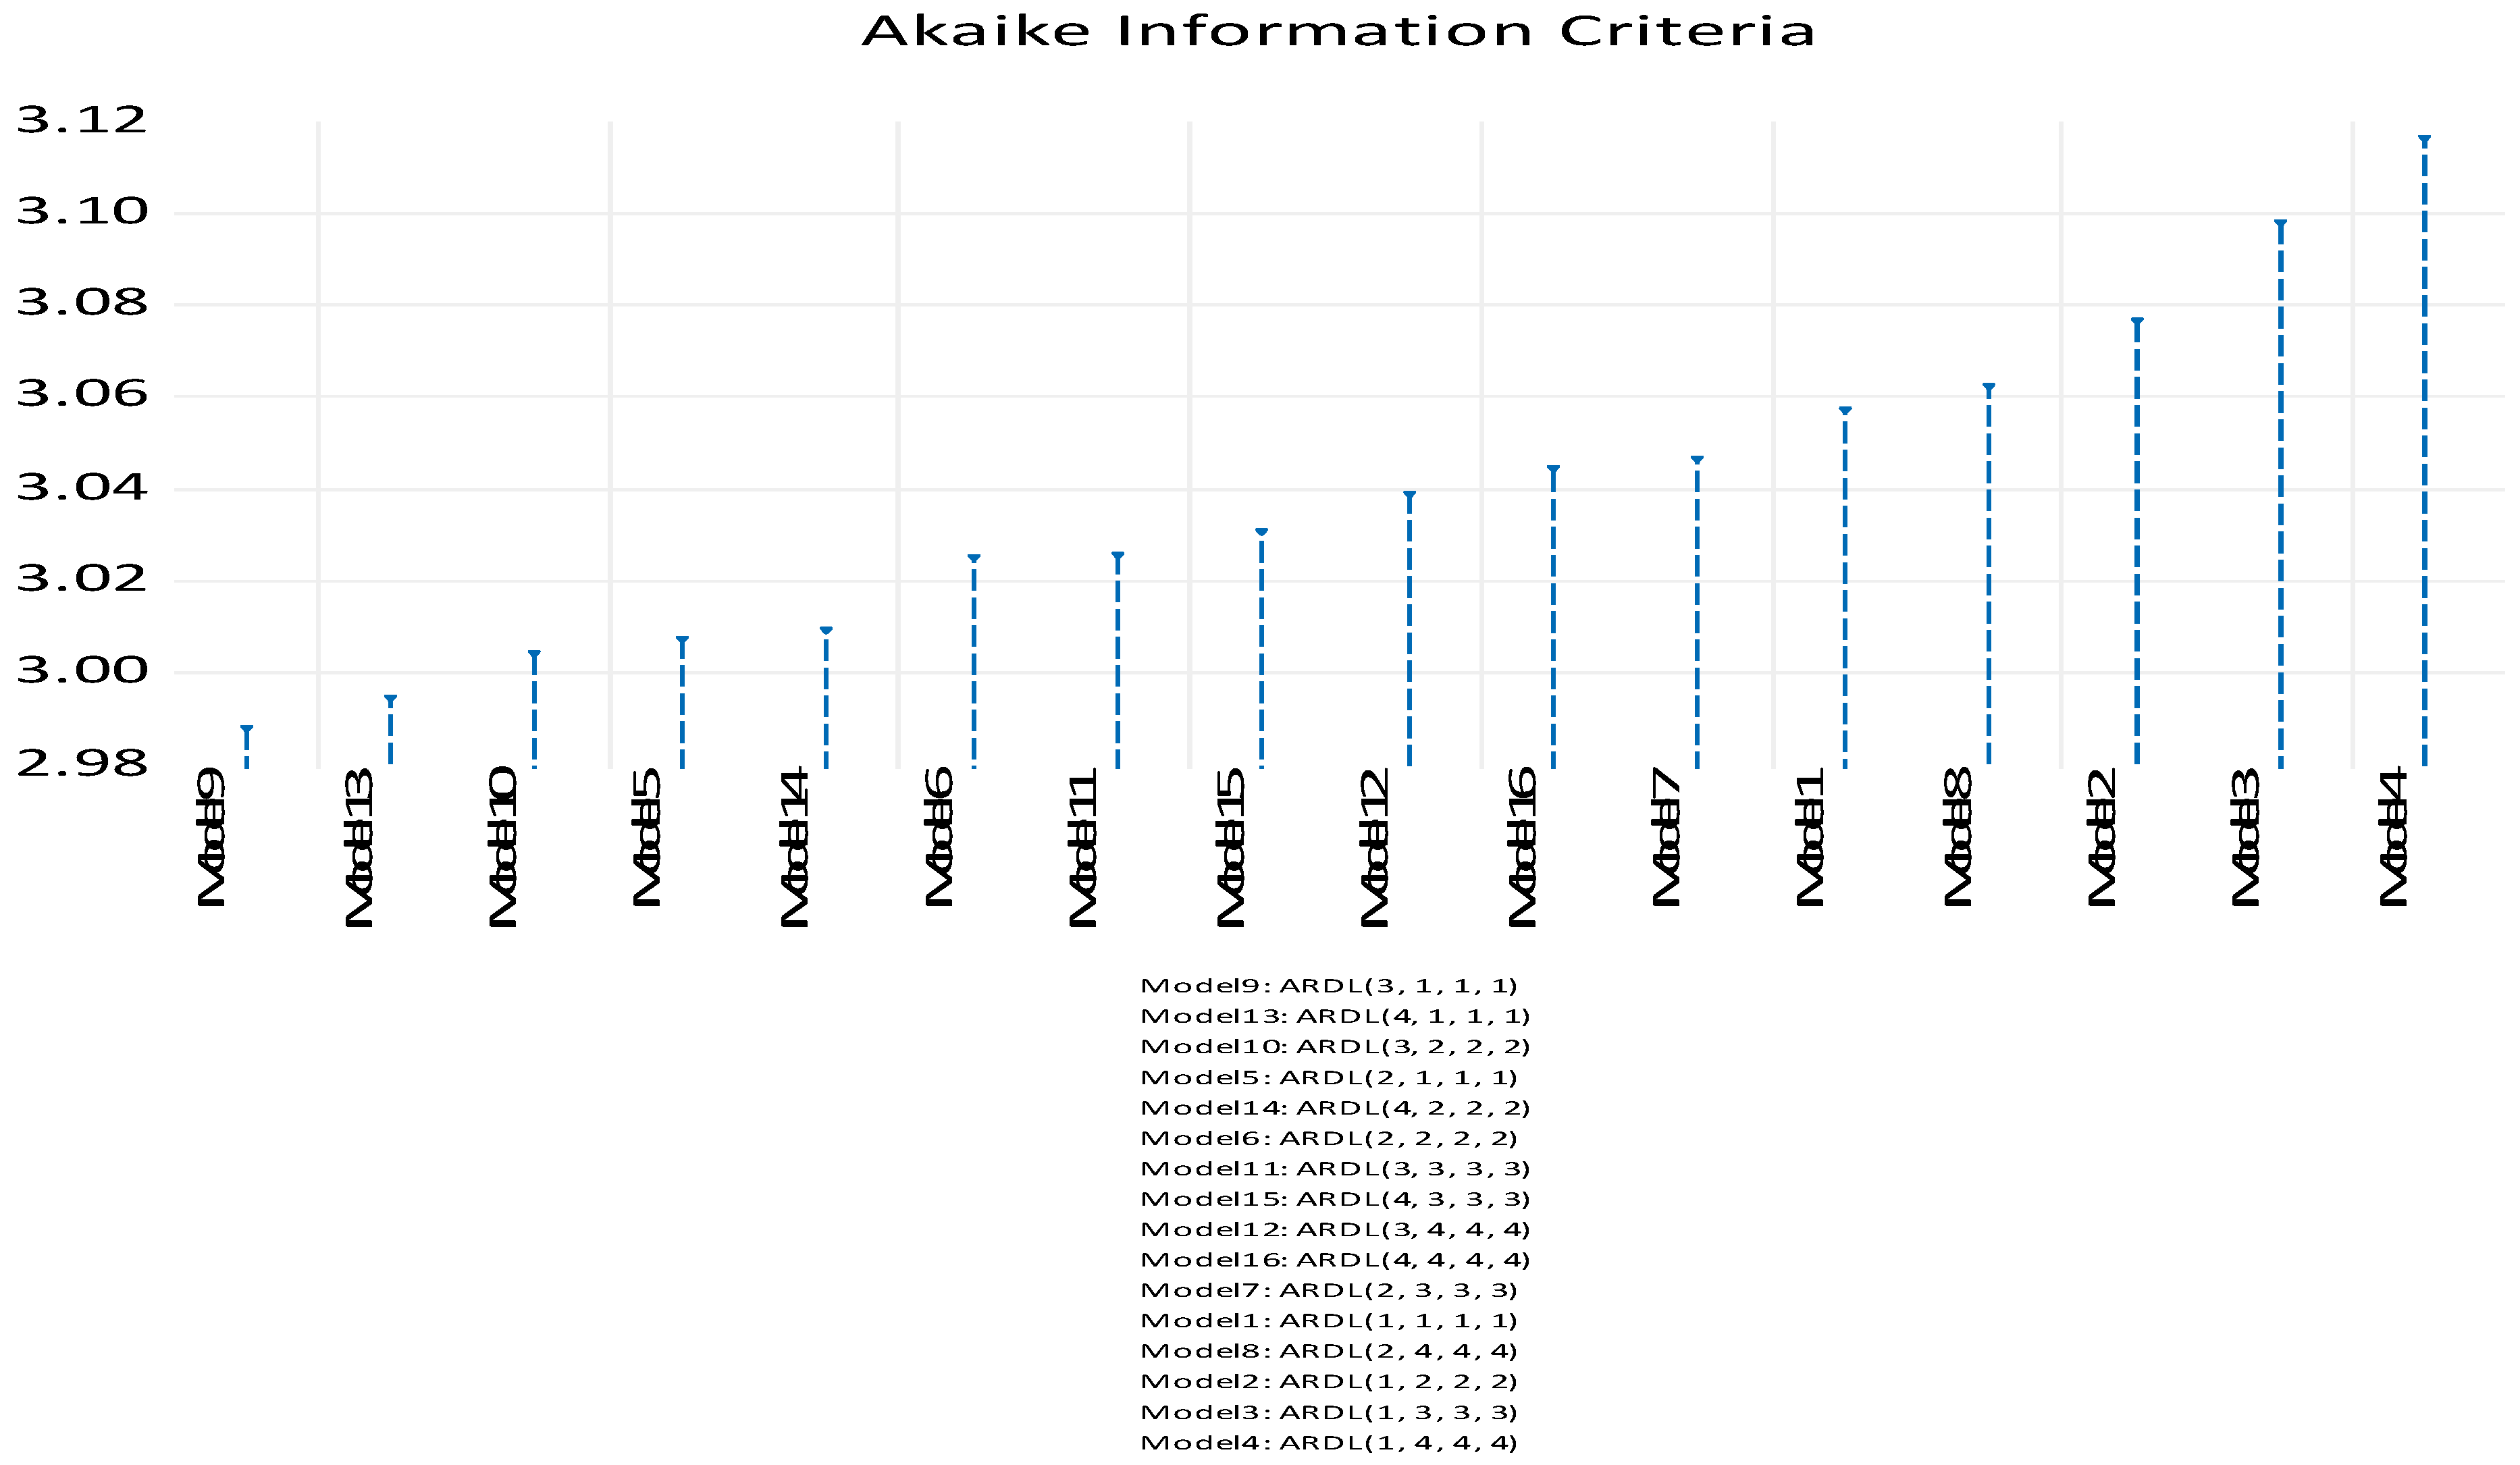
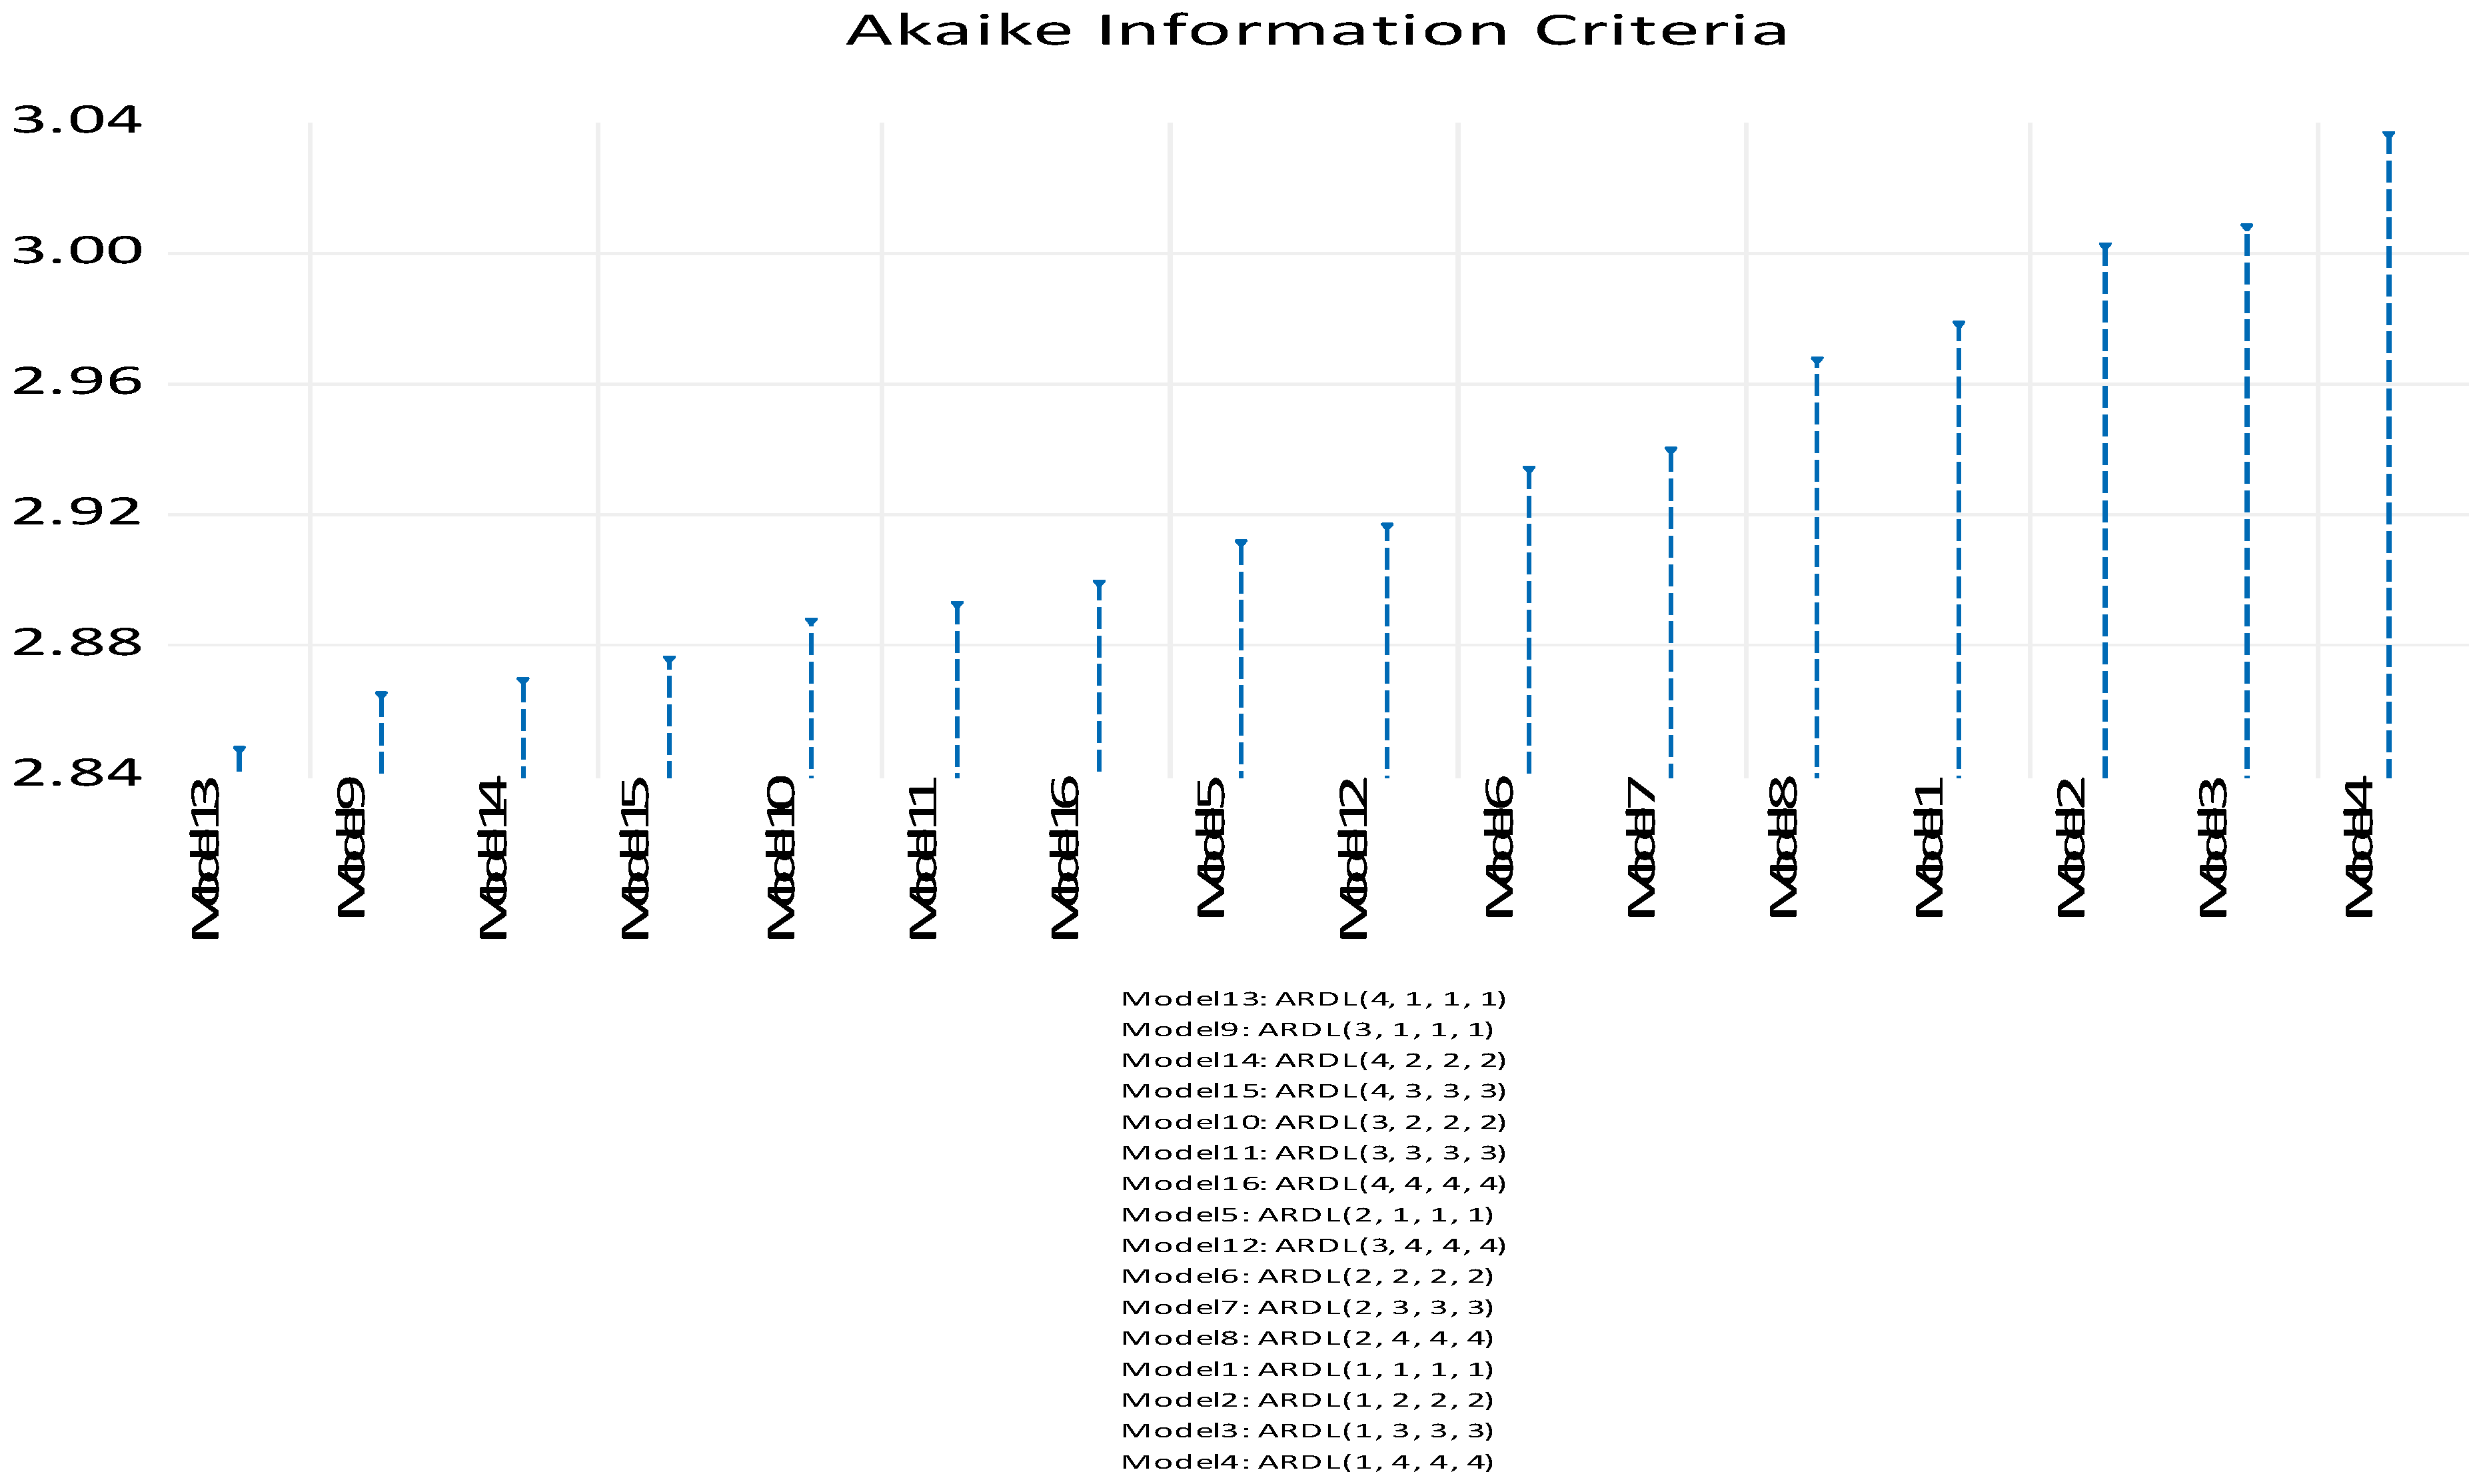
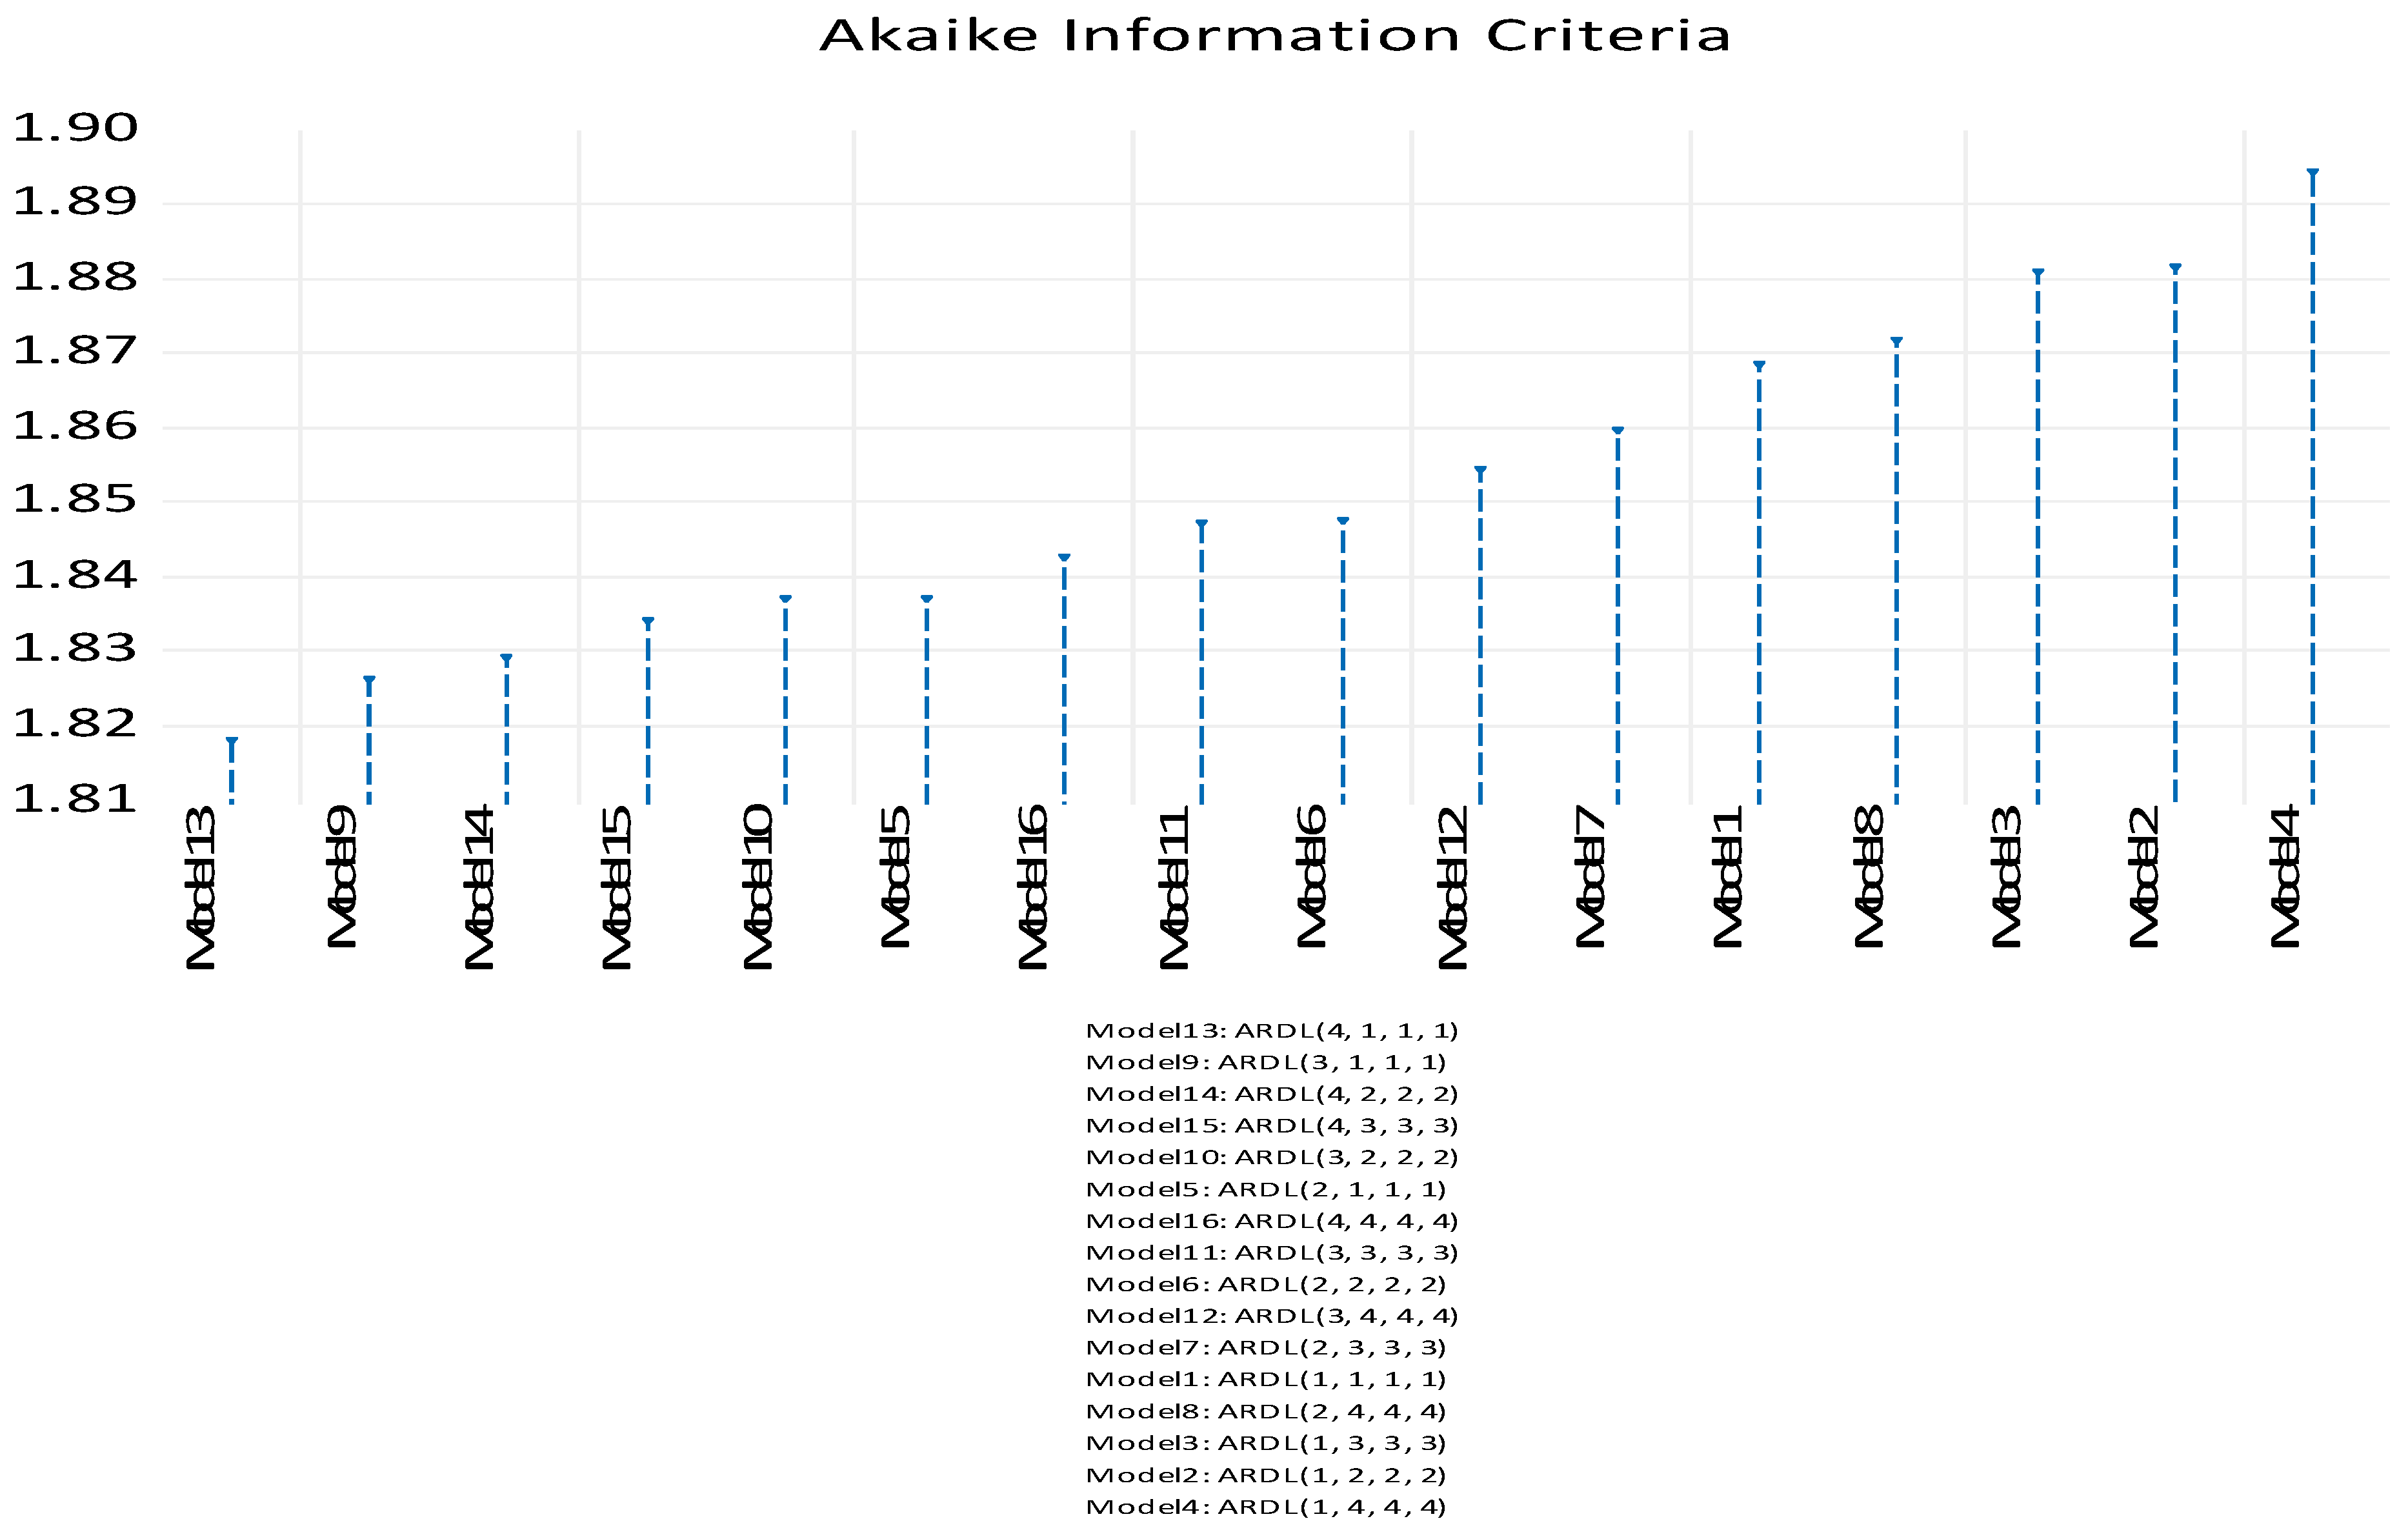
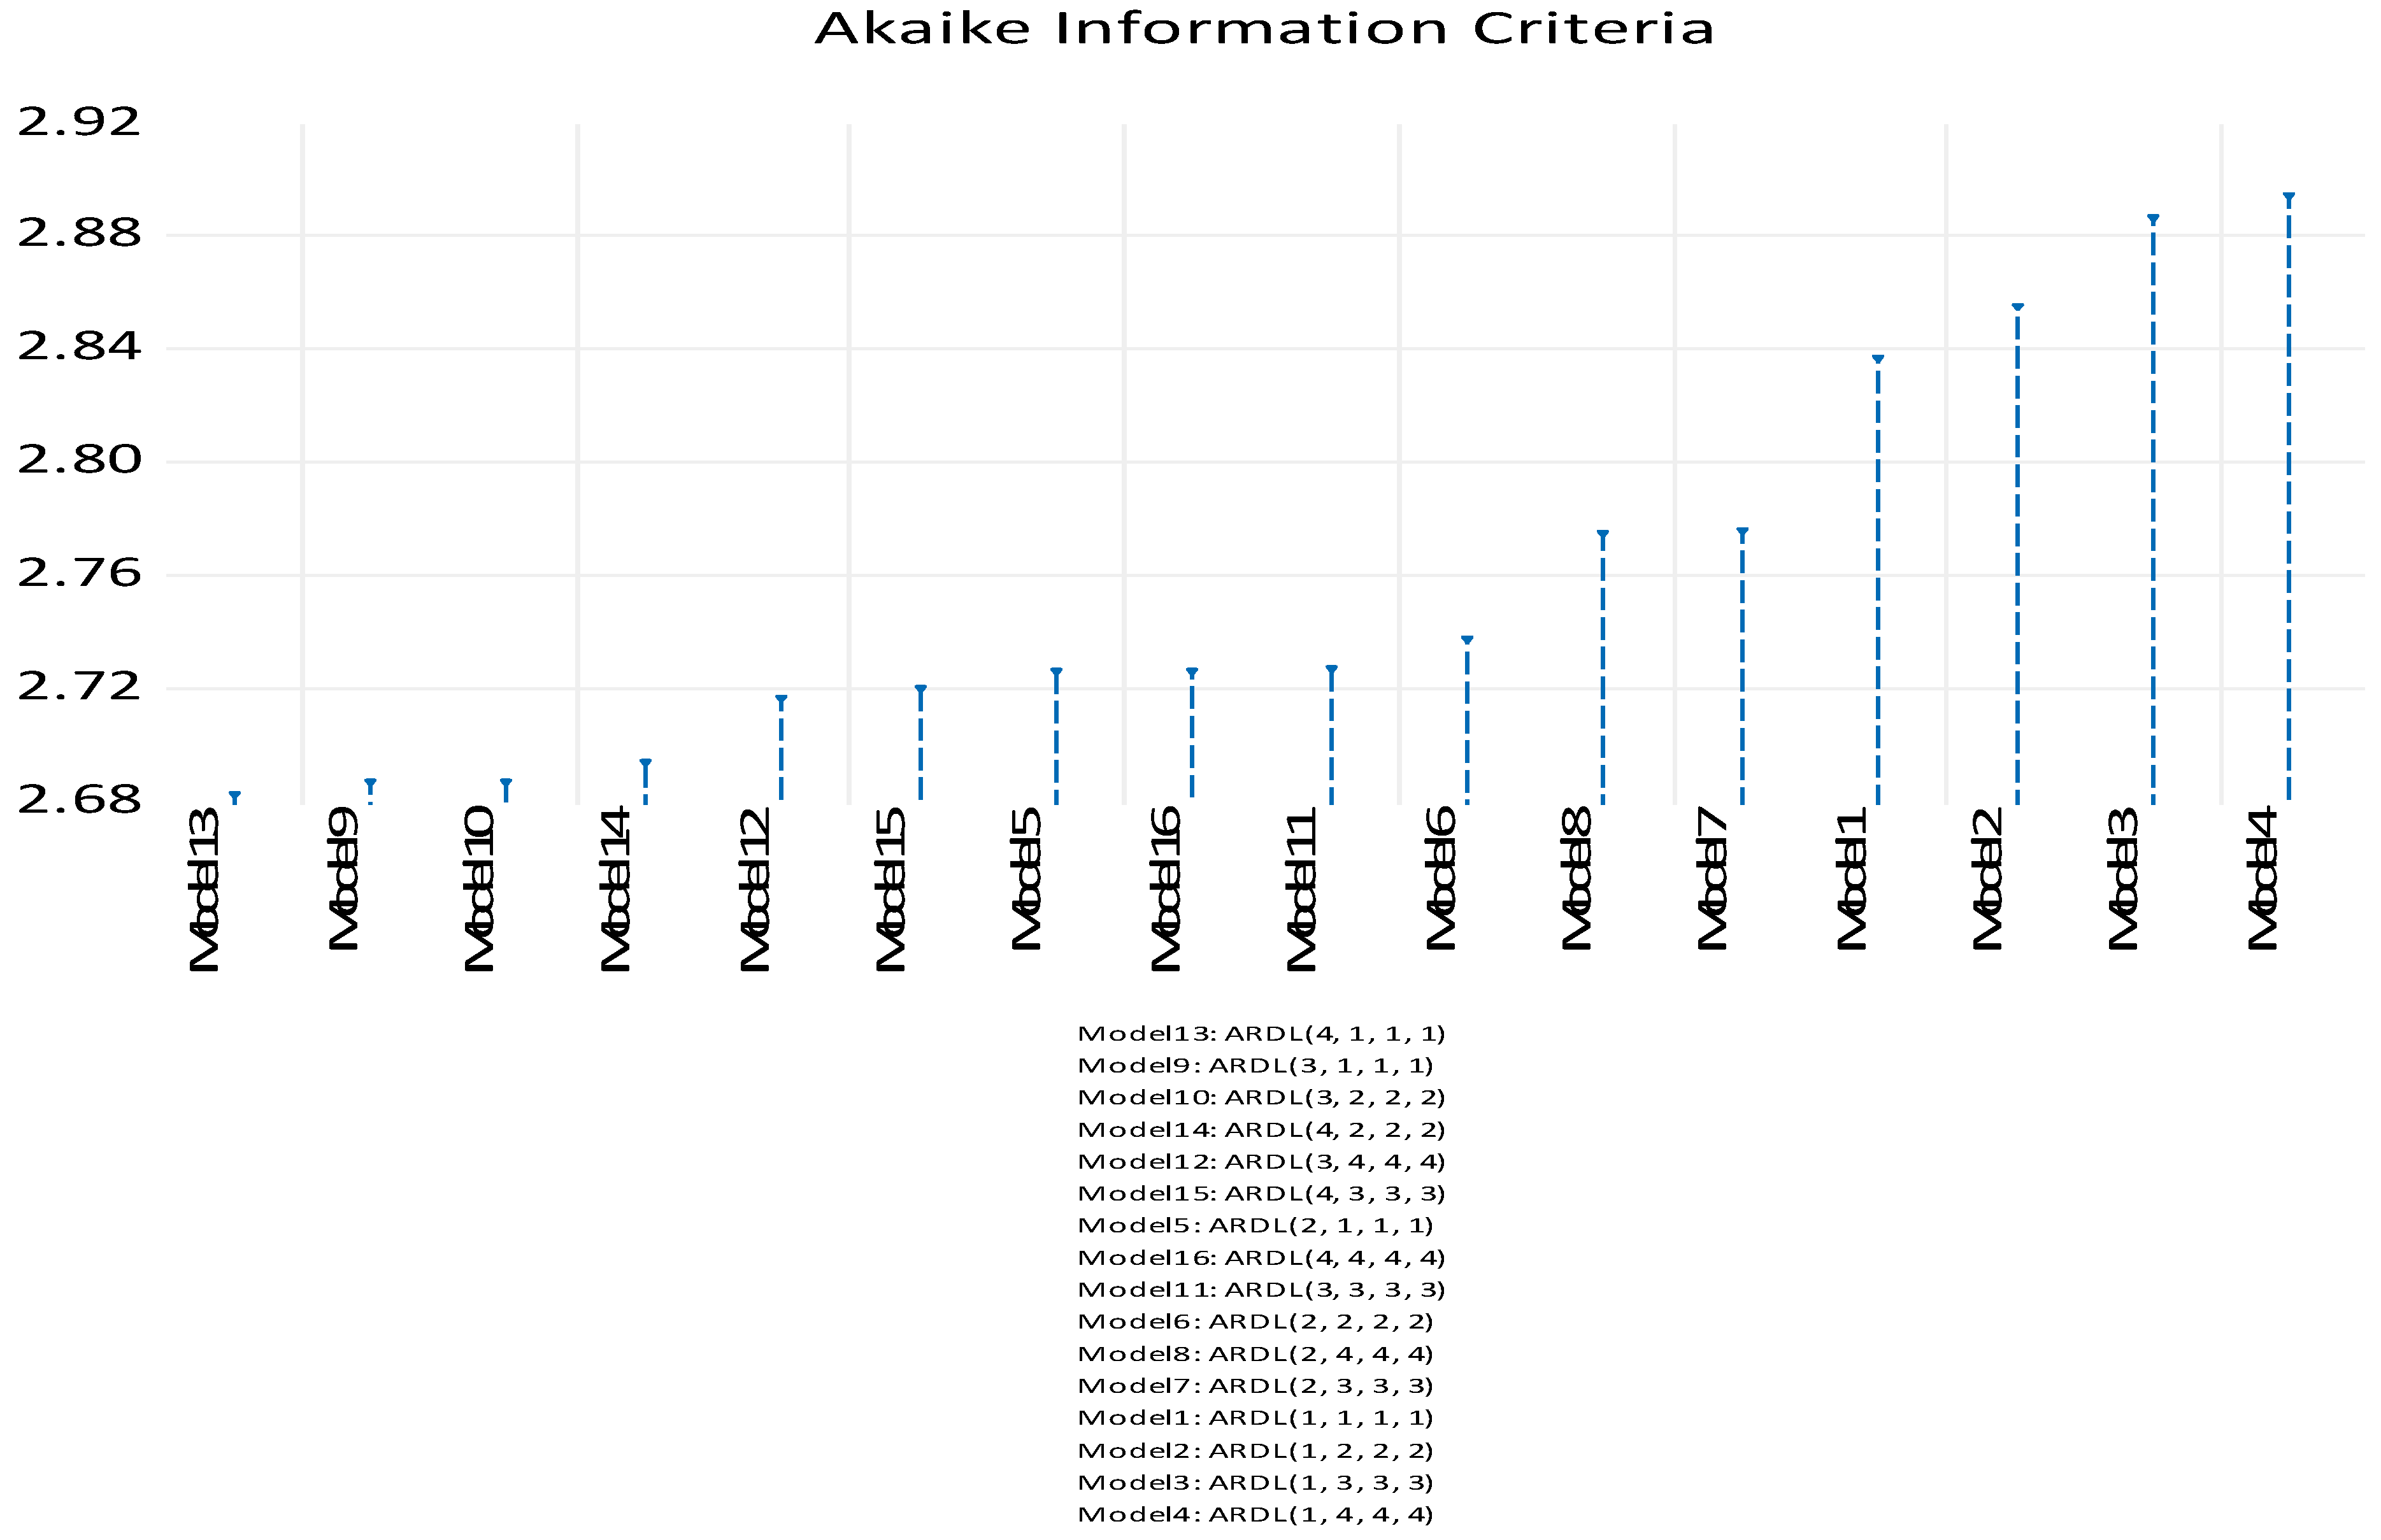
Appendix A. Optimal Lag Length Selection

Appendix A.1. Segment A: ETFs with Domestic Benchmarks

Figure A1. Model with Amihud Ratio.
Economies 10 00130 g0a1
Figure A2. Model with High–Low Spread.
Economies 10 00130 g0a2

Appendix A.2. Segment B: ETFs with International Benchmarks

Figure A3. Model with Amihud Ratio.
Economies 10 00130 g0a3
Figure A4. Model with High–Low Spread.
Economies 10 00130 g0a4

Notes

1
Market (or trading) liquidity which relates to how easily a security can be traded is different from funding liquidity which relates to how easily funding can be obtained (Brunnermeier and Pedersen 2009). This study focuses on market liquidity.
2
This includes ETFs which track a variety of asset classes including stocks, bonds, real estate, commodities, and currencies.
3
The CGREEN and CSEW40 ETFs were removed from the sample due to insufficient data.
4
Refer to Howell (2011) for a detailed discussion of the factors used in assessing each risk.
5
Specifically, the magnitudes of the effects of political risk on the Amihud ratio and high–low spread.

References

  1. Aitken, Michael, and Carole Comerton-Forde. 2003. How should liquidity be measured? Pacific-Basin Finance Journal 11: 45–59. [Google Scholar] [CrossRef]
  2. Al Mustofa, M. U., I. Mawardi, and T. Widiastuti. 2020. Impact of political risk, financial risk and economic risk on trading volume of Islamic stocks exchange in Indonesia. In Advances in Business, Management and Entrepreneurship. Boca Raton: CRC Press, pp. 410–14. [Google Scholar]
  3. Amihud, Yakov. 2002. Illiquidity and stock returns: Cross-section and time-series effects. Journal of Financial Markets 5: 31–56. [Google Scholar] [CrossRef] [Green Version]
  4. Baltagi, Badi H., Qu Feng, and Chihwa Kao. 2012. A Lagrange Multiplier test for cross-sectional dependence in a fixed effects panel data model. Journal of Econometrics 170: 164–77. [Google Scholar] [CrossRef] [Green Version]
  5. Bartov, Eli, and Gordon M. Bodnar. 1996. Alternative accounting methods, information asymmetry and liquidity: Theory and evidence. Accounting Review 71: 397–418. [Google Scholar]
  6. Będowska-Sójka, Barbara. 2018. The coherence of liquidity measures. The evidence from the emerging market. Finance Research Letters 27: 118–23. [Google Scholar] [CrossRef]
  7. Belkhir, Mohamed, Narjess Boubakri, and Jocelyn Grira. 2017. Political risk and the cost of capital in the MENA region. Emerging Markets Review 33: 155–72. [Google Scholar] [CrossRef]
  8. Ben Nasr, Adnen, Juncal Cunado, Riza Demirer, and Rangan Gupta. 2018. Country risk ratings and stock market returns in Brazil, Russia, India, and China (BRICS) countries: A nonlinear dynamic approach. Risks 6: 94. [Google Scholar] [CrossRef] [Green Version]
  9. Ben-David, Itzhak, Francesco Franzoni, and Rabih Moussawi. 2018. Do ETFs increase volatility? The Journal of Finance 73: 2471–535. [Google Scholar] [CrossRef] [Green Version]
  10. Bidirici, Melike, and Eda Bohur. 2015. Design and economic growth: Panel cointegration and causality analysis. Procedia-Social and Behavioral Sciences 210: 193–202. [Google Scholar] [CrossRef] [Green Version]
  11. Brunnermeier, Markus K., and Lasse H. Pedersen. 2009. Market liquidity and funding liquidity. The Review of Financial Studies 22: 2201–38. [Google Scholar] [CrossRef] [Green Version]
  12. Cannon, Susanne E., and Rebel A. Cole. 2011. Changes in REIT liquidity 1988–2007: Evidence from daily data. The Journal of Real Estate Finance and Economics 43: 258–80. [Google Scholar] [CrossRef] [Green Version]
  13. Chen, Louisa, Liya Shen, and Zhiping Zhou. 2021. Understand funding liquidity and market liquidity in a regime-switching model. International Journal of Finance & Economics. Online First Article. [Google Scholar]
  14. Chiu, Junmao, Huimin Chung, and Keng Y. Ho. 2014. Fear sentiment, liquidity, and trading behavior: Evidence from the index ETF market. Review of Pacific Basin Financial Markets and Policies 17: 1450017. [Google Scholar] [CrossRef]
  15. Chordia, Tarun, Richard Roll, and Avanidhar Subrahmanyam. 2001. Market liquidity and trading activity. The Journal of Finance 56: 501–30. [Google Scholar] [CrossRef]
  16. Chordia, Tarun, Richard Roll, and Avanidhar Subrahmanyam. 2008. Liquidity and market efficiency. Journal of Financial Economics 87: 249–68. [Google Scholar] [CrossRef]
  17. Chung, Kee H., and Hao Zhang. 2014. A simple approximation of intraday spreads using daily data. Journal of Financial Markets 17: 94–120. [Google Scholar] [CrossRef]
  18. Corwin, Shane A. 2014. Dealing with Negative Values in the High–low Spread Estimator. Working Paper. Notre Dame: University of Notre Dame. [Google Scholar]
  19. Corwin, Shane A., and Paul Schultz. 2012. A simple way to estimate bid–ask spreads from daily high and low prices. The Journal of Finance 67: 719–60. [Google Scholar] [CrossRef]
  20. da Silva, Patricia P., Pedro A. Cerqueira, and Wojolomi Ogbe. 2018. Determinants of renewable energy growth in Sub-Saharan Africa: Evidence from panel ARDL. Energy 156: 45–54. [Google Scholar] [CrossRef]
  21. Debata, Byomakesh, and Jitendra Mahakud. 2018. Economic policy uncertainty and stock market liquidity: Does financial crisis make any difference? Journal of Financial Economic Policy 10: 112–35. [Google Scholar] [CrossRef]
  22. Demsetz, Harold. 1968. The cost of transacting. The Quarterly Journal of Economics 82: 33–53. [Google Scholar] [CrossRef]
  23. Duong, Huu N., Chandra Krishnamurti, Justin H. Nguyen, My Nguyen, and S. Ghon Rhee. 2018. The Impact of Economic Policy Uncertainty on Stock Liquidity: Cross-Sectional Effects and Economic Channels. SSRN 3088922. Rochester: SSRN. [Google Scholar]
  24. Erdem, Ekrem, Bulent Guloglu, and Saban Nazlioglu. 2010. The macroeconomy and Turkish agricultural trade balance with the EU countries: Panel ARDL analysis. International Journal of Economic Perspectives 4: 371–79. [Google Scholar]
  25. Fong, Kingsley Y., Craig W. Holden, and Charles A. Trzcinka. 2017. What are the best liquidity proxies for global research? Review of Finance 21: 1355–401. [Google Scholar] [CrossRef]
  26. Foster, F. Douglas, and Subramanian Viswanathan. 1993. Variations in trading volume, return volatility, and trading costs: Evidence on recent price formation models. The Journal of Finance 48: 187–211. [Google Scholar] [CrossRef]
  27. Hadri, Kaddour. 2000. Testing for stationarity in heterogeneous panel data. The Econometrics Journal 3: 148–61. [Google Scholar] [CrossRef]
  28. Han, Qian, and Jufang Liang. 2017. Index futures trading restrictions and spot market quality: Evidence from the recent Chinese stock market crash. Journal of Futures Markets 37: 411–28. [Google Scholar] [CrossRef]
  29. Harvey, Campbell R. 2004. Country Risk Components, the Cost of Capital, and Returns in Emerging Markets. Working Paper. Cambridge: National Bureau of Economic Research. [Google Scholar]
  30. Hoti, Suhejla. 2005. Modelling country spillover effects in country risk ratings. Emerging Markets Review 6: 324–45. [Google Scholar] [CrossRef]
  31. Howell, Llewellyn D. 2011. International Country Risk Guide Methodology. New York: PRS Group. [Google Scholar]
  32. Huang, Roger D., and Hans R. Stoll. 2001. Exchange rates and firms’ liquidity: Evidence from ADRs. Journal of International Money and Finance 20: 297–325. [Google Scholar] [CrossRef]
  33. Huberman, Gur, and Dominika Halka. 2001. Systematic liquidity. Journal of Financial Research 24: 161–78. [Google Scholar] [CrossRef]
  34. IOL. 2020. Exchange-traded Funds are Still Popular Trading Instruments after 20 Years. Available online: https://www.iol.co.za/personal-finance/investments/exchange-traded-funds-are-still-popular-trading-instruments-after-20-years-51115810 (accessed on 25 February 2022).
  35. Kim, Soyoung, and Doo Y. Yang. 2011. The impact of capital inflows on asset prices in emerging Asian economies: Is too much money chasing too little good? Open Economies Review 22: 293–315. [Google Scholar] [CrossRef] [Green Version]
  36. Kim, Suk J., and Eliza Wu. 2008. Sovereign credit ratings, capital flows and financial sector development in emerging markets. Emerging Markets Review 9: 17–39. [Google Scholar] [CrossRef] [Green Version]
  37. Kinlaw, Will, Mark Kritzman, and David Turkington. 2013. Liquidity and portfolio choice: A unified approach. The Journal of Portfolio Management 39: 19–27. [Google Scholar] [CrossRef] [Green Version]
  38. Krinsky, Itzhak, and Jason Lee. 1996. Earnings announcements and the components of the bid–ask spread. The Journal of Finance 51: 1523–35. [Google Scholar] [CrossRef]
  39. Kunjal, Damien, and Faeezah Peerbhai. 2021. Investor overconfidence in the South African exchange-traded fund market. Cogent Economics & Finance 9: 1978190. [Google Scholar]
  40. Kunjal, Damien, Faeezah Peerbhai, and Paul F. Muzindutsi. 2021. The performance of South African exchange-traded funds under changing market conditions. Journal of Asset Management 22: 350–59. [Google Scholar] [CrossRef]
  41. Kunjal, Damien, Faeezah Peerbhai, and Paul F. Muzindutsi. 2022. Political, economic, and financial country risks and the volatility of the South African Exchange-traded Fund market: A GARCH-MIDAS approach. In Risk Management. London: Palgrave Macmillan UK. [Google Scholar]
  42. Kyle, Albert S. 1985. Continuous auctions and insider trading. Econometrica: Journal of the Econometric Society 53: 1315–35. [Google Scholar] [CrossRef] [Green Version]
  43. Lee, Charles M., Belinda Mucklow, and Mark J. Ready. 1993. Spreads, depths, and the impact of earnings information: An intraday analysis. The Review of Financial Studies 6: 345–74. [Google Scholar] [CrossRef]
  44. Lee, Chi C., and Chien C. Lee. 2018. The impact of country risk on income inequality: A multilevel analysis. Social Indicators Research 136: 139–62. [Google Scholar]
  45. Lee, Chien C., and Mei P. Chen. 2021. The effects of investor attention and policy uncertainties on cross-border country exchange-traded fund returns. International Review of Economics & Finance 71: 830–52. [Google Scholar]
  46. Lee, Hyun H., Hyeon S. Huh, and Donghyun Park. 2013. Financial integration in East Asia: An empirical investigation. The World Economy 36: 396–418. [Google Scholar] [CrossRef] [Green Version]
  47. Lee, Kuan H., Horacio Sapriza, and Yangru Wu. 2016. Sovereign debt ratings and stock liquidity around the World. Journal of Banking & Finance 73: 99–112. [Google Scholar]
  48. Lesmond, David A. 2005. Liquidity of emerging markets. Journal of Financial Economics 77: 411–52. [Google Scholar] [CrossRef]
  49. Levin, Andrew, Chien F. Lin, and Chia S. J. Chu. 2002. Unit root tests in panel data: Asymptotic and finite-sample properties. Journal of Econometrics 108: 1–24. [Google Scholar] [CrossRef]
  50. Lin, Crystal Y., Hamid Rahman, and Kenneth Yung. 2010. Investor overconfidence in REIT stock trading. Journal of Real Estate Portfolio Management 16: 39–57. [Google Scholar] [CrossRef]
  51. Liu, Shuming. 2015. Investor sentiment and stock market liquidity. Journal of Behavioral Finance 16: 51–67. [Google Scholar] [CrossRef]
  52. Ma, Xinxin, Pengcheng Song, and Xuan Zhang. 2020. The structural changes of liquidity risk, and liquidity risk premium in China stock market. Emerging Markets Finance and Trade 56: 3507–21. [Google Scholar] [CrossRef]
  53. Malamud, Semyon. 2016. A Dynamic Equilibrium Model of ETFs. Available online: https://ssrn.com/abstract=2831973 (accessed on 10 January 2022).
  54. Marshall, Ben R., Nhut H. Nguyen, and Nuttawat Visaltanachoti. 2018. Do liquidity proxies measure liquidity accurately in ETFs? Journal of International Financial Markets, Institutions and Money 55: 94–111. [Google Scholar] [CrossRef]
  55. Mensi, Walid, Shawkat Hammoudeh, Seong M. Yoon, and Mehmet Balcilar. 2017. Impact of macroeconomic factors and country risk ratings on GCC stock markets: Evidence from a dynamic panel threshold model with regime switching. Applied Economics 49: 1255–72. [Google Scholar] [CrossRef]
  56. Munir, Qaiser, Hooi H. Lean, and Russell Smyth. 2020. CO2 emissions, energy consumption and economic growth in the ASEAN-5 countries: A cross-sectional dependence approach. Energy Economics 85: 104571. [Google Scholar] [CrossRef]
  57. Nagar, Venky, Jordan Schoenfeld, and Laura Wellman. 2019. The effect of economic policy uncertainty on investor information asymmetry and management disclosures. Journal of Accounting and Economics 67: 36–57. [Google Scholar] [CrossRef]
  58. O’Hara, Maureen. 2004. Liquidity and Financial Market Stability. Working Paper No. 55. Brussels: National Bank of Belgium. [Google Scholar]
  59. Onuoha, F. C., I. C. Okonkwo, P. Okoro, and K. Okere. 2018. The causal relationship between Foreign Direct Investment (FDI) and the macro-economy of selected west African countries: Panel ARDL/granger causality analysis. African Research Review 12: 140–63. [Google Scholar] [CrossRef] [Green Version]
  60. Pedroni, Peter. 1999. Critical values for cointegration tests in heterogeneous panels with multiple regressors. Oxford Bulletin of Economics and Statistics 61: 653–70. [Google Scholar] [CrossRef]
  61. Pedroni, Peter. 2004. Panel cointegration: Asymptotic and finite sample properties of pooled time series tests with an application to the PPP hypothesis. Econometric Theory 20: 597–625. [Google Scholar] [CrossRef] [Green Version]
  62. Pesaran, M. Hashem, Yongcheol Shin, and Ron P. Smith. 1999. Pooled mean group estimation of dynamic heterogeneous panels. Journal of the American Statistical Association 94: 621–34. [Google Scholar] [CrossRef]
  63. Pesaran, M. Hashem. 2004. General Diagnostic Tests for Cross Section Dependence in Panels. Working Paper No. 1240. Cambridge: University of Cambridge. [Google Scholar]
  64. Pesaran, M. Hashem. 2007. A simple panel unit root test in the presence of cross-section dependence. Journal of Applied Econometrics 22: 265–312. [Google Scholar] [CrossRef] [Green Version]
  65. Pham, Son D., Ben R. Marshall, Nhut H. Nguyen, and Nuttawat Visaltanachoti. 2021a. Liquidity Spillover between ETFs and Their Constituents. SSRN 3806140. Rochester: SSRN. [Google Scholar]
  66. Pham, Son D., Ben R. Marshall, Nhut H. Nguyen, and Nuttawat Visaltanachoti. 2021b. The liquidity of active ETFs. Global Finance Journal 49: 100572. [Google Scholar] [CrossRef]
  67. Rompotis, Gerasimos G. 2017. The impact of terrorism on Islamic exchange-traded funds. Journal of Islamic Economics, Banking and Finance 13: 71–95. [Google Scholar] [CrossRef]
  68. Sakarya, Burchan, and Aykut Ekinci. 2020. Exchange-traded funds and FX volatility: Evidence from Turkey. Central Bank Review 20: 205–11. [Google Scholar] [CrossRef]
  69. Salisu, Afees A., and Kazeem O. Isah. 2017. Revisiting the oil price and stock market nexus: A nonlinear Panel ARDL approach. Economic Modelling 66: 258–71. [Google Scholar] [CrossRef]
  70. Sari, Ramazan, Mehmet Uzunkaya, and Shawkat Hammoudeh. 2013. The relationship between disaggregated country risk ratings and stock market movements: An ARDL approach. Emerging Markets Finance and Trade 49: 4–16. [Google Scholar] [CrossRef]
  71. Smales, Lee A., and Brian M. Lucey. 2019. The influence of investor sentiment on the monetary policy announcement liquidity response in precious metal markets. Journal of International Financial Markets, Institutions and Money 60: 19–38. [Google Scholar]
  72. Soltani, Hayet, Abderrahmen Aloulou, and Mouna B. Abbes. 2017. The impact of political instability on investor sentiment and market performance: Evidence from Tunisian revolution. IUP Journal of Applied Finance 23: 5–17. [Google Scholar]
  73. Steyn, Johan. 2019. The tracking efficiency of exchange-traded funds listed on the Johannesburg Stock Exchange. Management Dynamics 28: 2–14. [Google Scholar]
  74. Strydom, Barry, Ailie Charteris, and Kerry McCullough. 2015. The relative tracking ability of South African exchange-traded funds and index funds. Investment Analysts Journal 44: 117–33. [Google Scholar] [CrossRef]
  75. Subrahmanyam, Avanidhar. 1991. A theory of trading in stock index futures. The Review of Financial Studies 4: 17–51. [Google Scholar] [CrossRef]
  76. Tseng, Yung C., and Wo C. Lee. 2016. Investor sentiment and ETF liquidity-evidence from Asia markets. Advances in Management and Applied Economics 6: 89. [Google Scholar]
  77. Vengesai, Edson, and Paul F. Muzindutsi. 2020. Effect of disaggregated country risk shocks on financing decisions of the JSE listed firms. International Journal of Economics and Finance Studies 12: 32–49. [Google Scholar] [CrossRef]
Table 1. Descriptive Statistics.
ETFs with Domestic BenchmarksETFs with International BenchmarksPolitical Risk RatingsEconomic Risk RatingsFinancial Risk Ratings
Amihud RatioHigh–Low SpreadAmihud RatioHigh–Low Spread
Mean0.07300.00190.00760.003266.341334.669638.2022
Maximum11.26240.04150.57530.015472.000038.500042.0000
Minimum0.0000 ^0.0000 ^0.0000 ^0.0000 ^61.500029.000031.5000
Std. Dev.0.40020.00210.04350.00232.65722.18061.8996
Skewness16.29882.94579.91371.51690.17340.0453−0.6408
Kurtosis342.080532.0415111.58636.64112.10242.22033.2277
Jarque-Bera22,845,021172,879.1426,444.1787.10478.87365.903916.2383
Probability0.00000.00000.00000.00000.01180.05220.0003
Notes: ^ denotes values less than 0.0000 which were rounded off. Source: Author’s own estimations.
Table 2. Cross-dependence Test Results.
Breusch-Pagan LMPesaran Scaled LMPesaran CDBias-Corrected Scaled LM
Panel A: ETFs with Domestic Benchmarks
l n A m i h u d 5219.084 *105.0217 *18.9311 *104.9296 *
l n S 9057.362 *197.5170 *44.8418 *197.4249 *
l n P 15,702.53 *357.6531 *15.0576 *357.5610 *
l n E 8728.886 *189.6014 *23.2580 *189.5093 *
l n F 7460.380 *159.0328 *3.7106 *158.9407 *
Panel B: ETFs with International Benchmarks
l n A m i h u d 1018.320 *153.8898 *21.4172 *153.8692 *
l n S 234.8760 *33.0018 *5.8957 *32.9812 *
l n P 1840.000 *280.6778 *40.6282 *280.6572 *
l n E 1840.000 *280.6778 *40.6282 *280.6572 *
l n F 1840.000 *280.6778 *40.6282 *280.6572 *
Notes: * represents statistical significance at a 1% level of significance. Source: Author’s own estimations.
Table 3. Results of the CIPS Unit Root Tests.
ETFs with Domestic BenchmarksETFs with International BenchmarksDecision
LevelsFirst Diff.LevelsFirst Diff.
l n A m i h u d −5.8977 *--−3.5392 *--I(0)
l n S −6.1900 *--−5.6034 *--I(0)
l n P −1.8345−2.6732 *−0.9304−4.6783 *I(1)
l n E −0.0855−3.6466 *−0.8698−5.2395 *I(1)
l n F −5.4336 *--−3.6757 *--I(0)
Notes: * represents statistical significance at a 1% level of significance. Source: Author’s own estimations.
Table 4. Cointegration Test Results.
VariableETFs with Domestic BenchmarksETFs with International Benchmarks
Amihud RatioHigh–Low SpreadAmihud RatioHigh–Low Spread
Within-dimesion
Panel v-Stat.2.6259 *4.6295 *−1.26820.8217
Panel rho-Stat.−47.8144 *−45.8030 *−11.2359 *−37.5923 *
Panel PP-Stat.−34.6400 *−29.5472 *−7.9423 *−19.5048 *
Panel ADF-Stat.−16.0223 *−11.5614 *−3.5314 *−9.7913 *
Between-dimension
Group rho-Stat.−47.2387 *−53.5373 *−9.7965 *−28.7477 *
Group PP-Stat.−41.0671 *−39.8233 *−9.6779 *−20.0359 *
Group ADF-Stat.−21.3164 *−19.2236 *−4.1344 *−10.1029 *
Notes: * represents statistical significance at a 1% level of significance. Source: Author’s own estimations.
Table 5. Panel ARDL Long-Run Pooled Mean Group Estimation.
VariableETFs with Domestic BenchmarksETFs with International Benchmarks
Amihud RatioHigh–Low SpreadAmihud RatioHigh–Low Spread
Optimal ModelARDL(3,1,1,1)ARDL(4,1,1,1)ARDL(4,1,1,1)ARDL(4,1,1,1)
l n P 9.2243−3.678596.3924−17.3035
l n E 8.94940.0745−1.72284.9250
l n F 0.01060.0226−49.5644−3.0041
Notes: Source: Author’s own estimations.
Table 6. Panel ARDL Short-Run Pooled Mean Group Estimation.
VariableETFs with Domestic BenchmarksETFs with International Benchmarks
Amihud RatioHigh–Low SpreadAmihud RatioHigh–Low Spread
D ( l n A m i h u d ( 1 ) ) −0.2932 * −0.4838 *
D ( l n A m i h u d ( 2 ) ) −0.1503 * −0.3154 *
D ( l n A m i h u d ( 3 ) ) −0.1632 *
D ( l n S ( 1 ) ) −0.4347 * −0.3331 *
D ( l n S ( 2 ) ) −0.2969 * −0.1696 **
D ( l n S ( 3 ) ) −0.1215 * −0.0458
D ( l n P ) 1.368812.1392 **6.07092.3972
D ( l n E ) −4.0743−4.6523−0.2089−2.0795
D ( l n F ) −3.9553 **7.1071 *−3.4771 ***0.1196
E C T −0.4440 *−0.3552 *−0.0687 **−0.3857 *
Notes: *, **, and *** represent statistical significance at a 1%, 5%, and 10% level of significance, respectively. E C T represents the error correction term. Source: Author’s own estimations.
Publisher’s Note: MDPI stays neutral with regard to jurisdictional claims in published maps and institutional affiliations.

