
FDI and Institutions in BRIC and CIVETS Countries: An Empirical Investigation


Abstract
1. Introduction
2. Theoretical Framework
2.1. FDI and Predominant Theories
2.2. Institutional Quality as an FDI Determinant in Developing and Emerging Countries
2.3. Institutional Quality as an FDI Determinant in BRIC and CIVETS Countries
2.4. Other Potential Determinant Factors of FDI
3. Estimation Methods and Data
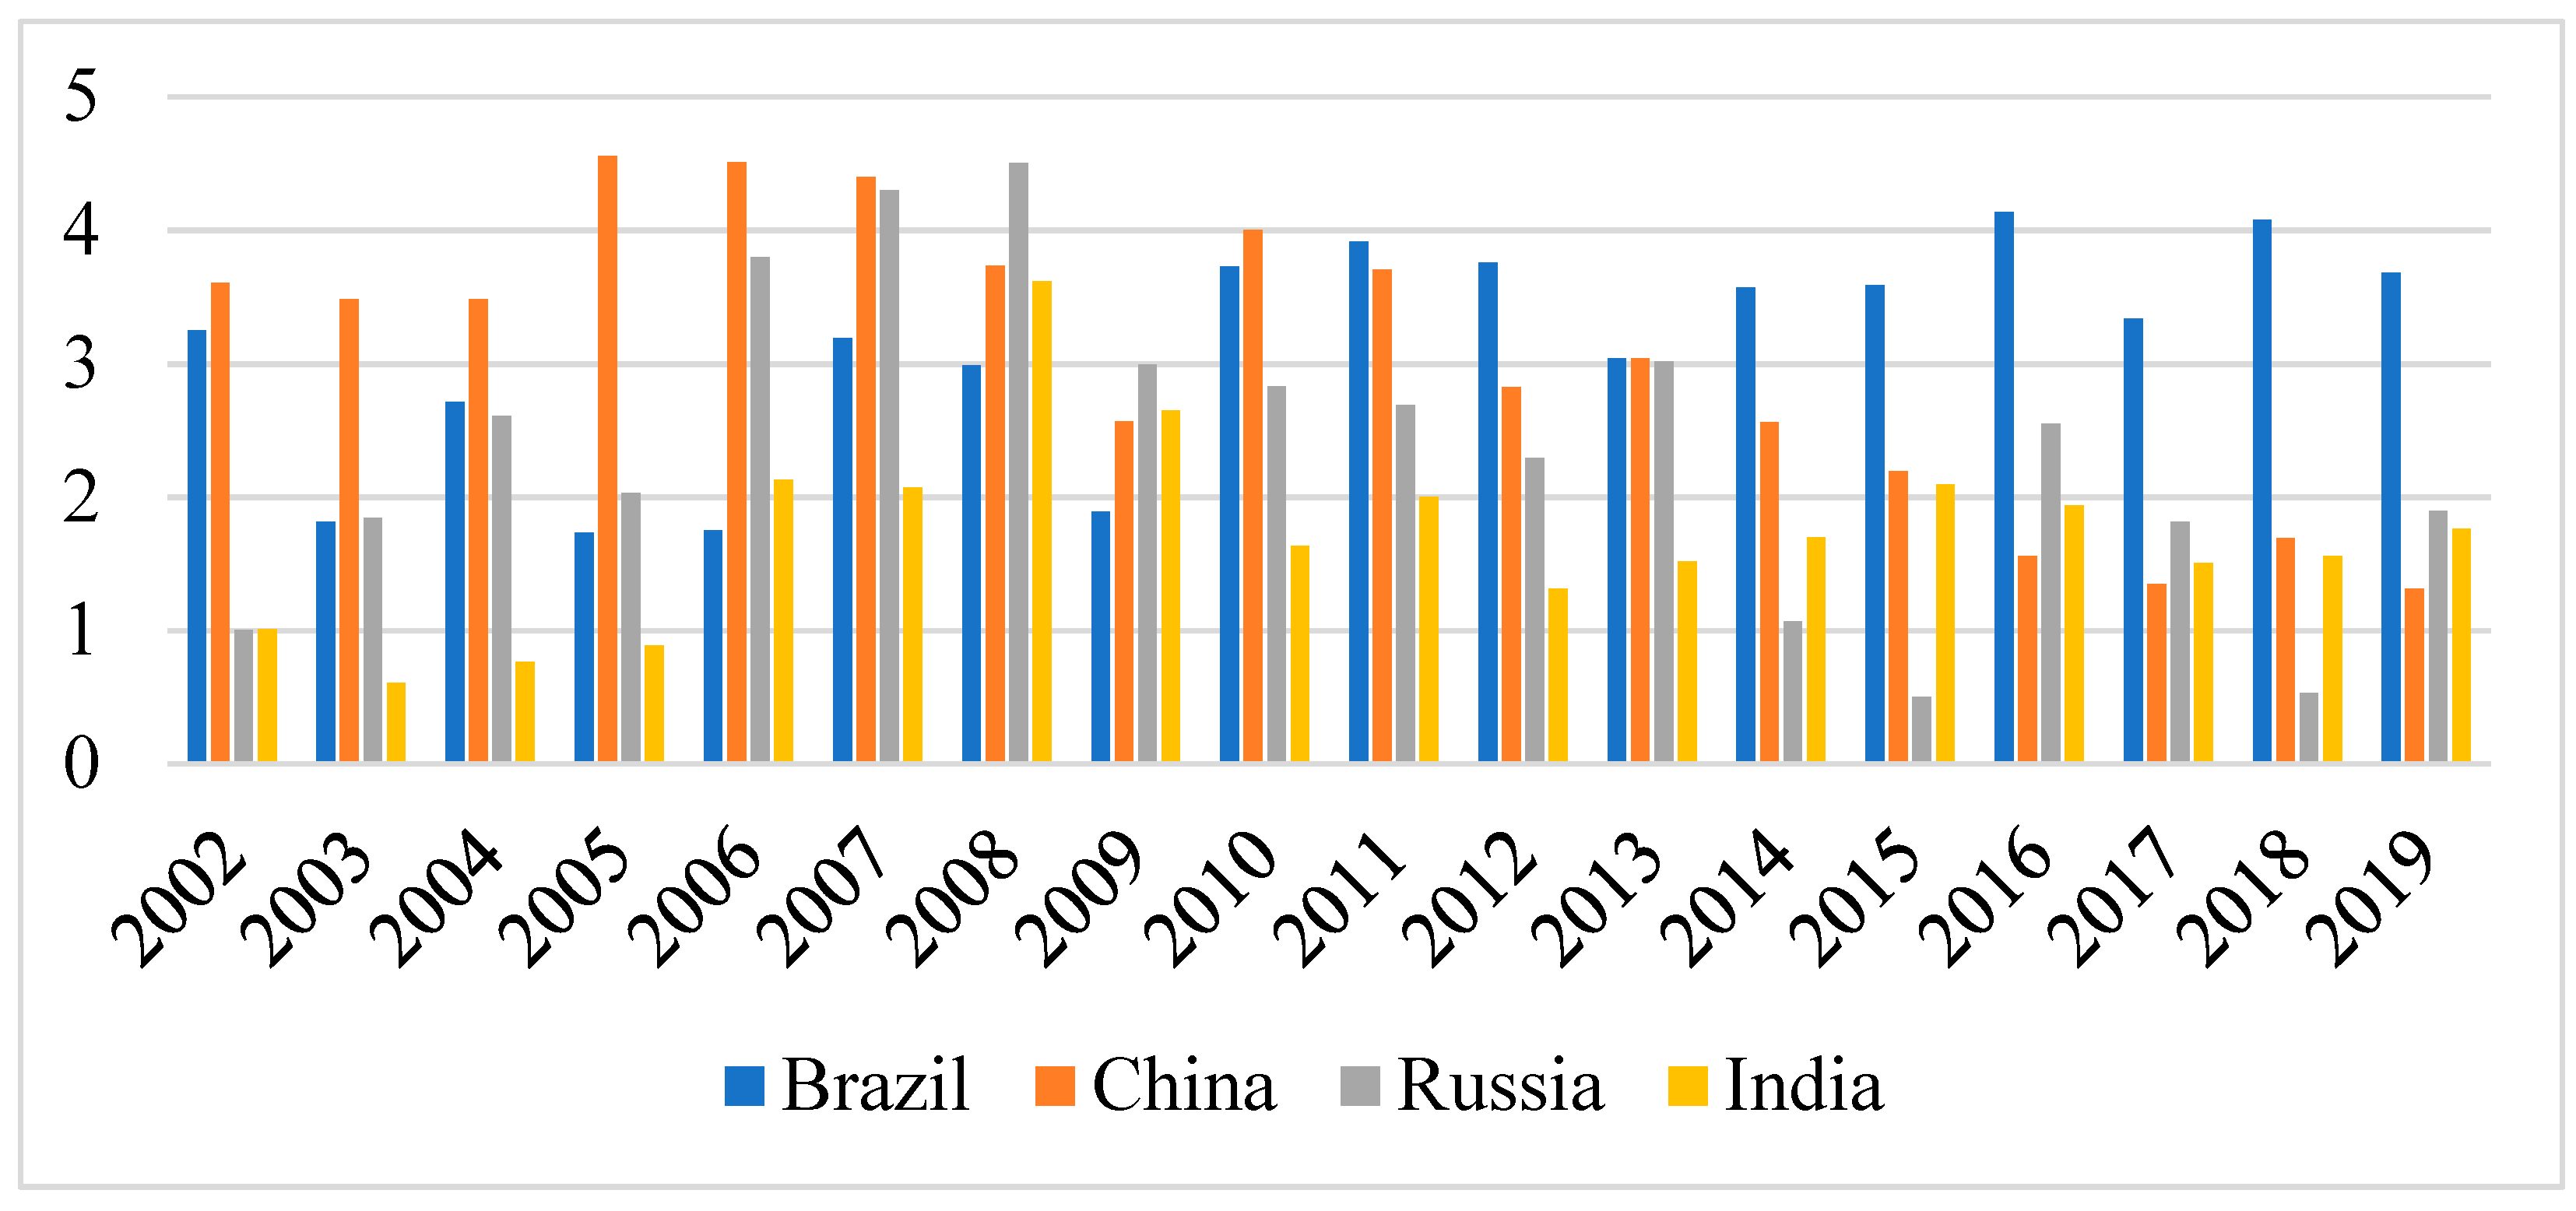
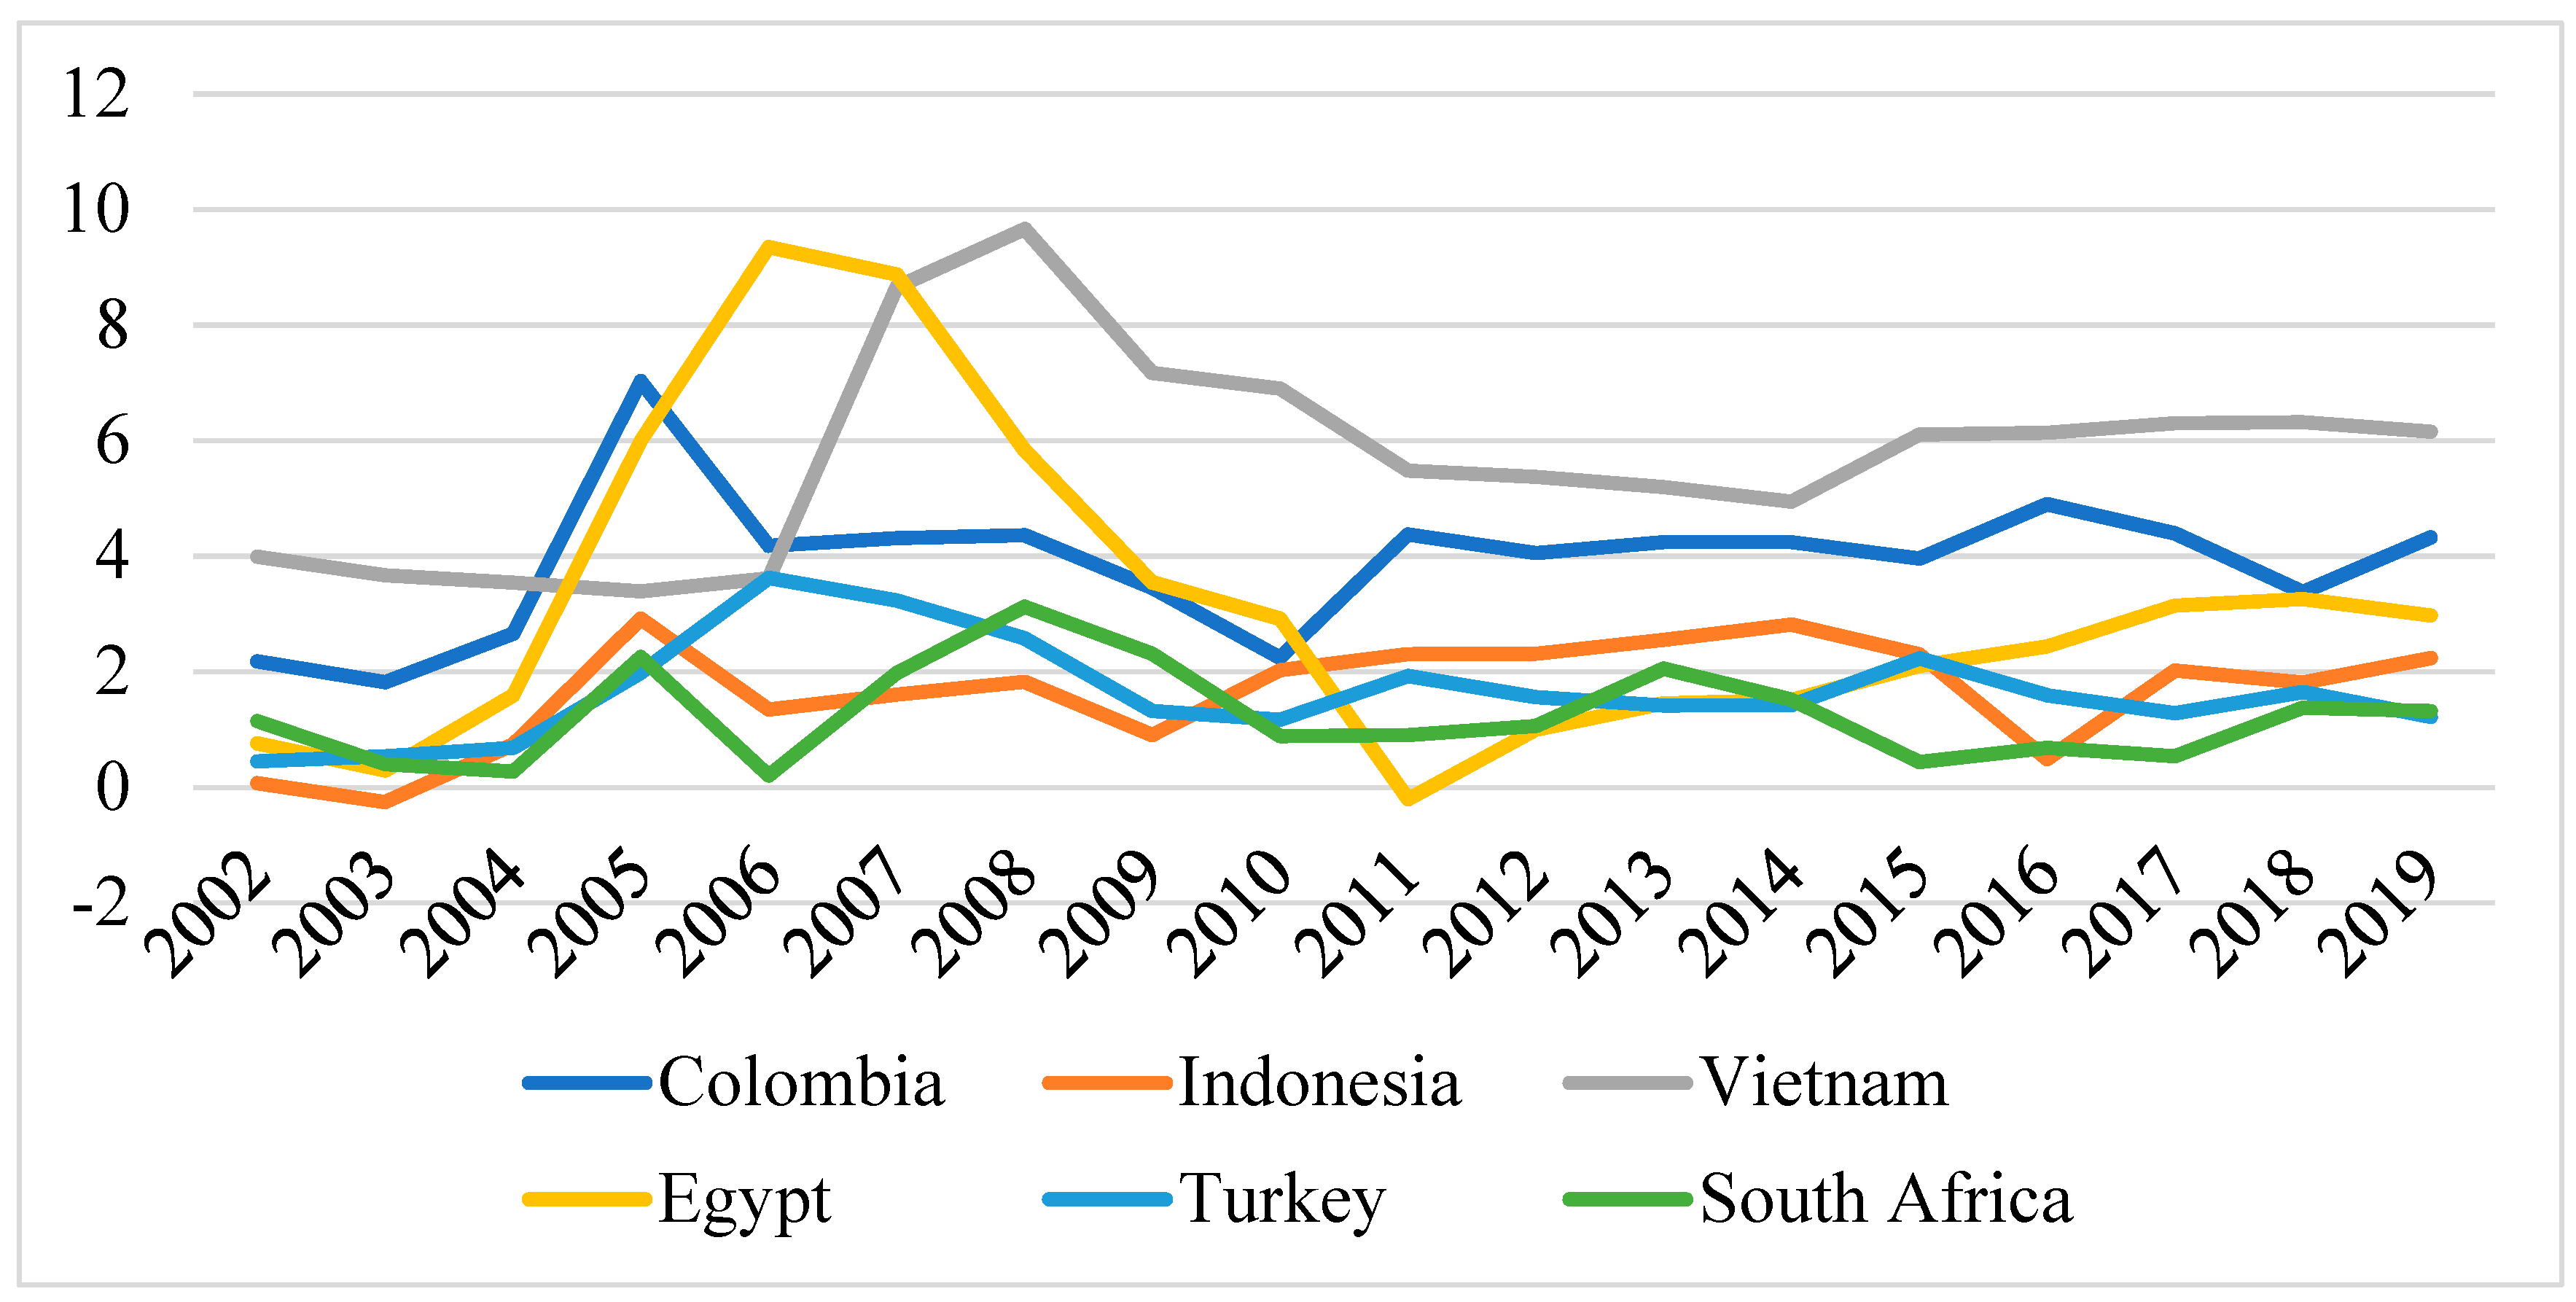
3.1. Data and Sources
3.2. Model Specification
3.3. Methodology
4. Empirical Results
5. Discussion
6. Conclusions and Suggestions
Author Contributions
Funding
Data Availability Statement
Conflicts of Interest
Appendix A

| FDI | GDP | Inflation | Exchange Rate | Trade Openness | CC | GE | PV | RL | RQ | VA | |
|---|---|---|---|---|---|---|---|---|---|---|---|
| FDI | 1 | 0.306 | −0.059 | 0.457 | 0.565 | −0.286 | −0.226 | 0.274 | −0.171 | −0.256 | −0.534 |
| GDP | 0.306 | 1 | 0.140 | 0.320 | 0.369 | −0.262 | −0.148 | 0.105 | −0.132 | −0.242 | −0.351 |
| Inflation | −0.059 | 0.140 | 1 | −0.018 | −0.127 | −0.236 | −0.254 | −0.077 | −0.104 | −0.271 | −0.241 |
| Trade openness | 0.561 | 0.140 | −0.018 | 1 | 0.804 | −0.024 | −0.005 | 0.645 | −0.016 | −0.403 | −0.581 |
| Exchange rate | 0.457 | 0.369 | −0.127 | 0.804 | 1 | −0.460 | −0.222 | 0.471 | −0.387 | −0.552 | −0.465 |
| CC | 0.141 | −0.262 | −0.353 | −0.024 | −0.668 | 1 | 0.512 | 0.519 | 0.733 | 0.669 | 0.482 |
| GE | 0.521 | −0.148 | −0.551 | −0.052 | −0.108 | 0.512 | 1 | 0.3 | 0.411 | 0.125 | −0.226 |
| PV | 0.332 | 0.105 | −0.205 | 0.645 | −0.554 | 0.519 | 0.31 | 1 | 0.037 | 0.663 | −0.068 |
| RL | −0.041 | −0.132 | −0.3913 | 0.016 | −0.508 | 0.733 | 0.411 | 0.037 | 1 | 0.212 | 0.655 |
| RQ | 0.069 | 0.242 | 0.1443 | −0.404 | −0.574 | 0.669 | 0.125 | 0.663 | 0.212 | 1 | 0.324 |
| VA | −0.606 | −0.358 | 0.125 | −0.581 | −0.568 | 0.482 | −0.226 | −0.068 | 0.655 | 0.324 | 1 |
| FDI | GDP | Inflation | Exchange Rate | Trade Openness | CC | GE | PV | RL | RQ | VA | |
|---|---|---|---|---|---|---|---|---|---|---|---|
| FDI | 1 | 0.369 | −0.058 | 0.457 | 0.567 | −0.282 | −0.226 | 0.274 | −0.171 | −0.257 | −0.534 |
| GDP | 0.306 | 1 | 0.140 | 0.369 | 0.320 | −0.262 | 0.148 | 0.105 | −0.132 | −0.242 | −0.351 |
| Inflation | 0.059 | 0.140 | 1 | −0.127 | −0.018 | −0.216 | −0.221 | −0.021 | −0.104 | −0.373 | −0.181 |
| Exchange rate | 0.454 | 0.368 | −0.127 | 1 | 0.804 | −0.910 | −0.180 | 0.891 | −0.901 | −0.911 | −0.991 |
| Trade openness | 0.565 | 0.329 | −0.018 | 0.804 | 1 | −0.243 | −0.054 | 0.645 | −0.016 | −0.403 | −0.581 |
| CC | 0.014 | −0.262 | −0.236 | −0.279 | −0.243 | 1 | 0.848 | 0.132 | 0.711 | 0.833 | 0.642 |
| GE | 0.154 | 0.201 | −0.254 | −0.222 | −0.054 | 0.848 | 1 | 0.321 | 0.744 | 0.838 | 0.685 |
| PV | −0.022 | −0.191 | −0.077 | 0.475 | 0.645 | 0.132 | 0.321 | 1 | 0.403 | −0.018 | −0.075 |
| RL | 0.018 | 0.410 | −0.104 | −0.387 | −0.016 | 0.711 | 0.744 | 0.403 | 1 | 0.637 | 0.379 |
| RQ | 0.165 | 0.190 | −0.273 | −0.522 | −0.403 | 0.833 | 0.838 | −0.018 | 0.637 | 1 | 0.775 |
| VA | 0.08 | 0.401 | −0.241 | −0.465 | −0.581 | 0.642 | 0.685 | −0.075 | 0.379 | 0.775 | 1 |
| ADF-Fisher Unit Root Test | ||||||||
|---|---|---|---|---|---|---|---|---|
| BRIC Economies | CIVETS Economies | |||||||
| At Level | Statistic | Probability | Statistic | Probability | Statistic | Probability | Statistic | Probability |
| LnFDI | 17.914 | 0.717 | 35.971 | 0.000 | 33.069 | 0.109 | 60.252 | 0.000 |
| LnGDP | 15.206 | 0.201 | 37.382 | 0.001 | 45.691 | 0.002 | 71.436 | 0.000 |
| LnInfla | 11.754 | 0.162 | 42.917 | 0.000 | 46.820 | 0.001 | 69.398 | 0.000 |
| LnExch | 2.932 | 0.936 | 16.294 | 0.018 | 21.281 | 0.003 | 30.093 | 0.001 |
| LnTrade | 10.659 | 0.227 | 23.336 | 0.003 | 16.607 | 0.165 | 66.99 | 0.000 |
| CC | 18.911 | 0.153 | 14.807 | 0.003 | 18.056 | 0.114 | 59.113 | 0.002 |
| GE | 5.241 | 0.731 | 22.481 | 0.004 | 17.891 | 0.119 | 67.761 | 0.021 |
| PV | 10.152 | 0.254 | 32.822 | 0.000 | 17.526 | 0.13 | 65.320 | 0.000 |
| RL | 10.303 | 0.244 | 15.850 | 0.014 | 6.078 | 0.812 | 66.829 | 0.000 |
| RQ | 16.355 | 0.476 | 19.496 | 0.012 | 10.565 | 0.566 | 66.091 | 0.026 |
| VA | 7.868 | 0.699 | 15.864 | 0.007 | 5.649 | 0.832 | 57.806 | 0.039 |
| Dependent Variable: LnFDI | ||||
|---|---|---|---|---|
| BRIC | CIVETS | |||
| Variable | Coefficient | Prob. | Coefficient | Prob. |
| C | −1.1791 | 0.002 | −0.0618 | 0.002 |
| LnGDP | 0.0191 | 0.029 | 0.0482 | 0.027 |
| LnInfla | −0.7191 | 0.001 | −0.3921 | 0.638 |
| LnExch | −0.9101 | 0.023 | 0.0571 | 0.036 |
| LnTrade | 1.1891 | 0.000 | 1.1925 | 0.000 |
| CC | −0.7808 | 0.012 | 0.1573 | 0.023 |
| PV | 0.2281 | 0.038 | 0.0831 | 0.036 |
| RL | 0.6289 | 0.026 | ||
| RQ | 0.3682 | 0.381 | 0.8061 | 0.000 |
| GE | −0.7281 | 0.481 | 0.3801 | 0.361 |
| VA | −0.3791 | 0.000 | ||
| R-squared | 0.4528 | 0.5382 | ||
| Adjusted R-squared | 0.4101 | 0.4981 | ||
| Durbin–Watson stat | 1.5022 | 1.2912 | ||
| Obs. | 72 | 108 | ||
| Dependent Variable: LnFDI | ||||
|---|---|---|---|---|
| BRIC | CIVETS | |||
| Variable | Coefficient | Prob. | Coefficient | Prob. |
| C | −2.8012 | 0.279 | 0.1412 | 0.805 |
| LnGDP | 0.0391 | 0.026 | 0.0038 | 0.000 |
| LnInfla | −0.0321 | 0.102 | −0.0037 | 0.336 |
| LnExch | −0.0192 | 0.258 | 0.006 | 0.929 |
| LnTrade | 1.2019 | 0.067 | 0.4005 | 0.000 |
| Lagged FDI | 0.0380 | 0.000 | ||
| CC | −0.3691 | 0.027 | 0.1924 | 0.023 |
| PV | 0.1801 | 0.291 | 0.1316 | 0.001 |
| RL | 0.1791 | 0.182 | ||
| RQ | 0.3791 | 0.291 | 0.2653 | 0.781 |
| GE | −0.0902 | 0.081 | 0.3981 | 0.299 |
| VA | −0.389 | 0.065 | ||
| R-squared | 0.6381 | 0.899 | ||
| Adjusted R-squared | 0.6071 | 0.088 | ||
| F-statistic | 51.1174 | 51.444 | ||
| Prob(F-statistic) | 0.0000 | 0.000 | ||
| Durbin–Watson stat | 1.969 | 1.709 | ||
| Obs. | 68 | 102 | ||
| Model 1 | Model 2 | Model 3 | Model 4 | Model 5 | Model 6 | |||||||
|---|---|---|---|---|---|---|---|---|---|---|---|---|
| Variable | Coeff. | Prob. | Coeff. | Prob. | Coeff. | Prob. | Coeff. | Prob. | Coeff. | Prob. | Coeff. | Prob. |
| GDP | −0.024 | 0.311 | 0.006 | 0.795 | 0.005 | 0.809 | −0.002 | 0.919 | 0.027 | 0.083 | 0.012 | 0.512 |
| Inflation | 0.035 | 0.295 | −0.030 | 0.423 | −0.037 | 0.401 | −0.028 | 0.553 | −0.037 | 0.012 | −0.039 | 0.189 |
| Real exchange rate | −0.103 | 0.000 | −0.091 | 0.000 | −0.088 | 0.000 | −0.089 | 0.000 | −0.097 | 0.000 | −0.087 | 0.021 |
| Trade openness | 0.168 | 0.020 | 0.166 | 0.000 | 0.174 | 0.001 | 0.205 | 0.004 | 0.265 | 0.002 | 0.291 | 0.001 |
| PV | 0.001 | 0.996 | 0.041 | 0.201 | 0.039 | 0.331 | 0.045 | 0.275 | 0.088 | 0.102 | 0.078 | 0.781 |
| GE | −0.158 | 0.002 | −0.162 | 0.003 | −0.181 | 0.003 | −0.201 | 0.002 | −0.261 | 0.103 | ||
| RQ | 0.072 | 0.075 | −0.012 | 0.905 | 0.076 | 0.191 | 0.079 | 0.041 | ||||
| CC | 0.045 | 0.481 | −0.107 | 0.087 | 0.096 | 0.002 | ||||||
| RL | 0.152 | 0.002 | 0.189 | 0.057 | ||||||||
| VA | 0.157 | 0.003 | ||||||||||
| R-squared | 0.410 | 0.487 | 0.488 | 0.492 | 0.547 | 0.541 | ||||||
| Adjusted R-squared | 0.366 | 0.439 | 0.432 | 0.446 | 0.481 | 0.478 | ||||||
| F-statistic | 9.197 | 10.293 | 8.715 | 8.458 | 8.321 | 8.218 | ||||||
| Prob(F-statistic) | 0.000 | 0.000 | 0.000 | 0.000 | 0.000 | 0.000 | ||||||
| Durbin–Watson stat | 1.005 | 1.102 | 1.103 | 1.189 | 1.355 | 1.378 | ||||||
| Obs. | 72 | 72 | 72 | 72 | 72 | 72 | ||||||
| Model 1 | Model 2 | Model 3 | Model 4 | Model 5 | Model 6 | |||||||
|---|---|---|---|---|---|---|---|---|---|---|---|---|
| Variable | Coeff. | Prob. | Coeff. | Prob. | Coeff. | Prob. | Coeff. | Prob. | Coeff. | Prob. | Coeff. | Prob. |
| GDP | 0.089 | 0.101 | 0.081 | 0.029 | 0.070 | 0.229 | 0.073 | 0.212 | 0.027 | 0.062 | 0.027 | 0.616 |
| Inflation | −0.053 | 0.171 | −0.043 | 0.065 | −0.620 | 0.058 | −0.056 | 0.349 | −0.019 | 0.071 | −0.022 | 0.695 |
| Real exchange rate | 0.014 | 0.003 | 0.015 | 0.037 | 0.010 | 0.015 | 0.012 | 0.089 | 0.026 | 0.000 | 0.024 | 0.023 |
| Trade openness | 0.237 | 0.000 | 0.248 | 0.000 | 0.361 | 0.000 | 0.361 | 0.000 | 0.075 | 0.000 | 0.075 | 0.397 |
| PV | −0.03 | 0.036 | −0.039 | 0.036 | 0.101 | 0.791 | 0.102 | 0.793 | 0.061 | 0.093 | 0.065 | 0.127 |
| GE | 0.023 | 0.12 | −0.584 | 0.000 | −0.621 | 0.000 | −0.281 | 0.005 | −0.272 | 0.083 | ||
| RQ | 0.435 | 0.000 | 0.419 | 0.000 | 0.441 | 0.000 | 0.445 | 0.000 | ||||
| CC | 0.076 | 0.516 | 0.037 | 0.076 | 0.034 | 0.743 | ||||||
| VA | −0.234 | 0.000 | 0.237 | 0.000 | ||||||||
| RL | −0.021 | 0.880 | ||||||||||
| R-squared | 0.427 | 0.431 | 0.448 | 0.454 | 0.555 | 0.551 | ||||||
| Adjusted R-squared | 0.394 | 0.412 | 0.409 | 0.416 | 0.514 | 0.509 | ||||||
| F-statistic | 9.191 | 10.881 | 11.291 | 11.913 | 13.611 | 12.307 | ||||||
| Prob(F-statistic) | 0.000 | 0.000 | 0.000 | 0.000 | 0.000 | 0.000 | ||||||
| Durbin–Watson stat | 0.692 | 0.789 | 0.835 | 0.894 | 0.961 | 0.960 | ||||||
| Obs. | 108 | 108 | 108 | 108 | 108 | 108 | ||||||
References
- Adam, Anokye Mohammed. 2020. Susceptibility of Stock Market Returns to International Economic Policy: Evidence from Effective Transfer Entropy of Africa with the Implication for Open Innovation. Journal of Open Innovation: Technology, Market, and Complexity 6: 71. [Google Scholar] [CrossRef]
- Ahlquist, John. 2006. Economic policy, institutions, and capital flows: Portfolio and direct investment flows in developing countries. International Studies Quarterly 50: 681–704. [Google Scholar]
- Ajide, Kazeem Bello, and Ibrahim Dolapo Raheem. 2016. Institutions—FDI nexus in ECOWAS countries. Journal of African Studies 17: 319–41. [Google Scholar] [CrossRef]
- Akbar, Minhas, and Ahsan Akbar. 2015. An empirical analysis of foreign direct investment in Pakistan. Studies in Business and Economics 10: 5–15. [Google Scholar] [CrossRef]
- Alam, Abdullah, and Syez Zulfiqar Ali Shah. 2013. Determinants of foreign direct investment in OECD member countries. Journal of Economic Studies 40: 515–27. [Google Scholar] [CrossRef]
- Anand, Prathivadi, Flavio Comim, and Shailaja Fennell. 2019. BRICS and emerging economies: An assessment. In Handbook of BRICS and Emerging Economies. Edited by Prathivadi Anand, Shailaja Fennell and Flavio Comim. New York: Oxford University Press. [Google Scholar]
- Antwi, Samuel, and Xicang Zhao. 2013. Impact of Foreign Direct Investment and Economic Growth in Ghana: A Cointegration Analysis. International Journal of Business and Social Research 3: 64–74. [Google Scholar] [CrossRef]
- Anwar, Amar, and Ichiro Iwasaki. 2021. Institutions and FDI from BRICS countries: A meta-analytic review. Empirical Economics 4: 1–52. [Google Scholar] [CrossRef]
- Anwar, Zeshan, and Talat Afza. 2014. Impact of governance indicators on FDI inflows: Empirical evidence from Pakistan. Caspian Journal of Applied Science Research 3: 16–23. [Google Scholar]
- Asiedu, Elisabeth. 2006. Foreign direct investment in Africa: The role of natural resources, market size, government policy, institutions and political stability. World Economy 29: 63–77. [Google Scholar] [CrossRef]
- Aslan, Ünal, and Zeynep Okten. 2010. The relations between FDI and democracy: Evidence from Turkey. International Research Journal of Finance and Economics 56: 111–23. [Google Scholar]
- Asongu, Simplice, Uduak Akpan, and Salisu Isihak. 2018. Determinants of foreign direct investment in fast-growing economies: Evidence from the BRICS and MINT countries. Financial Innovation 4: 1–17. [Google Scholar] [CrossRef]
- Asongu, Simplice, and Nicholas Odhiambo. 2018. Drivers of growth in fast emerging economies: A dynamic instrumental quantile approach to real output and its rates pf growth in BRICS and MINT countries. Applied Econometrics and International Development 18: 5–22. [Google Scholar]
- Axarloglou, Kostas, and Mike Pournarakis. 2005. Capital inflows in the Balkans: Fortune or misfortune? The Journal of Economic Asymmetries 2: 21–48. [Google Scholar] [CrossRef]
- Azam, Muhammad, and Muhammad Haseeb. 2021. Determinants of foreign direct investment in BRICS-does renewable and non-renewable energy matter? Energy Strategy Reviews 35: 100638. [Google Scholar] [CrossRef]
- Banga, Rashmi. 2006. The export-diversifying impact of Japanese and US foreign direct investments in the Indian manufacturing sector. Journal of International Business Studies 37: 558–68. [Google Scholar]
- Barro, Robert J., and Jong W. Lee. 1993. International Comparisons of Educational Attainment. Journal of Monetary Economics 32: 363–94. [Google Scholar] [CrossRef]
- Bbale, John Mayanja, and John Bosco Nnyanzi. 2016. Institutions and Foreign Direct Investment: Evidence from Sub-Saharan Africa Regions. Journal of Sustainable Development 9: 11–26. [Google Scholar] [CrossRef]
- Bose, Soumali, and Bindya Kohli. 2018. Study of FDI trends and patterns in BRICS economies during the period 1990–2015. Emerging Economy Studies 4: 78–101. [Google Scholar] [CrossRef]
- Botello, Juan Carlos, Martin Davila, and Carolyn Vargas. 2019. How does Colombia attract foreign direct investment? International Journal of Business and Economic Development 6: 1–14. [Google Scholar] [CrossRef]
- Brooks, Chris. 2014. Introductory Econometrics in Finance, 3rd ed. New York: Cambridge University Press. [Google Scholar]
- Buchanan, Bonnie, Quan Le, and Meenakshi Rishi. 2012. Foreign direct investment and institutional quality: Some empirical evidence. International Review of Financial Analysis 21: 81–89. [Google Scholar] [CrossRef]
- Buckley, Peter, and Mark Casson. 1976. The Future of the Multinational Enterprise. London: The MacMillan Press. [Google Scholar]
- Busse, Matthias, and Carsten Hefeker. 2009. Political risk, institutions and foreign direct investment. European Journal of Political Economy 23: 397–415. [Google Scholar] [CrossRef]
- Caves, Richard. 1971. International Corporations: The industrial Economics of Foreign Investment. Economica 38: 1–27. [Google Scholar]
- Çepni, Oğuzhan, Selçuk Gül, Yavuz Selim Hacıhasanoğlu, and Muhammed Hasan Yılmaz. 2020. Global uncertainties and portfolio flow dynamics of the BRICS countries. Research in International Business and Finance 54: 101277. [Google Scholar] [CrossRef]
- Chang, Shu Chen. 2005. The dynamic interactions among foreign direct investment, economic growth, exports and unemployment: Evidence from Taiwan. Economic Change and Restructuring 38: 235. [Google Scholar] [CrossRef]
- Chaudhuri, Sarbajit, and Shigemi Yabuuchi. 2010. Formation of special economic zone, liberalized FDI policy and agricultural productivity. International Review of Economics & Finance 19: 779–88. [Google Scholar] [CrossRef]
- Chodisetty, Murthy, and Deepshika Reddy. 2019. Impact of institutional indicators influence on FDI flows with reference to BRICS countries. An empirical research. International Journal of Innovative Technology and Exploring Engineering 8: 798–803. [Google Scholar] [CrossRef]
- Cieślik, Andrzej, and Michael Ryan. 2005. Location Determinants of Japanese Multinationals in Poland: Do Special Economic Zones Really Matter for Investment Decisions? Journal of Economic Integration 20: 475–96. [Google Scholar] [CrossRef][Green Version]
- Cleeve, Emmanuel. 2012. Political and institutional impediments to foreign direct investment inflows to sub-Saharan Africa. Thunderbird International Business Review 54: 469–77. [Google Scholar] [CrossRef]
- Coe, David, Elhanan Helpman, and Alexander Hoffmaister. 2009. International R&D spillovers and institutions. European Economic Review 53: 723–41. [Google Scholar] [CrossRef]
- Dakhlaoui, Imen, and Chaker Aloui. 2016. The interactive relationship between the US economic policy uncertainity and BRIC stock markets. International Economics 146: 141–57. [Google Scholar] [CrossRef]
- Daude, Christian, and Ernesto Stein. 2007. The quality of institutions and foreign direct investment. Economic & Politics 19: 317–44. [Google Scholar] [CrossRef]
- Delaunay, Christian, and Richard Torrisi. 2012. FDI in Vietnam: An empirical study of an economy in transition. Journal of Emerging Knowledge on Emerging Markets, 4. [Google Scholar] [CrossRef]
- Dua, Pami, and Reetika Garg. 2015. Macroeconomic determinants of foreign direct investment: Evidence from India. Journal of Developing Areas 49: 133–55. [Google Scholar]
- Duan, Yunyun. 2010. FDI in BRICs: A sector level analysis. International Journal of Business and Management 5: 46. [Google Scholar] [CrossRef][Green Version]
- Dumludag, Devrim. 2009. An analysis of the determinants of foreign direct investment in turkey: The role of the institutional context. Journal of Business Economics and Management 10: 15–30. [Google Scholar] [CrossRef]
- Dunning, John Harry. 1973. The determinants of international production. Oxford Economic Papers 25: 289–335. [Google Scholar]
- Dunning, John Harry. 1981. International Production and the Multinational Enterprise. London: George Allen and Unwin. [Google Scholar]
- Dunning, John Harry. 1988. Explaining International Production. London: Unwin Hyman. [Google Scholar]
- Dunning, John Harry. 1993. Multinational Enterprises and the Global Economy. Wokingham: Addison-Wesley. [Google Scholar]
- Dunning, John Harry, and Sarianna Lundan. 2008. Multinational Enterprises and the Global Economy, 2nd ed. Cheltenham: Edward Elgar. [Google Scholar]
- Efeoglu, Ibrahim, and Bryan Christiansen. 2014. Turkey: A rising civets star? In Handbook of Research on Global Business Opportunities. Edited by Bryan Christiansen. Pennsylvania: IGI Global. [Google Scholar]
- Epaphra, Manamba, and John Massawe. 2017. The effect of corruption on foreign direct investment: A panel data study. Turkish Economy Review 4: 19–54. [Google Scholar]
- Eren, Mesult, and Alfredo Jimenez. 2015. Institutional quality similarity, corruption distance and inward FDI in Turkey. Journal for East European Management Studies 20: 88–101. [Google Scholar] [CrossRef]
- Erkekoglu, Hatice, and Zerrin Kilicarslan. 2016. Do political risks affect the foreign direct investment inflows to host countries. Journal of Business, Economics and Finance 5: 218–32. [Google Scholar] [CrossRef]
- Fails, Matthew. 2012. Inequality, Institutions, and the Risks to Foreign Investment. International Studies Quarterly 54: 516–29. [Google Scholar] [CrossRef]
- Farzanegan, Mohammad, Mai Hassan, and Ahmed Badreldin. 2020. Economic liberalization in Egypt: A way to reduce the shadow economy? Journal of Policy Modeling 42: 307–27. [Google Scholar] [CrossRef]
- Fernandes, Ana, and Caroline Paunov. 2012. Foreign direct investment in services and manufacturing productivity: Evidence from Chile. Journal of Development Economics 97: 305–21. [Google Scholar] [CrossRef]
- Fowowe, Babajide, and Mohammed Shuaibu. 2014. Is foreign direct investment good for the poor? New evidence from African countries. Economic Change and Restructuring 47: 321. [Google Scholar] [CrossRef]
- Gammoudi, Mouna, and Mondher Cherif. 2016. Capital account openness, political institutions and FDI in MENA region: An empirical investigation. Journal of Economic Development 41: 53–76. [Google Scholar]
- Gangi, Yagoub, and Rafid Abdulrazak. 2012. The impact of governance on FDI flows to African countries. World Journal of Entrepreneurship, Management and Sustainable Development 8: 162–69. [Google Scholar] [CrossRef]
- Gorodnichenko, Yuriy, Jan Svejnar, and Katherine Terrell. 2014. When does FDI have positive spillovers? Evidence from 17 transition market economies. Journal of Comparative Economics 42: 954–69. [Google Scholar] [CrossRef]
- Guerra Baron, Angélica. 2014. Un estudio comparado de las politicas exteriores economicas: El case de los paises CIVETS. Papel Politico 19: 179–210. [Google Scholar] [CrossRef]
- Guo, Peng, Huiming Zhu, and Wanhai You. 2018. Asymmetric dependence between economic policy uncertainty and stock market returns in G7 and BRIC: A quantile regression approach. Finance Research Letters 25: 251–58. [Google Scholar] [CrossRef]
- Gupta, Priya, and Archana Singh. 2016. Determinants of Foreign Direct Investment Inflows in BRICS Nations: A Panel Data Analysis. Emerging Economy Studies 2: 181–98. [Google Scholar] [CrossRef]
- Gwenhamo, Farayi, and Johannes Fedderke. 2013. The composition of foreign capital stocks in South Africa: The role of institutions, domestic risk and neighbourhood effects. Economic Modelling 35: 763–70. [Google Scholar] [CrossRef]
- Ha, Yoo Jung, and Axèle Giroud. 2015. Competence-creating subsidiaries and FDI technology spillovers. International Business Review 24: 605–14. [Google Scholar] [CrossRef]
- Hintošová, Aneta Bobenič. 2021. Inward FDI: Characterizations and Evaluation. Encyclopedia 1: 1026–37. [Google Scholar] [CrossRef]
- Hsiao, Cheng. 2007. Panel data analysis: Advantages and disadvantages. Test 16: 1–22. [Google Scholar] [CrossRef]
- Hung, Ngo Thai. 2021. Directional Spillover Effects Between BRICS Stock Markets and Economic Policy Uncertainty. Asia-Pacific Financial Markets 28: 429–48. [Google Scholar] [CrossRef]
- Hymer, Stephen. 1976. The International Operations of National Firms: A Study of Direct Foreign Investment. Cambridge: MIT Press. [Google Scholar]
- Iman, Mohamad, and Akiya Nagata. 2005. Liberalization policy over foreign direct investment and the promotion of local firms development in Indonesia. Technology in Society 27: 399–411. [Google Scholar] [CrossRef]
- IMF. 1993. Balance of Payments Manual: Fifth Edition (BPM5). Washington, DC: International Monetary Fund. [Google Scholar]
- Iwasaki, Ichiro, and Keiko Suganuma. 2015. Foreign direct investment and regional economic development in Russia: An econometric assessment. Economic Change and Restructuring 48: 209. [Google Scholar] [CrossRef][Green Version]
- Jadhav, Pravin. 2012. Determinants of foreign direct investment in BRICS economies: Analysis of economic, institutional and political factor. Procedia—Social and Behavioral Sciences 37: 5–15. [Google Scholar] [CrossRef]
- Jadhav, Pravin, and Vijaya Katti. 2012. Institutional and political determinants of foreign direct investment: Evidence from BRICS economies. Poverty and Public Policy 4: 49–57. [Google Scholar]
- Jensen, Nathan. 2008. Political Risk, Democratic Institutions, and Foreign Direct Investment. The Journal of Politics 70: 1040–52. [Google Scholar] [CrossRef]
- John, Elena, Laura Wallenius, and Mikael Collan. 2014. The impact of Euro Area macroeconomic announcements on CIVETS stock market. Procedia Economics and Finance 15: 27–37. [Google Scholar] [CrossRef]
- Kang, Sung Jin, and Hong Shik Lee. 2007. The determinants of location choice of South Korean FDI in China. Japan and the World Economy 19: 441–60. [Google Scholar] [CrossRef]
- Kindleberger, Charles Poor. 1969. American Business Abroad: Six Lectures on Direct Investment. New Haven: Yale University Press. [Google Scholar]
- Kinuthia, Bethuel Kinyanjui, and Syed Mansoob Murshed. 2014. FDI determinants: Kenya and Malaysia compared. Journal of Policy Modeling 37: 388–400. [Google Scholar] [CrossRef]
- Kishor, Nawal, and Raman Preet Singh. 2015. Determinants of FDI and its impact on BRICS countries: A panel data approach. Transnational Corporations Review 7: 269–78. [Google Scholar] [CrossRef]
- Kiyota, Kozo, and Shujiro Urata. 2004. Exchange Rate, Exchange Rate Volatility and Foreign Direct Investment. The World Economy 27: 1501–36. [Google Scholar] [CrossRef]
- Knickerbocker, Frederick. 1974. Oligopolistic Reaction and Multinational Enterprise. Cambridge. Cambridge, MA: Harvard Business School Division of Research. [Google Scholar]
- Kurul, Zühal, and Yasemin Yalta. 2017. Relationship between institutional factors and FDI flows in developing countries: New evidence from dynamic panel estimation. Economies 5: 17. [Google Scholar] [CrossRef]
- Kwoba, Margaret, and Patrick Kibati. 2016. Impact of Selected Macro Economic Variables on Foreign Direct Investment in Kenya. International Journal of Economics, Finance and Management Sciences 4: 107–16. [Google Scholar] [CrossRef]
- Kyrkilis, Dimitrios, and Pantelis Pantelidis. 2003. Macroeconomic determinants of outward foreign direct investment. International Journal of Social Economics 30: 827–36. [Google Scholar] [CrossRef]
- Labes, Sebastian Andrei. 2015. FDI determinants in BRICS. CES Working Papers 7: 296–308. [Google Scholar]
- Lee, Hoon, Glen Biglaiser, and Joseph Staats. 2014. The effects of political risk on different entry modes of foreign direct investment. International Interactions 40: 683–710. [Google Scholar] [CrossRef]
- Lemoine, Françoise. 2013. From foreign trade to international investment: A new step in China’s integration with the world economy. Economic Change and Restructuring 46: 25–43. [Google Scholar] [CrossRef]
- Leong, Chee Kian. 2013. Special economic zones and growth in China and India: An empirical investigation. International Economics and Economic Policy 10: 549–67. [Google Scholar] [CrossRef]
- Li, Yameng, Ruosu Gao, and Jingyi Wang. 2021. Determinants of EMNEs’ Entry Mode Decision with Environmental Volatility Issues: A Review and Research Agenda. Journal of Risk and Financial Management 14: 500. [Google Scholar] [CrossRef]
- Liargovas, Panagiotis, and Konstantinos Skandalis. 2012. Foreign direct investment and trade openness: The case of developing economies. Social Indicators Research 102: 323–31. [Google Scholar] [CrossRef]
- Lily, Jaratin, Mori Kogid, Dullah Mulok, Lim Sang, and Rozilee Asid. 2014. Exchange Rate Movement and Foreign Direct Investment in ASEAN Economies. Economics Research International 2014: 320949. [Google Scholar] [CrossRef]
- Lindblad, Thomas. 2015. Foreign Direct Investment in Indonesia: Fifty years of discourse. Bulletin of Indonesian Economic Studies 51: 217–37. [Google Scholar] [CrossRef]
- Mahembe, Edmore, and Nicholas Odhiambo. 2016. Does foreign direct investment cause economic growth? A dynamic panel data analysis for SADC countries. International Journal of Emerging Markets 11: 316–32. [Google Scholar] [CrossRef]
- Mahmoodi, Majid, and Elahe Mahmoodi. 2016. Foreign direct investment, exports and economic growth: Evidence from two panels of developing countries. Economic Research 29: 938–49. [Google Scholar] [CrossRef]
- Makabenta, Maria Peregrina. 2002. FDI Location and Special Economic Zones in the Philippines. Review of Urban & Regional Development Studies 14: 59–77. [Google Scholar] [CrossRef]
- Makoni, Patricia. 2018. Drivers of foreign direct investment in Egypt. Acta Universitatis Danubius Œconomica 14: 474–95. [Google Scholar]
- Maryam, Javeria, and Ashok Mittal. 2020. Foreign direct investment into BRICS: An empirical analysis. Transnational Corporations Review 12: 1–9. [Google Scholar] [CrossRef]
- Mason, Ryan, and Veselina Vracheva. 2017. The impact of inflation targeting on attractive foreign direct investment. The Journal of Applied Business and Economics 19: 79–94. [Google Scholar]
- Mehrara, Mohsen, Amin Haghnejad, Jalal Dehnavi, and Fereshteh Meybodi. 2010. Foreign direct investment, exports and economic growth in the developing countries: A panel data approach. Journal of Academic Research in Economics 2: 259–80. [Google Scholar]
- Mensi, Walid, Shawkat Hammoudeh, Juan Reboredo, and Khuong Nguyen. 2014. Do gobal factors impact BRICS stock markets? A quantile regression approach. Emerging Markets Review 19: 1–17. [Google Scholar] [CrossRef]
- Metaxas, Theodore, and Polyexni Kechagia. 2013. FDI through the imitation procedure: The case of China. Applied Econometrics and International Development 13: 145–60. [Google Scholar]
- Moghadam, Alireza Tavakol, Nur Syazwani Mazlan, Lee Chin, and Saifuzzaman Ibrahim. 2019. Mergers and Acquisitions and Greenfield Foreign Direct Investment in Selected ASEAN Countries. Journal of Economic Integration 34: 746–65. [Google Scholar]
- Najaf, Khakan, and Saleh Ashraf. 2016. Impact of terrorism, gas shortage and political instability on FDI inflows in Pakistan. Scientific Journal of Pure and Applied Sciences 5: 390–97. [Google Scholar] [CrossRef]
- Naude, Wim, and Waldo Krugell. 2007. Investigating geography and institutions as determinants of foreign direct investment in Africa using panel data. Applied Economics 39: 1223–33. [Google Scholar] [CrossRef]
- Ngô, Vi Dũng, Thi Bich Đào, and Ngoc Nguyn ễ. 2018. Economic and non-economic determinants of FDI inflows in Vietnam: A sub-national analysis. Post-Communist Economies 30: 693–712. [Google Scholar] [CrossRef]
- Nistor, Paula. 2015. FDI implications on BRICS economy growth. Procedia Economics and Finance 32: 981–85. [Google Scholar] [CrossRef]
- Pečarić, Mario, Tino Kusanović, and Pavle Jakovac. 2021. The Determinants of FDI Sectoral Structure in the Central and East European EU Countries. Economies 9: 66. [Google Scholar] [CrossRef]
- Pegkas, Panagiotis. 2015. The impact of FDI on economic growth in Eurozone countries. The Journal of Economic Asymmetries 12: 124–32. [Google Scholar] [CrossRef]
- Peres, Mihaela, Waqar Ameer, and Helian Xu. 2018. The impact of institutional quality on foreign direct investment inflows: Evidence for developed and developing countries. Economic Research-Ekonomska Istraživanja 31: 626–44. [Google Scholar] [CrossRef]
- Petrović-Ranđelović, Marija, Petar Mitić, Aleksandar Zdravković, Dušan Cvetanović, and Slobodan Cvetanović. 2020. Economic growth and carbon emissions: Evidence from CIVETS countries. Applied Economics 52: 1806–15. [Google Scholar] [CrossRef]
- Qureshi, Fiza, Saba Qureshi, Xuan Vinh Vo, and Ikramuddin Junejo. 2020. Revisiting the nexus among foreign direct investment, corruption and growth in developing and developed markets. Borsa Istanbul Review 21: 80–91. [Google Scholar] [CrossRef]
- Rashid, Mamunur, Xuan Looi, and Shao Wong. 2017. Political stability and FDI in the most competitive Asia Pacific countries. Journal of Financial Economic Policy 9: 140–55. [Google Scholar] [CrossRef]
- Sabir, Samina, Anum Rafique, and Kamran Abbas. 2019. Institutions and FDI: Evidence from developed and developing countries. Financial Innovation 5: 1–20. [Google Scholar] [CrossRef]
- Saidi, Yosra, Anis Ochi, and Houria Ghadri. 2013. Governance and FDI attractiveness: Some evidence from developing and developed countries. Global Journal of Management and Business Research Finance 13: 15–24. [Google Scholar]
- Sane, Malick. 2016. Determinants of foreign direct investment inflows to ECOWAS member countries: Panel data modeling and estimation. Modern Economy 7: 1517–42. [Google Scholar] [CrossRef]
- Seyoum, Mebratu, Renshui Wu, and Jihong Lin. 2014. Foreign Direct Investment and Trade Openness in Sub-Saharan Economies: A Panel Data Granger Causality Analysis. South African Journal of Economics 82: 402–21. [Google Scholar] [CrossRef]
- Shah, Mumtaz Hussain, and Zahid Ali. 2016. What Drives Foreign Direct Investment to BRICS? Putaj Humanities & Social Sciences 23: 51–66. [Google Scholar]
- Siddica, Asiya, and Tanzim Angkur. 2017. Does institution affect the inflo of FDI? A panel analysis of developed and developing countries. International Journal of Economics and Finance 9: 214–21. [Google Scholar] [CrossRef]
- Tomohara, Akinori, and Sadayuki Takii. 2011. Does globalization benefit developing countries? Effects of FDI on local wages. Journal of Policy Modelling 33: 511–21. [Google Scholar] [CrossRef]
- Tosun, Umur, Onur Yurdakul, and Varol Iyidogan. 2014. The relationship between corruption and foreign direct investment inflows in Turkey: An empirical investigation. Transylvanian Review of Administrative Sciences 42: 247–57. [Google Scholar]
- Tsaurai, Kunofiwa. 2018. Investigating the impact of inflation on foreign direct investment in Southern Africa. Economica 14: 597–611. [Google Scholar]
- Ucal, Meltem. 2014. Panel Data Analysis of Foreign Direct Investment and Poverty from the Perspective of Developing Countries. Procedia – Social Behavioral Sciences 109: 1101–5. [Google Scholar] [CrossRef]
- UNCTAD. 2018. World Investment Report 2018: Investment and New Industrial Policies. Sales No: E.18.II.D.4. New York: United Nations, United Nations Publications. [Google Scholar]
- UNCTAD. 2021. World Investment Report 2021. Available online: https://unctad.org/system/files/official-document/wir2021_en.pdf (accessed on 5 January 2021).
- UNCTAD. 2022. Benchmarks FDI Performance and Potential. Available online: https://unctad.org/press-material/unctad-benchmarks-fdi-performance-and-potential (accessed on 5 January 2021).
- Upadhyaya, Kamal, Rabindra Bhandari, and Robert Rainish. 2011. Exchange rate volatility and Foreign Direct Investment in South Asia. International Journal of Economic Policy in Emerging Economies 4: 366–77. [Google Scholar] [CrossRef]
- Uttama, Nathapornpan Piyaareekul. 2015. Foreign Direct Investment and the Poverty Reduction Nexus in Southeast Asia. In Poverty Reduction Policies and Practices in Developing Asia. Economic Studies in Inequality, Social Exclusion and Well-Being. Edited by Almas Heshmati, Esfandiar Maasoumi and Guanghua Wan. Singapore: Springer, pp. 281–98. [Google Scholar]
- Uttama, Nathapornpan Piyaareekul, and Nicolas Peridy. 2010. Some new insights into FDI determinants in MENA countries: An application of a spatial panel data model, 3: 314–29. International Journal of Economic Policy in Emerging Economies 3: 314–29. [Google Scholar]
- Vernon, Raymond. 1966. International Investment and International Trade in the Product Cycle. Quarterly Journal of Economics 80: 190–207. [Google Scholar]
- Vijayakumar, Narayanamurthy, Perumal Sridharan, and Kode Chandra Rao. 2010. Determinants of FDI in BRICS countries: A panel analysis. International Journal of Business Science and Applied Management 5: 1–13. [Google Scholar]
- Wei, Shang Jin. 2000. How taxing is corruption on international investors? Review of Economics and Statistics 82: 1–11. [Google Scholar]
- Wernick, David, Jerry Haar, and Shane Singh. 2009. Do governing institutions affect foreign direct investment inflows? New evidence from emerging economies. International Journal of Economics and Business Research 3: 317–22. [Google Scholar]
- Wijeweera, Albert, Renato Villano, and Brian Dollery. 2010. Economic Growth and FDI Inflows: A Stochastic Frontier Analysis. Journal of Developing Areas 43: 143–58. [Google Scholar] [CrossRef]
- Wong, Koi, and Tuck Cheong Tang. 2011. Foreign direct investment and employment in manufacturing and services sectors: Fresh empirical evidence from Singapore. Journal of Economic Studies 38: 313–30. [Google Scholar] [CrossRef]
- WTO. 2021. World Trade Statistical Review. Available online: https://www.wto.org/english/res_e/statis_e/wts2021_e/wts2021_e.pdf (accessed on 5 January 2021).
- Xaypanya, Phonesavanh, Poomthan Rangkakulnuwat, and Sasiwimon Warunsiri Paweenawat. 2015. The determinants of foreign direct investment in ASEAN: The first differencing panel data analysis. International Journal of Social Economics 42: 239–250. [Google Scholar]
- Yi, Yong, Wei Qi, and Dandan Wu. 2013. Are CIVETS the next BRICs? A comparative analysis from scientometrics perspective. Scientometrics 94: 615–28. [Google Scholar] [CrossRef]
- Zakari, Murtala. 2017. The Impact of Exchange Rate Fluctuations on Foreign Direct Investment in Nigeria. Journal of Finance and Accounting 5: 165–70. [Google Scholar] [CrossRef]


| Author(s) | Time Period | Sample | Findings |
|---|---|---|---|
| Busse and Hefeker (2007) | 1984–2003 | 83 developing economies | Certain institutional indicators influence FDI inflows, including law and order and VA. |
| Kurul and Yalta (2017) | 2002–2012 | 113 developing countries | Among the institutional factors, it is observed that GE, CC and VA determine the amount of the absorbed FDI. |
| Daude and Stein (2007) | 1982–2002 | 34 developed and developing economies | Better institutions attract FDI. Among the sub-indices, lack of commitment and government instability play a crucial role in discouraging inflows. |
| Wernick et al. (2009) | 1996–2006 | 64 emerging countries | Strong institutions promote FDI inflows. |
| Buchanan et al. (2012) | 1996–2006 | 164 developing and developed economies | FDI and institutional quality are positively related. Additionally, better institutions are negatively related to FDI volatility. |
| Erkekoglu and Kilicarslan (2016) | 2002–2012 | 91 countries | Political stability and absence of violence reduce FDI. |
| Qureshi et al. (2020) | 1996–2018 | 54 developed and developing economies | Lower corruption boosts FDI. There is a bidirectional association between FDI and corruption in both developed and developing economies. |
| Author(s) | Time Period | Sample | Findings |
|---|---|---|---|
| Asiedu (2006) | 1984–2000 | 22 sub-Saharan African countries | Political stability and less corruption attract FDI inflows. |
| Naude and Krugell (2007) | 1970–1990 | 43 African developing countries | Better institutions, focusing on political stability, promote FDI in the region. |
| Gangi and Abdulrazak (2012) | 1996–2000 | 50 countries in Africa | Among the indicators, it is observed that RL, GE and VA influence the amount of FDI inflows. |
| Cleeve (2012) | 1988–2008 | 40 sub-Saharan African countries | Better institutions attract FDI; however, political instability and corruption do not influence the amount of FDI inflows. |
| Ajide and Raheem (2016) | 2000–2013 | 15 countries ECOWAS | Poor institutions in the region discourage FDI. |
| Gammoudi and Cherif (2016) | 1985–2009 | 17 Middle East and North African (MENA) | Certain institutional factors, including democratic accountability and law and order, play a more important role in attracting FDI. |
| Bbale and Nnyanzi (2016) | 1996–2013 | 44 sub-Saharan African countries | Institutional quality is an FDI determinant in several groups of countries in the region, including SADC (Southern African Development Cooperation), EAC (East African Community) and ECOWAS (Economic Community of West African States). |
| Rashid et al. (2017) | 2000–2013 | 15 developing and developed economies in Asia Pacific | Political stability is the most important FDI determinant among the studied countries. |
| Author(s) | Time Period | Sample | Findings |
|---|---|---|---|
| Dumludag (2009) | 2006 | Turkey | Among the sub-indices of governance, low corruption plays a crucial role in attracting FDI inflows. |
| Aslan and Okten (2010) | 1970–2010 | Turkey | There is a uni-directional causal relation between democracy and FDI. |
| Jadhav (2012) | 2000–2009 | BRICS | Financial factors are more important in attracting FDI in BRICS economies compared to institutional factors. |
| Jadhav and Katti (2012) | 2000–2010 | BRICS | Among the indicators of institutional quality, it is observed that RQ and government effectives have a positive impact on FDI inflows. |
| Gwenhamo and Fedderke (2013) | 1960–2006 | South Africa | Better institutions, focusing on property rights, increase the volume of FDI. |
| Tosun et al. (2014) | 1992–2010 | Turkey | The impact of corruption on FDI inflows is negative in both short- and long-term. |
| Eren and Jimenez (2015) | 2002–2010 | Turkey | The amount of FDI inflows is higher when performed from economies that present similar corruption level to Turkey. |
| Makoni (2018) | 1980–2016 | Egypt | Improved institutional quality increased the country’s competitiveness towards foreign investors. |
| Asongu et al. (2018) | 2001–2011 | BRICS, MINT | Institutional quality does not play a significant role in attracting FDI. |
| Chodisetty and Reddy (2019) | 2002–2017 | BRICS | Among the studied countries, it is observed that FDI inflows are positively related to VA in Brazil and RQ is insignificant in the case of Russia. The indicators are positively associated to FDI inflows in China. |
| Dependent Variable | Definition | Source |
|---|---|---|
| Foreign direct investment, net inflows (% of GDP) (For brevity called FDI inflows). | Foreign direct investment shows net inflows in the recipient country from foreign investors, and is divided by GDP. | World Development Indicators (World Bank) |
| GDP growth annual % (for brevity called GPD) | Annual percentage growth rate of GDP at market prices based on constant local currency. Aggregates are based on constant 2015 prices, expressed in U.S. dollars. | World Development Indicators (World Bank) |
| Trade % GPD (For brevity called trade openness) | Trade is the sum of exports and imports of goods and services measured as a share of gross domestic product. | World Development Indicators (World Bank) |
| Real exchange rate | Real exchange rate is the nominal effective exchange rate (a measure of the value of a currency against a weighted average of several foreign currencies) divided by a price deflator or index of costs. | World Development Indicators (World Bank), authors’ calculations |
| Inflation GDP deflator (annual %) (For brevity called inflation) | Inflation as measured by the annual growth rate of the GDP implicit deflator shows the rate of price change in the economy as a whole. | World Development Indicators (World Bank) |
| Independent Variables | Definition | Expected Sign | Source |
|---|---|---|---|
| VA | Voice and accountability refer to the extent to which citizens are able to participate in selecting their government, freedom of expression, association and a free media (−2.5 to 2.5 scale) | + | Worldwide Governance Indicators (World Bank) |
| PV | Political stability and absence of violence refer to the likelihood of political instability and/or politically-motivated violence, including terrorism (−2.5 to 2.5 scale) | + | Worldwide Governance Indicators (World Bank) |
| GE | Government effectiveness refers to the quality of public services, civil service and the degree of its independence from political pressures (−2.5 to 2.5 scale) | + | Worldwide Governance Indicators (World Bank) |
| RQ | Regulatory quality refers to the ability of the government to formulate and implement sound policies and regulations that permit and promote private sector development (−2.5 to 2.5 scale) | + | Worldwide Governance Indicators (World Bank) |
| RL | Rule of law refers to the extent to which agents have confidence in and abide by the rules of society (−2.5 to 2.5 scale) | + | Worldwide Governance Indicators (World Bank) |
| CC | Control of corruption refers to the extent to which public power is exercised for private gain, including petty and grand forms of corruption. (−2.5 to 2.5 scale) | + | Worldwide Governance Indicators (World Bank) |
| Mean | Median | Maximum | Minimum | Std. Dev. | Jarque Bera | Obs. | |
|---|---|---|---|---|---|---|---|
| FDI | 11.354 | 11.364 | 13.354 | 9.302 | 0.045 | 3.36 | 72 |
| GDP | 14.174 | 15.027 | 23.03 | 0.998 | 3.883 | 8.489 | 72 |
| Inflation | 15.905 | 15.749 | 33.26 | 8.589 | 4.890 | 28.201 | 72 |
| Real exchange rate | 90.602 | 89.244 | 112.97 | 57.593 | 4.89 | 16.034 | 72 |
| Trade openness | 51.398 | 54.505 | 73.278 | 30.905 | 11.814 | 4.194 | 72 |
| PV | −0.671 | −0.582 | 0.329 | −1.513 | 0.418 | 1.171 | 72 |
| RL | −0.366 | −0.349 | 0.177 | −0.97 | 0.333 | 4.847 | 72 |
| RQ | −0.232 | −0.272 | 0.309 | −0.546 | 0.188 | 10.545 | 72 |
| CC | −0.474 | −0.422 | 0.165 | −1.132 | 0.326 | 2.098 | 72 |
| VA | −0.402 | −0.075 | 0.571 | −1.748 | 0.898 | 9.253 | 72 |
| GE | −0.072 | −0.091 | 0.518 | −0.5 | 0.237 | 1.208 | 72 |
| Mean | Median | Maximum | Minimum | Std. Dev. | Jarque Bera | Obs. | |
|---|---|---|---|---|---|---|---|
| FDI | 8.735 | 8.123 | 15.489 | 5.568 | 2.162 | 22.88 | 108 |
| GDP | 10.515 | 10.855 | 12.626 | 1.002 | 2.369 | 2.162 | 108 |
| Inflation | 14.208 | 12.626 | 43.397 | 5.632 | 5.632 | 22.635 | 108 |
| Real exchange rate | 53.591 | 39.162 | 85.361 | 27.162 | 2.162 | 22.88 | 108 |
| Trade openness | 73.364 | 57.231 | 96.223 | 36.069 | 43.883 | 88.489 | 108 |
| PV | −0.746 | −0.768 | 0.481 | −2.374 | 0.713 | 1.171 | 108 |
| RL | −0.27 | −0.317 | 0.255 | −0.914 | 0.301 | 6.679 | 108 |
| RQ | −0.089 | −0.09 | 0.804 | −0.923 | 0.446 | 6.609 | 108 |
| CC | −0.342 | −0.393 | 0.568 | −1.144 | 0.347 | 3.419 | 108 |
| VA | −0.385 | −0.165 | 0.715 | −1.538 | 0.722 | 7.941 | 108 |
| GE | −0.062 | −0.053 | 0.692 | −0.877 | 0.351 | 1.158 | 108 |
| Dependent Variable: LnFDI | ||||
|---|---|---|---|---|
| BRIC | CIVETS | |||
| Variable | Coefficient | Prob. | Coefficient | Prob. |
| LnGDP | −0.0161 | 0.034 | 0.0364 | 0.000 |
| LnExch | −0.2353 | 0.000 | 0.0670 | 0.000 |
| LnInfla | −0.0667 | 0.024 | −0.6065 | 0.000 |
| LnTrade | 0.7153 | 0.000 | 0.1807 | 0.007 |
| PV | 0.2102 | 0.038 | 0.1807 | 0.007 |
| RL | 0.4675 | 0.013 | ||
| GE | −0.5388 | 0.003 | −0.5862 | 0.034 |
| CC | −0.3963 | 0.011 | 0.2264 | 0.340 |
| RQ | 0.2841 | 0.077 | 0.9618 | 0.000 |
| VA | −0.6065 | 0.000 | ||
| R-Squared | 0.5265 | 0.5251 | ||
| Adjusted R-squared | 0.4665 | 0.4968 | ||
| Durbin–Watson stat | 1.386 | 1.1003 | ||
| Akaike info criterion | 0.0282 | 0.8894 | ||
| Schwarz criterion | 0.3126 | 1.0632 | ||
| Hannan–Quinn criterion | 0.1413 | 0.9598 | 0.9598 | |
| Obs. | 72 | 108 | 108 | |
| Dependent Variable: LnFDI | ||||
|---|---|---|---|---|
| BRIC | CIVETS | |||
| Variable | Coefficient | Prob. | Coefficient | Prob. |
| C | −3.9462 | 0.022 | −1.6595 | 0.354 |
| LnGDP | 0.0553 | 0.043 | 0.1093 | 0.013 |
| LnInfla | −0.0616 | 0.143 | −0.7181 | 0.003 |
| LnExch | −0.1473 | 0.101 | 0.032 | 0.335 |
| LnTrade | 1.1481 | 0.000 | 0.9191 | 0.000 |
| CC | −0.4038 | 0.039 | 0.1561 | 0.025 |
| PV | 0.1243 | 0.102 | 0.2483 | 0.003 |
| RL | 0.4617 | 0.079 | ||
| RQ | 0.3735 | 0.195 | 0.0434 | 0.841 |
| GE | −0.5821 | 0.005 | 0.2831 | 0.165 |
| VA | −0.442 | 0.005 | ||
| R-squared | 0.6887 | 0.921 | ||
| Adjusted R-squared | 0.6253 | 0.911 | ||
| F-statistic | 10.8684 | 92.582 | ||
| Prob(F-statistic) | 0.0000 | 0.000 | ||
| Durbin–Watson stat | 1.8973 | 1.735 | ||
| Chi-Sq. Statistic | 16.42 | 51.414 | ||
| Chi-Sq. d.f. | 9 | 0 | ||
| Prob. | 0.018 | 0.000 | ||
| Obs. | 72 | 108 | ||
| BRIC | CIVETS | |||
|---|---|---|---|---|
| Cross-section dependence | Breusch–Pagan LM test | 1.571 (0.000) | 1.981 (0.000) | There is no cross-section. |
| Heteroscedasticity | Wald test | 2.947 (0.004) | 1.492 (0.000) | There is no heteroscedasticity. |
| Autocorrelation | Durbin–Watson test | 1.897 | 1.735 | There is no autocorrelation. |
Publisher’s Note: MDPI stays neutral with regard to jurisdictional claims in published maps and institutional affiliations. |
© 2022 by the authors. Licensee MDPI, Basel, Switzerland. This article is an open access article distributed under the terms and conditions of the Creative Commons Attribution (CC BY) license (https://creativecommons.org/licenses/by/4.0/).
Share and Cite
Kechagia, P.; Metaxas, T. FDI and Institutions in BRIC and CIVETS Countries: An Empirical Investigation. Economies 2022, 10, 77. https://doi.org/10.3390/economies10040077
Kechagia P, Metaxas T. FDI and Institutions in BRIC and CIVETS Countries: An Empirical Investigation. Economies. 2022; 10(4):77. https://doi.org/10.3390/economies10040077
Chicago/Turabian StyleKechagia, Polyxeni, and Theodore Metaxas. 2022. "FDI and Institutions in BRIC and CIVETS Countries: An Empirical Investigation" Economies 10, no. 4: 77. https://doi.org/10.3390/economies10040077
APA StyleKechagia, P., & Metaxas, T. (2022). FDI and Institutions in BRIC and CIVETS Countries: An Empirical Investigation. Economies, 10(4), 77. https://doi.org/10.3390/economies10040077