1. Introduction
Tourism has proven to be one of the sectors hardest hit by the COVID-19 pandemic, which is seriously affecting economies, people’s livelihoods, public services and limiting opportunities on all continents. Preserving the livelihoods that depend on this sector should be a priority, and the recovery of tourism offers opportunities for transformation, with an emphasis on managing the impact of the pandemic on tourist destinations and creating greater potential among the population and companies operating in this area by countering through innovation, digitalization, sustainability and partnerships.
Cruise tourism, as one of the most dynamically developing, unique and popular types of business, has certain advantages and features that allow it to remain more stable for a long time amid other economic sectors (
Brida and Aguirre 2008;
CLIA 2008;
Navarro-Ruiz et al. 2019). Thus, over the past 10 years, cruise passenger traffic has increased by more than 1.6 times, and the growth rate of total revenues from the development of cruise tourism amounted to about 150%. According to the Cruise Lines International Association, “globally, the cruise industry generates over
$150 billion in economic activity every year, supporting 1.17 million jobs paying more than
$50 billion in salaries and wages” (
CLIA 2008). The intensity of the industry’s development involves the identification of key components that form the potential of this sector and create the basis for its effective development, both for an individual cruise destination and for entire countries, regions and complexes.
Note that the development of cruise tourism is based on the process of creating a cruise tourism product. Its promotion and implementation is provided by many enterprises and organizations (
MacNeill and Wozniak 2018;
Papathanassis 2019). A significant number of participants in the cruise business predetermine the system-forming nature of its functioning. It also indicates the need to identify all its constituent elements in order to understand the cause-and-effect relationships between the main, auxiliary and supporting processes of creating a cruise tourism product (
Logunova et al. 2020).
The objective of the study is to build structural and logical model of the cruise tourism functioning based on the identification of its structural components and representation of the link between tourist needs, the species classification of cruise tourism and the industries involved in its development (
Papathanassis 2017).
The tourism sector is still suffering huge losses due to the COVID-19 pandemic: in the first five months of 2021, international tourist flows in some parts of the world decreased by as much as 95%, and 100–120 million jobs were at risk. At the same time, according to forecasts, by the end of 2021 the volume of world GDP will decrease by more than 4 trillion dollars. “For developed countries this is a serious shock, but for developing countries it is an emergency situation,” said UN Secretary General Antonio Guterres (
International Tourizm 2021).
In his message on the occasion of World Tourism Day, he noted that the tourism sector is connected with almost all spheres of the economy and sectors of society, but not everyone can take advantage of its benefits. On the other hand, a tourism crisis such as the current one is hitting the poorest and most vulnerable groups in the first place. That is why this year the theme of the World Day was the call for the inclusive development of the tourism sector.
As of 2019, tourism accounted for 7% of world trade, and the sector, which employs 1 in 10 people on the planet, through a complex value chain (
UNWTO 2020b,
2020c). Interconnected industries provide livelihoods for millions of people in developed and developing countries. As borders closed, hotels shut down and air traffic dropped sharply, international tourist arrivals fell 56%, and the tourism sector lost
$320 billion in the first five months of 2020, more than three times the period of the 2009 global economic crisis. Governments are trying to compensate for the loss of revenue that is needed to fund public services, including social and environmental protection, and meet debt maturities (
UNWTO 2020b).
2. The Main Ingredients of Influence in the Industry
The activities of transport and logistics companies in the world were also significantly affected by quarantine measures due to the ban on the movement of passengers on all types of transport and the restriction of freight traffic by some countries. Rail freight transport, as well as combined transport, appear to have been less affected by the pandemic, especially at the initial stage, and in some cases their condition even improved by freeing up more rail routes for freight traffic due to the cancellation of passenger flights. For the marine and cruise industries, the measures also had a strong impact.
Considering the impact of the cruise industry on the economy of a country in a region or a separate area, it should be noted that this business involves all economic sectors, reflected in the System of National Accounts and characterizing the set of institutional units (
Nyberg et al. 2021):
Non-financial corporations, founded by legal entities or individuals, organize the processes of tangible and intangible production associated with the supply and production of goods necessary for the organization of cruise tourism, construction and maintenance of cruise ships, the provision of port, transport and other non-financial services.
Financial corporations, specializing in financial intermediation, provide banking and insurance services to both entrepreneurs and tourists. They also invest in the development of priority investment projects in the cruise business.
General public administration, represented by government bodies at the central, regional and local levels, exercises legislative, judicial and executive power, implements tax, environmental, customs and social policies, creates state and regional development programs, coordinates the activities of cruise industry enterprises, and contributes to the creation of favorable investment climate in the tourism sector.
Households that unite individuals as consumers, taking care of their financial well-being, increasing human capital and improving the health of family members, provide consumer services, partially provide education and health services and contribute to expanding the range and improving the quality of tangible and intangible benefits thereby stimulating the activity of other economic sectors.
Non-profit organizations serving households bring people together according to professional, cultural and other interests; provide non-market services of a socio-cultural, medical, housing and recreational nature for employees of cruise tourism enterprises.
The “Rest of the World” sector expands economic cooperation and interaction of the state with other countries of the world through the joint attraction of international tourist flows and contributes to obtaining a favorable image in the world tourist market.
Moreover, depending on the connection with the market, the market sector should be distinguished. It determines the ratio of supply and demand and covers the production of goods and services to create an integrated cruise tourism product (
Figure 1). It is also necessary to highlight the non-market sector, which is based on the production of goods and services for direct use in the production process of the cruise industry enterprises, as well as the provision of services by tourist associations and organizations for free (
Nyberg et al. 2021).
Thus, the main factors affecting the level of demand for a cruise tourism product include both external economic factors and individual preferences of tourists. External economic factors include the general economic level of the country’s development, which determines the rate of inflation and unemployment, the level of personal income and consumption and their share of vacation time in the family budget. Individual preferences of tourists are predetermined by their demographic, socio-economic, psychological and other characteristics, according to which they organize the infrastructure of the cruise ship and the program of tourists’ stay on board and shore (
Selivanov 2010).
Cruise operators, agents and companies, which are mostly represented by the non-financial corporations sector, meet the needs of various target audiences in a quality tourism product and organize interaction between economic sectors (
Figure 2).
Thus, if we consider tourism as a complex branch of the economy, then cruise tourism is its mutually transformable independent sub-industry based on structural and functional differentiation. It, in turn, includes a wide range of industries (sub-industries) involved in the creation of the cruise product indirectly (mechanical engineering, transport and communication, food, light and printing industries, etc.) (
CLIA 2008).
Each sub-industry (industry), taking into account its functional specialization, differentiates into third-level industries (mechanical engineering—into shipbuilding, automotive, etc., transport and communication—into ports, aviation and passenger transport, etc., food industry—into the dairy, confectionery, bakery industries, etc.).
No country has escaped serious losses in its tourism sector, from Italy, where tourism accounts for 6% of national GDP, to Palau, where tourism accounts for nearly 90% of all exports. This crisis was a serious shock for the developed countries and caused the most vulnerable segments of the population and developing countries to actually find themselves in emergency situations. The impact of the crisis on small island developing States (SIDS), least developed countries (LDCs) and many African countries is a matter of concern. In Africa, this sector accounted for 10% of all exports in 2019 (
UNWTO 2020a,
2020b).
3. Aggregation and Structuring in the Industry
This distribution is based on the combination of a set of enterprises that have their own specific characteristics, predetermined by their business environment, which is significantly influenced by such external factors as:
Natural and climatic factors, including meteorological and climatic factors (winds, air and water temperatures, precipitation and fog), hydrological factors (fluctuations in water levels, waves, currents), geomorphological factors (geological structure of the area, variability of the coast and bottom, movement sediment and soil properties), natural monuments and exotic natural objects, the richness of flora and fauna. All these have a primary impact on the possibility of organizing cruise tourism and the manifestation of tourist interest.
Political and legal factors that determine international relations in the field of the cruise business, contributing to the country’s positive image formation in the world tourism market and determine also the safety of navigation in the internal waters of the state. Moreover, these factors form the regulatory and legislative framework in the tourism sector. The role of political factors increases with the growth of turmoil, terrorist attacks, hostage-taking in a number of Arab countries, change of political regimes and testifies to the growing importance of international cooperation in order to resolve differences and ensure the safety of tourists at all stages of travel.
Economic factors, which are based on tax, investment, foreign economic activity of the state, distribution and employment of labor resources by economic sectors, as well as the growth rate of inflation, interest rates and energy prices, which determine the level of income and quality of life of the population. Economic factors directly affect the formation of the cost of the tour, determine the demand for cruise tourism products and create the preconditions for cruise tourism development.
A separate aspect in the analysis of economic factors in cruise tourism is the level of port dues set for cruise ships, and border and customs conditions for tourists who prefer a sea voyage.
- 4.
Socio-demographic factors affecting the volume of consumed cruise services due to an increase (decrease) in the number and changes in the demographic structure of the population, birth rate, mortality, life expectancy, indicators of demographic load and the nation ageing, work capacity and labor mobility, intensity level labor and its complexity, the length of free time, the length of the vacation period, etc.
- 5.
Scientific and technical factors that improve the quality of the cruise product and expand the range of related tourist services. These factors affect technological progress in the cruise business and contribute to reducing unit costs through the use of energy-saving technologies and improving the material and technical base of enterprises in this industry.
One of the modern approaches of building a structure of complex processes is using machine learning approach to understand interactions between different factors in a system.
The most appropriate way to understand this structure is by using Bayesian networks or Markov chains. Bayesian networks represents an acyclic graph, where its nodes are some factors (in our case different sectors of economy) and edges are relations between them.
Generally, a Bayesian network defines relations between different factors, that builds more complex system. In the case of the functioning of cruise tourism, it will describe dependency between natural, political, economic, social and science factors, which will lead to a deeper understanding of this complex system and also help to build a more sustainable business system.
The main feature of Bayesian networks are based on the conditional independence of variables or, in our case, different factors of the complex cruise tourism system. This means, that two different factors
and
are conditionally independent from factor
, if with defined factor
, the value of
does not increase information about factor
, or:
The complex scheme of using Bayesian network in modelling of cruise tourism functioning is provided in
Figure 3. This scheme represents relations between environmental (green), economic (blue), political (red), populational (yellow) and industrial (purple). Understanding the relationship between different variables that form a cruise tourism system is important for predicting optimal strategy from economic growth and tourist happiness. Due to the complex basis of every system, the success of cruise tourism for both companies and tourists depends mainly from large group of variables that can obviously vary it space-time continuum. This groups generally represents different groups of predictors of different origins. To visualize this structure, we used EU spatial data for Mediterranean Sea and R-package “bnlearn”. Spatial data were stored in group of “NetCDF” files containing corresponding data for different periods of time. To process this dataset with R and learn the structure of the Bayesian network we transform these geospatial layers to “dataframes”. A learning structure using “bnlearn” package was based on receiving probabilities of changing variables
as a response of any change of variable
. Thus, we visualized the cruise tourism structure in the Mediterranean Sea as a directed acyclic graph. The group of predictors were colored using “Adobe Photoshop” to detach one group of predictors from another. From
Figure 3 we can see that a cruise tourism system is mainly based on environmental variables. This group of predictors generally does not depend on any external influence, except fundamental processes. Other groups of predictors are a derivative of human activity and economic and political systems and can be changed depending on the political or economic situation.
In general, the sources of influence of the cruise industry on the economic growth of the state and the welfare of its citizens can be grouped as follows (
Figure 4).
Supply management (consumables and lubricants, food, clothing, spare parts, etc.);
Taxes and fees;
Cruise ships building and maintenance;
Services provided by ports (mooring, fresh water replenishment, lighting, garbage disposal, etc.);
Expenses of passengers and crew on land (excursions, hotel accommodation, transfer to the airport, taxis, etc.).
As the result, the goal of cruise tourism modelling is determining the most suitable touristic areas and visualizing them on a cruise tourism suitability map. Suitability analysis described in this paper represents a search for an optimal location, area or route that is characterized by a combination of certain properties, appropriate for using or traveling. In our case it should be an area or route that will lead not only to the economic growth of cruise companies, but also to the satisfaction of tourists and to increasing their numbers. Also, an important result of cruise suitability analysis and planning is a decreasing harmful impact on the natural environment. The result of the suitability analysis often represents a suitability map. It shows which locations, areas or routes are suitable for tourism use in a form of a thematic map. The opposite variation of the suitability map is a risk map which segregates specific areas that are dangerous or not appropriate for tourism or that will not help to increase income or economic growth. The conduct of the suitability analysis and creation of the suitability map is based of analysis of variables with different genesis which are represented at
Figure 3. Evaluation of suitability is often based on different methodologies and can be used not only for a good experience of other successful cases, but also in clustering a combination of variables and finding more suitable places. The most appropriate way to evaluate suitable areas for cruise tourism is to use the weights of evidence approach. Suitability analysis is this case based on fact that when we analyzing the factors for a given number of grid cells {
D}, containing the event
D and the total number of grid cells {
T}, the prior probability is expressed by (1):
Assuming that a binary predictor of influencing factor
B occupies
N{
B} grid cells, and if a certain number of known successful tourism area are within the cells of this factor, then the probability of suitability, given the possibility of the presence of a predictor factor and the absence of an influencing factor, can be expressed by (2) and (3).
The posterior probability determines the presence or absence of a factor and is denoted by {D|B} and {D|B−}, respectively. {D|B} and {D|B−} denote the posterior probabilities of finding the grid cells of factor B in the grid cells of event D.
Weights for binary factors are determined by (4) and (5):
where
and
are the weights of the absence or presence of factors affecting cruise tourism suitability, respectively.
The final result of the analysis using the weights of evidence method is the calculation of the cruise tourism suitability index (
CTSI) by (6).
where
—weight coefficients of cruise tourism successfulness in the study area.
Thus, the creation of a cruise tourism product is a process of interaction of both production and non-production sectors of various economic sectors.
Therefore, cruise tourism is an intersectoral complex, which includes: cruise companies and cruise operators; transport organizations; collective and individual accommodation facilities; restaurant business enterprises, etc. Thus, cruise tourism is inextricably linked to the enterprises of related and supporting industries such as port and agriculture, shipbuilding and ship repair, mining and extractive industries, light and food industries and many other industries and enterprises (from manufacturers of electronic computers to organizations providing consulting and information services). All these industries help to ensure cruise tourism sector efficiency (
Navarro-Ruiz et al. 2019).
According to the concept of effective development, the level of competitiveness of cruise tourism as an important economic sector depends on the degree of customer satisfaction. Meanwhile, a cruise tourism product is not just a set of interrelated tourist services. It helps to satisfy spiritual and emotional needs of a consumer and gain experience of staying in unusual conditions by contemplating an environment unusual for a tourist (
Logunova et al. 2020;
International Tourizm 2021;
Papathanassis 2020;
Navarro-Ruiz et al. 2020).
Consequently, discomfort even at one stage of the voyage will have a negative impression on the entire vacation and form a negative attitude towards both the cruise product itself and the companies that provide it, and towards the region in particular.
Thus, during a voyage, a cruise passenger consumes a variety of services: passenger transportation, accommodation, catering, trade, recreational and cultural, health, excursions, etc. However, first of all, a passenger needs life-support services, including housing, food, transport, leisure. This results in the creation of appropriate transport and tourist infrastructures, the necessary conditions for the development of which are: a favorable investment climate, initiative and interest from business structures and authorities, and the possibility of integration with international cruise organizations (
Figure 5).
In addition to the COVID-19 pandemic, climate change is a major obstacle to tourism development. Small island states are particularly affected, where tourism accounts for nearly 40% of economic activity. However, with the right approach to rebuilding and developing the tourism sector, it can provide decent jobs and develop a viable inclusive economy that all members of society can benefit from. Analysis of the situation of tourism development is very relevant and important.
Information flow between sectors is key to understanding the impact of the pandemic and designing effective responses. Specific data on the socio-economic impacts of the COVID-19 pandemic on culture and tourism, as well as on solutions being implemented to rescue tourism will make it possible to develop mitigation plans to meet different needs and replicate best practices. The recovery and health improvement of citizens during a pandemic is another urgent task. Forecasting and analysis of monitoring the situation in the tourism sector is a strategic planning for the world.
Figure 6 shows the structural and logical model of cruise tourism functioning, based on the relationship of tourist needs according to the hierarchy of needs, the species classification of cruise tourism, and the industries involved in its development.
4. Data Visualization and Forecasting in a Geographic Information System (GIS)
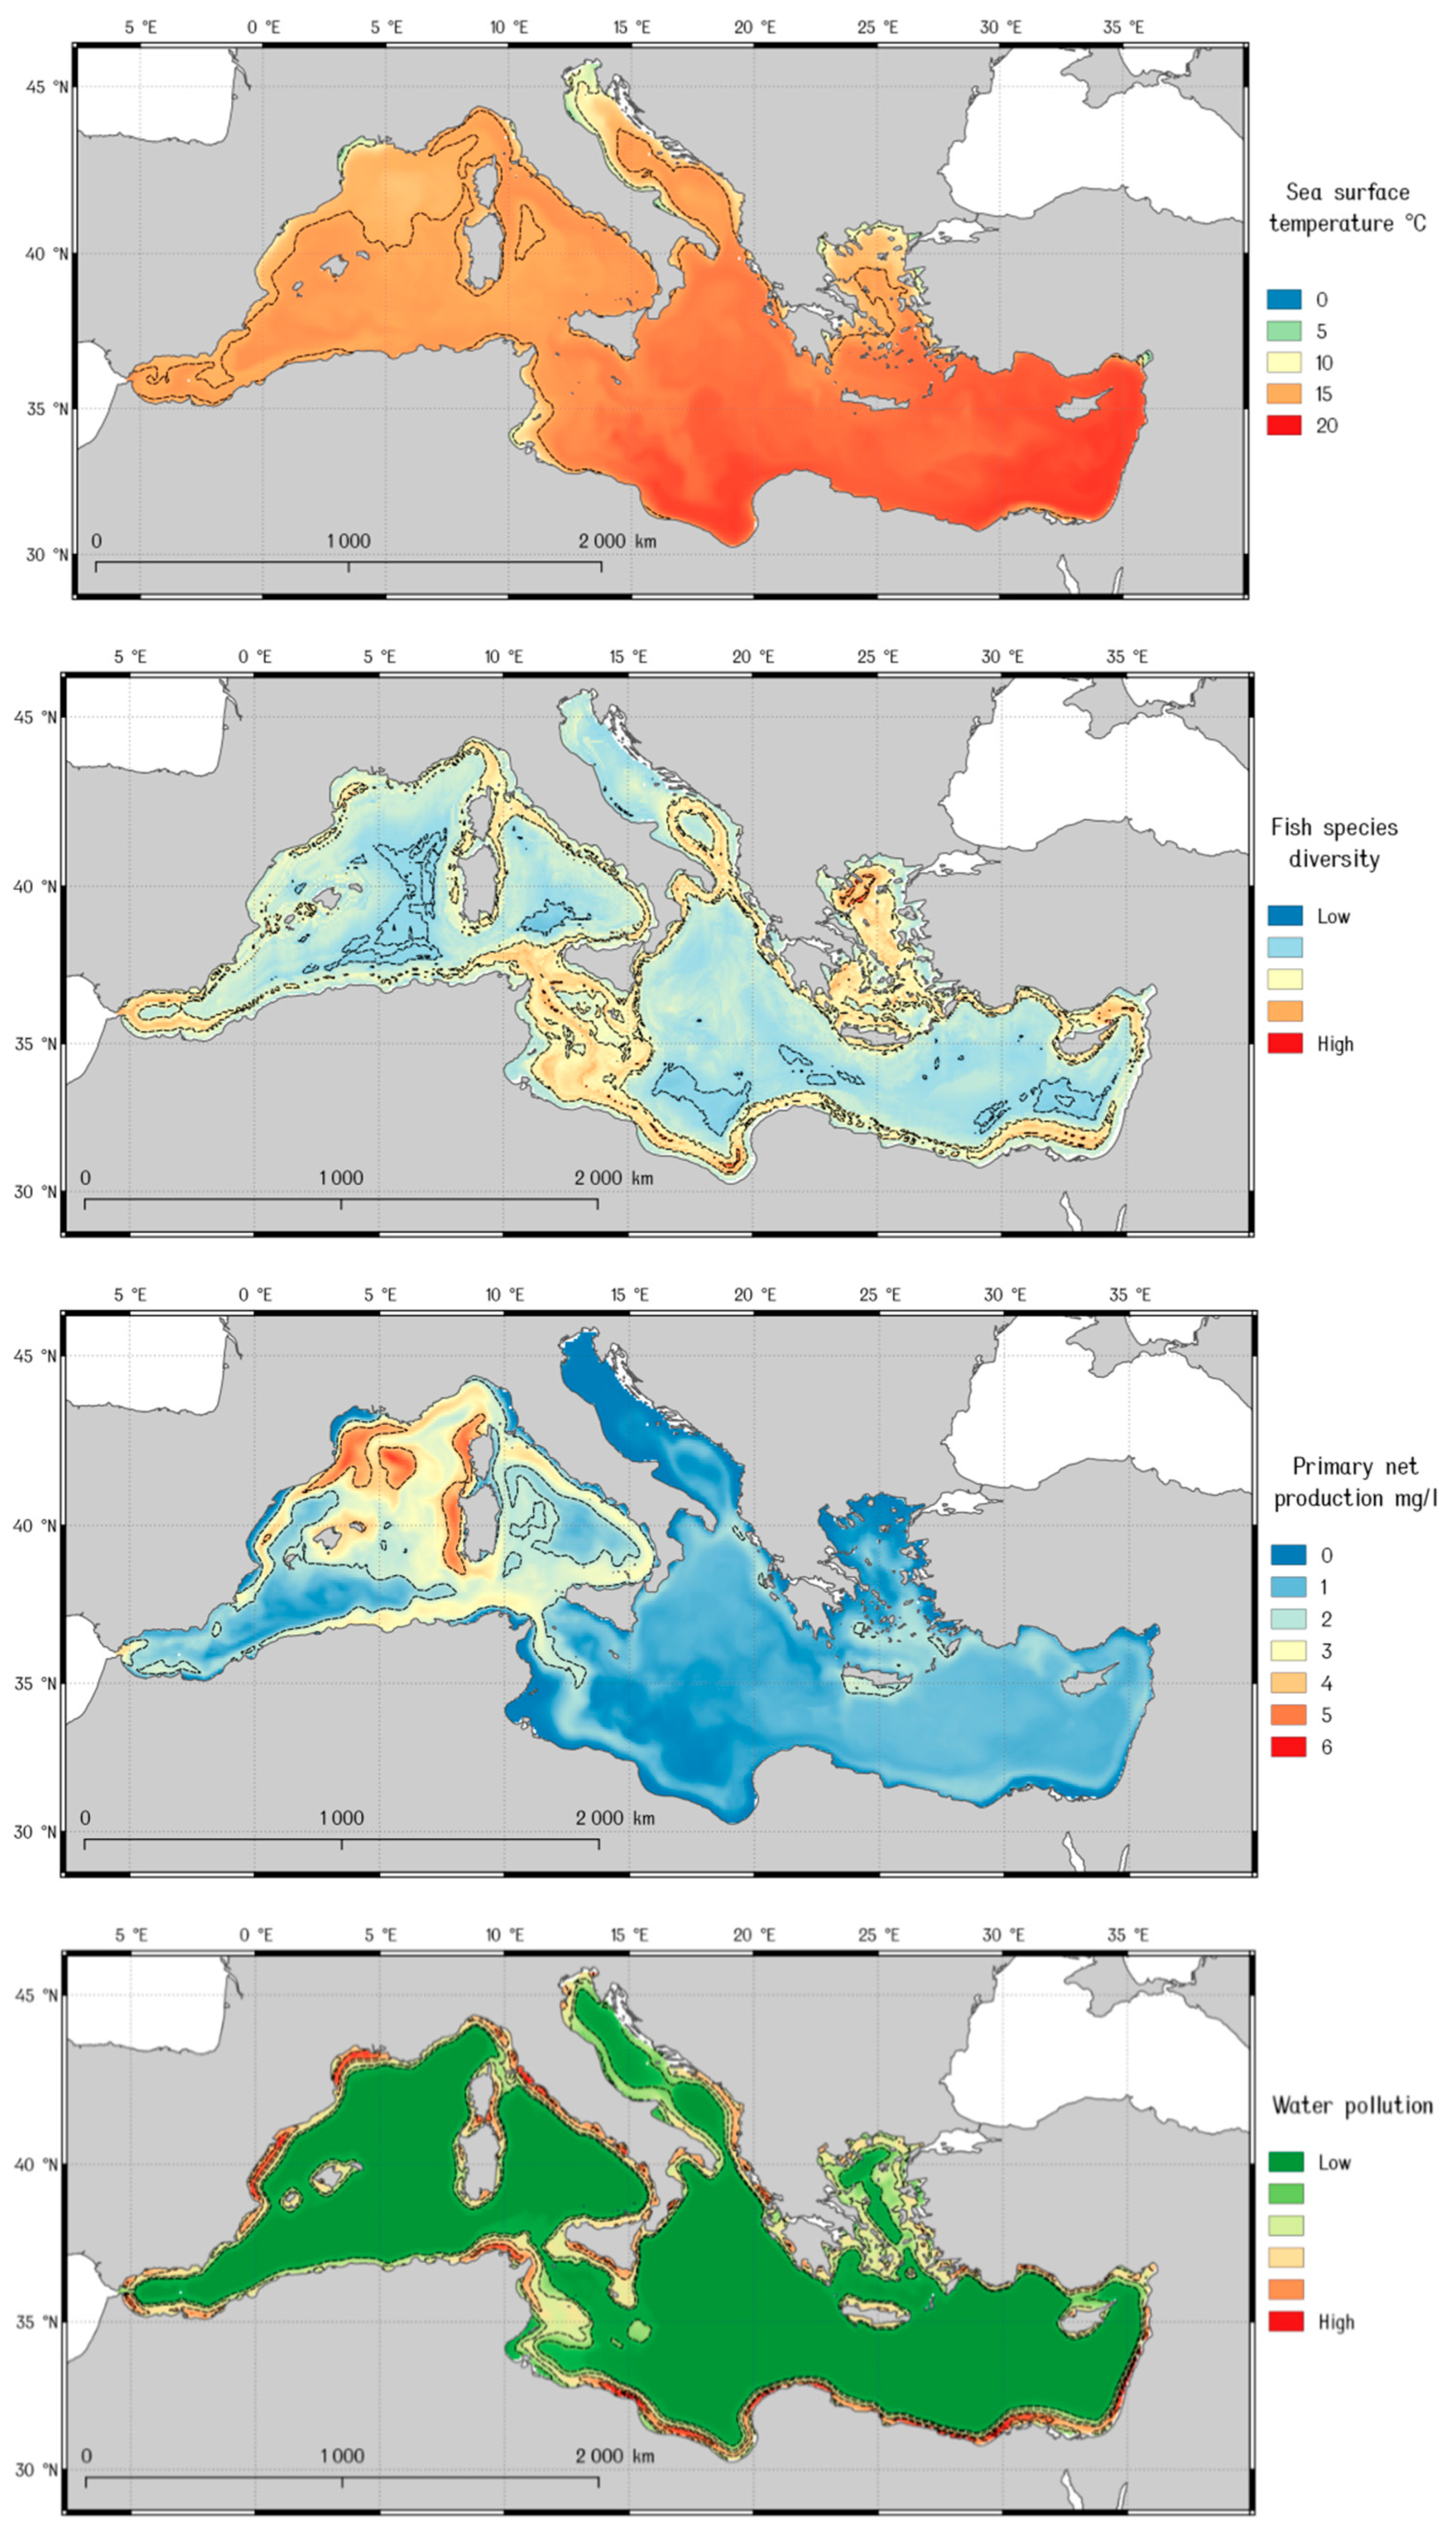
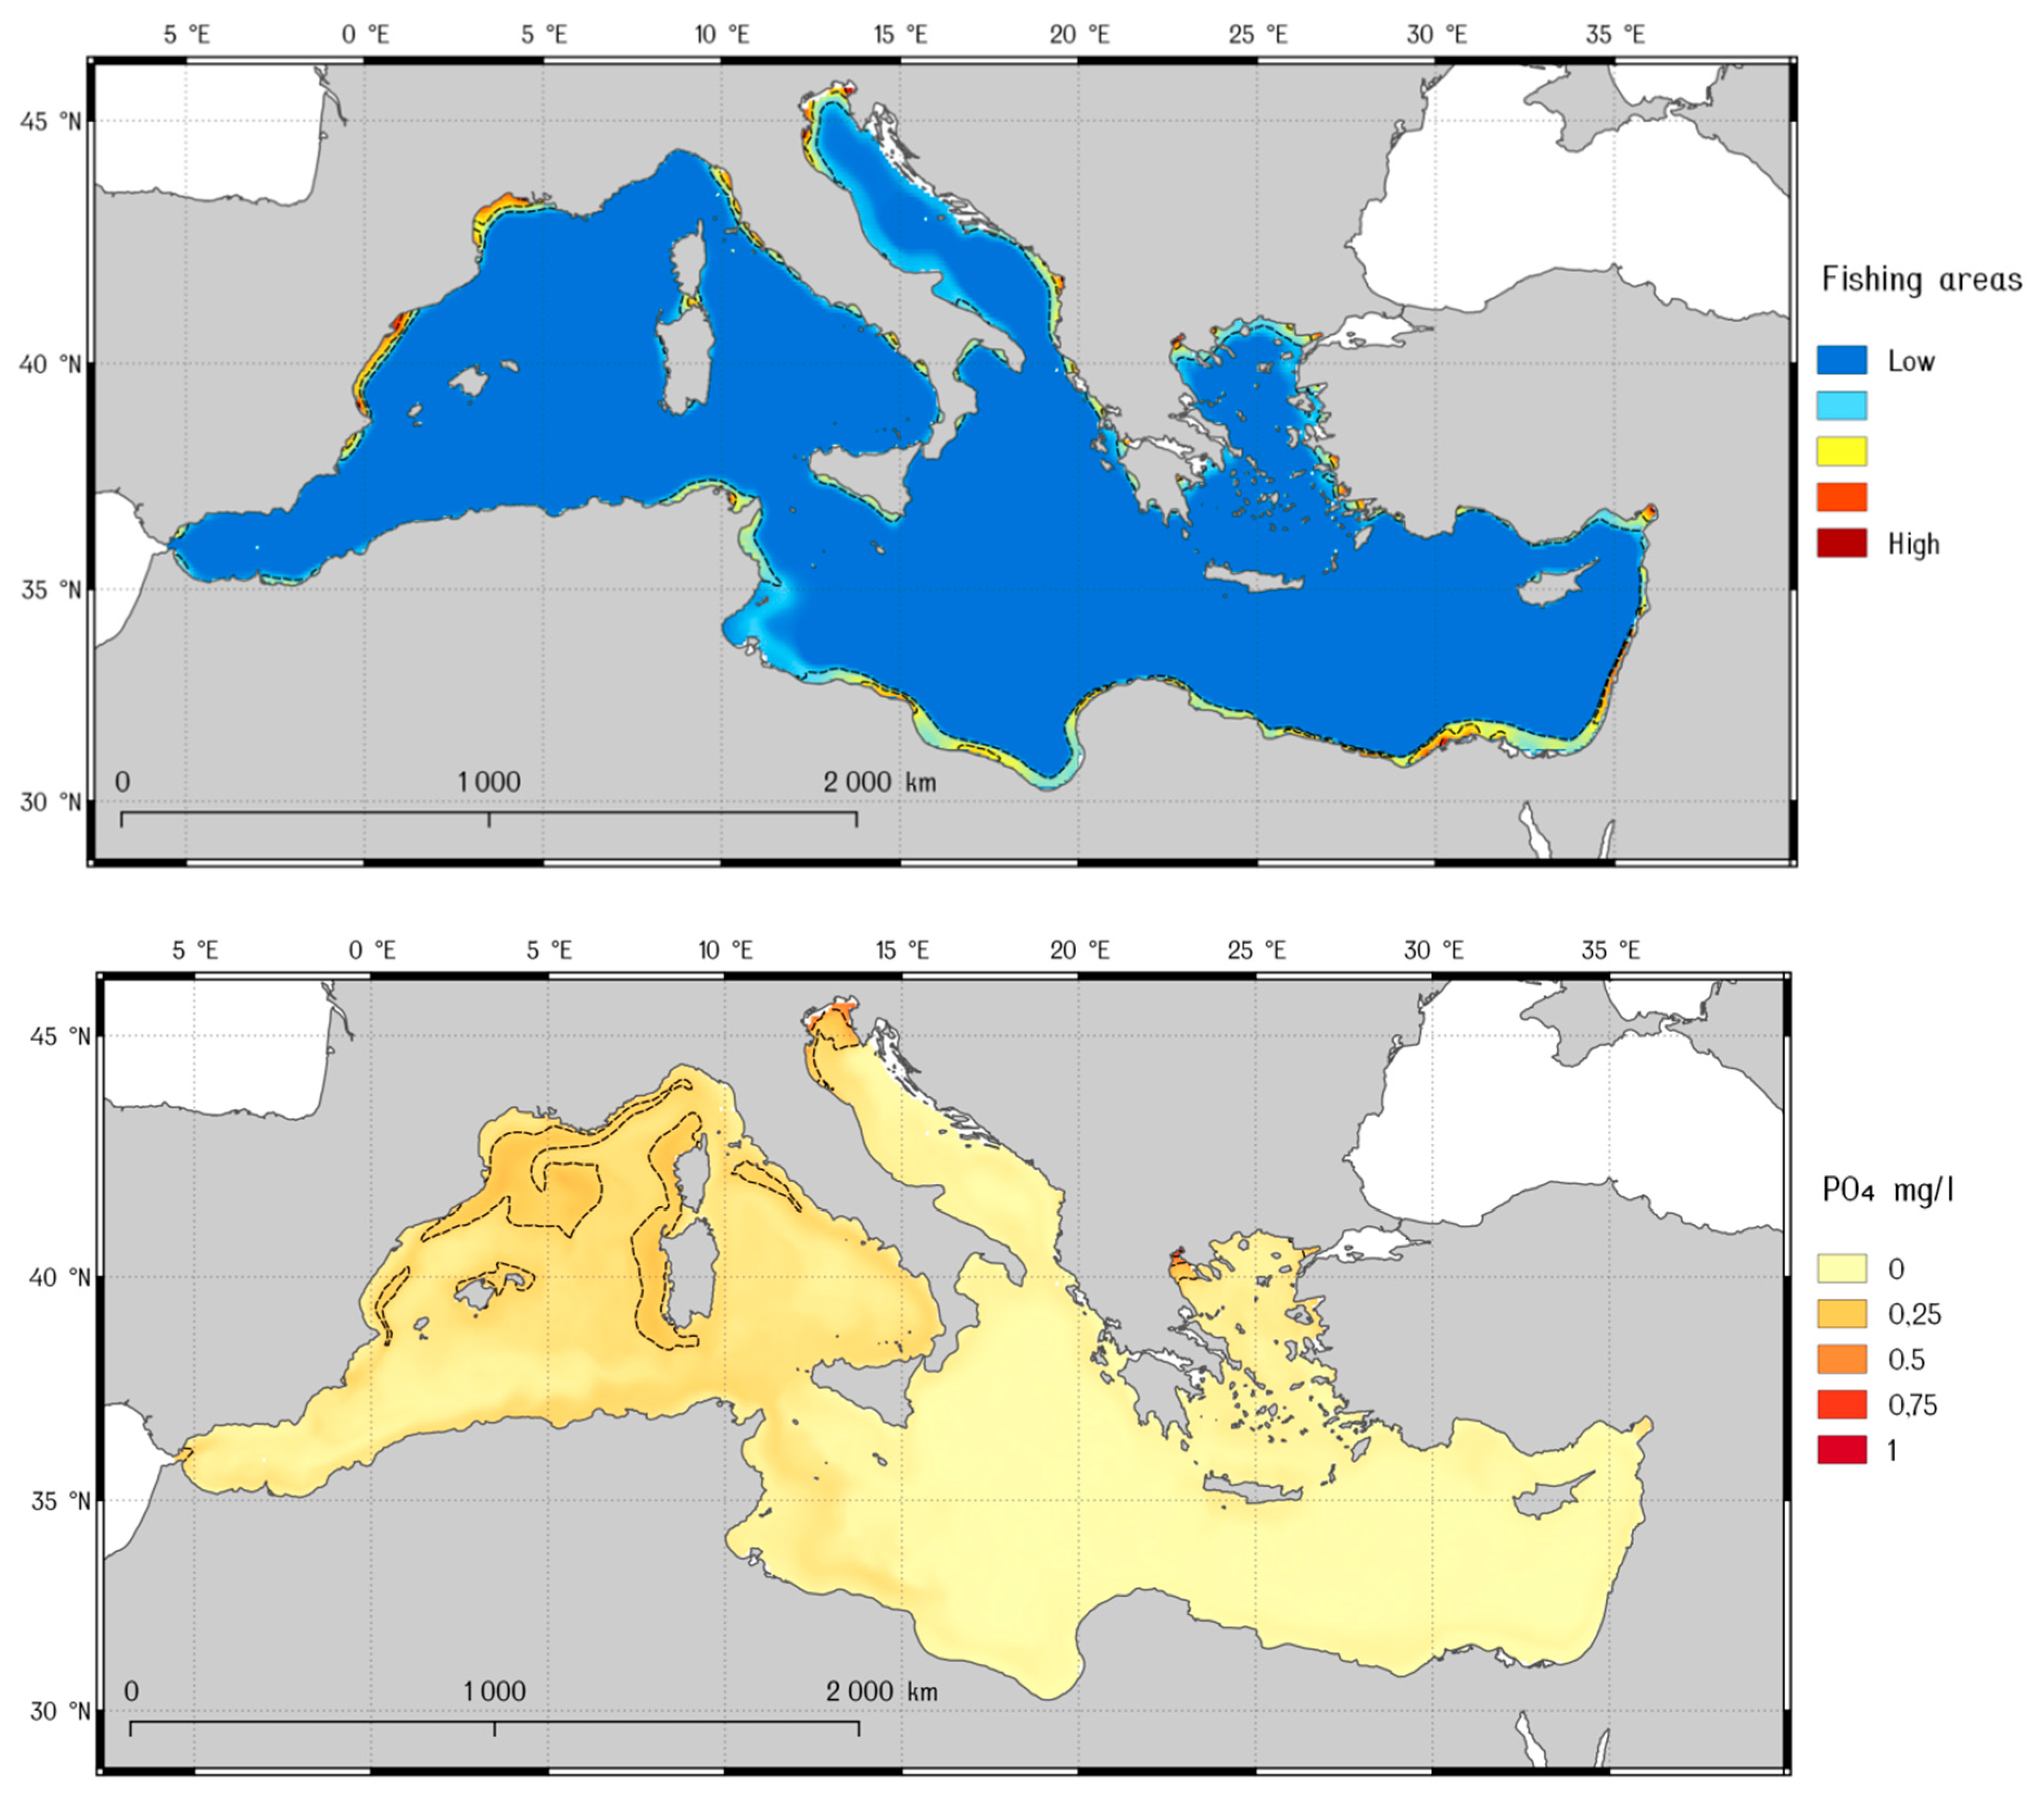
A practical part of cruise tourism mostly depends on the environmental state. Different environmental variables can impact on its success. Routing of the cruise vessel must be based on the suitability of the environmental drivers. For example, sea temperature and salinity can impact on a good climate and sea state for tourist relaxation, while a high level of chlorophyll-a or water pollution can decrease attractiveness. Great importance is also attached to fisheries, the impact of which can be reflected in overloading of the marine environment with water and noise pollution, decreasing tourist happiness. This variable reflects not only the environmental state of the cruise area, but also the political and economic situation there (
Ruan and Zhang 2021;
Mahon et al. 2021;
Stojčić et al. 2021).
Based on this we suggest complex system from visualization to forecasting using spatial data and GIS technologies.
Environmental and economic data were provided by the EMODnet Central Portal and Copernicus Marine Environment Monitoring Service. Data were processed using QGIS 3.12. Complex analysis of indicators allows monitoring based on fundamental models and with the possibility of real-time mode. Timely dynamics allow the building of both economic and socio-economic trends.
This model based on the machine learning approach with combining Bayesian networks and k-means clustering (
Yemelyanov et al. 2021). This will helps to distinguish different zones that are suitable and unsuitable for cruise tourism.
Bayesian networks are partly based on determining the structure and interactions of environmental variables between each other. Generally, Bayesian network can be represented as an acyclic graph where nodes describe different variables, while edges are relations between them. In the case of cruise tourism these variables have environmental, economic or political origins. For example, as Bayesian network nodes
can be water temperature, water pollution, fisheries areas, etc. Every node
in a network can be connected with the node
by an edge, that represents manifestations’ probability of node
from node
:
where probability
depends from probability of corresponding connected node and is represented by a random value.
Calculations of the cruise tourism structure were undertaken using R-package «bnlearn» inside QGIS with RQGIS connector.
Spatial zoning of the marine area was undertaken using a k-means clustering approach. Clustering means a task of dividing of a dataset into several dissimilar groups based on different variables. Zoning using k-means clustering consists of several steps:
Selection of appropriate variables in dataset;
Data normalization;
Verification of clustering tendency;
Optimal number of clusters selection;
Clustering and validation.
To predict cruise tourism suitability in the Mediterranean Sea as variables we choose sea surface temperature, fish species diversity, primary net production, sea surface salinity, water pollution, chlorophyll-a and dissolved oxygen concentration, PO
4 and popular fishing areas (
Figure 7).
To perform k-means clustering in QGIS we used the SAGA module k-means clustering for grids.
Let us simulate our indicators and the structures described above in a geoinformation modeling environment (
Figure 7).
As a result, we receive a final map with clustered areas (
Figure 8). The most suitable for cruise tourism are areas with high and very high suitability (blue and green). Most of these areas are located near the shoreline and in the central part of the Mediterranean Sea. The main reason for such zonation, in our opinion, is based on the domination of suitable parameters for the environmental variables, that provide good and attractive conditions for tourists. Areas with low and very low suitability for tourism are located in the most polluted areas with high industrial pressure. Models and characteristics of critical quality indicators can be either assessed by experts in a simple manner or implemented using information technologies and neural networks.
Thus, the cruise tourism development depends on all economic sectors, which are closely interconnected and together create a high-quality cruise product.
Covering all spheres of economic activity, the cruise industry provides an opportunity for the simultaneous development of many unrelated types of industries. Thereby, it contributes to an increase in the competitiveness and performance of both the enterprises involved in the process of creating a cruise product and the economic growth of the region and the country as a whole.
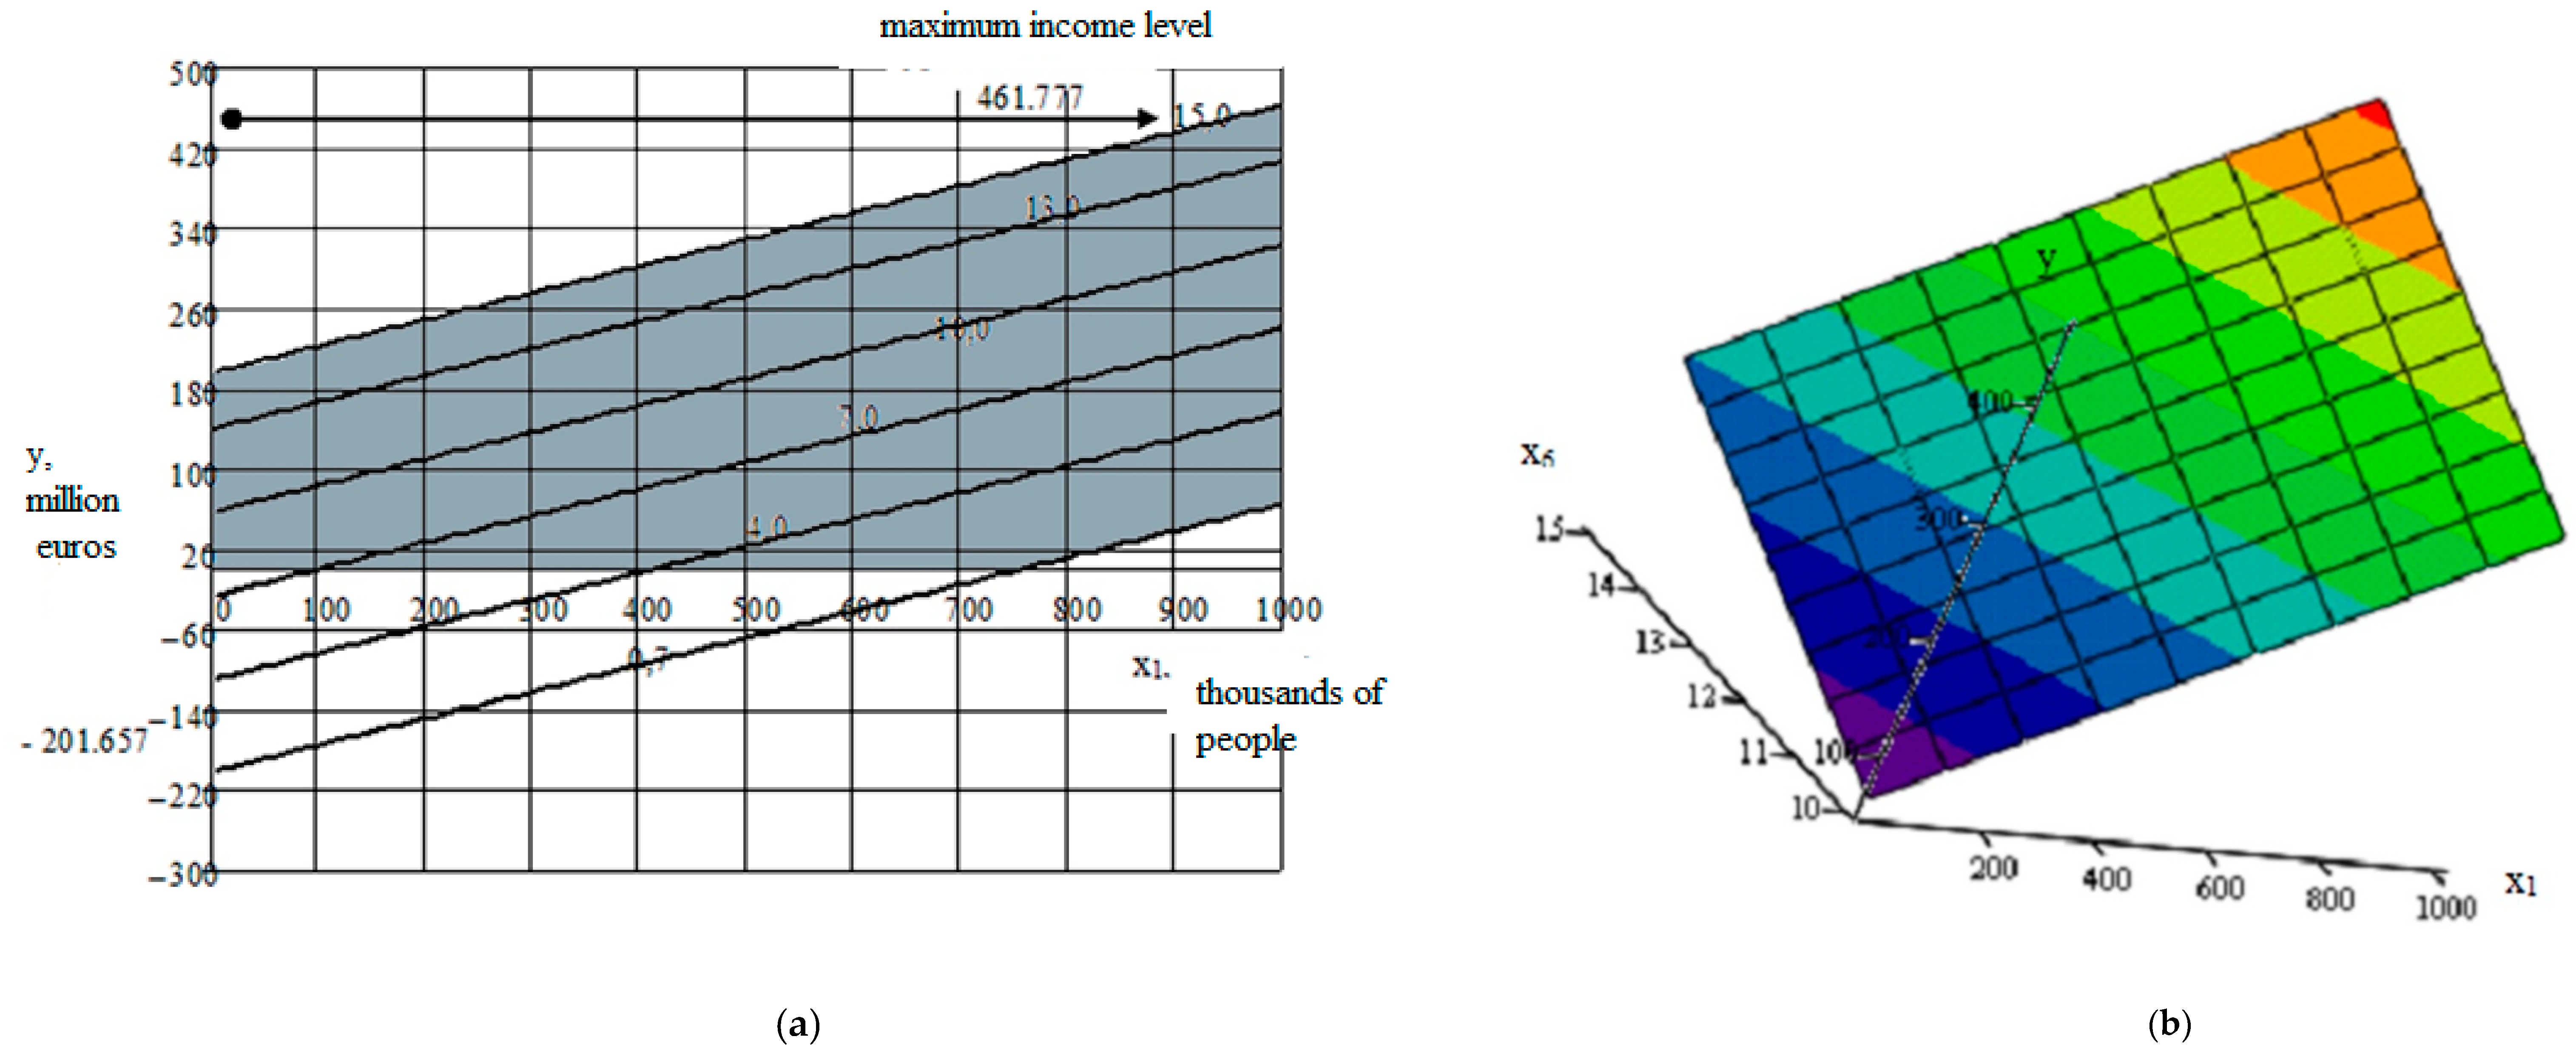
In order to ensure high growth rates of the national cruise market and find quantitative parameters, we carried out economic and mathematical modeling based on the construction of an empirical regression equation, which makes it possible to assess the degree of influence of individual variables on the level of effectiveness of the development of cruise tourism of the most successful tourist destinations.
It should be noted that, mathematically, the problem of correlation-regression analysis is reduced to the search for an analytical expression that would reflect as best as possible the relationship of factor attributes with a productive attribute, i.e., to finding the function :
Taking into account that any function of several variables can be brought to a linear form by a logarithm or change of variables, the multiple regression equation was expressed in linear form, and the parameters of the equation were found by the least squares method:
where
—the calculated values of the effective feature-function;
x1, x2, …, xn—factorial signs;
a0, a1, a2, …, an—parameters of the equation.
The selection of variables in the multiple regression equation was carried out using a step-by-step approach, according to which the factors are included in the equation sequentially, then their significance is checked and it is determined how much the sum of squares of the residuals decreases and the multiple correlation coefficient increases. In this case, the addition of new explanatory variables to the model was carried out as long as the adjusted coefficient of determination and the value of the Fisher criterion grew.
As an effective indicator, it was decided to use direct income from cruise tourism (Y), and factor indicators gradually introduced into the model were indicators characterizing the economic, social and resource efficiency of the cruise industry:
- -
number of tourists who preferred cruises, thousand people (x1);
- -
index of competitiveness of travel and tourism of a particular country (x2);
- -
length of the coastline of the state, km (x3);
- -
index of the cost of living (x4), which determines the level of prices in a particular country;
- -
the number of workers in the cruise industry, thousand people (x5);
- -
capital investments in the development of the tourism sector, million euros (x6);
- -
average monthly salary of one worker in the cruise industry, EUR/person (x7);
- -
number of ports with the necessary infrastructure to receive cruise ships (x8),
- -
labor productivity of workers in the cruise industry, thousand euros/person (x9).
At the same time, the selected variables reflected the average values of the development of the European cruise market for 2005–2011 (
Table 1 and
Table 2).
To establish the correspondence of the mathematical model to the experimental data and to assess the adequacy of the inclusion of explanatory variables in the equation in order to describe the dependent variable, the adequacy of the model was checked by calculating the average approximation error. As a result of the values obtained, three countries (Denmark, Finland and the Netherlands) were excluded from the sample of 15 European countries, the approximation error of which exceeded 40%. This took into account the fact that, starting with the six-factor model, the coefficients of determination had rather high values; in addition, the actual Fisher criterion significantly exceeded the tabular indicators, in order to avoid penetration into the regression equation of the random term for choosing the most adequate model, and we calculated the parameters at which the average approximation error reaches the smallest value using the Excel program and the Search for solution function.
It should be noted that, despite the preservation of the general proportions, the parameters of the regression equations using two different methods are somewhat different. In addition, given that the values of the regression coefficients do not allow one to judge which of the factor indicators included in the model has a greater effect on the level of direct income from cruise tourism, since the coefficients are incomparable with each other and in fact the phenomena reflected by them are not only incomparable but also expressed in different units of measurement, we calculated the partial coefficients of elasticity and β-coefficients.
Partial coefficients of elasticity (
) were determined by the formula:
where
ai is the regression coefficient for the
i-th factor;
Beta coefficients (
βi) were calculated using the formula:
where
—standard deviation of the
i-th factor;
To characterize the tightness of communication in multiple linear correlation, the multiple correlation coefficient (
) was used, calculated by the formula:
—paired linear correlation coefficients, allowing to evaluate the influence of each factor separately on the effective indicator, and determined by the formulas:
On the basis of paired correlation coefficients, partial first-order correlation coefficients were found, showing the relationship of each factor with the investigated indicator under conditions of complex interaction of factors, calculated by the formulas:
The scale of the negative consequences depends on the type of transport and the state’s integration into the global transport and logistics structure. During the first wave of the pandemic, up to 90% of flights were canceled in EU countries, and there was a decrease in the volume of passenger traffic by cars in the aisles of 60–90%, and by public transport by about 50% (
McCarthy 2003). According to the generalized data for 2020, the global volume of freight traffic will decrease by approximately 36%, and the losses of Russian transport companies will amount to 230 billion rubles. Today, the countries are in a transitional stage: in the transport sector, there is an adaptation to the updated conditions of activity and adaptation to new conditions. However, there are a number of risks involved (
Shpilko and Androsova 2012;
Yemelyanov et al. 2021;
UNWTO 2020a,
2020b,
2020c).
Of particular importance for the development of cruise tourism are investments, which, according to J. Christopher Holloway, are a key criterion for determining the degree of success of the tourism industry in a particular destination, and on the technical condition of infrastructure facilities, production (transport, communications, construction, water-heat and energy supply) and social (trade, public catering, consumer services, cultural, children’s, medical institutions) components, which is confirmed by the parameters of the regression equation (coefficient at ×6): an increase in capital investment by 1 million euros generates an inflow of direct revenues from the cruise sector of more than 27 million euros.
The impact of COVID-19 on passenger maritime transport has also been colossal, especially as some countries advised against sailing and major cruise lines suspended operations. Cruise shipping is one of the key tourism industries and makes a significant contribution to the economies of the countries to which tourists travel, especially SIDS. Cruise tourism, serving 28.5 million passengers, generated approximately
$150 billion in global goods and services production in 2018 and generated over 1 million jobs, according to the International Association of Cruise Lines (ICL). Along with the impact on jobs, as of early August, some 5000 seafarers were still on board cruise ships awaiting repatriation, which was delayed by the closure of ports and lack of coordination and support between countries (
UNWTO 2020b).
It was found that the number of workers employed in this area and the level of their labor productivity have the greatest impact on the development of cruise tourism, which is fully consistent with the generally accepted statement about the importance of the most important resource of any state—a person, as well as investment in infrastructure development and objects of tourist interest.
5. Conclusions
The global transport and logistics system turned out to be one of the areas most affected by the pandemic (COVID-19). The negative consequences are based on various factors: the closure of state borders, the imposition of restrictions on the movement of people and goods, the rupture of supply chains, and a decrease in demand and purchasing power. The combination of these factors affected all types of transport—from the use of personal and public transport in cities to the implementation of passenger and freight transport both within countries and between them.
The impact of COVID-19 on tourism is fraught with increased poverty (SDG 1) and inequality (SDG 10), and risks undermining conservation efforts. The pandemic also risks slowing progress towards the Sustainable Development Goals (SDGs) (
http://tourism4sdgs.org) (accessed on 1 May 2021). The variety of approaches to the process of creating a cruise tourism product predetermines the representation of the cruise industry as a special socially relevant independent industry that ensures the implementation of tourist needs and is carried out at all stages of a cruise, from the provision of accommodation and catering services (physiological needs) to cognitive and creative processes (self-development).
The paper provides a methodological analysis of the sea tourism industry. Algorithmic and conceptual bases of situation analysis are proposed. An overview of the state of the industry during the COVID-19 pandemic was undertaken. We developed an interactive GIS monitoring map for industry tracking analysis and decision support.
Connectivity provided by air, land and sea transport forms the backbone of tourism. Before the crisis, roughly 58% of the 1.5 billion tourists who crossed borders annually traveled by air, and 39% of travelers used ground transportation (UNWTO Tourism Data Dashboard, Global and Regional Tourism Performance, available at
https://www.unwto.org/global-and-regional-tourism-performance) (accessed on 1 September 2021).
In connection with the pandemic, large banks and other financial institutions have lowered their forecasts regarding the growth of the global economy. Due to the pandemic, the incomes of the population have decreased, and some citizens have completely lost their jobs. This negatively affected the retail, aviation and restaurant business. The pandemic has had this impact on the service sector in most countries, including Russia and the United States. The risks and fears associated with coronavirus have negatively impacted investor sentiment, resulting in a sharp decline in share prices in major markets.
The analysis has looked at the state of the transport maritime industry in the period before and during COVID-19. On the basis of predictive and factorial models, functional diagrams and factorial analyzes of indicators were built (
Figure 9,
Figure 10 and
Figure 11). A model for monitoring the situation in the industry is proposed. An illustrative example of modeling in a geoinformation system environment of components (
Figure 7 and
Figure 8) is presented. This allows us to build active and timely cloud models during the digitalization period.


 ,
, 


