Article

Lifetime of Catalyst under Voltage Cycling in Polymer Electrolyte Fuel Cell Due to Platinum Oxidation and Dissolution

by
Victor A. Kovtunenko
1,2,* and
Larisa Karpenko-Jereb
3
1
Institute for Mathematics and Scientific Computing, Karl-Franzens University of Graz, NAWI Graz, Heinrichstr. 36, 8010 Graz, Austria
2
Lavrentyev Institute of Hydrodynamics, Siberian Division of the Russian Academy of Sciences, 630090 Novosibirsk, Russia
3
Scientific Consulting, 8046 Stattegg, Austria
*
Author to whom correspondence should be addressed.
Technologies 2021, 9(4), 80; https://doi.org/10.3390/technologies9040080
Submission received: 5 October 2021 / Revised: 25 October 2021 / Accepted: 29 October 2021 / Published: 31 October 2021
(This article belongs to the Section Environmental Technology)

Abstract

:
The durability of a platinum catalyst in a polymer electrolyte membrane fuel cell is studied at various operating conditions with respect to the different electric potential difference (called voltage) applied in accelerated stress tests. The electrochemical reactions of Pt ion dissolution and Pt oxide coverage of the catalyst lead to the degradation of platinum described by a one-dimensional Holby–Morgan model. The theoretical study of the underlying reaction–diffusion system with the nonlinear reactions is presented by numerical simulations which allow to predict a lifetime of the catalyst under applied voltage cycling. The computer simulation investigates how the Pt mass loss depends on the voltage slope and the upper potential level in cycles.

1. Introduction

Polymer electrolyte membrane fuel cells (PEMFC) are extensively applied as power sources for various portable devices and vehicles. For effectiveness and high durability of commercial PEMFC, this task challenges the study of degradation of catalyst materials using the valuable platinum metal, see [1,2,3]. The mathematical modeling supported by numerical simulations is well reasoned for better understanding mechanisms, which cause the electrochemical degradation on the Pt surface. In the last decades, numerous publications have been devoted to development of diffusion models of Pt degradation in a catalyst layer (CL) within fuel cells, for which we refer to [2,4,5] and other works. For other mathematical approaches, we cite [6,7,8,9,10,11,12] for modeling nonlinear diffusion in multi-phase media with interface reactions by Poisson–Nernst–Planck equations and [13] for the mechanical degradation due to fracture.
In our study, we apply the degradation model of PEM due to Holby and Morgan [14]. The catalyst layer is assumed to be filled with Pt nanoparticles placed on a carbon support bound with the perfluorinated sulfonated ionomer, and the membrane is made from the same ionomer. The model is based on the platinum ion (Pt 2 + ) dissolution and the platinum oxide (PtO) coverage of the catalyst layer according to the following two electrochemical reactions:
Pt ( s ) Pt ( aq ) 2 + + 2 e ,
Pt ( s ) + H 2 O ( aq ) PtO ( s ) + 2 H ( aq ) + + 2 e .
Taking into account Gibbs–Thomson’s effect, the equations of the degradation reactions (1) and (2) are described by the Butler–Volmer reaction rate that is of exponential type. The Pt dissolution and oxidation take into account diffusion of building Pt ions into the ionomer membrane in the direction across CL, since degradation would be impossible without the diffusion.
In our previous work [15], the two degradation phenomena were investigated theoretically and numerically for different cycling profiles of the electric potential difference (called voltage) of triangle, hat, and square shapes according to the three industrial protocols. In the current paper, we continue the investigation of voltage cycles applied in accelerated stress tests in order to predict the lifetime of Pt catalyst. Namely, numerical simulations show in details the platinum mass loss on different time scales when varying the voltage slope and upper potential level.
The paper is organized as follows. In the section “Materials and Methods”, we introduce geometrical, physical, and chemical properties of the catalyst layer and the ionomer membrane, which are used for the mathematical and numerical methods. The mathematical model is given by a coupled system of nonlinear reaction–diffusion equations for three unknown variables: the Pt 2 + concentration, the Pt particle diameter, and the PtO coverage ratio. The section “Results and Discussion” presents numerical simulations of the underlying model using a second-order implicit–explicit scheme, and “Conclusion” summarizes the main findings of our study.

2. Materials and Methods

The developed degradation model is one-dimensional and based on the following assumptions: the model consist of two layers, catalyst and membrane, in PEMFC; the two degradation mechanisms are considered, namely, Pt dissolution and diffusion into ionomer, and formation of platinum oxides on Pt particles surface; the Pt particles are fully surrounded by ionomer on the carbon support; platinum ions diffuse through the inonomer, and the diffusion into gas diffusion layer is impossible.
For time t 0 , the space variable x [ 0 , L ] describes a semi-infinite cathode catalyst layer of the thickness L = 1 × 10 3 (cm), such that its left end-point x = 0 meets the gas diffusion layer (GDL), and the right end-point x = L confirms the interface with PEM. The corresponding model of degradation is sketched in Figure 1.
Let Pt particles be given by spheres of the diameter d Pt = 3 × 10 7 (cm) and volume V Pt = 4 / 3 π ( d Pt / 2 ) 3 1.5 × 10 20 (cm 3 ). We assume that the nanoparticles are posed on a carbon support with the density ρ Pt = 21.45 (g/cm 3 ) and loading p Pt = 4 × 10 4 (g/cm 2 ), and the volume fraction of ionomer increment in cathode ε = 0.2 . For the parameters, Pt volume fraction across CL can be estimated as ε Pt = ( p Pt / ρ Pt ) / L 2 %, and Pt number concentration in CL as N Pt = ε Pt / V Pt 1.32 × 10 18 (1/cm 3 ).
For physical parameters, there are the gas constant R = 8.31445985 (J/mol/K), Faraday constant F = 96485.3329 (C/mol), the temperature T = 353.15 (K) that is 80 C, taken from [15] and given in Table 1 for P t 2 + formation and diffusion, and in Table 2 for PtO formation. In the theoretical model, we have some fitting parameters taken from the literature and used for simulation.

2.1. Governing Relations

For a given voltage V expressing the electric potential difference versus a reference of 0 (V), three unknown variables of the degradation model are: platinum ion Pt 2 + concentration c ( t , x ) > 0 (mol/cm 3 ), Pt particle diameter d ( t , x ) > 0 (cm), and platinum oxide PtO coverage ratio θ ( t , x ) ( 0 , 1 ) , which is dimensionless. The governing system of reaction–diffusion equations is formulated in [16] as follows:
c t ε D Pt 2 c x 2 = B 3 d 2 r dissol ( c , d , θ , V ) for t > 0 , x ( 0 , L ) ,
where the quantity B 3 = π N Pt / ( 2 ε ) (1/cm 3 ) is denoted for short, and
d t = Ω r dissol ( c , d , θ , V ) for t > 0 , x ( 0 , L ) ,
θ t + 2 θ d d t = 1 Γ r oxide ( θ , V ) for t > 0 , x ( 0 , L ) .
The partial differential equations are endowed with the initial conditions:
c = 0 , d = d Pt , θ = 0 as t = 0 , x [ 0 , L ] ,
and the mixed Neumann–Dirichlet boundary conditions:
c x = 0 as t > 0 , x = 0 , c = 0 as t > 0 , x = L .
The conditions in (7) imply no-flux condition at the CL-GDL interface, and that the dissolved Pt 2 + concentration goes to zero at the CL-PEM interface.
The reaction rates entering governing relations (3)–(5) are established in [14] based on a modified Butler–Volmer equation for the Pt ion dissolution (1):
r dissol ( c , d , θ , V ) = B 1 ( d , θ ) exp { ( 1 β 1 ) B 4 ( d , θ ) V } c B 2 ( d , θ ) exp { β 1 B 4 ( d , θ ) V }
in units of mol/(cm 2 × s), and for the Pt oxide coverage (2):
r oxide ( θ , V ) = Γ exp 1 R T ( H 2 , fit + λ θ ) ( ν 1 1 θ 2 exp { n 2 F ( 1 β 2 ) R T U fit + ω θ n 2 F + ( 1 β 2 ) n 2 F R T V } ν 2 10 2 p H exp n 2 F β 2 R T U fit + ω θ n 2 F β 2 n 2 F R T V ) .
In (8) and (9), the auxiliary quantities stand for B 1 in mol/(cm 2 × s):
B 1 ( d , θ ) = ν 1 Γ ( 1 θ ) exp 1 R T H 1 , fit n F ( 1 β 1 ) U eq 4 Ω γ 0 ( θ ) n F d ,
for B 2 in cm/s:
B 2 ( d , θ ) = ν 2 Γ ( 1 θ ) c ref exp 1 R T H 1 , fit + n F β 1 U eq 4 Ω γ 0 ( θ ) n F d ,
and for B 4 in C/J:
B 4 ( d , θ ) = F R T n 4 Ω Γ n 2 θ d ,
using the expression of γ 0 in J/cm 2 :
γ 0 ( θ ) = γ + Γ R T ( θ ln ν 2 ν 1 10 2 p H + θ 2 n 2 F U fit + ω θ 2 R T + θ ln θ 2 + ( 2 θ ) ln 1 θ 2 ) .
The parameter entering (3)–(13) are accounted in Table 1 and Table 2.

2.2. Numerical Simulation

For our investigation, we chose voltage cycling conditions used in the accelerated stress test (AST); see [17].
Each cycle is characterized by the period p. The reference voltage profile first accelerates during p = 10 (s) from the lower V min = 0.6 to the upper V max = 0.9 potential level (V) with the slope α = 3 × 10 2 (V/s), then switches to V min again; see the 5 cycles illustrated in Figure 2b. We use the mathematical model (3)–(7) for computer simulations of the catalyst degradation and the CL operation under the voltage cycling conditions. The respective solution triples ( c , d , θ ) ( t , x ) during the 5 periodic cycles that are depicted versus time t ( 0 , 50 ) (s) across the catalyst thickness x ( 0 , 1 × 10 3 ) (cm) in Figure 3 in the respective plots (a)–(c).
In Figure 3a, we observe the evolution of Pt ions distribution, which is low at the interface with PEM and high when meeting GDL. The concentration is varied periodically from 0 to around 2 × 10 7 (mol/cm 3 ). Figure 3b demonstrates the decrease in Pt particle diameter through the catalyst length. The Pt particle diameter decreases faster at the membrane surface at x = L than at the boundary with the gas diffusion layer at x = 0 . The periodic change in the coverage of Pt surface by platinum oxide during the voltage cycling is depicted in Figure 3c. In every cycle, at the high voltage V max , the formation of PtO occurs, and at the low voltage V min , the reverse reaction proceeds such that the platinum oxide is reduced to the platinum. As seen, there is not enough time for the reduction reaction, such that the part of Pt surface is permanently covered by PtO, where the oxide coverage is varied from 40 to 70% of Pt surface. The coverage of catalyst layer and the loss of Pt mass in time will be investigated further in Section 3.
For numerical solution of the nonlinear reaction–diffusion problem (3)–(7), we realize a second-order implicit–explicit scheme from [15], which employs the standard fourth-order Runge–Kutta method and the tridiagonal matrix algorithm. In the numerical tests, we set a uniform mesh of the fixed time τ = 10 2 (s) and space h = L / 10 (cm) steps. It is worth noting that the size choice produced stable calculations reported further, wheres violating a CFL condition between τ and h might lead to numerical instabilities. For instance, the instability appeared for small V min < 0.6 and large V max > 1 in such a way that ( c , d , θ ) became negative. In this case, decreasing the time step to, e.g., τ = 10 4 was helpful, but essentially increased the computational complexity.

3. Results and Discussion
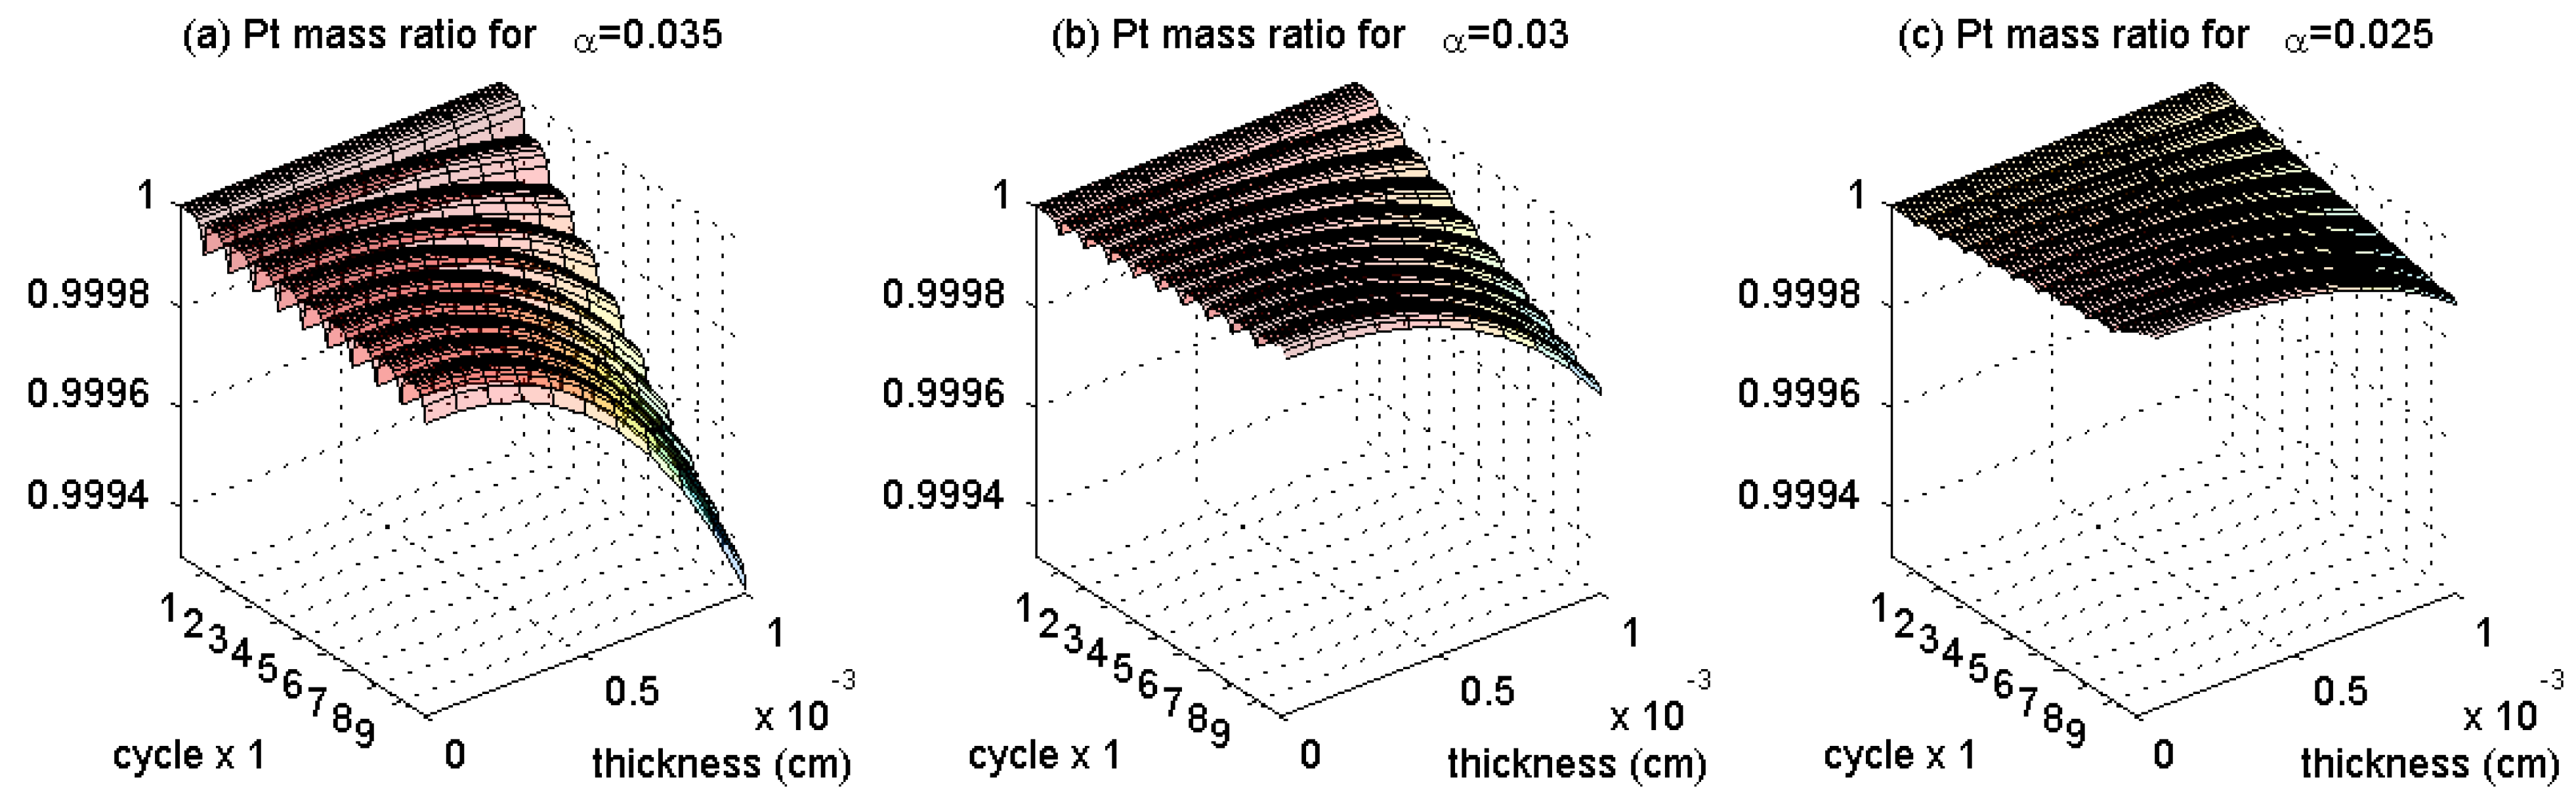
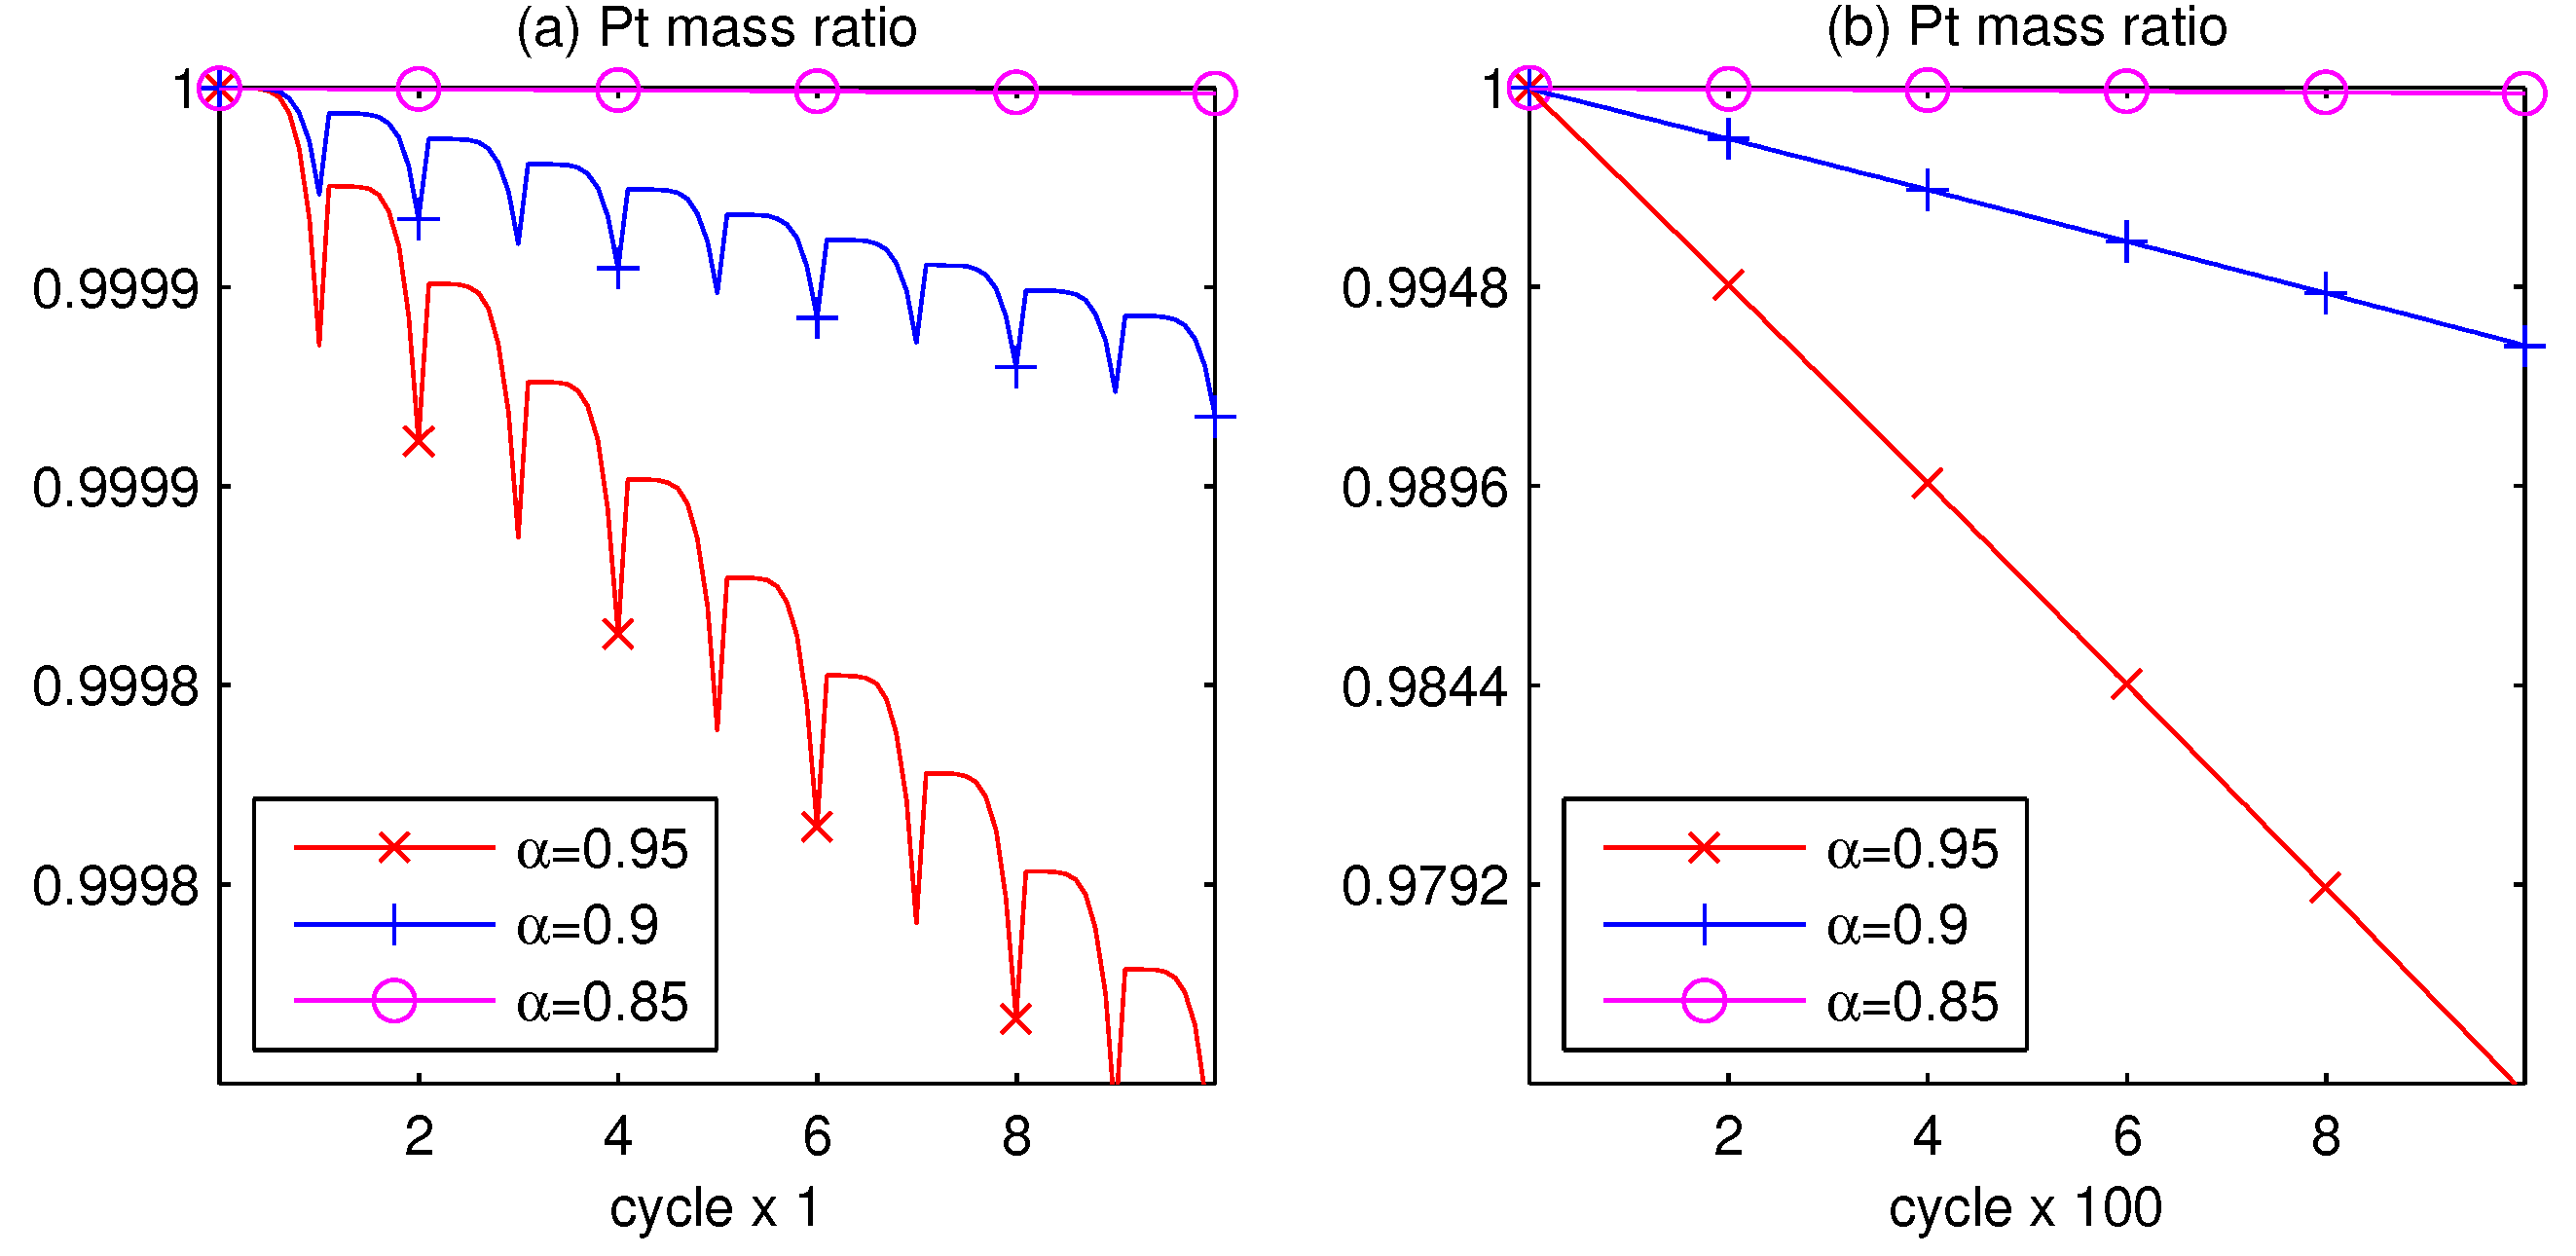
It is of special importance to investigate under which critical operating conditions the full CL coverage (that is θ 1 ) occurs, thus causing blockage of the catalyst layer in the considered model.
First, we apply the accelerated stress test (AST) with V min = 0.6 (V) and vary the slope (the rate of potential change) with the ratio ten in the range of α [ 10 3 , 10 3 ] (V/s). In Figure 4 versus the slope α we plot: (a) a log–log graph of the critical time t cr , cover in seconds, while (b) shows the semi-log plot of the corresponding critical voltage V cr , cover [ 0.9436 , 1.3632 ] (V), when θ 1 is attained by computing the problem (3)–(7).
Figure 4 demonstrates critical operating conditions when Pt surface is completely covered by PtO; in this moment, the catalyst surface of Pt becomes inactive. For example, if the potential growth is 0.1 V/s (that is the slope α ), the complete coverage of Pt surface by platinum oxide occurs in t cr , cover = 5 s. In this case, the critical value of the voltage V cr , cover attained is 1.05 V. If the potential increases with α = 1.0 V/s, the whole coverage of the catalyst surface by oxide is reached in t cr , cover = 0.5 s; it happens at the voltage V cr , cover = 1.08 V. This consideration is helpful to argue the following numerical results with respect to variation of upper and lower potential levels.

3.1. Pt Mass Loss

The electrochemical degradation of PEM can be measured by the following quantity of relative Pt mass m Pt ( 0 , 1 ] (mass ratio) defined from the Pt diameter d in (4) by
m Pt ( t , x ) = 4 3 π d ( t , x ) 2 3 / V Pt for t 0 , x [ 0 , L ] .
Indeed, starting from m Pt 1 due to the initial condition (4) at t = 0 , the decrease in the Pt mass ratio in time would imply loss of Pt ions up to m Pt 0 when the CL is blocked and does not work anymore. Continuing the work of [15], we study the Pt mass loss under the operating conditions with respect to cycling voltage profiles.
For this task, first we consider three triangle profiles conforming the AST test illustrated within five periodic cycles in Figure 2a–c. All profiles start from V min = 0.6 (V), then accelerate during p = 10 (s) up to the upper potential level V max = 0.95 , 0.9 , 0.85 (V). Respectively, the voltage slope varies as α { 3.5 , 3 , 2.5 } × 10 2 (V/s).
In Figure 5, the Pt mass m Pt along the catalyst length x [ 0 , L ] is presented during 10 cycles in plots (a)–(c) corresponding to the three profiles. From Figure 5, we conclude that decreasing the slope α weakens the Pt mass loss, thus the degradation.
Further, we use the mass ratio from (14) averaged over the catalyst length as
m ¯ Pt ( t ) = mean x [ 0 , L ] m Pt ( t , x ) for t > 0 , m ¯ Pt ( 0 ) = 1 .
In Figure 6 we plot the platinum mass ratio computed by formula (15) versus the number of cycles.
For comparison, the three curves of m ¯ Pt corresponding to the voltage profiles from Figure 2a–c are shown at two different scales. The 10 cycles during 1 min 40 s are depicted at the fine scale in plot (a) and obey a waving behavior, whereas in plot (b), the three curves of Pt mass continued for 1000 voltage cycles during 2 h 46 min 40 s at the coarse scale and are close to straight lines.
It is worth noting that in the three profiles in Figure 2, not only the slope but also the upper potential level is changed. Therefore, next we test numerically voltage cycling for the fixed slope α = 0.03 (V/s) and three pairs of lower and upper potential levels ( V min , V max ) = ( 0.6 , 0.9 ) , ( 0.65 , 0.95 ) , and ( 0.7 , 1 ) (V), presented in Figure 7a–c.
The corresponding Pt mass averaged along the catalyst length is given by three respective curves in Figure 8 at the two scales during 10 voltage cycles in plots (a), and 1000 cycles in plot (b).
From Figure 8, we observe the decay of m ¯ Pt in time (during cycles) starting at 1, which is stronger at the larger upper potential level and weaker at the lower V max .
Finally, from these results, we derive a prognosis to the catalyst lifetime.

3.2. Lifetime Prognosis for CL

Based on the linear decay of Pt mass depicted in plots (b) of Figure 6 and Figure 8, we calculate the rate of the Pt mass loss during 1000 cycles and extrapolate it to the the CL blockage when m ¯ Pt becomes zero. The data filling Table 3 are presented in the descending order with respect to the predicted number (#) of live cycles in CL (respectively, predicted lifetime in hours). As seen from Table 3, the prognosis depends on the slope α (V/s) and upper potential level V max (V) of voltage cycles. The catalyst durability is much longer when the fuel cell is operating at the small potential difference.

4. Conclusions

Accelerated stress tests are developing to simulate the degradation phenomena during polymer electrolyte membrane fuel cells operation. A direct comparison to experiments is hardly probable, since multiple organizations explore different voltage cycling protocols and various operating conditions (T, pH, pressure, etc). Our theoretical results are consistent with the experimental results reported in [17,18,19,20]. Stariha et al. [17] revealed that the Pt degradation is primary influenced by the upper potential level and by the rate of potential change (the slope). Marcu et al. [18] showed that an increase in the voltage upper limit in the triangle voltage cycle leads to a significant reduction of the catalyst lifetime. In accordance with the findings of Sugawara et al. [19], the Pt dissolution is accelerated when the upper potential limit is greater than 0.8 V, which confirms our results in Table 3. Takei et al. [20] reported that the Pt dissolution during the load cycles occurs particularly in the cathode CL near the membrane side, as also shown in our simulation. For the suggested model of catalyst degradation in PEMFC due to Pt dissolution and oxidation, as well as diffusion of platinum ions through ionomer of CL into the membrane, we report the following findings:
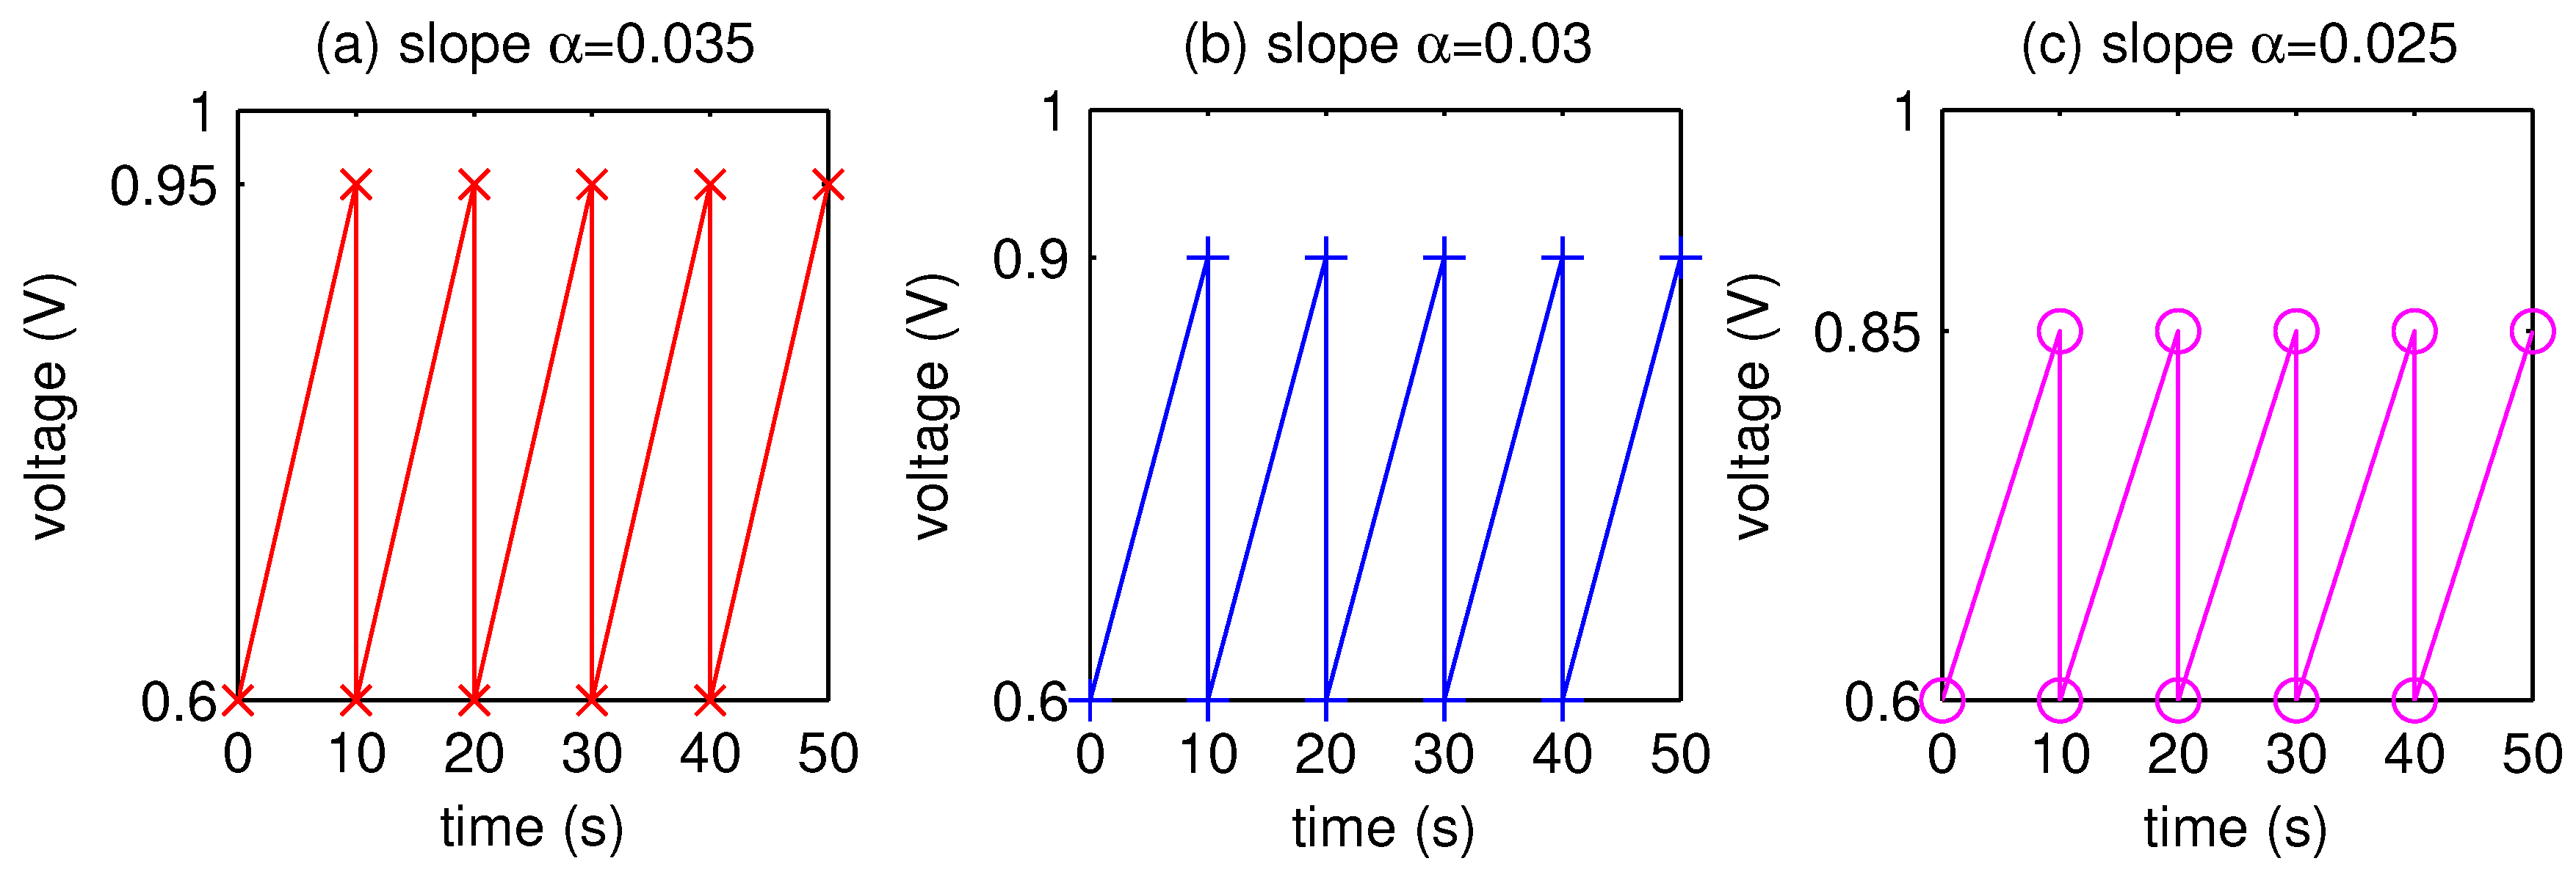
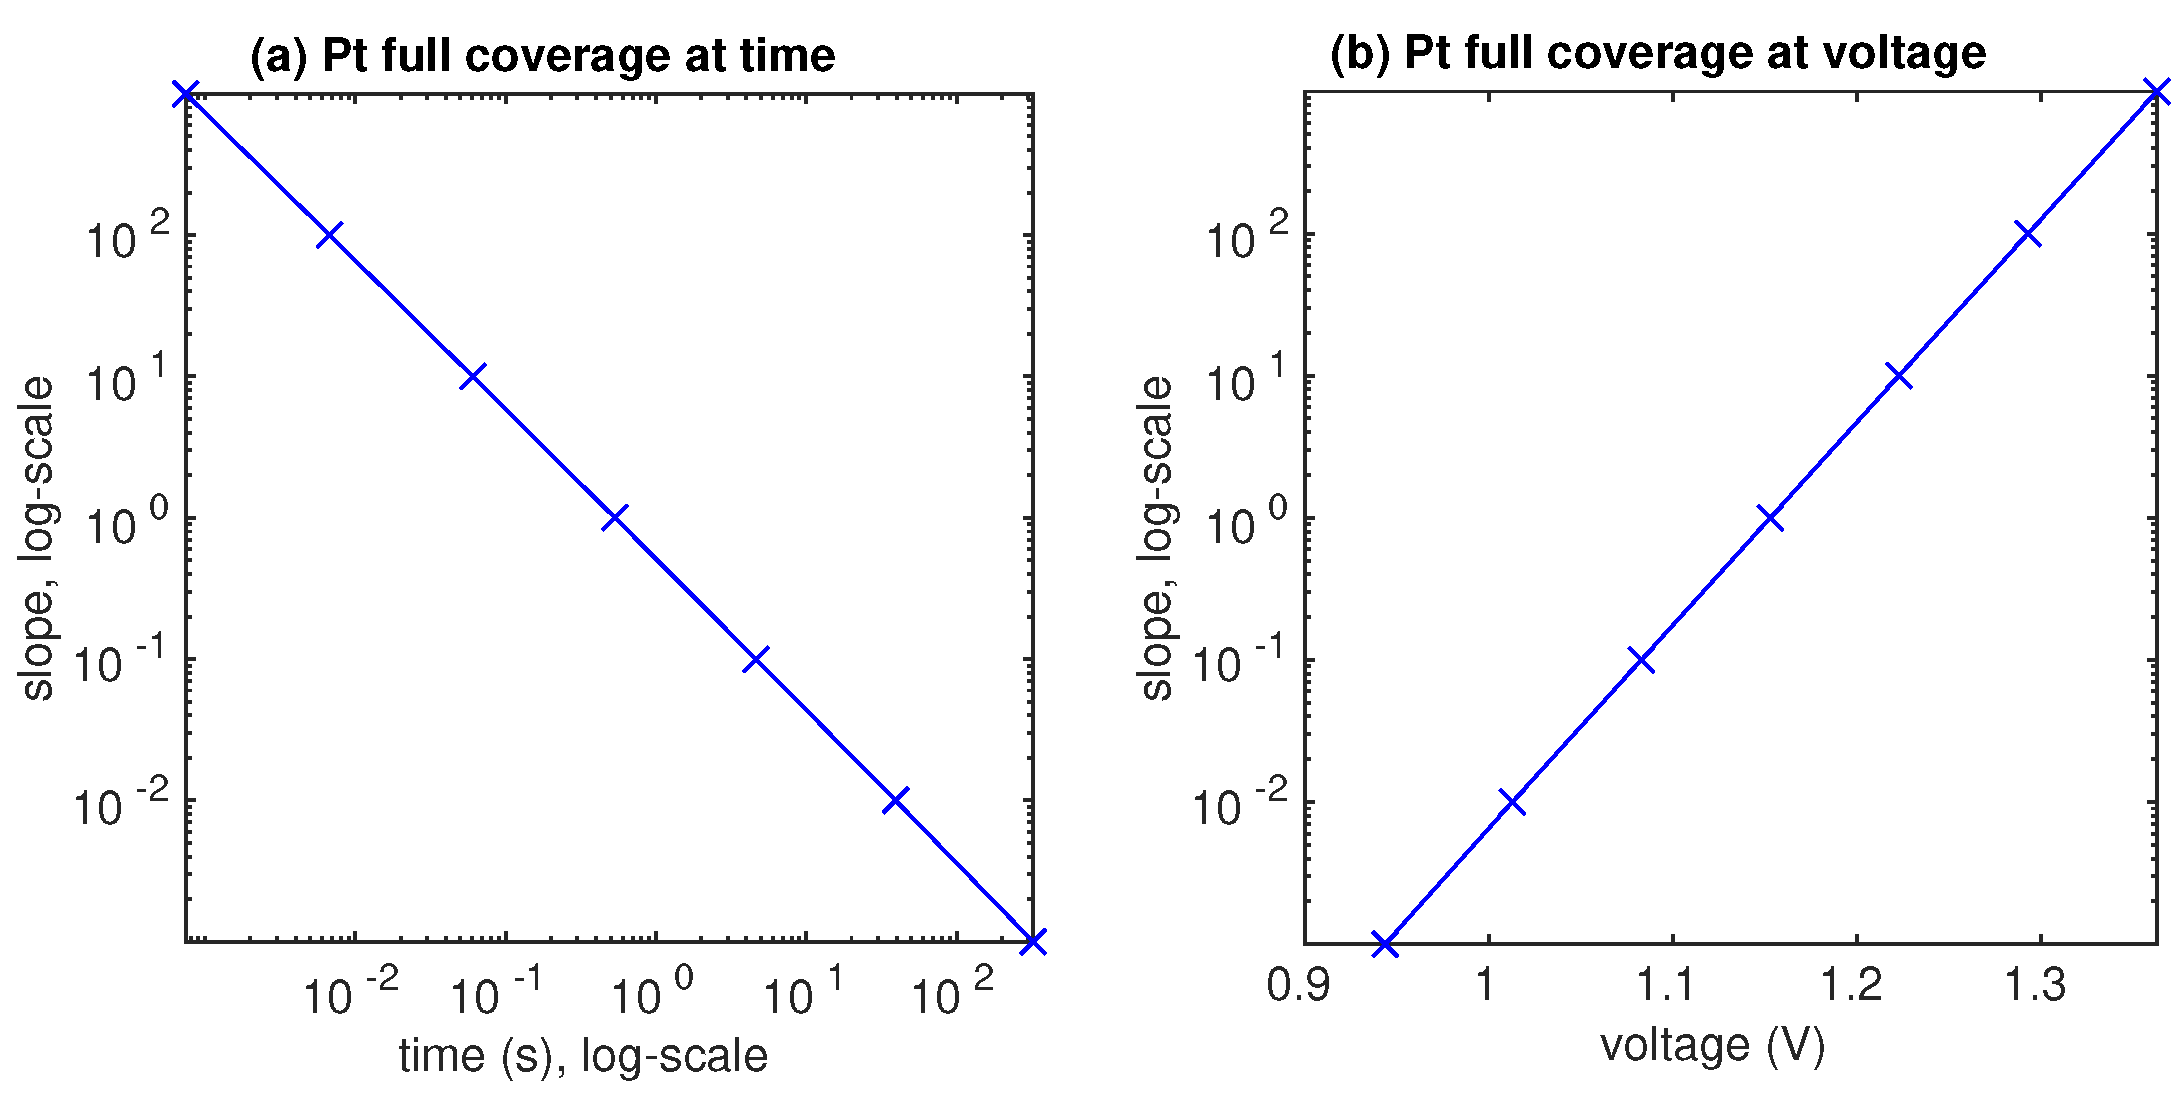
  • The AST simulation shows that larger slope affects smaller critical time and larger critical voltage when Pt surface of the catalyst layer is completely covered by PtO.
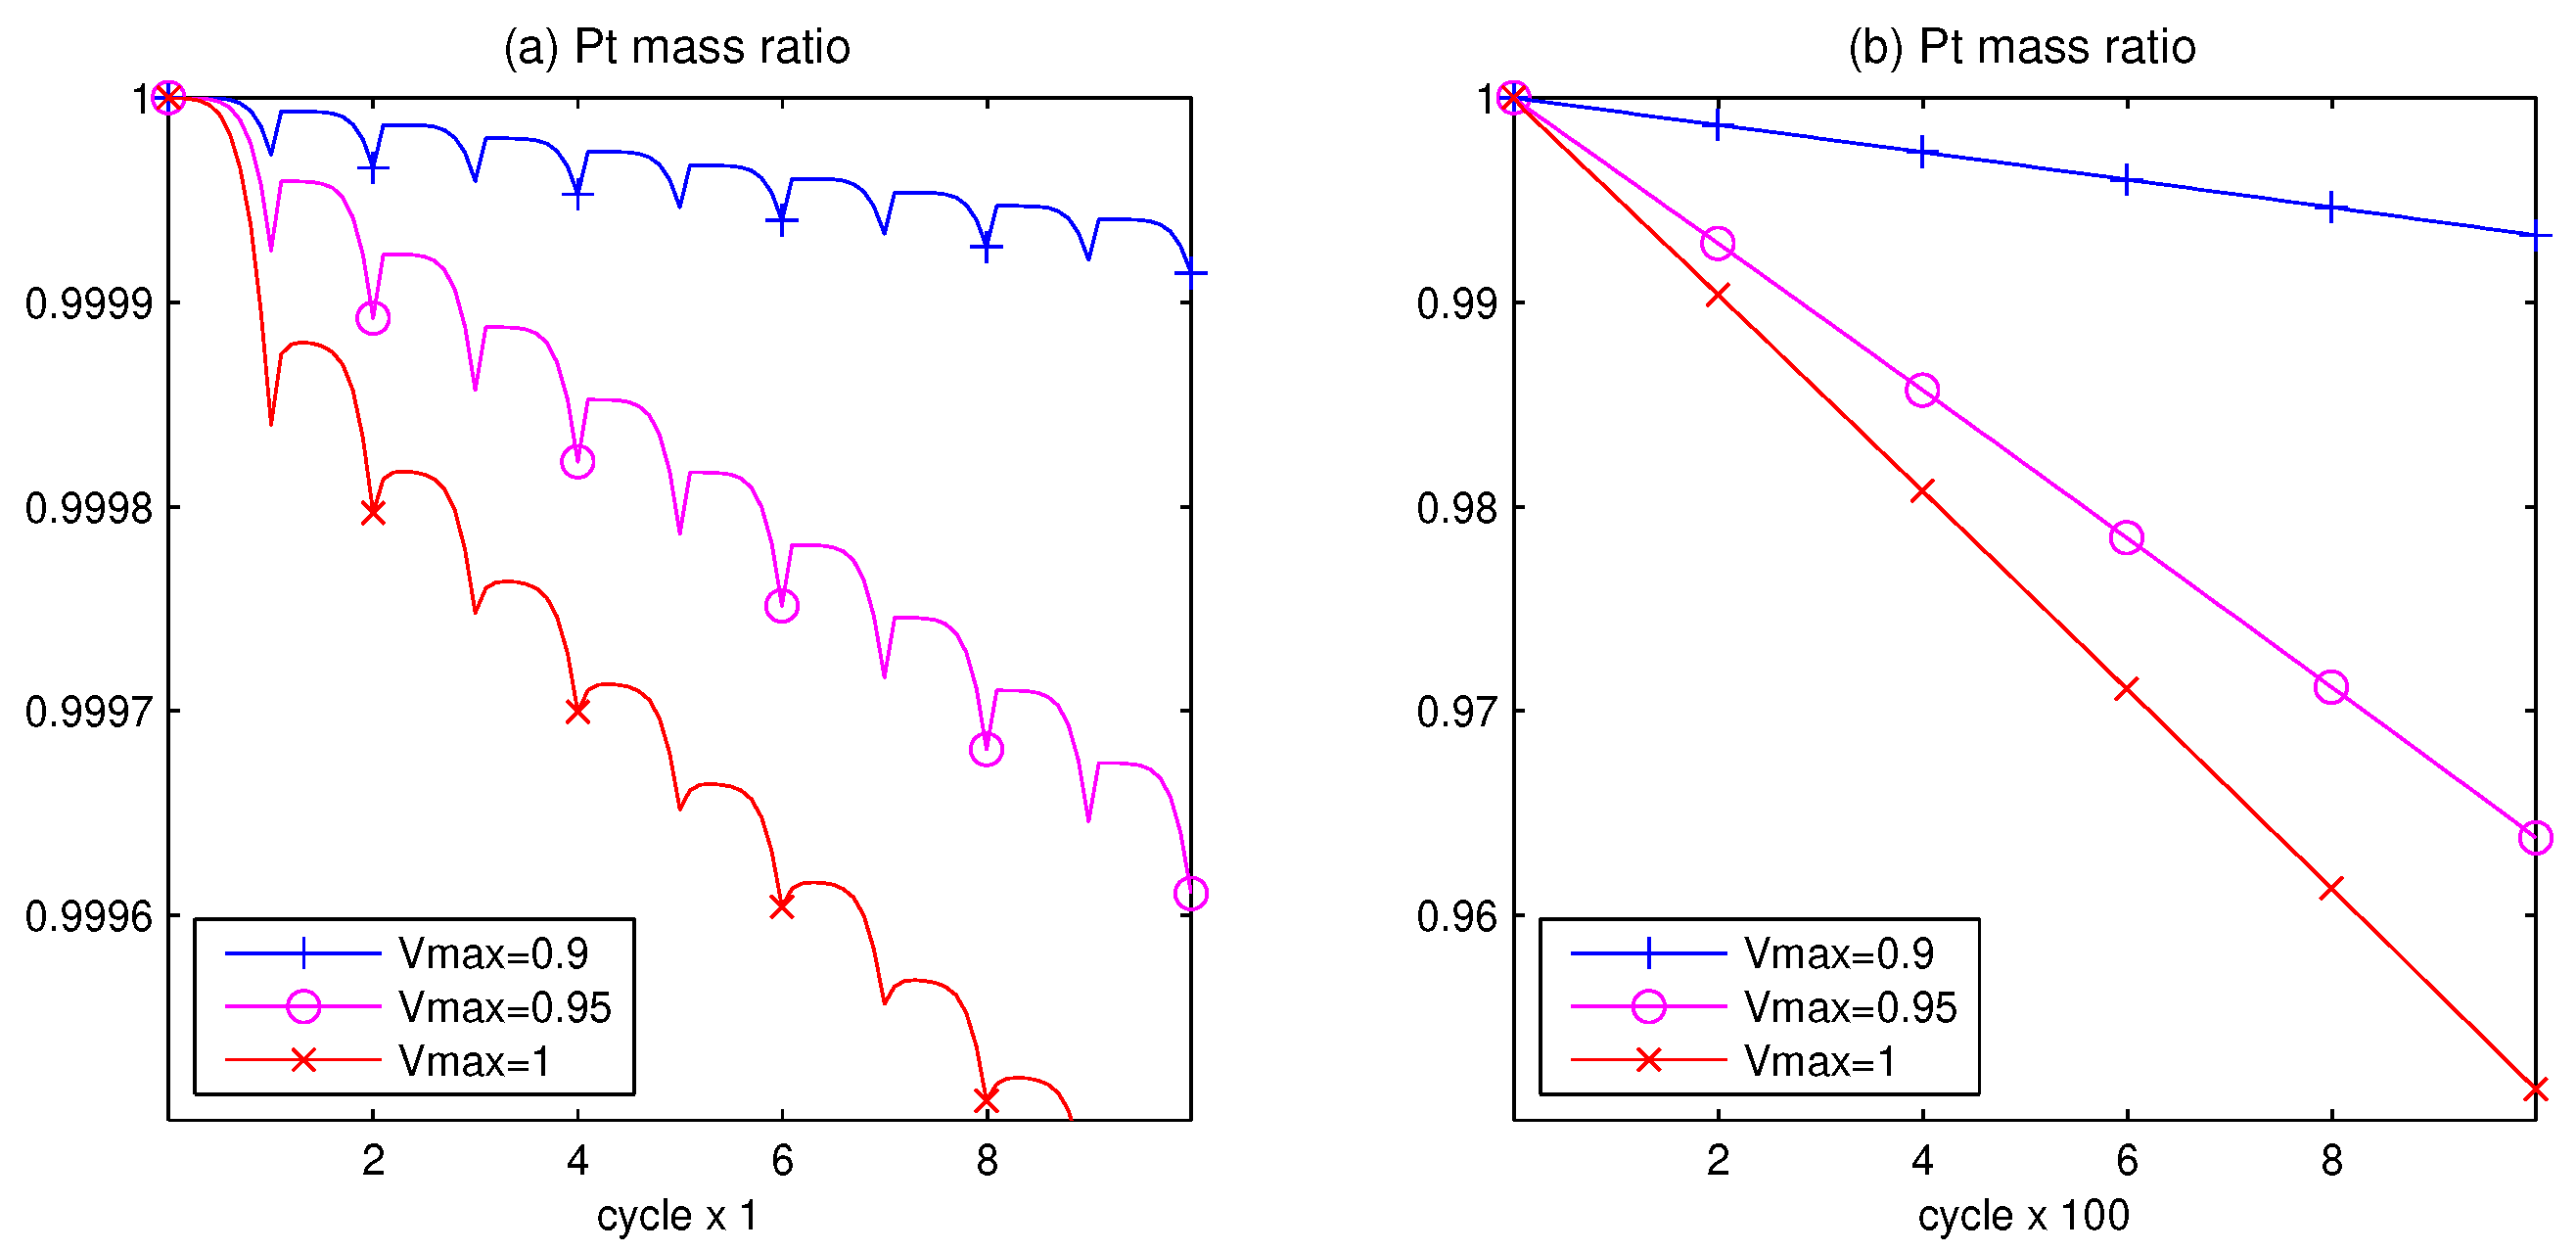
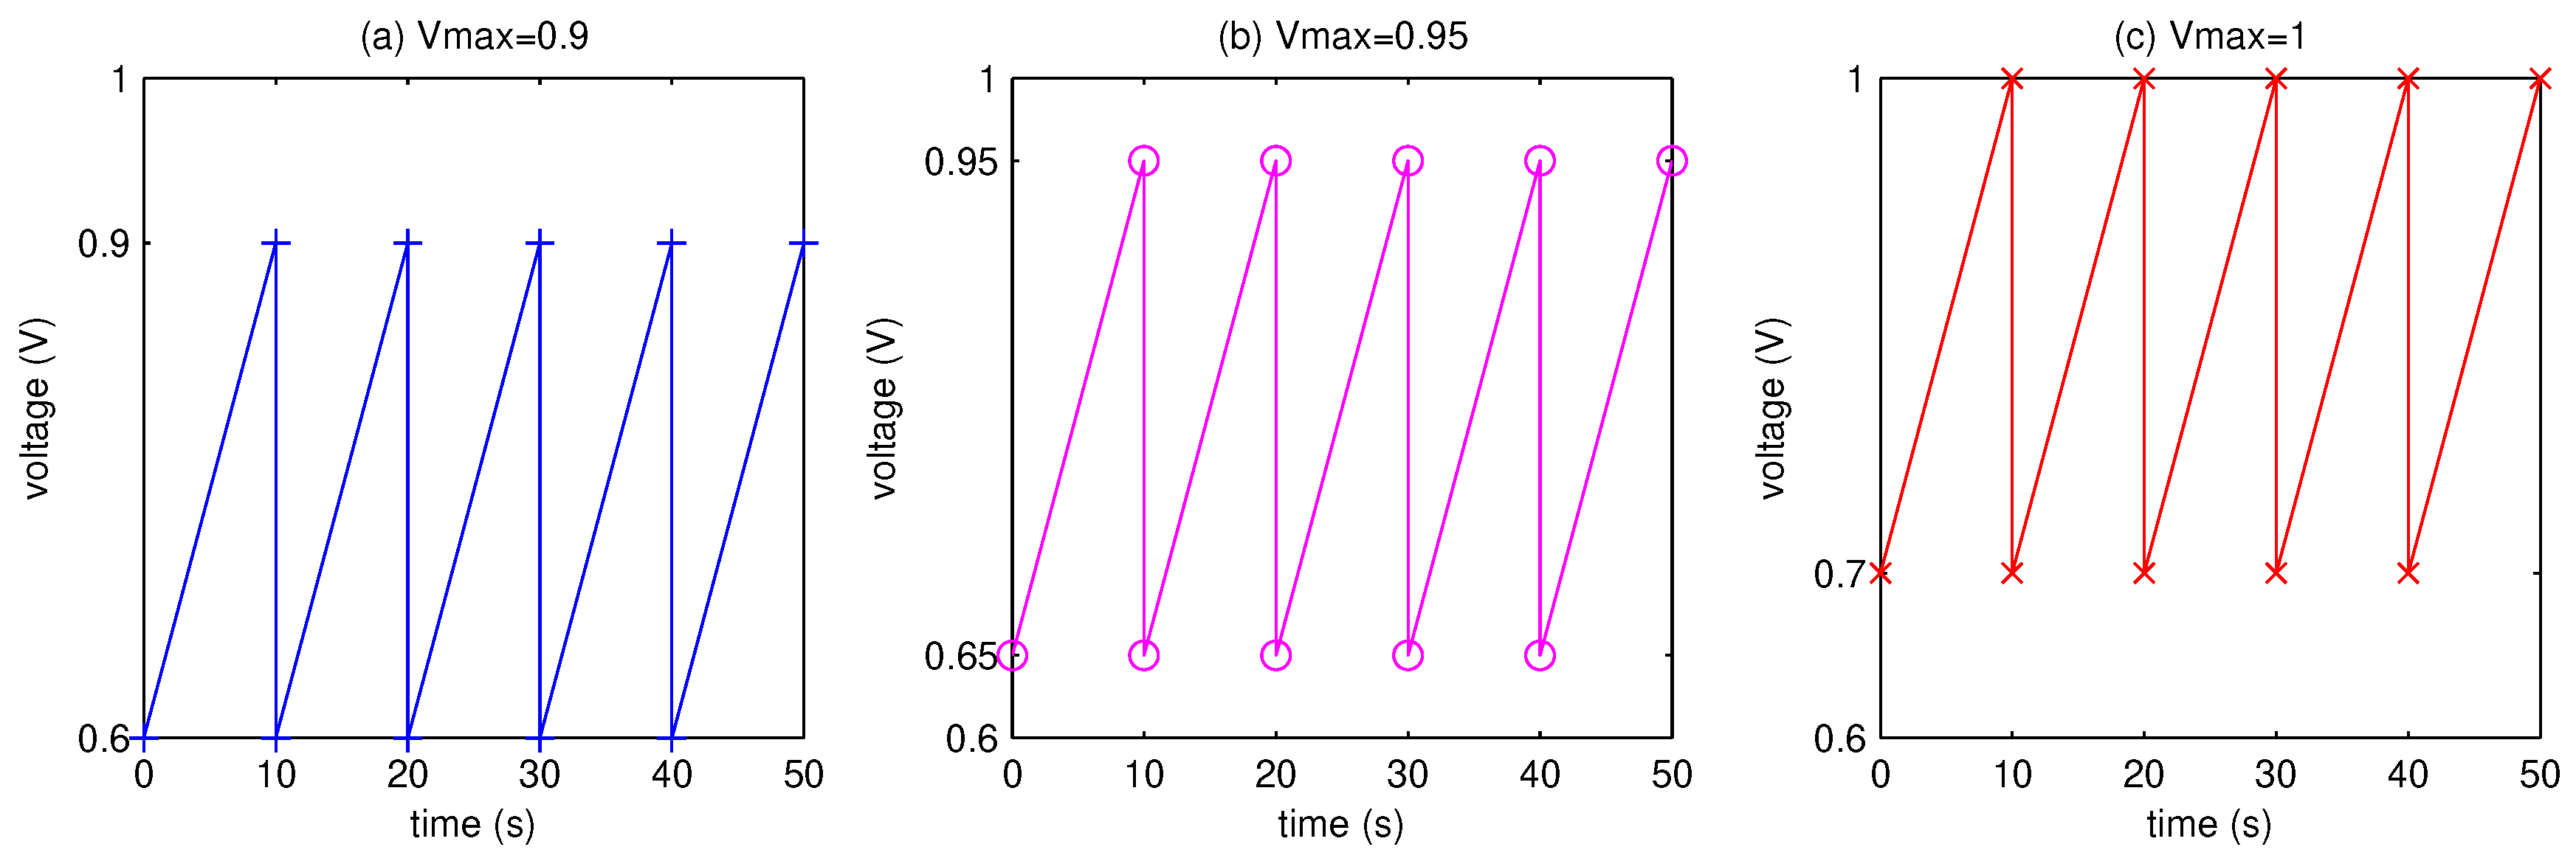
  • The computer tests demonstrate that the higher the potential difference, as well as the higher the upper potential level, the stronger the degradation phenomenon.
  • Since the Pt mass loss is linear, its extrapolation from finite cycles to the full coverage, when CL is blocked, gives a prognosis for the catalyst lifetime.

Author Contributions

Conceptualization, L.K.-J.; methodology, L.K.-J.; software, V.A.K.; validation, L.K.-J.; formal analysis, V.A.K.; investigation, V.A.K. All authors have read and agreed to the published version of the manuscript.

Funding

V.A.K. is supported by the Austrian Science Fund (FWF) project P26147-N26: PION and the European Research Council (ERC) under European Union’s Horizon 2020 Research and Innovation Programme (advanced grant No. 668998 OCLOC).

Institutional Review Board Statement

Not applicable.

Informed Consent Statement

Not applicable.

Data Availability Statement

Data sharing not applicable.

Acknowledgments

Thank Open Access Funding by the University of Graz for their partial support.

Conflicts of Interest

The authors declare no conflict of interest.

Abbreviations

The following abbreviations are used in this manuscript:
ASTaccelerated stress test
Ccarbon
CLcatalyst layer
FCfuel cell
GDLgas diffusion layer
ODEordinary differential equation
Ptplatinum
PtOplatinum oxide
Pt 2 + platinum ion
PEMpolymer electrolyte membrane

References

  1. Eikerling, M.; Kulikovsky, A. Polymer Electrolyte Fuel Cells: Physical Principles of Materials and Operation; Elsevier: Amsterdam, The Netherlands, 2017. [Google Scholar]
  2. Hacker, V.; Mitsushima, S. Fuel Cells and Hydrogen: From Fundamentals to Applied Research; Elsevier: Amsterdam, The Netherlands, 2018. [Google Scholar]
  3. Kulikovsky, A.; Berg, T. Positioning of a reference electrode in a PEM fuel cell. J. Electrochem. Soc. 2011, 162, F843–F848. [Google Scholar] [CrossRef]
  4. Burlatsky, S.F.; Gummalla, M.; Atrazhev, V.V.; Dmitriev, D.V.; Kuzminyh, N.Y.; Erikhman, N.S. The dynamics of platinum precipitation in an ion exchange membrane. J. Electrochem. Soc. 2011, 158, B322–B330. [Google Scholar] [CrossRef]
  5. Karpenko-Jereb, L.; Sternig, C.; Fink, C.; Tatschl, R. Membrane degradation model for 3D CFD analysis of fuel cell performance as a function of time. International Journal of Hydrogen Energy 2016, 11, 13644–13656. [Google Scholar] [CrossRef] [Green Version]
  6. Fellner, K.; Kovtunenko, V.A. A singularly perturbed nonlinear Poisson–Boltzmann equation: Uniform and super-asymptotic expansions. Math. Meth. Appl. Sci. 2015, 38, 3575–3586. [Google Scholar] [CrossRef]
  7. Fellner, K.; Kovtunenko, V.A. A discontinuous Poisson–Boltzmann equation with interfacial transfer: Homogenisation and residual error estimate. Appl. Anal. 2016, 95, 2661–2682. [Google Scholar] [CrossRef] [PubMed] [Green Version]
  8. González Granada, J.R.; Kovtunenko, V.A. Entropy method for generalized Poisson–Nernst–Planck equations. Anal. Math. Phys. 2018, 8, 603–619. [Google Scholar] [CrossRef] [Green Version]
  9. Kovtunenko, V.A.; Zubkova, A.V. On generalized Poisson–Nernst–Planck equations with inhomogeneous boundary conditions: A-priori estimates and stability. Math. Meth. Appl. Sci. 2017, 40, 2284–2299. [Google Scholar] [CrossRef]
  10. Kovtunenko, V.A.; Zubkova, A.V. Mathematical modeling of a discontinuous solution of the generalized Poisson–Nernst–Planck problem in a two-phase medium. Kinet. Relat. Mod. 2018, 11, 119–135. [Google Scholar] [CrossRef] [Green Version]
  11. Kovtunenko, V.A.; Reichelt, S.; Zubkova, A.V. Corrector estimates in homogenization of a nonlinear transmission problem for diffusion equations in connected domains. Math. Meth. Appl. Sci. 2020, 43, 1838–1856. [Google Scholar] [CrossRef] [PubMed] [Green Version]
  12. Kovtunenko, V.A.; Zubkova, A.V. Homogenization of the generalized Poisson–Nernst–Planck problem in a two-phase medium: Correctors and estimates. Appl. Anal. 2021, 100, 253–274. [Google Scholar] [CrossRef] [Green Version]
  13. Khludnev, A.M.; Kovtunenko, V.A. Analysis of Cracks in Solids; WIT-Press: Boston, MA, USA, 2000. [Google Scholar]
  14. Holby, E.F.; Morgan, D. Application of Pt nanoparticle dissolution and oxidation modeling to understanding degradation in PEM fuel cells. J. Electrochem. Soc. 2012, 159, B578–B591. [Google Scholar] [CrossRef]
  15. Kovtunenko, V.A.; Karpenko-Jereb, L. Study of voltage cycling conditions on Pt oxidation and dissolution in polymer electrolyte fuel cells. J. Power Sources 2021, 493, 229693. [Google Scholar] [CrossRef]
  16. Li, Y.; Moriyama, K.; Gu, W.; Arisetty, S.; Wang, C.Y. A one-dimensional Pt degradation model for polymer electrolyte fuel cells. J. Electrochem. Soc. 2015, 162, F834–F842. [Google Scholar] [CrossRef] [Green Version]
  17. Stariha, S.; Macauley, N.; Sneed, B.T.; Langlois, D.; More, K.L.; Mukundan, R.; Borup, R.L. Recent advances in catalyst accelerated stress tests for polymer electrolyte membrane fuel cells. J. Electrochem. Soc. 2018, 165, F492–F501. [Google Scholar] [CrossRef]
  18. Marcu, A.; Toth, G.; Behm, R.J. Electrochemical test procedures for accelerated evaluation of fuel cell cathode catalyst degradation. Fuel Cells 2014, 14, 378–385. [Google Scholar] [CrossRef]
  19. Sugawara, Y.; Okayasu, T.; Yadav, A.P.; Nishikata, A.; Tsuru, T. Dissolution mechanism of platinum in sulfuric acid solution. J. Electrochem. Soc. 2012, 159, F779–F786. [Google Scholar] [CrossRef]
  20. Takei, C.; Kakinuma, K.; Kawashima, K.; Tashiro, K.; Watanabe, M.; Uchida, M. Load cycle durability of a graphitized carbon black-supported platinum catalyst in polymer electrolyte fuel cell cathodes. J. Power Sources 2016, 324, 729–737. [Google Scholar] [CrossRef] [Green Version]
Figure 1. The degradation model.
Technologies 09 00080 g001
Figure 2. The five voltage cycles with slopes: (a) α = 0.035 . (b) α = 0.03 . (c) α = 0.025 (V/s).
Technologies 09 00080 g002
Figure 3. The solution: (a) Pt 2 + concentration c. (b) Pt particle diameter d. (c) PtO coverage ratio θ .
Technologies 09 00080 g003
Figure 4. The values: (a) critical time t cr , cover (s). (b) critical voltage V cr , cover (V) for CL coverage under AST test.
Technologies 09 00080 g004
Figure 5. The Pt mass ratio m Pt for voltage slopes: (a) α = 0.035 . (b) α = 0.03 . (c) α = 0.025 (V/s).
Technologies 09 00080 g005
Figure 6. The averaged Pt mass ratio m ¯ Pt for various slopes α versus: (a) 10 cycles. (b) 1000 cycles.
Technologies 09 00080 g006
Figure 7. The five voltage cycles for fixed slope α = 0.03 (V/s), lower and upper potential levels: (a) ( V min , V max ) = ( 0.6 , 0.9 ) . (b) ( V min , V max ) = ( 0.65 , 0.95 ) . (c) ( V min , V max ) = ( 0.7 , 1 ) (V).
Technologies 09 00080 g007
Figure 8. The Pt mass ratio m ¯ Pt for voltage cycles from Figure 7 for: (a) 10 cycles. (b) 1000 cycles.
Technologies 09 00080 g008
Table 1. Parameters for Pt ion formation and diffusion.
SymbolValueUnitsDescription
ν 1 1 × 10 4 HzDissolution attempt frequency
ν 2 8 × 10 5 HzBackward dissolution rate factor
β 1 0.5 Butler–Volmer transfer coefficient for Pt dissolution
n2 Electrons transferred during Pt dissolution
U eq 1.18VPt dissolution bulk equilibrium voltage
Ω 9.09cm 3 /molMolar volume of Pt
γ 2.4 × 10 4 J/cm 2 Pt [1 1 1] surface tension
c ref 1mol/cm 3 Reference Pt ion concentration
H 1 , fit 4 × 10 4 J/molFit Pt dissolution activation enthalpy
D Pt 1 × 10 6 cm 2 /sDiffusion coefficient of Pt ion in the membrane
Table 2. Parameters for Pt oxide formation.
SymbolValueUnitsDescription
p H 0 Potential of hydrogen ions (protons)
ν 1 1 × 10 4 HzForward Pt oxide formation rate constant
ν 2 2 × 10 2 HzBackward Pt oxide formation rate constant
Γ 2.2 × 10 9 mol/cm 2 Pt surface site density
β 2 0.5 Butler–Volmer transfer coefficient for PtO formation
n 2 2 Electrons transferred during Pt oxide formation
U fit 0.8VPt oxide formation bulk equilibrium voltage
λ 2 × 10 4 J/molPt oxide dependent kinetic barrier constant
ω 5 × 10 4 J/molPt oxide–oxide interaction energy
H 2 , fit 1.2 × 10 4 J/molFit partial molar oxide formation activation enthalpy
Table 3. The loss of Pt mass ratio before m ¯ Pt = 0 under various voltage cycles.
V min (V) V max (V) α (V/s)Rate of Pt Mass LossPrognosis (# Cycles)Lifetime (h)
0.60.850.0250.9999997.18527  × 10 6 19,959
0.60.90.030.993257148,304412
0.60.950.0350.97370438,028106
0.650.950.030.96380627,62997
0.710.030.95149420,61657
Publisher’s Note: MDPI stays neutral with regard to jurisdictional claims in published maps and institutional affiliations.

