Article

Respiration Measurement in a Simulated Setting Incorporating the Internet of Things

1
Industry and Innovation Research Institute, Sheffield Hallam University, Sheffield S1 1WB, UK
2
Sheffield Children’s Hospital, Sheffield S10 2TH, UK
*
Author to whom correspondence should be addressed.
Technologies 2021, 9(2), 30; https://doi.org/10.3390/technologies9020030
Submission received: 18 March 2021 / Revised: 8 April 2021 / Accepted: 22 April 2021 / Published: 24 April 2021

Abstract

:
The Internet of Things (IoT) in healthcare has gained significant attention in recent years. This study demonstrates an adaptation of IoT in healthcare by illustrating a method of respiration rate measurement from a platform that simulates breathing. Respiration rate is a crucial physiological measure in monitoring critically ill patients. The devised approach, with further development, may be suitable for integration into neonatal intensive care units (NICUs) to measure infants’ respiration rate. A potential advantage of this method is that it monitors respiration using a wireless non-contact method and could add benefits such as preservation of skin integrity. The paper aimed to assess the accuracy of an IoT-integrated ultrasound (US)-based method for measuring respiration rate. Chest movement due to respiration was simulated by a platform with a controllable moving surface. The magnitude and frequency of the movements were accurately controlled by a signal generator. The surface movements were tracked using US as a reliable and cost-effective technology. ESP8266 NodeMCU was used to wirelessly record the US signal and ThingSpeak and Matlab© were used to analyze and visualize the data in the cloud. A close relationship between the measured rate of the simulated respiration and the actual frequency was observed. The study demonstrated a possible adaption of IoT for respiration rate measurement, however further work will be needed to ensure security and reliability of data handling before use of the system in medical environments.

1. Introduction

In this section, an overview of the Internet of Things (IoT) in healthcare is provided. Then, the need for measuring respiration rate (RR) and approaches for its measurement are introduced.

1.1. The IoT in Healthcare

The IoT is a collection of physical devices that are connected through the internet. These devices have sensors capable of transmitting to and receiving data from other devices or networks, through the cloud or the internet, along with distinct capabilities to analyze, make decisions or carry out important tasks [1,2,3,4,5].
The IoT is having an increasing impact in the medical field in assisting with monitoring patients and supporting healthcare activities [6,7]. The Internet of Medical Things (IoMT) is a subdivision of the IoT that deals with interconnected medical devices and equipment that constitute healthcare information technology. IoMT solutions offered by healthcare organizations are creating opportunities in improving clinical efficiency, home or remote monitoring, wearable sensors for physiological measurements and sleep monitoring conditions [8,9]. The developments in 5G networks can facilitate greater and more effective adaptation of the IoT [10] with smart healthcare solutions extending to asset management, remote monitoring, assisted living and telemedicine [11,12].
An IoT structure consists of devices or sensors to gather information, local networks to translate proprietary communication to the Internet Protocol (IP), the internet and back-end services. The back-end services may be embedded or stand-alone [13]. The architecture of IoT in healthcare organizations may be organized as perception, application and network layers [14]. The perception layer relates to the sensing units that gather relevant medical data. These include radio frequency identification (RFID), infrared, vision, location, temperature, humidity and electrophysiological data. The network layer deals with data communication and storage. The communication can be wired or wireless (e.g., Bluetooth, ZigBee, Wi-Fi). Data storage can be local or cloud server-based. Cloud storage can provide flexibility and scalability, but patient data security needs careful consideration [15]. The interpretation of the data and delivering application-specific services to the user are achieved by the application layer.
Medical applications of the IoT utilizing artificial intelligence (AI) have significantly grown in recent years [16]. AI and the IoT could complement each other to facilitate wearable devices, remote connectivity, diagnosis and monitoring, sensor networks and patient care [17]. The move toward digitalization and adaptation of associated technologies such as the IoT, mobile wireless computing with effective data processing and AI have resulted in emergence of ‘smart hospitals’ [18]. In these environments, quality of service (QoS) for delivering applications plays a key role. QoS refers to mechanisms that allow performance of wireless computer networks to be assessed and the resulting information be used to improve transmission of applications (e.g., video, audio, data) according to their requirements [19,20,21,22,23].
Non-uniformity in the architecture of interconnecting intelligent devices in smart hospitals has resulted in the development of narrowband IoT (NB-IoT) [24]. NB-IoT has the advantages of reduced cost and power consumption and has the potential to formalize architecture for connecting intelligent devices in smart hospitals [25].
A fundamental aspect of the IoT applied to healthcare is its handling of critical but extensive patient data, also referred to as ‘big data’. These data have been characterized by ‘three Vs’, i.e., volume, variety and velocity (i.e., speed the data can be accessed and interpreted) [7].
The diversity of IoT sensors and their applications can increase the risk of unauthorized data access that could jeopardize patient privacy, loss or corruption of data [26]. IoT architecture by nature can be dynamic, i.e., devices may connect and disconnect as needed [27]. This may increase the risk of unauthorized devices connecting to the network. A study providing a detailed review of the IoT highlighted ten associated security factors in the medical field [28]. These are confidentiality, i.e., securing patients’ personal details, integrity, i.e., no alteration of data by adversaries, authentication, i.e., correct recognition of node accessing the network, availability, i.e., reliable IoT services as needed, data freshness, i.e., up to date information, non-repudiation, i.e., a node not denying the information it had sent, authorization, i.e., only those permitted allowed access to the network services or resources, resilience, i.e., ability to recover when some interconnected devices are compromised, fault tolerance, i.e., ability to continue operating properly in the event of the failure of some components, and self-healing, i.e., the process of recovery and ability to maintain a level of services following a failure. Other security-related issues include accountability and auditing [29]. Accountability ensures organizations or individuals are responsible for their actions and auditing facilitates monitoring of an individual’s interactions (e.g., login, data modifications) with the IoT network.
A study reported an IoT generic model with the privacy and security policies as the central element that interacts with end users, cloud and devices/sensors [30]. Solutions to improve IoT security were proposed that included access control and management, awareness of information security by medical staff, physical security of IoT devices and data, network security, firewalls, intrusion detection and prevention systems, ingress/egress filtering, internet protocol security, secure Sockets layer/transport layer security and use of HTTPS to allow message encryption. Encryption can help to overcome the ubiquitous nature of the IoT that can result in compromise of a patient’s privacy [31]. IoT security has been explored by considering the four-layer architecture of the IoT, i.e., application, middleware, network and perception layers [32]. The IoT in the medical field has security and privacy issues in all layers [33]. The perception layer acquires medical data (e.g., heart rate, respiration rate) from sensors and transfers them to the network layer. The forms of attack at the different layers could be [34]:
  • Application layer: account hijacking, ransomware and brute force
  • Middleware layer: cross-sire request forgery and scripting, session hijacking
  • Network layer: eavesdropping, replay, access, denial of service
  • Perception layer: device tampering
IoT devices can be prone to hardware and software malicious attacks [35,36]. The attacks can be considered from the points of view of the IoT layers, methods, origins and levels of complexity [37].

1.2. Respiration Rate

Respiration rate (RR) represents average number of breaths per minute (i.e., average number of times air is inhaled and exhaled per minute). Its unit is breaths per minute (bpm). Its value varies in children and adults. It is around 15 bpm in healthy adults, and it is higher in young healthy children. RR is an important indicator of deterioration in critically ill patients and its monitoring is therefore clinically crucial [38].
The need for an accurate measurement of RR has been reported in several studies [39,40,41,42,43,44,45]. Respiratory rate is often not recorded due to the difficulties in its measurement [41], even though an abnormal respiratory rate can be an important predictor of serious events such as cardiac arrest. RR is probably the most in need of continuous monitoring among vital signs [42]. These points were further emphasized in other studies [43,44,45,46].
A number of approaches were devised to measure respiration rate, each having its own merits. In this section, some of these approaches are very briefly introduced. Respiratory airflow can be measured using nasal prongs placed in the nostrils [47]. This is an accurate method of measuring respiration rate as it directly detects respiratory airflow. However, since the prongs are placed in the nostril, it is not comfortable for some young children and they either refuse to accept it, or may remove it during long-term monitoring, such as an overnight recording. It also misses any respiratory airflow caused by mouth-oriented breathing.
Respiration rate has been measured by infrared thermal imaging. Using this method, the variations in infrared emission centered on the nose as the air is inhaled and exhaled are converted to a respiratory signal and respiration rate is obtained from it. The method is noncontact, i.e., the measurement device is not attached to the subject’s body and thus it is better tolerated by children than nasal prongs. However, body movement during the recording needs to be tracked using a suitable procedure to ensure the correct region in the recorded thermal images is processed [48,49,50].
A thermistor placed close to the nose can also measure the respiratory-related temperature variations as the air is inhaled and exhaled and thus is another valid approach to measure respiration rate. However, the method can be affected by changes in skin and room temperature [40]. Monitoring chest movements using strain gauge sensors [51] and visual video imaging [52] provide other respiratory rate measurement solutions.
In the following sections, a description of IoT for neonatal intensive care units (NICUs) is provided due to the relevance of the IoT-integrated RR measurement approach for NICUs, the set-up used to simulate respiration rate measurement is outlined, the integration of IoT into the simulated respiration rate measurement system is explained and the results obtained are discussed.

2. IoT for the Neonatal Intensive Care Unit (NICU)

NICUs take care of premature babies who are unable to survive on their own and need the aid of incubators, monitors and breathing devices. Babies stay in a NICU from days to weeks depending on their health condition and whether they are born at full-term or prematurely [53]. Neonates are nursed in incubators to maintain a constant body temperature and are monitored to ensure physiological parameters such as heart rate and RR are within their expected ranges and to direct clinical intervention when the infant’s health is at risk [54]. Monitoring of RR is carried out by nurses who count the breaths per minute visually or using a stethoscope or via electrocardiography (ECG) stickers on the chest using an algorithm to calculate RR. Blood oxygen and carbon dioxide levels are measured using pulse oximetry, capillary or arterial blood sampling. Due to the fragile nature of the skin of premature neonates, this study explored a non-contact physiological measurement approach whereby the sensing unit is not attached to the body [55]. Infrared thermal imagining as a non-contact method for monitoring and diagnosis in neonates has previously proved effective in an NICU environment. For example, infrared thermal imaging was used to detect inflammatory intra-abdominal pathology in infants [56].
Integration of IoT into an NICU requires a wireless connection to IoT devices with 3G or higher, WiFi mesh or WiMax. For data transmission, solutions with universal computing are available, e.g., radio frequency identification (RFID), Bluetooth, ZigBee and wireless sensor networks (WSNs). Many hospitals use wireless local area networks (WLANs) for communication and patient data handling. WLANs and Wireless Personal Area Networks (WPANs) are the most affordable wireless network solutions for neonatal monitoring [57]. The mobility feature of WPANs helps to track other devices and facilitates non-obstructive neonatal monitoring [57].
By integrating a neonatal incubator with the IoT, parameters like RR can be monitored remotely via the internet. If the measured parameter moves out of the safe limits, it can be raised to the responsible healthcare provider through an SMS or an alarm to indicate the anomaly, thereby providing timely attention to the infant in the NICU. The electronic devices in NICUs are essentially IoT objects which are always connected to the internet, and then to a private or the public cloud. These objects are accessible remotely. They can interact with each other directly, through a process called Machine-To-Machine (M2M) communication. IoT objects send data continuously to the web using services like ubidots that also store data online. They trigger certain events in the cloud based on the data monitoring in the incubator. An advantage of the remote monitoring system is that clinicians can access real-time health data and monitor patients regularly through automated workflows or email and treat them at the onset of a health problem. A model of IoT-embedded NICU transmitting data over the cloud from sensors has been reported [58].

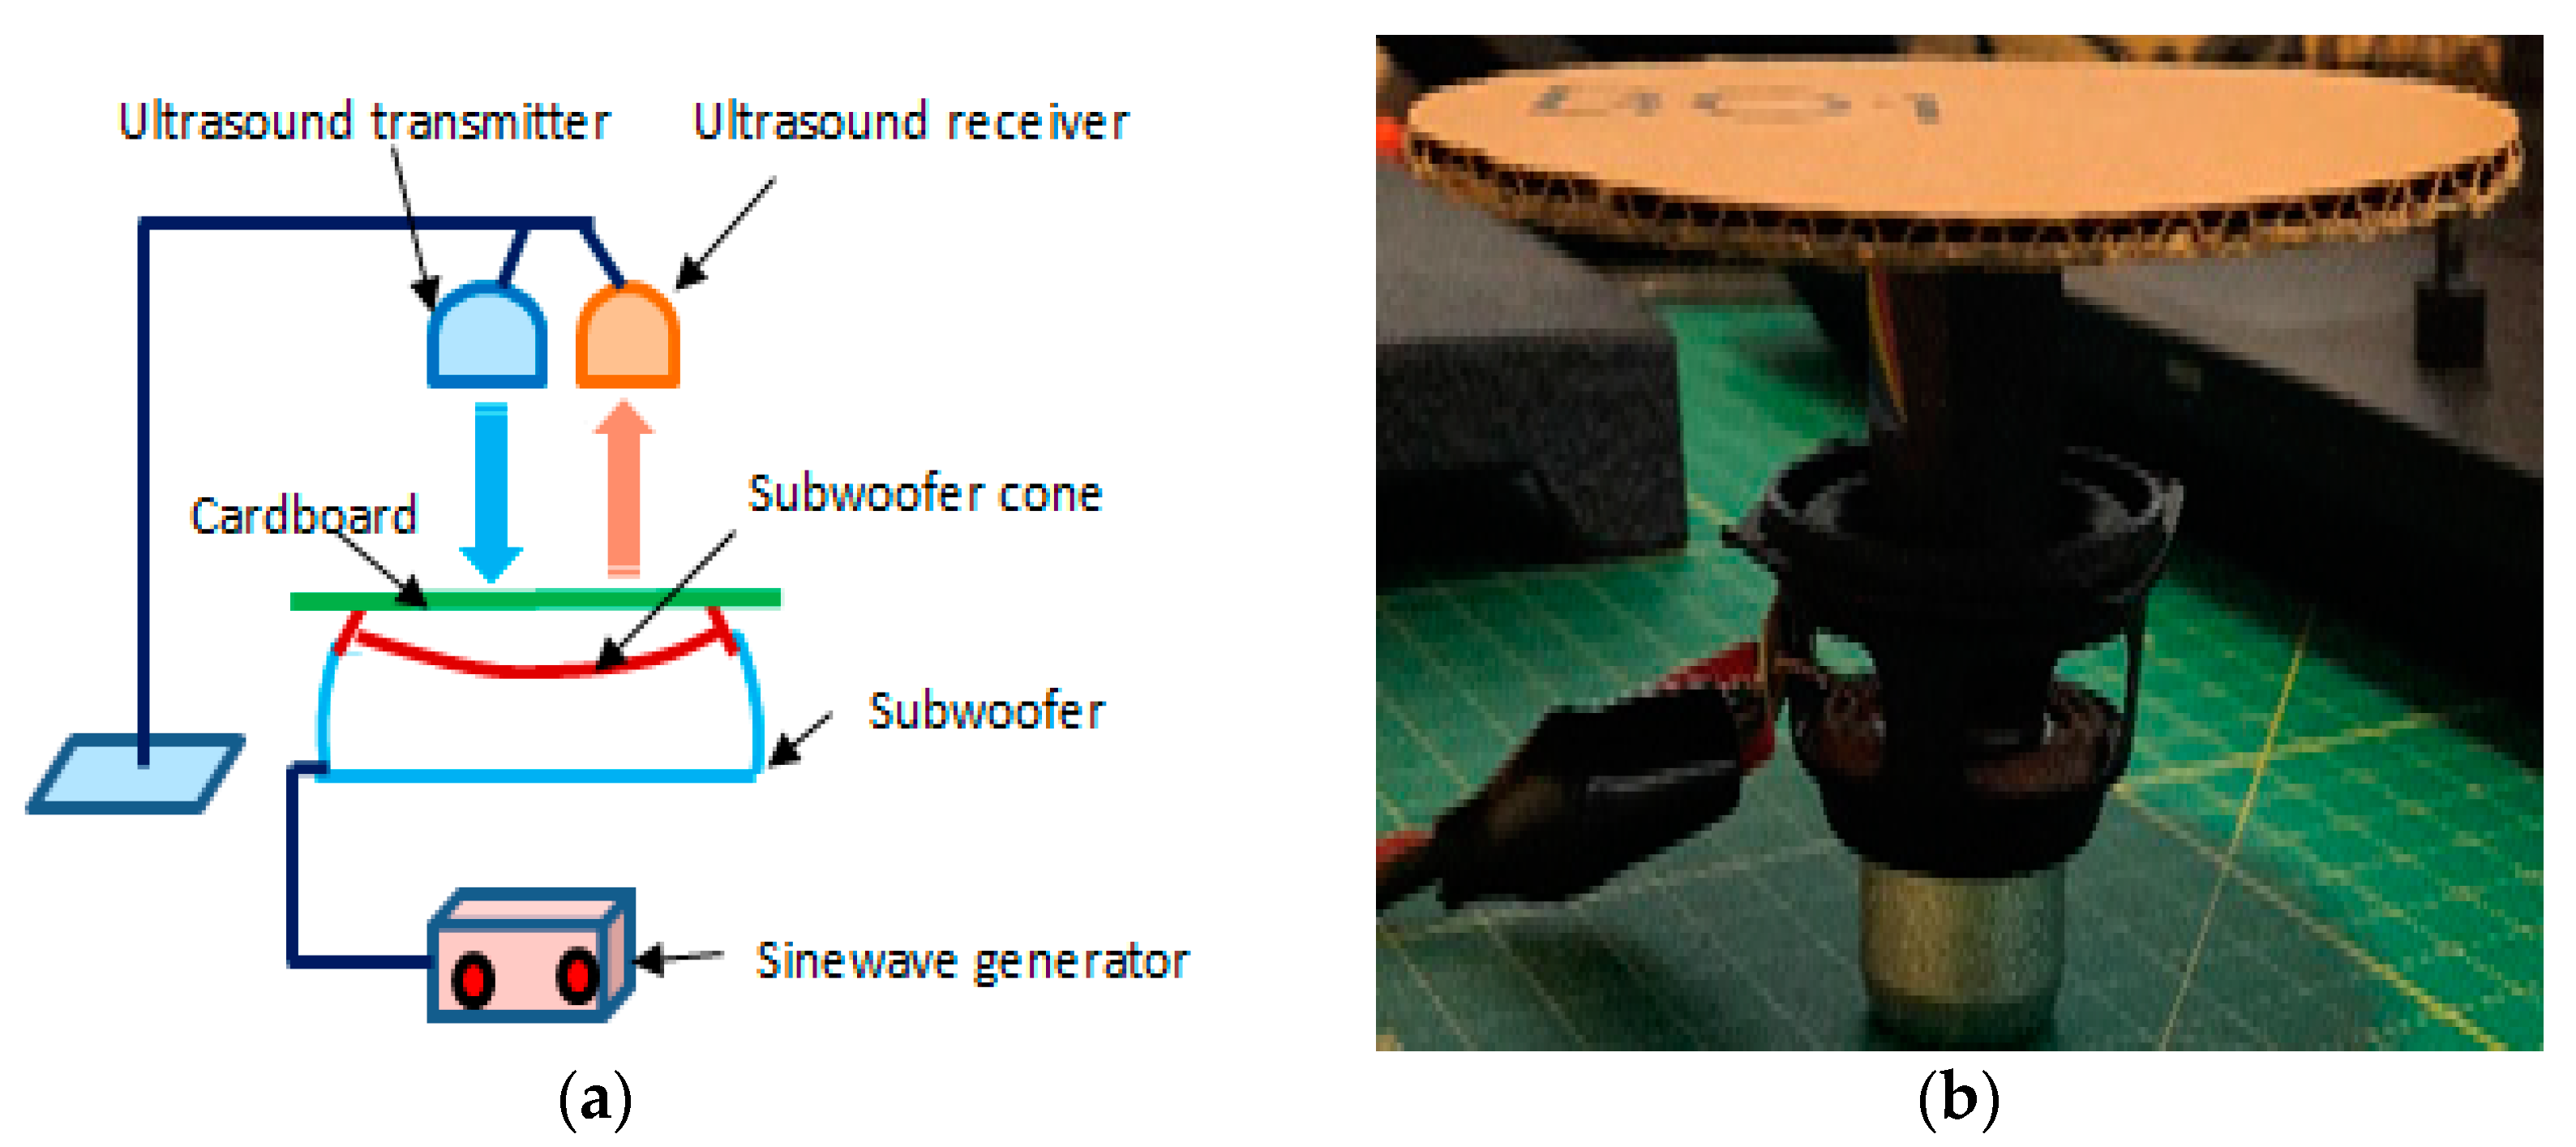
3. Set-Up for the Simulated Respiration Rate Measurement

In this section, a prototype IoT-integrated system for noncontact respiration rate (RR) measurement is described. An ultrasound (US) sensor was used to track simulated chest movements associated with respiration. Neonates in incubators do not move around significantly, therefore once the US transceiver is focused on the neonate’s chest, they could remain within the US recording beam. If the infant moves outsides the field of view of the US beam, a repositioning of the US transmitter and its associated receiver would be needed. This repositioning should be automatic through a feedback mechanism, however in this study, this feature was not implemented. Furthermore, in some infants, respiration may also cause abdominal movements and so both the chest and abdomen should be tracked. Again, this feature was not incorporated in this study. For clinical deployment, these features should be considered.
An US sensor transmits a high-frequency sound wave to the surface being tracked. A proportion of its energy is reflected back to the US receiver. This distance between the US source and the surface (L) can be measured by
L = 0.5 vt cos(α)
where t is the time taken for the wave to propagate to the surface and reflect back to the US receiver, v is the speed of the US wave in air and α is the angle between the transmitted and received US waves. The factor 0.5 is included as t represents the time taken for the US wave to propagate to the surface and to return from it, i.e., covering a distance of 2L. When the US transmitter and receiver are close to each other, α could be considered as zero, hence L = 0.5 vt.
The current face-to-face meeting restrictions (ethical issues) imposed due to COVID-19 at the time of this study prevented a clinical trial involving testing the method on patients. Instead, a set-up was devised to test the effectiveness of the system. This set-up simulated chest movements associated with respiration. It consisted of an accurate sinewave signal generator connected to a subwoofer. The surface of the subwoofer’s cone was covered with a flat circular cardboard. Using this set-up, the magnitude and frequency of the movements of the surface could be accurately controlled by adjusting the amplitude and frequency of the sinewave signal produced by the signal generator. This set-up is shown in Figure 1. The distance of the US transceiver to the surface was 50 cm. The sample rate used in the data recording was 20 samples per seconds.

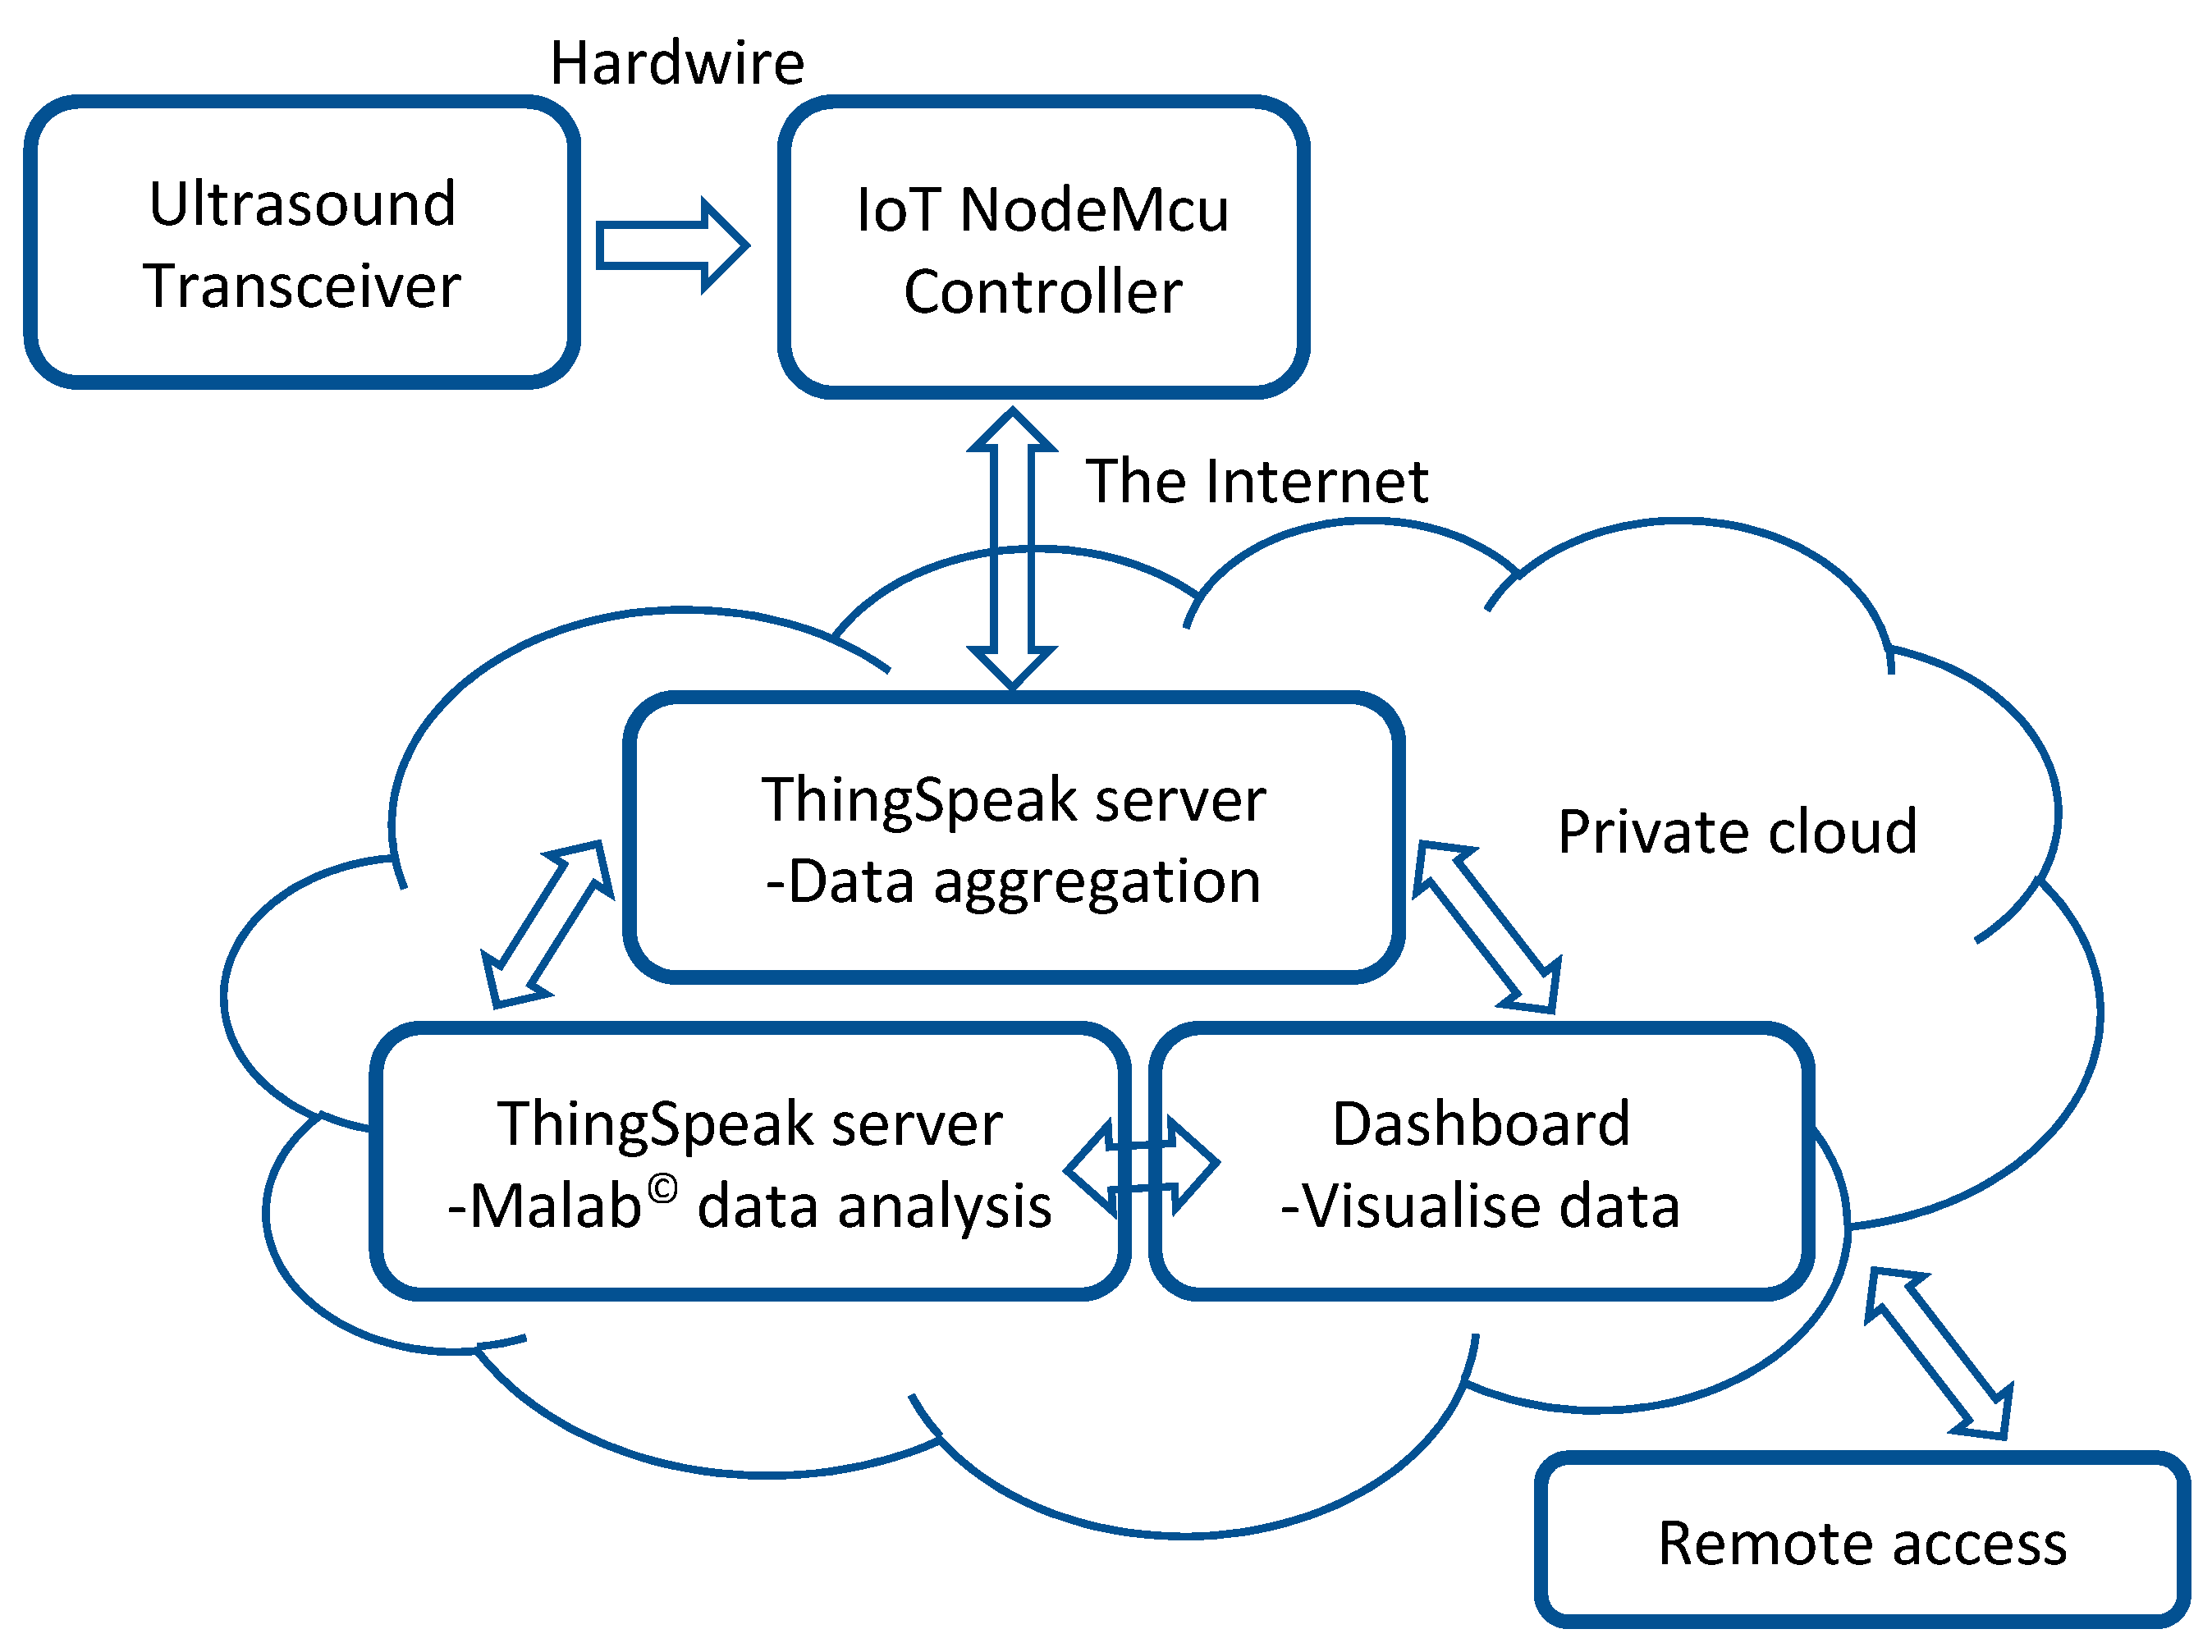
4. Integration of IoT into the Simulated Respiration Rate Measurement System

This section explains the integration of the IoT as part of the simulated respiration rate measurement system. It outlines the methodology used to record the US signal, its transmission, analysis, display and determination of respiration rate. The set-up for remote monitoring of the recorded data from the cloud by IoT devices is explained. The hardware elements employed were: ESP8266 NodeMCU and a US transceiver (transmitter/receiver). The recorded real-time US data were wirelessly transmitted to the ThingSpeak every 15 s. Data analysis was performed in real-time and results were displayed utilizing the cloud. The steps involved were:
  • Receiving the US signal reflected from the surface being monitored.
  • Real-time wireless US data transmission to the ThingSpeak server.
  • Data aggregation and analysis that included respiration rate calculation through the ThingSpeak server.
  • Displaying the results through the ThingSpeak server with the aid of integrated Matlab© software.
The elements used for the set-up are shown in Figure 2. The details of elements making up the system are:
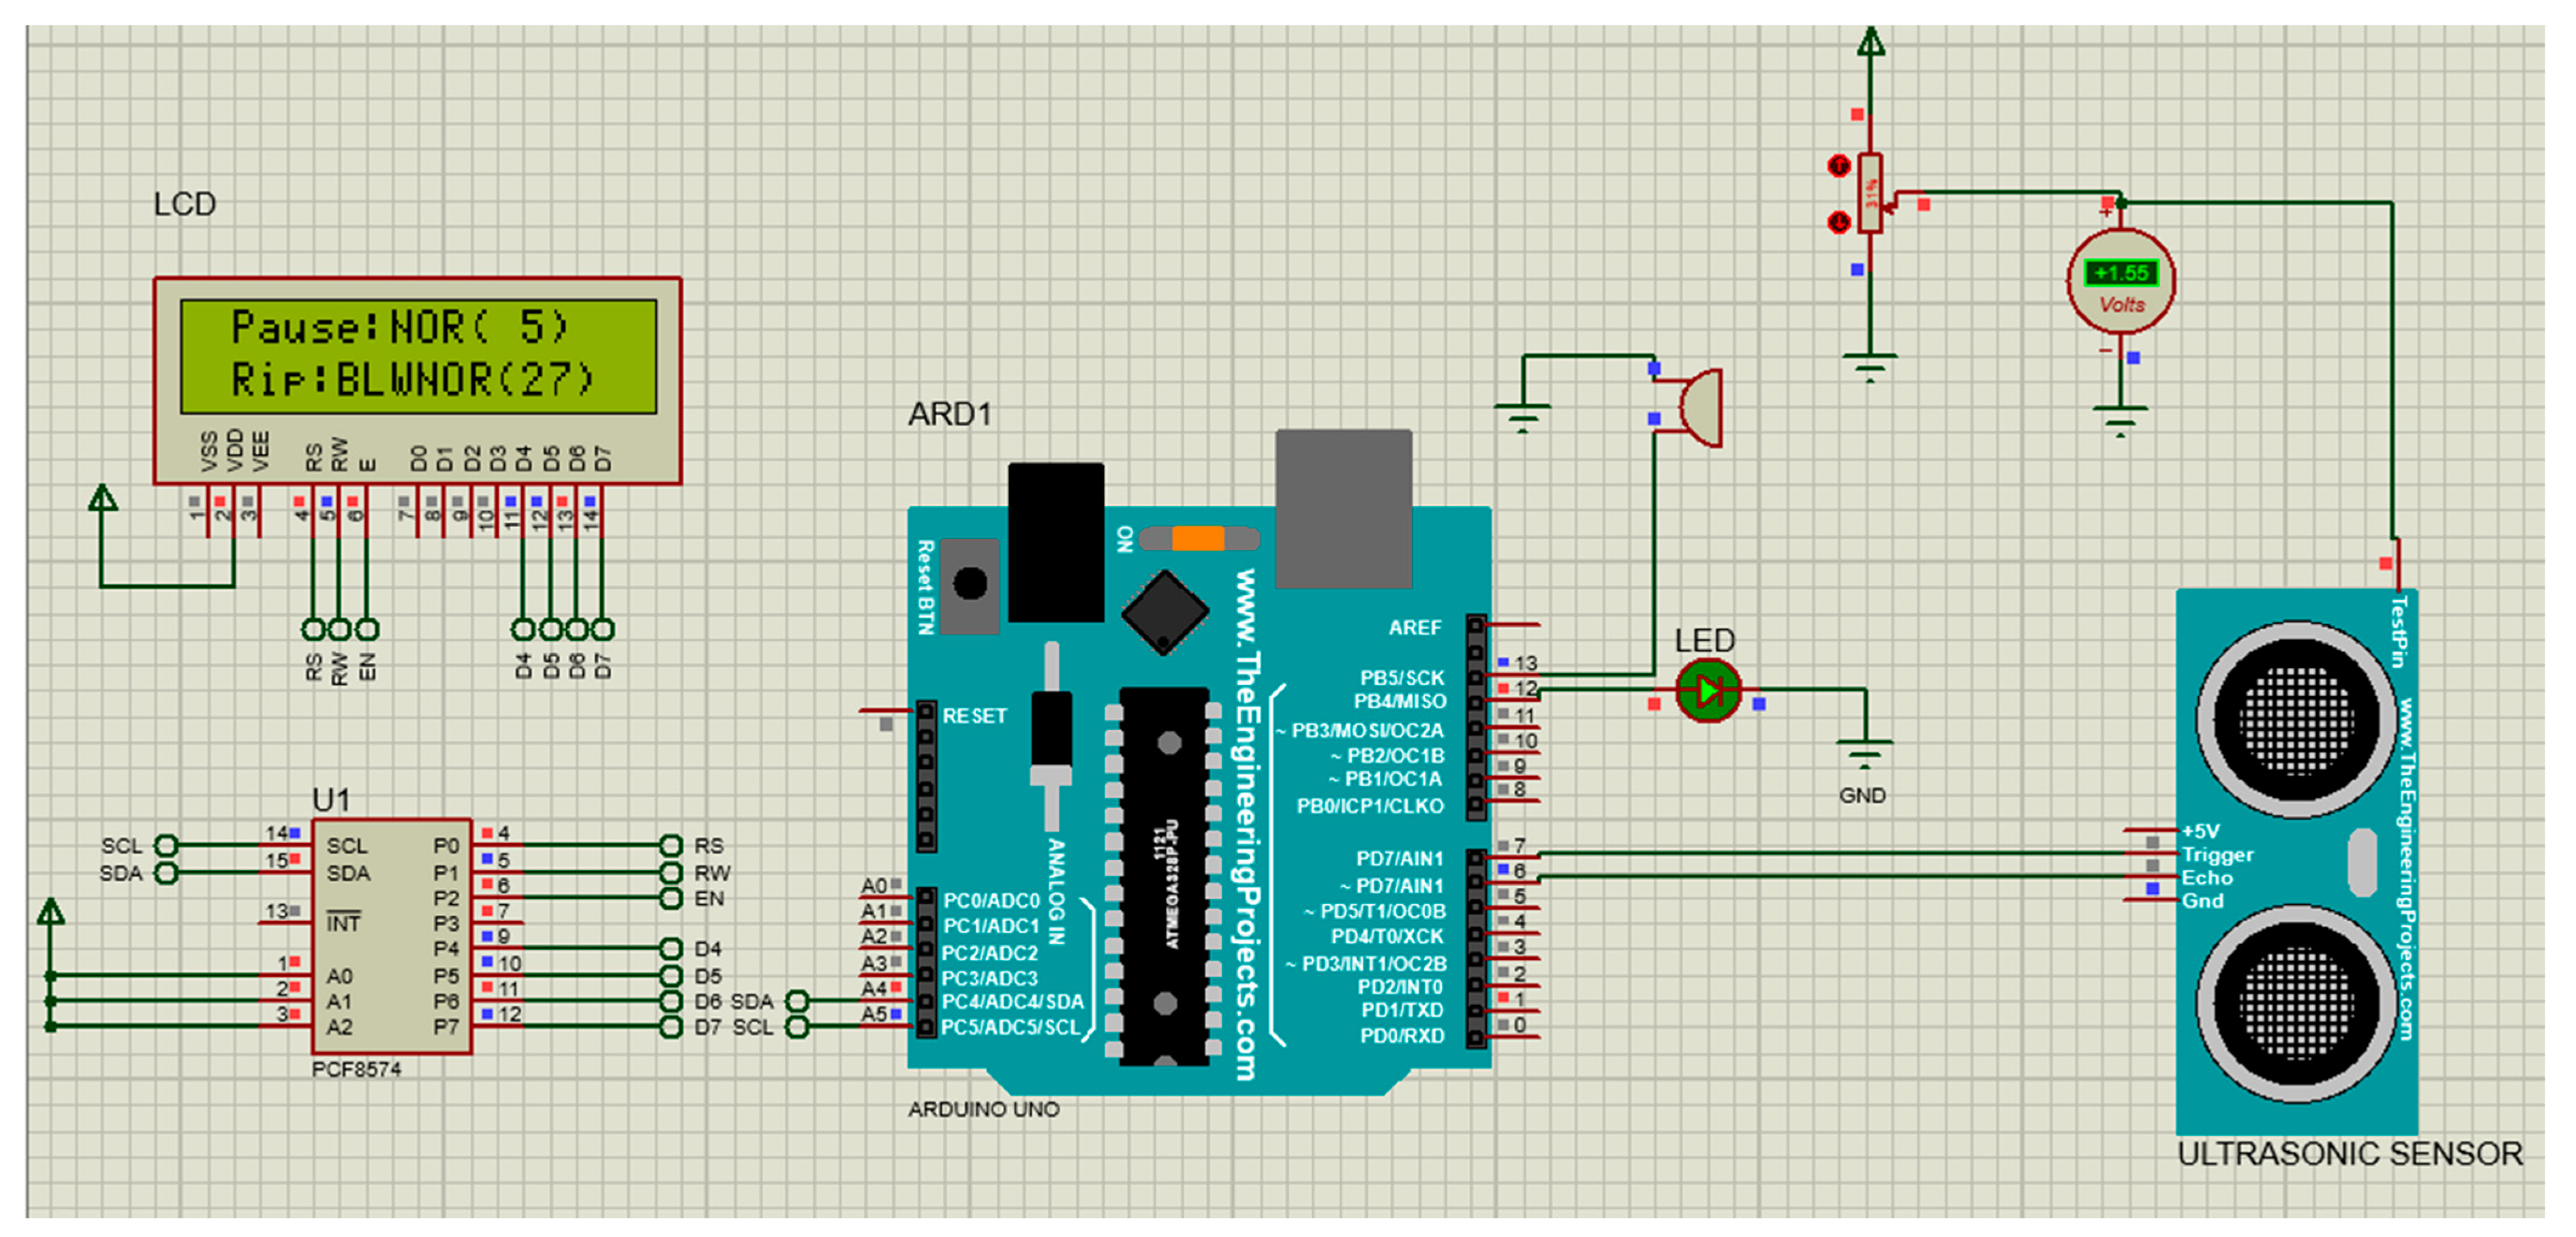
  • US transceiver—The type of US transceiver was HC-SR04. This is a 4-pin module, whose pin names are supply voltage (Vcc), trigger, echo and ground. It provides 2 to 400 cm noncontact distance measurement. Its distance measurement accuracy can be 3 mm. The module contains US transmitter, receiver and control circuits. It operates by automatically sending eight 40 kHz signals for its measurements.
  • ESP8266 NodeMCU—This is an IoT device that connects to an active wireless network. It was used to record the US signal and wirelessly transmit it to the ThingSpeak for processing over the cloud. NodeMCU connects an active wireless network for data transmission to the ThingSpeak. It is an open-source IoT platform. It has a firmware which runs on ESP8266, an integrated Wi-Fi chip, a power amplifier, power management modules, antenna switches and filters.
  • ThingSpeak—This is an open-source web-based IoT analytics platform that allows users to aggregate data, analyzes them using web-integrated Matlab© and visualizes live data streams in the cloud. It allows users to create channels like YouTube or television [59]. The data can be analyzed and visualized using different ThingSpeak applications based on packages such as Matlab©. Matlab© was used for data analysis in this study. ThingSpeak has designed a secured system for user data protection. Each ThingSpeak channel has its own unique and secure read and write Application Programming Interface (API) keys.
The hardware set-up is shown in Figure 3.
The hardware also integrated environmental humidity and temperature sensors and an LCD display to interface with the user. It adapted an LED and a miniature buzzer to raise visual and audio alarms when RR exceeded the preset range indicated by the user.

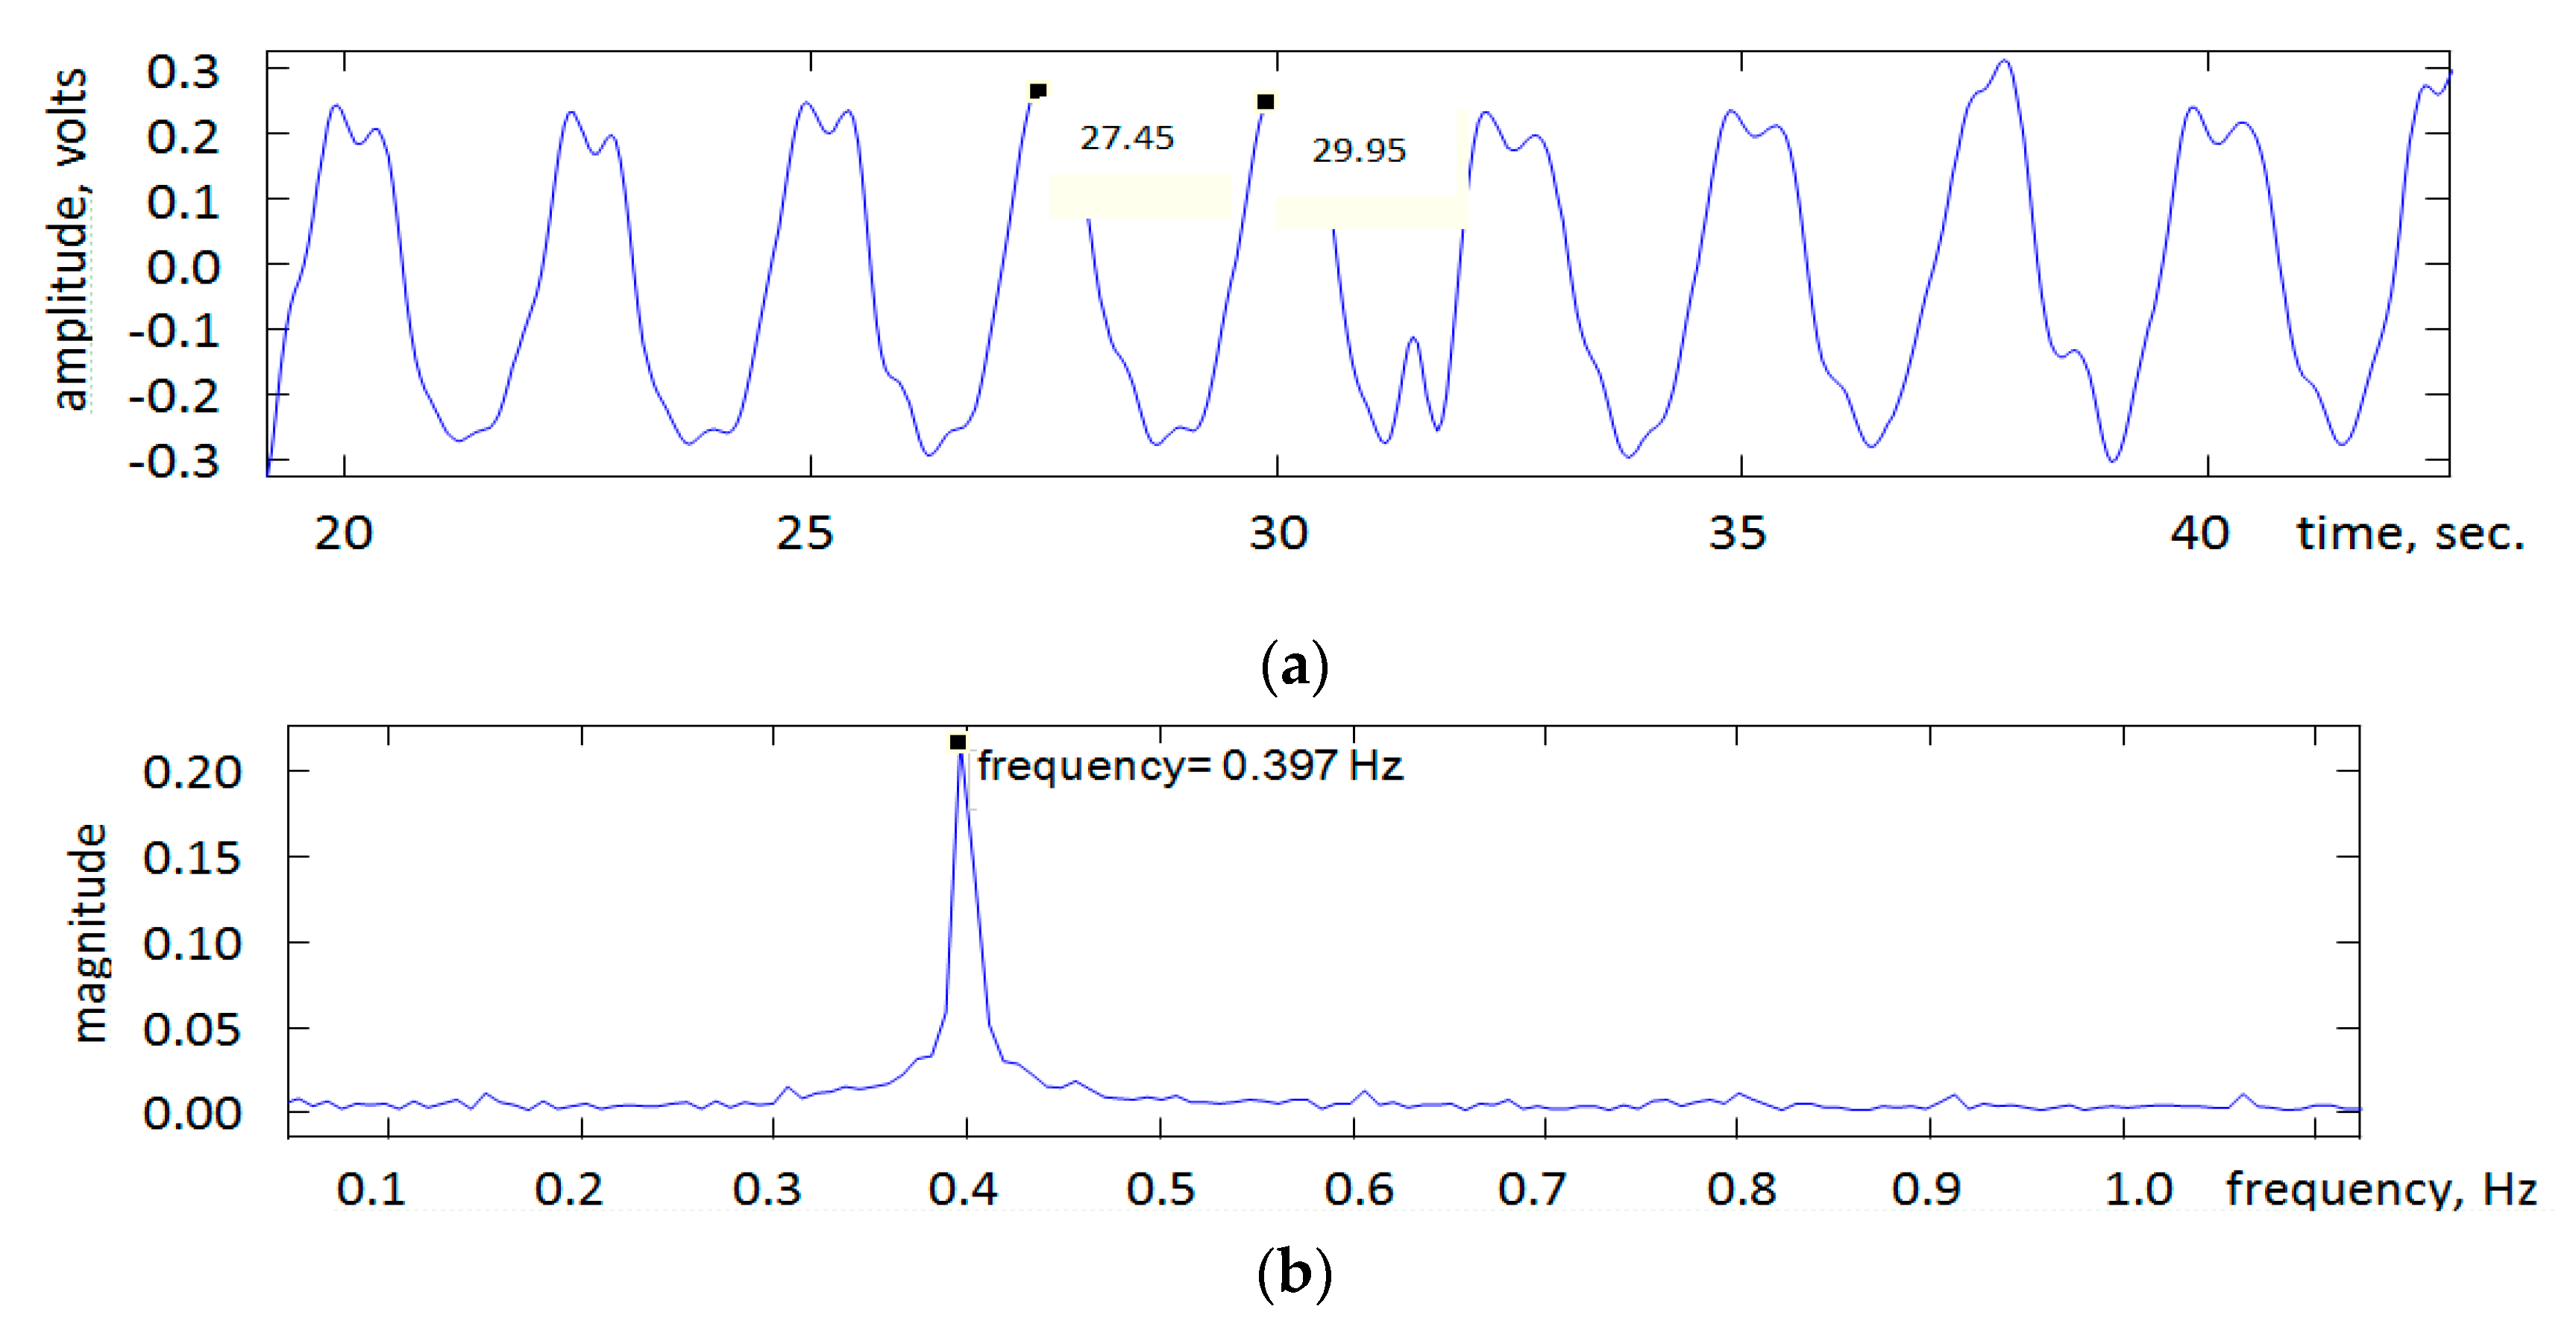
5. Results and Discussion

Figure 4a shows an example of the signal recorded using the system. The signal generator’s frequency was set to 0.4 Hz. Figure 4b shows the magnitude frequency spectrum of the signal in Figure 4a. The peak of the magnitude frequency spectrum appears at 0.397 Hz, characterizing the frequency of the dominant signal component which is close to the signal generator set frequency of 0.4 Hz. Relating this frequency to respiration rate, 0.4 Hz corresponds 0.4 Hz × 60 s = 24 breaths per minute (bpm).
Table 1 provides the signal generator frequency varied in the range of 0.1 to 1 Hz (corresponding to a breathing range 0.1 Hz × 60 s = 6 bpm to 1.0 Hz × 60 s = 60 bpm) and the associated US signal frequencies determined by identifying the frequency corresponding to the peak in the signal’s magnitude frequency spectrum.
From the data in Table 1, the mean and standard deviation of the frequencies associated with the signal generator were 0.550 and 0.303 Hz. The mean and standard deviation of the frequencies associated with the US recorded signal were 0.565 and 0.300 Hz. The percentage difference between the stated means is −14.6%. The related measurements are shown in Figure 5.
A close relationship was observed between the two sets of frequencies (gradient 0.99). The differences between the signal generator’s frequencies and the US-recorded signal’s frequencies are partly related to:
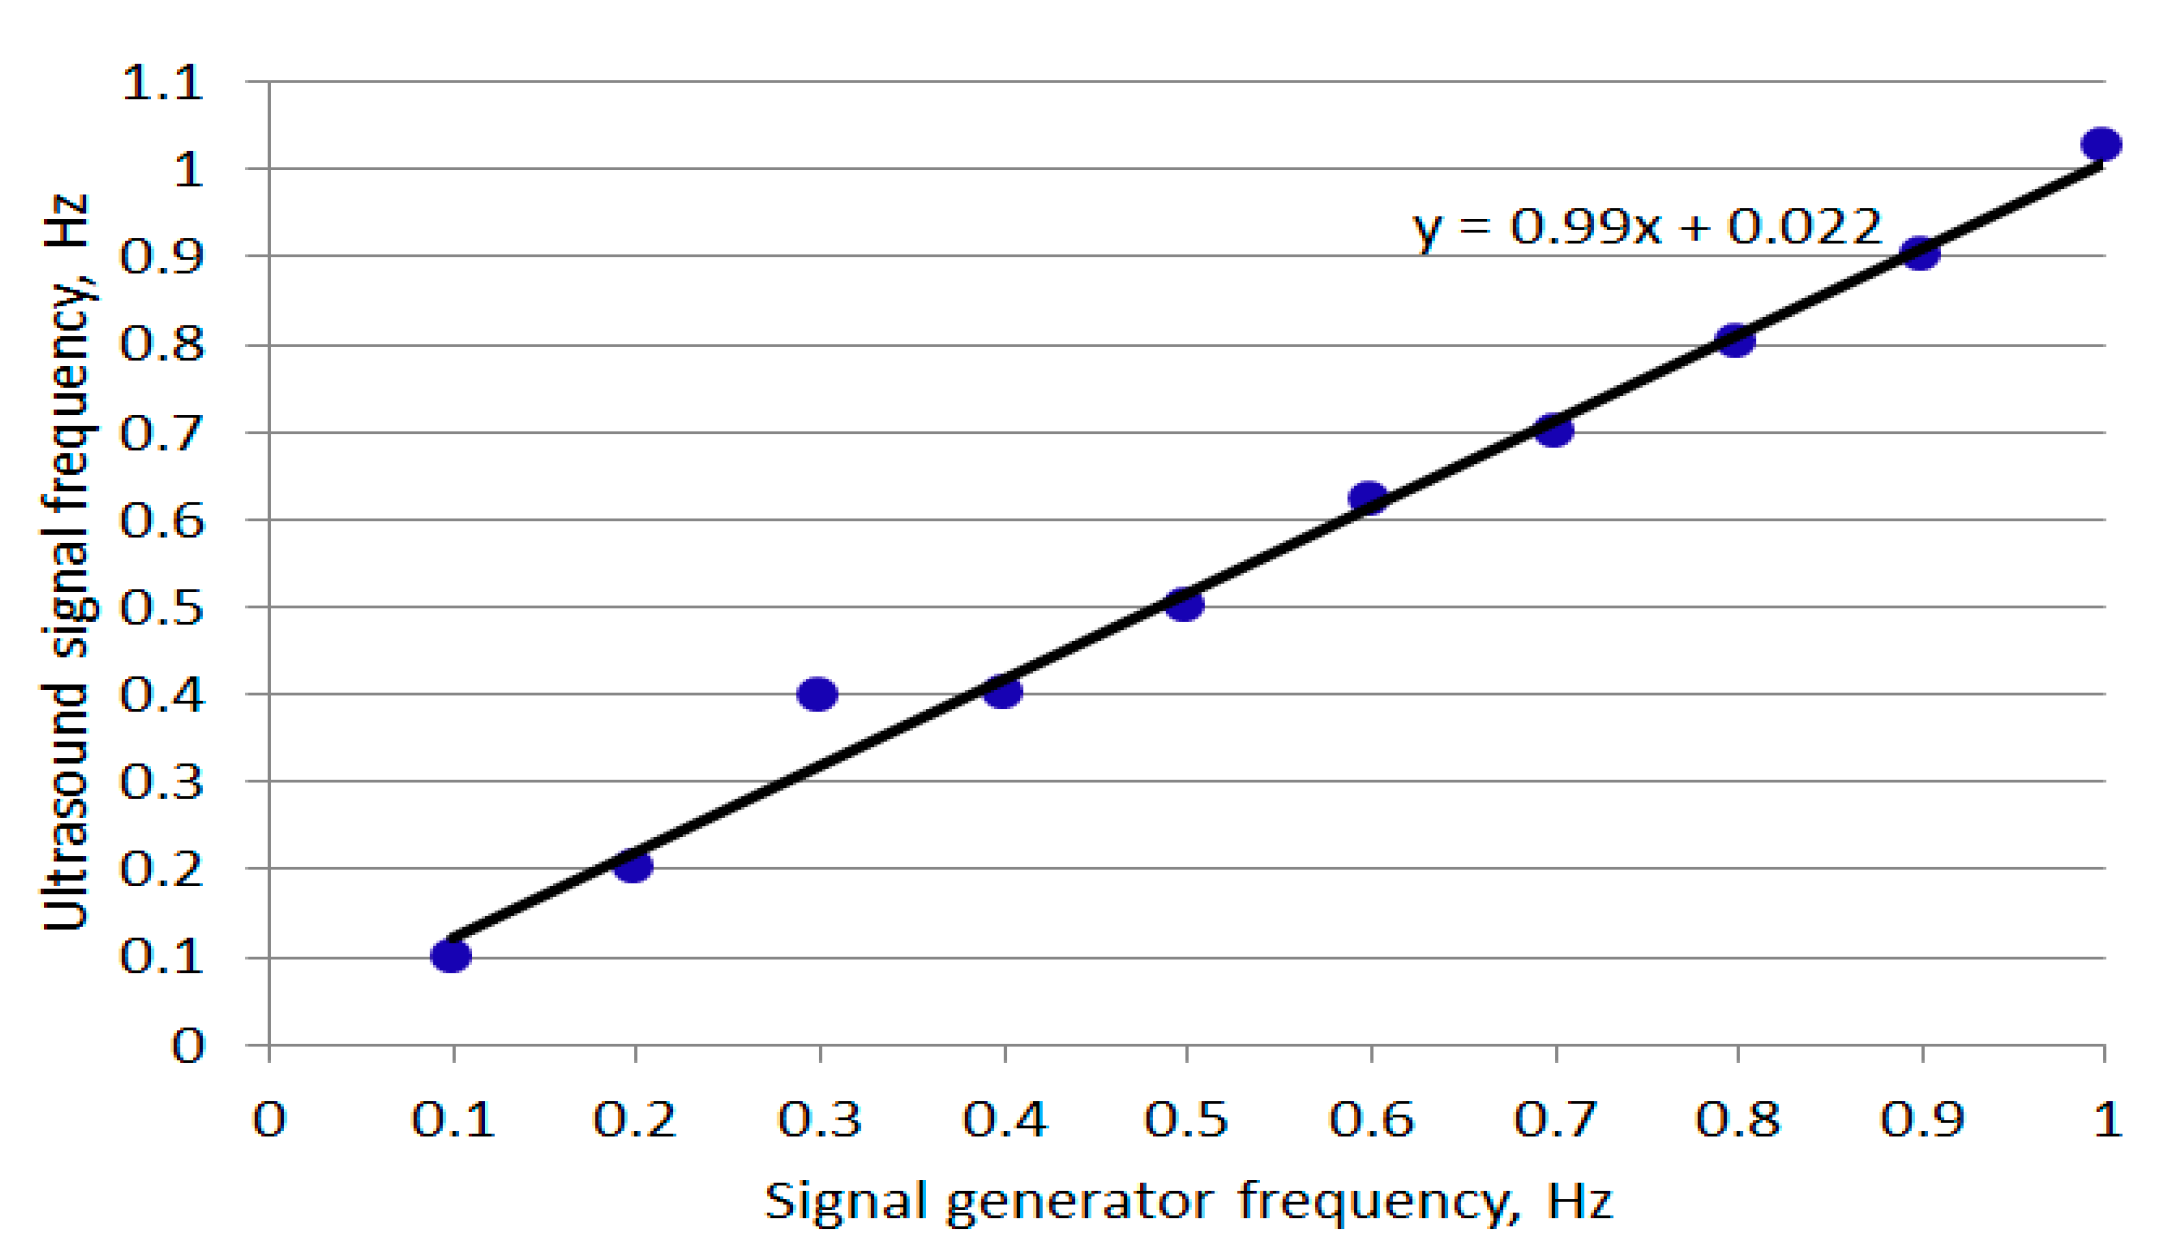
  • Accuracy of the frequency setting on the signal generator.
  • Accuracy of manually reading the frequency associated with the peak in the magnitude frequency spectrum.
  • Level of accuracy provided by the US transceiver.
The study focused on a possible use of the IoT that could be integrated into a platform that simulated respiration and its rate. Although there are a number of RR measurement methods, these tend to be contact-based, i.e., the sensing device is attached to the patient’s body. This in turn may affect the patient’s comfort and thus alter the respiration rate. US, as a harmless, cost-effective technology, has the potential to provide noncontact RR measurement. A number of further developments are needed to utilize the reported system in clinical environments. These include:
  • Tracking: The US-based RR measurement method works while the baby’s chest (or abdomen if moving due to respiration) remains within the US field of view. If the baby moves, repositioning of the US transceiver will be needed. This repositioning requires the position of the baby to be tracked. A number of tracking algorithms were reported that may be considered. A relatively simple tracking approach is template matching. In this approach, the template of the section being tracked is segmented from the first image in the video and correlation is used to identify the section in the following images [60]. Another approach is the Kanade-Lucas-Tomasi (KLT) feature tracker [61] that looks for unique feature points in a region of interest and then tracks these points in subsequent images. The tracking algorithm requires a camera. An infrared thermal camera allows the baby to be viewed without reliance on background light, but it is more expensive than a visual camera.
  • Incorporation into neonatal incubators: This requires design considerations that encompass the infants, medical practitioners and family members [62].
  • Integration into smart hospital infrastructure: This will allow clinicians to be alerted if an anomaly in the child’s breathing is detected through warning messages sent to the clinicians’ digital devices [63].

6. Conclusions

Adaptation of the IoT in healthcare can provide flexibility in patient data collection and storage. It has the potential to improve patient experience and reduce cost. This study outlined a simulated setting, whereby the IoT could be adapted into a neonatal intensive care unit (NICU) to measure respiration rate. Chest movements were simulated through a devised platform with a controllable moving surface. US was used to accurately measure the platform’s surface movement. ESP8266 NodeMCU was used as an IoT device to connect to the active wireless network, capture the US signal and transmit it to the ThingSpeak. Real-time wireless data transmission took place in the ThingSpeak server, where data aggregation and analysis to determine respiration rate were performed using Matlab©. The frequency of the platform surface movement closely matched with the frequency measured by the IoT-integrated US system. Further development work will be needed to fully adapt the system as part of NICU and use it in a hospital environment.

Author Contributions

Conceptualization, methodology and validation: T.A., R.S. and H.E. All authors also contributed to the preparation of the paper. All authors have read and agreed to the published version of the manuscript.

Funding

The study had no external funding.

Institutional Review Board Statement

The study was conducted according to the guidelines of the Declaration of Helsinki.

Data Availability Statement

Not applicable.

Acknowledgments

Authors acknowledge the administration support provided by Sheffield Hallam University, UK, and Sheffield Children’s Hospital, UK. We are also grateful for the reviewers’ constructive comments and feedback.

Conflicts of Interest

There was no conflict of interest.

References

  1. Ibarra-Esquer, J.E.; González-Navarro, F.F.; Flores-Rios, B.L.; Burtseva, L.; Astorga-Vargas, M.A. Tracking the evolution of the Internet of Things concept across different application domains. Sensors 2017, 17, 1379. [Google Scholar] [CrossRef]
  2. Chen, S.; Xu, H.; Liu, D.; Hu, B.; Wang, H. A vision of IoT: Applications, challenges, and opportunities with china perspective. IEEE Internet Things J. 2014, 1, 349–359. [Google Scholar] [CrossRef]
  3. Kang, Y.-M.; Han, M.-R.; Han, K.-S.; Kim, J.-B. A study on the Internet of Things (IoT) applications. Int. J. Softw. Eng. Its Appl. 2015, 9, 117–126. [Google Scholar] [CrossRef]
  4. Kumar, S.; Tiwari, P.; Zymbler, M. Internet of Things is a revolutionary approach for future technology enhancement: A review. J. Big Data 2019, 6, 1–21. [Google Scholar] [CrossRef] [Green Version]
  5. Miorandi, D.; Sicari, S.; De Pellegrini, F.; Chlamtac, I. Internet of things: Vision, applications and research challenges. J. Ad Hoc Netw. 2012, 10, 1497–1516. [Google Scholar] [CrossRef] [Green Version]
  6. Joyia, J.G.; Liaqat, R.M.; Farooq, F.; Rehman, S. Internet of medical things (IOMT): Applications, benefits and future challenges in healthcare domain. J. Commun. 2017, 12, 240–247. [Google Scholar] [CrossRef] [Green Version]
  7. Dimitrov, D.V. Medical Internet of Things and Big Data in Healthcare. Health Inform. Res. 2016, 22, 156–163. [Google Scholar] [CrossRef] [PubMed]
  8. Baker, S.B.; Xiang, W.; Atkinson, I. Internet of Things for Smart Healthcare: Technologies, Challenges, and Opportunities. IEEE Access 2017, 5, 26521–26544. [Google Scholar] [CrossRef]
  9. Maksimović, M.; Vujović, V.; Perišić, B. Do it yourself solution of Internet of Things healthcare system: Measuring body parameters and environmental parameters affecting health. J. Inf. Syst. Eng. Manag. 2016, 1, 25–39. [Google Scholar] [CrossRef] [Green Version]
  10. Liu, X.; Jia, M.; Zhang, X.; Lu, W. A novel multichannel Internet of things based on dynamic spectrum sharing in 5G communication. IEEE Internet Things J. 2018, 6, 5962–5970. [Google Scholar] [CrossRef]
  11. Brito, J.M. Technological trends for 5G networks influence of e-health and IoT applications. Int. J. Health Med. Commun. 2018, 9, 1–22. [Google Scholar] [CrossRef]
  12. Ahad, A.; Tahir, M.; Sheikh, M.A.; Ahmed, K.I.; Mughees, A.; Numani, A. Technologies trend towards 5G network for smart health-care using IoT: A review. Sensors 2020, 20, 4047. [Google Scholar] [CrossRef] [PubMed]
  13. Vijayalakshmi, A.W.; Arockiam, L. A secured architecture for IoT healthcare system. In Proceeding of the International Conference on Computer Networks, Big Data and IoT (ICCBI-2018). ICCBI 2018. Lecture Notes on Data Engineering and Communications Technologies; Pandian, A., Senjyu, T., Islam, S., Wang, H., Eds.; Springer International Publishing: Berlin, Germany, 2020; pp. 904–911. [Google Scholar] [CrossRef]
  14. Kelly, T.J.; Campbell, K.L.; Gong, E.; Scuffham, P. The Internet of Things: Impact and implications for health care delivery. J. Med. Internet Res. 2020, 22, e20135. [Google Scholar] [CrossRef] [PubMed]
  15. Darwish, A.; Hassanien, A.E.; Elhoseny, M.; Sangaiah, A.K.; Muhammad, K. The impact of the hybrid platform of internet of things and cloud computing on healthcare systems: Opportunities, challenges, and open problems. J. Ambient. Intell. Humaniz. Comput. 2019, 10, 4151–4166. [Google Scholar] [CrossRef]
  16. Miller, D.D.; Brown, E.W. Artificial Intelligence in Medical Practice: The Question to the Answer? Am. J. Med. 2018, 131, 129–133. [Google Scholar] [CrossRef] [PubMed]
  17. Shah, R.; Chircu, A. IoT and AI in healthcare: A systematic literature review. Issues Inf. Syst. 2018, 19, 33–41. [Google Scholar]
  18. Uslu, B.Ç.; Okay, E.; Dursun, E. Analysis of factors affecting IoT-based smart hospital design. J. Cloud Comput. 2020, 9, 1–23. [Google Scholar] [CrossRef]
  19. Salama, A.; Saatchi, R. Evaluation of wirelessly transmitted video quality using a modular fuzzy logic system. Technologies 2019, 7, 67. [Google Scholar] [CrossRef] [Green Version]
  20. Salama, A.; Saatchi, R.; Burke, D. Fuzzy logic and regression approaches for adaptive sampling of multimedia traffic in wireless computer networks. Technologies 2018, 6, 24. [Google Scholar] [CrossRef] [Green Version]
  21. Salama, A.; Saatchi, R. Probabilistic classification of quality of service in wireless computer networks. ICT Express 2019, 5, 155–162. [Google Scholar] [CrossRef]
  22. Dogman, A.; Saatchi, R.; Al-Khayatt, S. Quality of service using a combination of fuzzy c-means and regression model. Int. J. Electron. Electr. Eng. 2012, 6, 58–65. [Google Scholar]
  23. Dogman, A.; Saatchi, R.; Al-Khayatt, S. Collaborative scheme to improve QOS in WLAN-wired networks. Mediterr. J. Comput. Netw. 2014, 10, 170–180. [Google Scholar]
  24. Zhang, H.; Li, J.; Wen, B.; Xun, Y.; Liu, J. Connecting intelligent things in smart hospitals using NB-IoT. IEEE Internet Things J. 2018, 5, 1550–1560. [Google Scholar] [CrossRef]
  25. Beyene, Y.D.; Jantti, R.; Ruttik, K.; Iraji, S. On the performance of narrow-band Internet of Things (NB-IoT). In Proceedings of the 2017 IEEE Wireless Communications and Networking Conference (WCNC), San Francisco, CA, USA, 19–22 March 2017; pp. 1–6. [Google Scholar]
  26. Zeadally, S.; Siddiqui, F.; Baig, Z.; Ibrahim, A. Smart Healthcare challenges and potential solutions using internet of things (IoT) and big data analysis. PSU Res. Rev. 2020, 4, 93–109. [Google Scholar]
  27. Atzori, L.; Iera, A.; Morabito, G. The internet of things: A survey. Comput. Netw. 2010, 54, 2787–2805. [Google Scholar] [CrossRef]
  28. Islam, S.M.R.; Kwak, D.; Kabir, H.; Hossain, M.; Kwak, K.-S. The internet of things for health care: A comprehensive survey. IEEE Access 2015, 3, 678–708. [Google Scholar] [CrossRef]
  29. Nasiri, S.; Sadoughi, F.; Tadayon, M.H.; Dehnad, A. Security requirements of internet of things-based healthcare system: A survey. Acta Inform. Med. 2019, 27, 253–258. [Google Scholar] [CrossRef]
  30. Tawalbeh, L.; Muheidat, F.; Tawalbeh, M.; Quwaider, M. IoT Privacy and security: Challenges and solutions. Appl. Sci. 2020, 10, 4102. [Google Scholar] [CrossRef]
  31. Eken, C.; Eken, H. Security threats and recommendation in IoT Healthcare. In Proceedings of the 9th ERROSIM and the 57th SIMs Oulu Finland, 12–16 September 2016; pp. 369–374. [Google Scholar] [CrossRef] [Green Version]
  32. Chen, K.; Zhang, S.; Li, Z.; Zhang, Y.; Beng, Q.; Ray, S.; Jin, Y. Internet-of-things security and vulnerabilities: Taxonomy, challenges, and practice. J. Hardw. Syst. Secur. 2018, 2, 97–110. [Google Scholar] [CrossRef]
  33. Kandasamy, K.; Srinivas, S.; Achuthan, K.; Rangan, V.P. IoT cyber risks: A holistic analysis of cyber risk assessment frameworks, risk vectors, and risk ranking process. EURASIP J. Inf. Secur. 2020, 8, 1–18. [Google Scholar] [CrossRef]
  34. Darwish, S.; Nouretdinov, I.; Wolthusen, S.D. Towards composable threat assessment for medical IoT (MIoT). Procedia Comput. Sci. 2017, 113, 627–632. [Google Scholar] [CrossRef] [Green Version]
  35. Maple, C. Security and privacy in the Internet of Things. J. Cyber Policy 2017, 2, 155–184. [Google Scholar] [CrossRef]
  36. Suhardi, A.R. A survey of security aspects for internet of things in healthcare. In Information Science and Applications (ICISA); Part of the Lecture Notes in Electrical Engineering book series (LNEE, Volume 376); Publisher Springer, 2016; pp. 1237–1247. [Google Scholar] [CrossRef]
  37. Alsubaei, F.; Abuhussein, A.; Shiva, S. Security and privacy in the Internet of Medical Things: Taxonomy and risk assessment. In Proceedings of the IEEE International Workshop on Networks of Sensors, Wearable, and Medical Devices, Singapore, 9 October 2017. [Google Scholar]
  38. Daw, W.; Kaur, R.; Delaney, M.; Elphick, H.E. Respiratory rate is an early predictor of clinical deterioration in children. Pediatr. Pulmonol. 2020, 55, 2041–2049. [Google Scholar] [CrossRef]
  39. Daw, W.; Kingshott, R.; Saatchi, R.; Durke, D.; Holloway, A.; Travis, J.; Evans, R.; Jones, A.; Hughes, B.; Elphick, H. Medical devices for measuring respiratory rate in children: A review. J. Adv. Biomed. Eng. Technol. 2016, 3, 21–27. [Google Scholar] [CrossRef]
  40. Al-Khalidi, F.Q.; Saatchi, R.; Burke, D.; Elphick, H.; Tan, S. Respiration rate monitoring methods: A review. Pediatr. Pulmonol. 2011, 46, 523–529. [Google Scholar] [CrossRef] [Green Version]
  41. Cretikos, M.A.; Bellomo, R.; Hillman, K.; Chen, J.; Finfer, S.; Flabouris, A. Respiratory rate: The neglected vital sign. Med. J. Aust. 2008, 188, 657–659. [Google Scholar] [CrossRef]
  42. Marjanovic, N.; Mimoz, O.; Guenezan, J. An easy and accurate respiratory rate monitor is necessary. J. Clin. Monit. 2020, 34, 221–222. [Google Scholar] [CrossRef] [PubMed] [Green Version]
  43. Hogan, J. Why don’t nurses monitor the respiratory rates of patients? Br. J. Nurs. 2006, 15, 489–492. [Google Scholar] [CrossRef] [PubMed]
  44. Philip, K.; Richardson, R.; Cohen, M. Staff perceptions of respiratory rate measurement in a general hospital. Br. J. Nurs. 2013, 22, 570–574. [Google Scholar] [CrossRef] [PubMed]
  45. Kelly, C. Respiratory rate: Why measurement and recording are crucial. Nurs. Times 2018, 114, 23–24. [Google Scholar]
  46. Rolfe, S. The importance of respiratory rate monitoring. Br. J. Nurs. 2019, 28, 504–508. [Google Scholar] [CrossRef] [PubMed]
  47. BaHammam, A. Comparison of nasal prong pressure and thermistor measurements for detecting respiratory events during sleep. Respiration 2004, 71, 385–390. [Google Scholar] [CrossRef]
  48. Elphick, H.; Alkali, A.; Kingshott, R.; Burke, D.; Saatchi, R. Exploratory study to evaluate respiratory rate using a thermal imaging camera. Respiration 2019, 97, 205–212. [Google Scholar] [CrossRef] [Green Version]
  49. Alkali, A.; Saatchi, R.; Elphick, H.; Burke, D. Thermal image processing for real-time noncontact respiration rate monitoring. IET Circuits Devices Syst. 2017, 11, 142–148. [Google Scholar] [CrossRef]
  50. Al-Kalidi, F.; Elphick, H.; Saatchi, R.; Burke, D. Respiratory rate measurement in children using a thermal camera. Int. J. Sci. Eng. Res. 2015, 6, 1748–1756. [Google Scholar]
  51. Chu, M.; Nguyen, T.; Pandey, V.; Zhou, Y.; Pham, H.N.; Bar-Yoseph, R.; Radom-Aizik, S.; Jain, R.; Cooper, D.M.; Khine, M. Respiration rate and volume measurements using wearable strain sensors. NPJ Digit. Med. 2019, 2, 8. [Google Scholar] [CrossRef] [PubMed]
  52. Tan, K.S.; Saatchi, R.; Elphick, H.; Burke, D. Real-time vision based respiration monitoring system. In Proceedings of the 2010 7th International Symposium on Communication Systems, Networks & Digital Signal Processing (CSNDSP 2010), Newcastle Upon Tyne, UK, 21–23 July 2010; pp. 770–774. [Google Scholar]
  53. Harer, M.; Moreno, M.A. What parents need to know about the neonatal intensive care unit. JAMA Pediatr. 2019, 173, 508. [Google Scholar] [CrossRef] [Green Version]
  54. van Vonderen, J.J.; Roest, A.A.W.; Siew, M.L.; Walther, F.J.; Hooper, S.B.; Te Pas, A.B. Measuring physiological changes during the transition to life after birth. Neonatology 2014, 105, 230–242. [Google Scholar] [CrossRef]
  55. Villarroel, M.; Chaichulee, S.; Jorge, J.; Davis, S.; Green, G.; Arteta, C.; Zisserman, A.; McCormick, K.; Watkinson, P.; Tarassenko, L. Non-contact physiological monitoring of preterm infants in the neonatal intensive care unit. NPJ Digit. Med. 2019, 2, 128. [Google Scholar] [CrossRef] [Green Version]
  56. Barson, C.; Saatchi, R.; Godbole, P.; Ramlakhan, S. Infrared thermal imaging to detect inflammatory intra-abdominal pathology in infants. WSEAS Trans. Boil. Biomed. 2020, 17, 82–98. [Google Scholar] [CrossRef]
  57. Gadekar, C.; Vaze, V.M. Context aware computing: IoT for neonatal health monitoring. Adv. Comput. Sci. Technol. 2017, 10, 53–62. [Google Scholar]
  58. Shakunthala, M.; Jasmin Banu, R.; Deepika, L.; Indu, L. Neonatal healthcare monitoring in incubator using IoT. Int. J. Electr. Electron. Data Commun. 2018, 6, 59–64. [Google Scholar]
  59. Pasha, S. Thingspeak based sensing and monitoring system for IoT with Matlab Analysis. Int. J. New Technol. Res. (IJNTR) 2016, 2, 19–23. [Google Scholar]
  60. Mei, X.; Ling, H. Robust visual tracking and vehicle classification via sparse representation. IEEE Trans. Pattern Anal. Mach. Learn. 2011, 33, 2259–2272. [Google Scholar]
  61. Zivkovic, Z.; van der Heijden, F. Improving the selection of feature points for tracking. Pattern Anal. Appl. 2004, 7, 1–17. [Google Scholar] [CrossRef]
  62. Ferris, T.K.; Shepley, M.M. The design of neonatal incubators: A systems-oriented, human-centered approach. J. Perinatol. 2013, 33, S24–S31. [Google Scholar] [CrossRef] [PubMed]
  63. Tian, S.; Yang, W.; Le Grange, J.M.; Wang, P.; Huang, W.; Ye, Z. Smart healthcare: Making medical care more intelligent. Glob. Health J. 2019, 3, 61–65. [Google Scholar] [CrossRef]
Figure 1. (a) A schematic diagram of the set-up used to simulate chest movement, (b) modified subwoofer connected to a signal generator used to simulate chest movement.
Technologies 09 00030 g001
Figure 2. Block diagram of the IoT set-up.
Technologies 09 00030 g002
Figure 3. The hardware set-up of the system.
Technologies 09 00030 g003
Figure 4. (a) An example of the recorded US signal. The values shown on the signal represent times in seconds associated with two successive peaks and thus their subtraction provides the signal’s period from which frequency can be determined. (b) The magnitude spectrum of the US signal indicating signal frequency.
Technologies 09 00030 g004
Figure 5. Plot of ultrasound-measured signal frequency against signal generator frequency.
Technologies 09 00030 g005
Table 1. The signal generator and US signal frequencies.
Signal Generator Frequency, Hz, (S)Ultrasound Signal Frequency, Hz, (U)S-U
0.10.1000.000
0.20.2010.001
0.30.3970.097
0.40.399−0.001
0.50.5000.000
0.60.6220.022
0.70.699−0.001
0.80.8010.001
0.90.9010.001
1.01.0260.026
Publisher’s Note: MDPI stays neutral with regard to jurisdictional claims in published maps and institutional affiliations.

