Article

Advanced Solutions Aimed at the Monitoring of Falls and Human Activities for the Elderly Population

Department of Electric Electronic and Information Engineering, University of Catania, 95125 Catania, Italy
*
Author to whom correspondence should be addressed.
Current address: Viale Andrea Doria, 6, 95125 Catania CT, Italy.
Technologies 2019, 7(3), 59; https://doi.org/10.3390/technologies7030059
Submission received: 28 February 2019 / Revised: 22 July 2019 / Accepted: 13 August 2019 / Published: 20 August 2019

Abstract

:
Ageing is a global phenomenon which is pushing the scientific community forward the development of innovative solutions in the context of Active and Assisted Living (AAL). Among functionality to be implemented, a major role is covered by falls and human activities monitoring. In this paper, main technological solutions to cope with the aforementioned needs are briefly introduced. A specific focus is given on solutions for Falls recognition and classification. A case of study is presented, where a classification methodology based on an event-driven correlation paradigm and an advanced threshold-based classifier is addressed. The receiver operating characteristic (ROC) theory is used to properly define thresholds’ values while, in order to properly assess performances of the classification methodology proposed, dedicated metrics are suggested, such as sensitivity and specificity. The solution proposed shows an average Sensitivity of 0.97 and an average Specificity of 0.99.

1. Introduction

Falls represent a serious issue which can have catastrophic consequences and the need for ICT (Information and Communication Technologies) based solutions is hence emerging to improve the life quality and autonomy of frail people, with particular regards to falls’ detection and classification.
In the last decades, the interest of the scientific community in the field of assistive technology is acquiring more and more visibility, especially due to the phenomenon of population ageing.
Just to mention few examples, in United Kingdom in 1997 around one in every six people (15.9%) were aged 65 years and over, increasing to one in every five people (18.2%) in 2017 and is projected to reach around one in every four people (24%) by 2037 [1]. In 2018 the Italian resident population amounted to about 60 million units. The average age is 45.2 years, reflecting a structure by age where only 13.4% of the population is under 15, 64.1% between 15 and 64 and 22.6% is 65 and older [2].
Most countries will see the number of elderly (60+) doubled in the coming 30 years, but also the number of the oldest-old (80+) will grow drastically in the long run. Specifically, considering the European country, the share of the elderly in the total population is expected to increase from 21% now to around 34% in 2050. In absolute terms, 37 million people are expected to be aged 80 and over in 2050, an increase by almost 160% compared with 1995 [3].
From the aforementioned statistics, it is straightforward to deduce the need for solutions assuring an improved quality of life and independence of the elderly.
To address this issue, in the past few years a significant research activity, focusing on advanced and reliable solutions to monitor frail people, has been developed [4,5,6,7,8,9,10,11,12,13,14]. These systems would directly benefit elderly people, by providing them with more autonomy, reducing the need for moving to institutionalized care center, enabling timely and effective intervention in case of need, and ultimately reducing the emotional and financial burden for the elderly and their families. The use of technology would also reduce the overall costs of health and social care [15].
Valid monitoring systems can be extremely beneficial in analyzing deviations with respect to the normal behaviour of an individual which can be strategic for early detection and treatment of worsening health conditions [16].
Celler et al. [17], during a studies of behavioural monitoring, discovered that the health condition of a subject can be estimated by check a set of simple parameters such as the mobility, sleep patterns, washing and toilet facilities, that have been demonstrated to be representative of the interaction of the subject with his environment. Commonly analyzed human activities are actions typically performed during the day, such as dressing, standing, sitting, walking, climbing stairs and laying down. Many different technologies have been proposed in the literature for human activities and falls monitoring. These include wearable multi-sensor architectures, developed by customized solutions, smartphones, or a combination of these systems.
The main aim of this paper is to present an overview of different approaches for falls detection, with a specific focus on methodologies developed at the SensorLab of the University of Catania, Italy, for fall classification. Robustness of developed methodologies against other user behaviors, such as sitting, is also demonstrated. A detailed discussion and more experimental results related to the classification paradigms developed can be found in journal papers already published by the authors [18,19].

2. Falls and Human Activities Detection Techniques: A Brief Overview

Following the classification provided in [20], falls and human activities detectors can be classified as wearables, non-wearables (ambient sensors, vision sensors, and radio-frequency sensors), and hybrid systems.

2.1. Wearable Solutions

Different approaches have been proposed for falls and human activities detection in the Active Assisted Living contexts using wearable solutions. Two main categories are addressed by the current State-of-the-art: customized devices [21,22,23,24] and smartphone-based platforms [25,26,27,28,29].

2.1.1. Customized Systems

Inertial solutions have been widely investigated by researchers and scientist as a practical and unobtrusive way to monitor people activities, while preserving subject’s privacy. Such systems show good performances in detecting and classifying falls, human activities and physiological parameters. Focusing on falls detection systems, in the following some examples are presented.
In [21] the authors present and discuss a computationally low-demanding algorithm for fall detection. The system utilize a triaxial accelerometer and a supervised clustering approach, implemented through one-class support vector machine classifier. Results clearly shows that the approach has been proved to be invariant to age, weight, height of people, and to the relative positioning area of the measurement system thus allowing to overpower typical drawbacks arising from threshold-based methodologies such as the need to adjust of a number of parameters depending on the user’s specifications.
In [5] a multisensor data fusion approach is investigated for the sake of falls and human activities classification with particular regards on elders and people with neurological pathologies. The working principle of the solution consist on an advanced signal processing technique carried out on data provided by an accelerometer and a gyroscope. Specifically, the system under study can recognize critical events such as falls or prolonged inactivity, to monitor the user posture, and to notify alerts to caregivers. A major outcome of this work relies on the information provided by the system, which can be useful to monitor the evolution of the user pathology with particular interest in rehabilitation tasks. The mean value of the sensitivity index computed across different classes of falls and human activities considered through the paper is 0.81%, while the average value of the specificity index is 0.98%.
In [30] a system based on a detection strategy consisting on an automatically adjustable threshold value for a pre-impact fall detection system is presented. Several experiments have been conducted evaluating performance such as sensitivity, specificity and accuracy. The results of proposed method can detect the pre-impact fall from normal activities of daily living with 99.48% sensitivity, 95.31% specificity and 97.40% accuracy with 365.12 msec of lead time.
A fall detection system, based on an instrumented insole is presented in [31]. Since high-acceleration activities have a high risk for falls, and because of the potential damage that is associated with falls during these activities, four low-acceleration activities, four high-acceleration activities, and eight types of high-acceleration falls have been investigated. A Support Vector Machine model’s Leave-One-Out cross-validation provides a fall detection sensitivity (99.6%), specificity (100%), and accuracy (99.9%). The classification results are comparable to other fall detection models in the State-of-the-art, while also including high-acceleration ADLs to challenge the classification model.
In [32], the authors propose a fall detection methodology based on a non-linear classification feature and a Kalman filter with a periodicity detector to reduce the false positive rate. The methodology requires a sampling rate of only 25 Hz; it does not require large computations or memory and it is robust among devices. The system has been tested using the SisFall dataset achieving 99.4% of accuracy.
Wang et al., in [33], present a fall classification methodology based on two new inertial parameters: acceleration cubic-product-root magnitude (ACM) and angular velocity cubic-product-root magnitude (AVCM). These indexes have been introduced to improve the selectivity of threshold-based fall detection methods, and evaluate strategies to distinguish falls from other activities of daily life (ADLs). Inertial data on four types of simulated falls and eight types of ADLs were collected. Two public datasets, UMAFall and Cognent Labs, were also included to evaluate fall detection methods. Results show that a hybrid use of ACM and AVCM parameters allows to reduce the misclassification rate compared to single-parameter methods.

2.1.2. Smartphone-Based Solutions

Although different surveys seem to reveal that smartphone-based assistive devices are not fully accepted by elderly, due to apparent request of technological skills, it must be considered that the monitoring of falls and human activities do not require any action by the user, thus habilitating fully smartphone-based solutions as a convenient way to perform such tasks [34].
In [18] authors present a smartphone-based strategy for fall detection. The developed methodology uses an event-driven approach to generate features to be successively processed by a threshold classification paradigm.
This solution, compared to systems using only the final posture to recognize fall, which are subjected to fail in case of extra movement of the user after the fall, analyzes the inertial signal evolution recorded during the fall event, which makes the system robust against exogenous user behaviours.
A fall detection system, developed on smartphones exploiting a two-step algorithm to monitor and detect fall events using the embedded accelerometer signals, is presented in [35]. The proposed solution uses techniques to properly detect fall-like events (such as lying on a bed or sudden stop after running) based on a multiple kernel learning support vector machine along with a threshold based strategy. Experimental results reveal that the system detects falls with high accuracy (97.8% and 91.7%), sensitivity (99.5% and 95.8%), and specificity (95.2% and 88.0%) when placed around the waist and thigh, respectively. The system also achieves a false alarm rate of 1 alarm per 59 hours of usage.
In [36] the authors propose a fall detection algorithm made up of a feature extraction and recognition processing. Six features were analyzed where, four of them, were related to the gravity vector extracted from accelerometer data. During the testing phase, a set of six features was clustered by support vector machine. The main feature contains the vertical directional information and provides a distinct pattern of fall-related activity. This feature acts as a trigger-key in recognition processing to avoid false alarms which lead to excessive computation. The results show that the algorithm could achieve a sensitivity of 96.67% and specificity of 95%.
Another interesting work is the one discussed in [37]. The paper proposes a fall classification strategy consisting on different approaches (detection of inactivity, detection of falls by thresholds analysis, detection of falls by device orientation analysis and detection of falls with decision trees algorithm) merged together, in order, to improve the efficiency and accuracy of the fall detection process. Through the databases Mobifall, Mobifall2 and a database developed by this study, tests performed with the proposed methodology showed 87.65% of specificity and 95.45% of sensitivity, with maximum detection delay of 3 seconds.
In [38], an automated fall detection system based on smartphone audio features is developed. The spectrogram, mel frequency cepstral coefficents (MFCCs), linear predictive coding (LPC), and matching pursuit (MP) features of different fall and no-fall sound events are extracted from experimental data. Based on the extracted audio features, four different machine learning classifiers: k-nearest neighbor classifier (k-NN), support vector machine (SVM), least squares method (LSM), and artificial neural network (ANN) are investigated for the sake of fall and no-fall events classification. Sensitivity, specificity, accuracy, and computational complexity have been evaluated for each audio feature. The best performance is achieved using spectrogram features with ANN classifier with sensitivity, specificity, and accuracy all above 98%.
Another work investigating the use of the inertial sensing feature of a smartphone for human falls detection is presented in [28] along with an application for the administration of a popular and standardized test in the field of human mobility assessment.
The fall detection methodology illustrated in [29] is based on the exploitation of acceleration and orientation information gathered by smartphone sensors and processed by threshold algorithms.

2.1.3. Non-Wearable Solutions

Digging into the State-of-the-art, it appears evident the supremacy of the camera-based falls and human activities detection systems in case of non-wearable solutions. A reason relies on the fact that, nowadays, cameras are becoming increasingly common among consumers. Cameras can be employed in many different contexts, such as the active assisted living one and for personal security. A major advantage of these systems rely on their capability to monitor more complex behaviours as respect to wearable solutions.
Although analyzing visual streams from cameras to automatically detect users’ behaviour is a challenging task [39], since it implies the need to differentiate users from environment where the users operates, human activities and falls analysis has anyway attracted considerable attention in the computer vision and image processing communities [40,41,42,43].
As an example, in [40], Messing et al. have used a particular technique for daily activity recognition, based on the velocity histories of tracked key points. The solution exploits a generative mixture model for video sequences, which shows similar performance compared to local spatio-temporal features on the KTH activity recognition dataset (a dataset provide by KTH Royal Institute of Technology in Stockholm).
In [41] the authors discuss a solution based on the use of an RGB-D (Kinect-style) cameras for fine-grained recognition of kitchen activities. The developed system combines depth (shape) and colour (appearance) to solve a number of perception problems fundamental for smart space applications: locating hands, identifying objects and their functionalities, recognizing actions and tracking object state changes through actions. The system is able to robustly track and recognize steps really detailed through cooking activities.
A key challenge in the computer vision context deals with the detection and classification of falls based on variations in human silhouette shape. In order to face this problem, the study presented in [44] proposes a multivariate exponentially weighted moving average (MEWMA) monitoring scheme, which is effective in detecting falls because it is sensitive to small changes. In order to distinguish real falls from some fall-like gestures, a classification stage based on a support vector machine (SVM) is applied on detected sequences. The methodology has been validated using the University of Rzeszow fall detection dataset (URFD) and the fall detection dataset (FDD). The results of the MEWMA-based SVM are compared with three other classifiers: neural network (NN), naïve Bayes and K-nearest neighbour (KNN). Results show the capability of the developed strategy to distinguish fall events.
In [45] a vision-based solution using Convolutional Neural Networks to detect falls in a sequence of frames is proposed. To model the video motion, and to make the system independent on the considered scenario, an optical flow images as input to the networks followed by a novel three-step training phase is introduced. The method has been evaluated in three public datasets achieving state-of-the-art results.

2.1.4. Hybrid System

In many application scenarios, there is a need to clearly differentiate activities characterized by similar motions or gesture but corresponding to different behaviours. Typically, these situations can arise from actions like carrying a glass of water or carrying a pillbox, or when an object is used or simply carried around.
A solution for the aforementioned problems is discussed in [46], where an approach based on direct motion measurements with inertial sensors and detection of object interaction with RF-ID for high-level activity recognition is proposed. The system uses a sensor fusion strategy based on different levels of abstraction for simultaneously integrating many channels of heterogeneous sensor data. This approach was evaluated with one Activity of Daily Living (ADL) breakfast scenario and one home care scenario where the proposed approach reached accuracy of 97% and 85% respectively.
A paper discussing the performance limitations of using individual wearable sensors instead of hybrid solutions, especially for the classification of similar activities, is presented in [6]. The is mainly based on a data fusion strategy of features extracted from experimental data collected by different sensors: a tri-axial accelerometer, a micro-Doppler radar, and a depth camera. Preliminary results show that combining information from heterogeneous sensors improves the overall performance of the system. The classification accuracy attained by means of this fusion approach improves by 11.2% compared to radar-only use, and by 16.9% compared to the accelerometer. Furthermore, adding features extracted from an RGB-D Kinect sensor, the overall classification accuracy increases up to 91.3%.
The time synchronization issue, when dealing with data fusion based on samples from several systems, is discussed in [47]. This work presents a technical platform for the efficient and accurate synchronization of the data captured from RGB-Depth cameras and wearable inertial sensors, that can be integrated into AAL solutions.

2.1.5. Conclusive Remarks

The solutions briefly cited in this section highlight the huge number of alternatives to detect falls and other human activities. The choice of the right technology is usually driven by the specific application, with particular regards to performances requested (classification accuracy, sensitivity and specificity), user skills, computational power requirements, the need for structured environment (e.g., camera-based solutions). Wearable solutions based on inertial sensors have been proved to represent the right compromise between reliability and ease of use. In general, it must be reminded that a reliable fall detector must exhibit properties such as robustness against users’ characteristics (e.g., height, weight), robustness against exogenous behaviour and suitable classification specificity (e.g., a fall is detected and classified in the right fall category). A case study developed by the research group working on Assistive Technology at the SensorLab of the University of Catania is presented in Section 3. The proposed solution is a wearable device which exploits an event-driven paradigm to guarantee suitable classification performances.

3. Event Driven Methodologies for Fall Detection and Classification

The wearable solution presented through this section exploits an event-driven approach which is able to guarantee high sensitivity and specificity of the classification task. Moreover, in order to improve the system robustness against users’ characteristics signals provided by the sensing platform are processed by a normalization routine.

3.1. The Event-Driven Classification Methodology

The classification methodology, schematized in Figure 1, is based on an event-driven correlation paradigm, which is known to be one of the most powerful, yet computationally manageable, methods of classification for the invariance to the translations and the robustness to the additive noise of the signal. The paradigm aims to extract robust features from the unknown target event to be classified. Adopted features consist in the correlation (named XCOR in Figure 1) operated between events signatures and the unknown pattern (run-time acquired data from a 3-axis accelerometer), which has been suitably pre-processed by a normalization routine.
Such features are then processed by a threshold-based classifier in order to estimate the class to which the event belongs. The Receiver Operating Characteristic (ROC) theory is used to properly define the thresholds’ values.
Moreover, in order to improve the classification performances of the system, the paradigm is reinforced by integrating the post-fall evaluation of the accelerometer axes, when specific conditions occur (details are provided in Section 3.1.3).
It must be specified that both signatures and thresholds identification are totally handled offline by means of a Matlab script. Those phases do not require to be executed each time the system perform a classification but, once determined, they are not subjected to changes. The classification strategy uses both the signatures and the thresholds as known data. On the contrary, both the correlation and classification phase are meant to be executed online [19].
This classification strategy has been specifically thought for its implementation in a real power-limited embedded system where, more complicate classification approaches, such as the ones based on machine learning techniques, can be hardly implemented. Although its implementation is not the focus of this paper, a previous work [19], which has laid the basis for this, shows a first implementation in an embedded system.
With the aim to assess performances of the classification methodology, dedicated metrics, such as Sensitivity and Specificity (see Section 5), have been used.
A major advantage of the classification paradigm adopted relies on its low computational demand and adaptability to several different application contexts.
In the following main elements of the classification methodology are addressed.

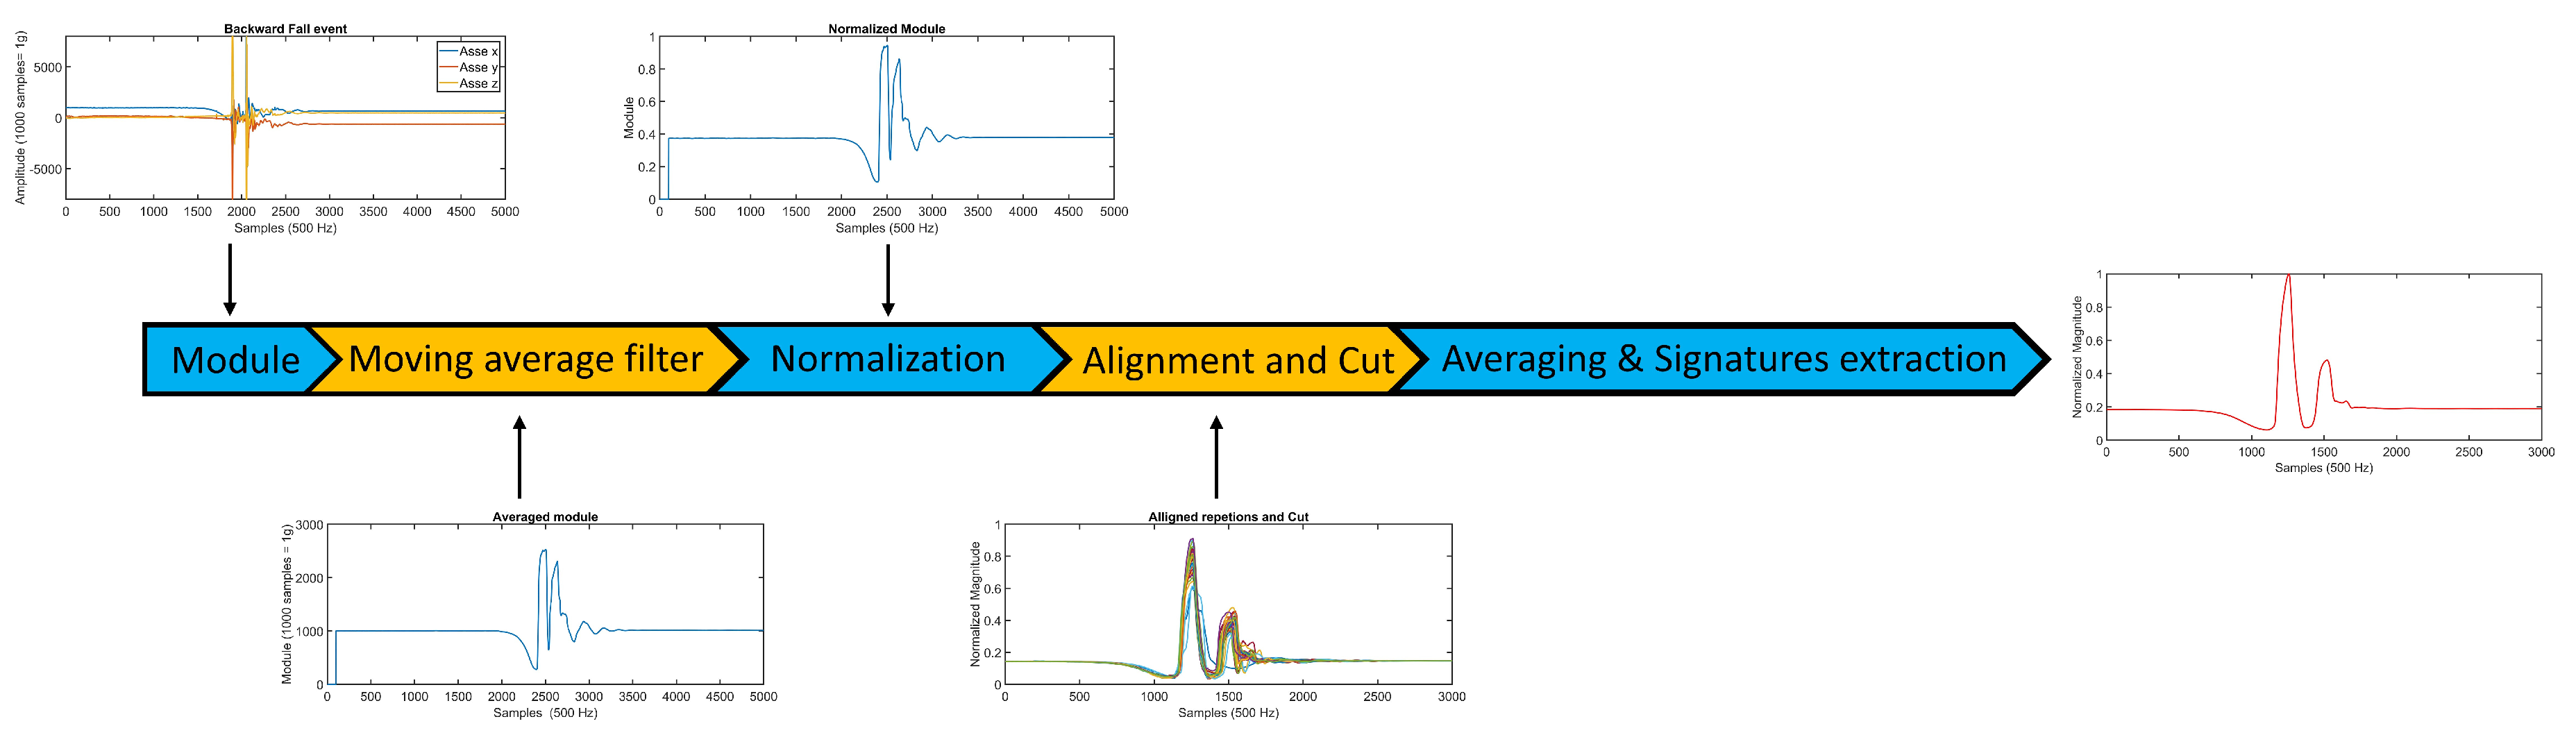
3.1.1. Signature: Definition and Building Process

A signature is defined as a typical time evolution of the acceleration magnitude uniquely describing a specific event. In order to build a reliable set of signatures (one per each class of events), a high-quality dataset, including several observations for each class of falls and human activities, is mandatory, as the one presented in Section 4 [19]. For each set of events belonging to the same class, the following pre-processing steps have been carried out:
  • Module computation, whose equation is shown in (1).
    M ( i ) = x ( i ) 2 + y ( i ) 2 + z ( i ) 2 for i = 1 , 2 . , n
    with n number of samples of the acquired signal.
  • Low pass filtering by means of a moving average, whose equation is shown in (2).
    M a ( i ) = 1 k j = a 1 a 2 M ( i + j ) for i = a 1 , 2 . , n a 2
    with:
    -
    n = number of samples of the acquired signal
    -
    a 1 = number of samples previous to i
    -
    a 2 = number of samples subsequent to i
    -
    k = a 1 + a 2 + 1
  • Normalization, whose algorithm (Algorithm 1) is shown below.
    Algorithm 1: Normalization algorithm
    Technologies 07 00059 i001
  • Alignment. The alignment algorithm is based on the time delay between patterns, estimated by computing the cross-correlation between signals. First the cross-correlation has been computed according the following Equation (3):
    R ^ x y ( r · Δ T ) = n = 0 N r 1 x n + r · y n Δ T 0 R ^ x y ( r · Δ T ) Δ T < 0
    with
    -
    n = number of acquired samples
    -
    x n = signature
    -
    y n = filtered and normalized acceleration module
    -
    r = sample number
    -
    Δ T = sampling time
    consequently, the time instant where the biggest value of R ^ x y is found, has been used to shift one signal in order to align them. The algorithm compute the correlation within a time windows of 300 ms.
  • Averaging the aligned vectors.
Examples of signatures for the classes of events considered in the case study presented in Section 4 are shown in Figure 2.

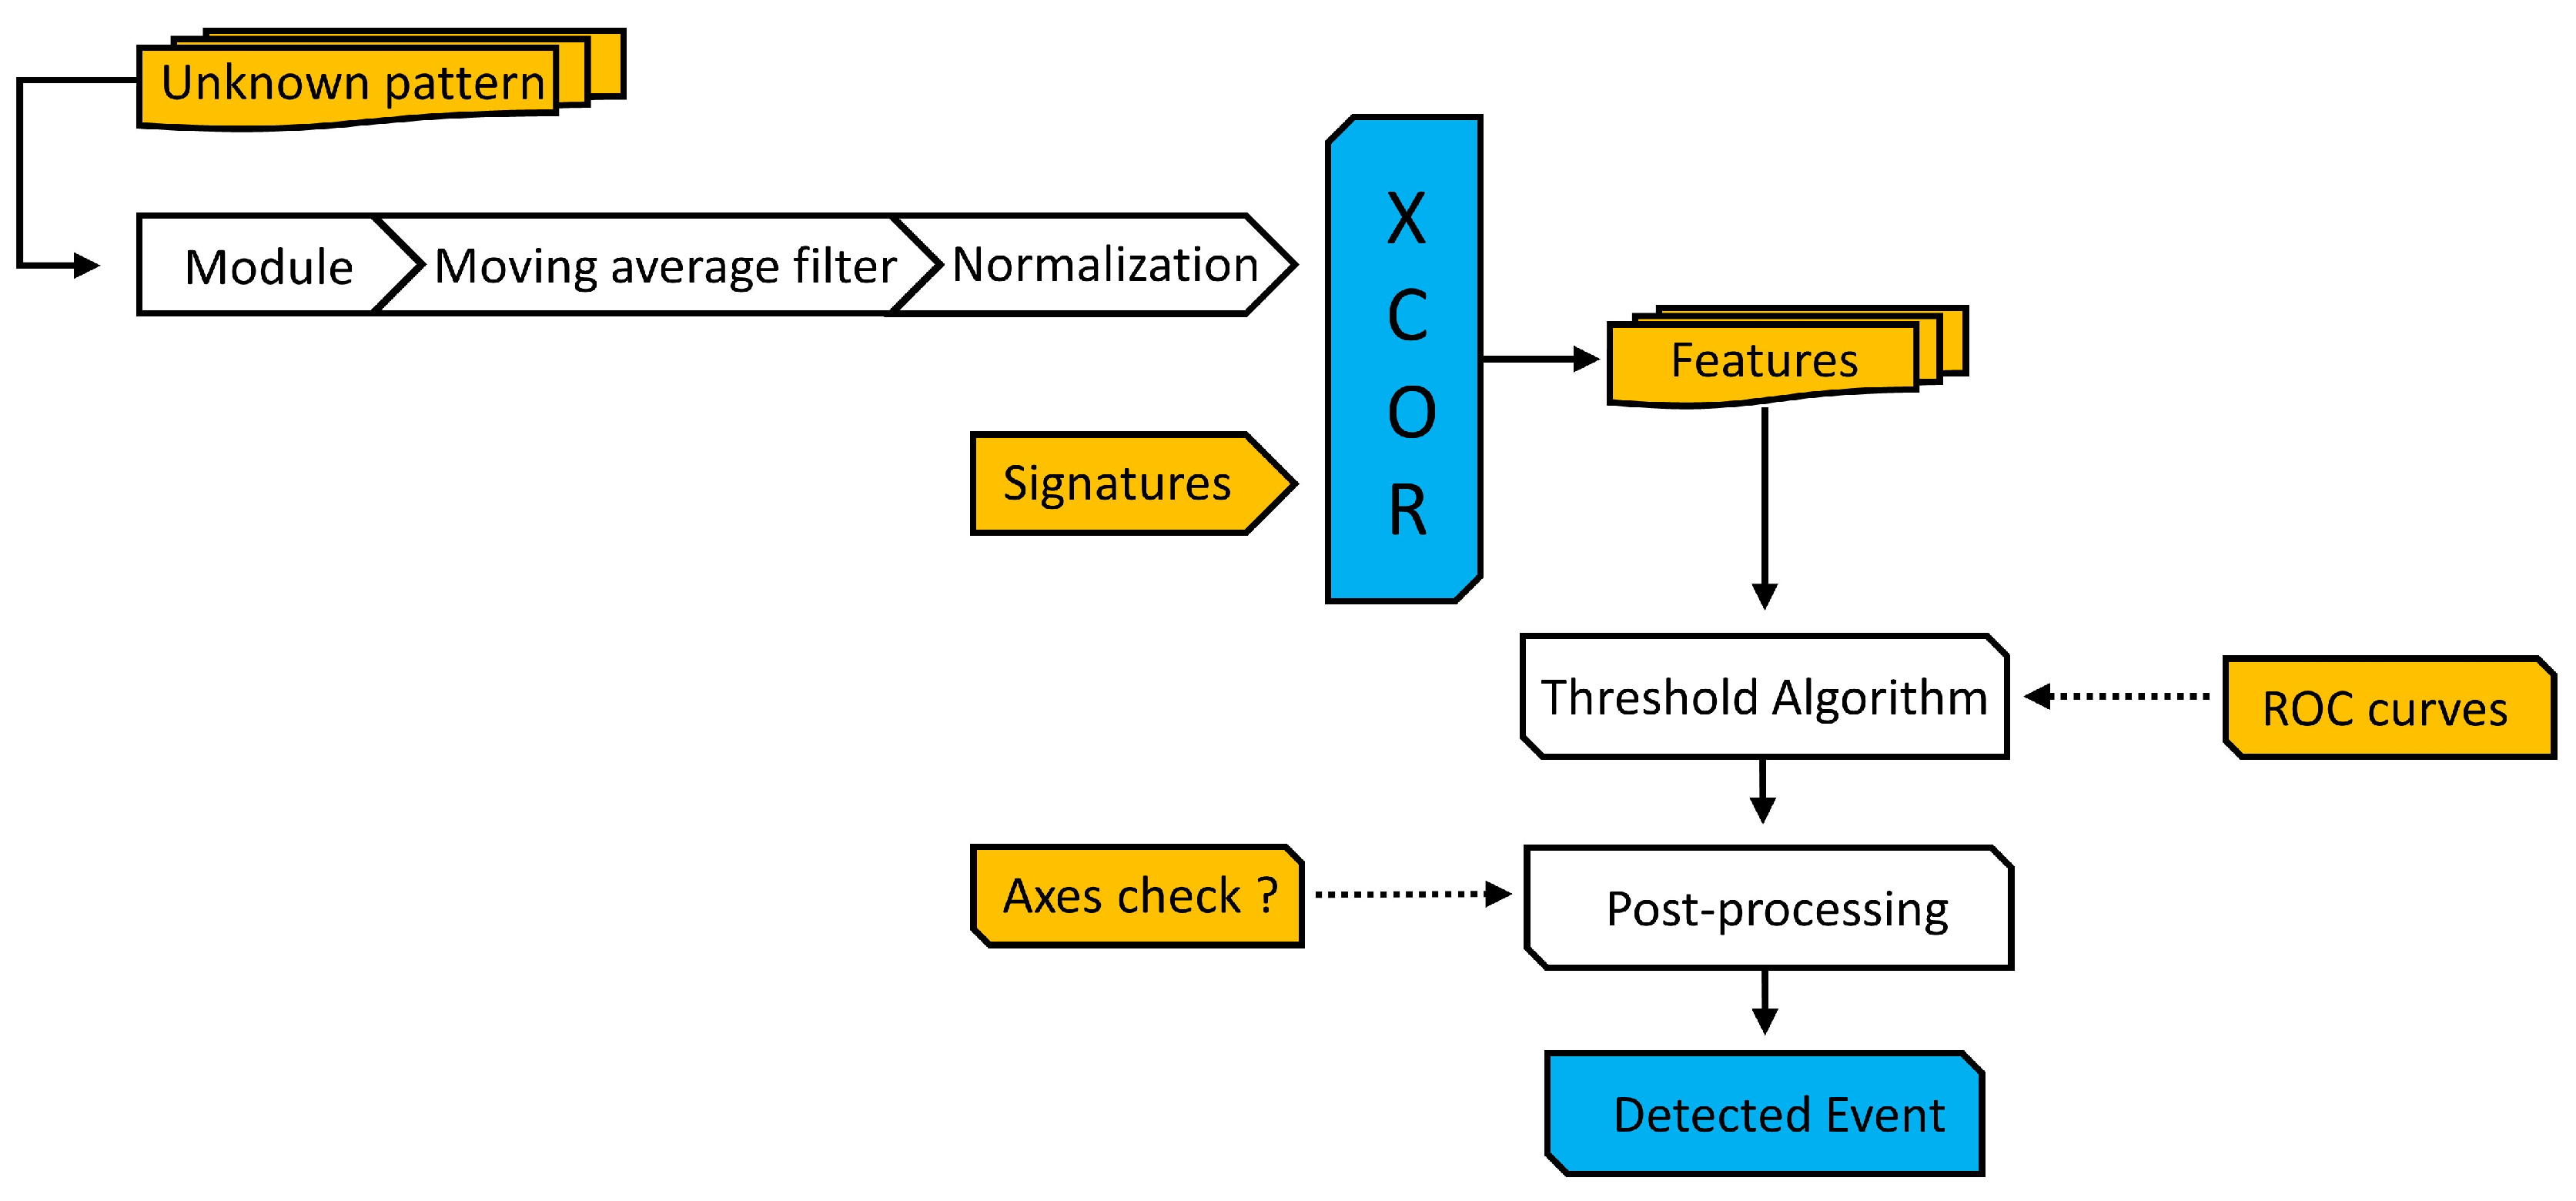
3.1.2. Pre-Processing of An Unknown Pattern and Features Generation

Initially, a new acquired and unknown pattern, is pre-processed by following steps indicated in Figure 3.
With the aim to make the classification procedure users’ independent, a data normalization has been computed both for the signatures and the inertial quantities representing the unknown pattern; this procedure makes the solution robust against users’ characteristics, such as weight and height. The normalization procedure constrains signals in the range [−1,1], thus preserving the signal’s dynamics, while assuring the generalization of the classification strategy. This approach also increases the robustness of the system against small variations of the device position on the user body, as well as it reduces the need for a tuning phase.
Once both the signatures and the unknown patterns have been properly processed, the cross-correlations between the acceleration module of the unknown event and the set of signatures representative of all the candidate class of events (falls and other human activities) have to be computed. The maximum values of such cross-correlations represent features to be processed by the classification paradigm.

3.1.3. Classification Procedure
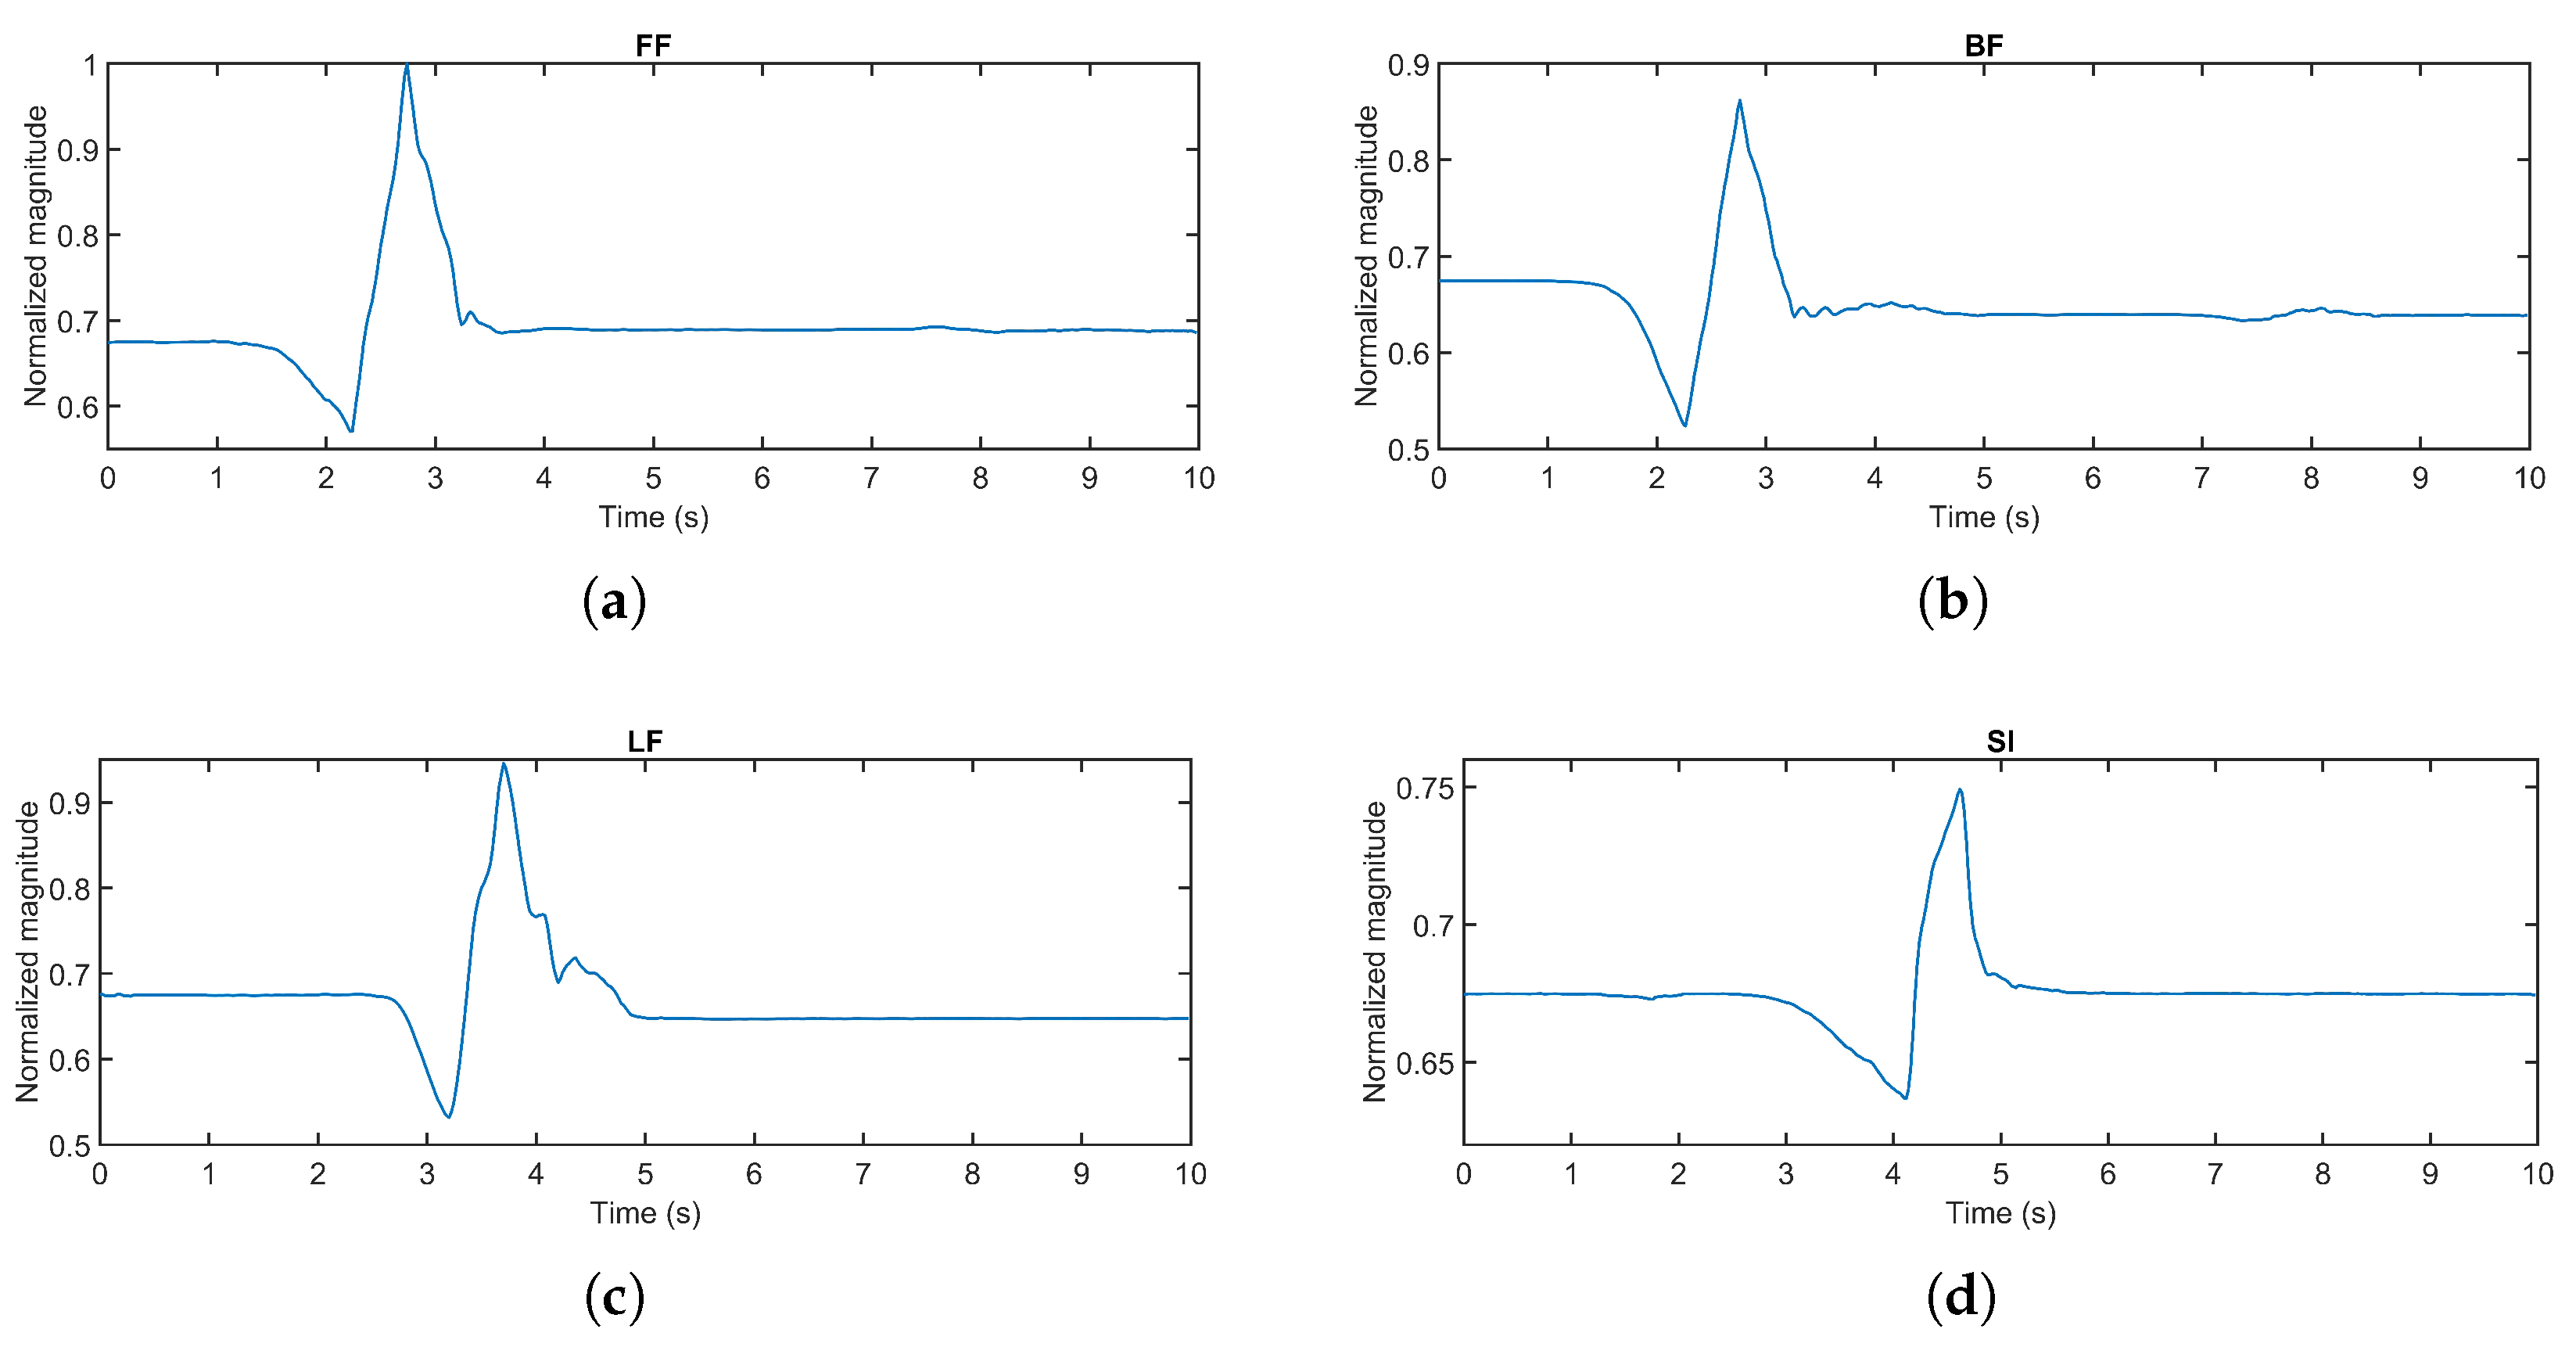
The threshold based classification algorithm (abbreviated as TA) compares the extracted features with threshold values, to define the potential class or classes to which the unknown target belongs. A pattern is classified as belonging to a specific class if the maximum value of its cross-correlation with the corresponding signature (feature) overpasses a predefined threshold.
As already stated, the ROC theory has been used to define optimal thresholds values for each class of the considered events. The ROC curve theory provides theoretical support to the classification problem where a classifier is required to map each instance to one of two classes [48]. The general strategy adopted by the ROC theory allows to identify thresholds which maximize both the sensitivity and specificity of the classification methodology. In order to guarantee this specification, the intersection between the specificity and sensitivity curves has been adopted as the selection criteria for thresholds identification [18]. It must be observed that the result of the classification strategy above described can lead to multiple classifications (an unknown pattern could be recognized as belonging to different classes) and unclassified events (an unknown pattern could be classified as not belonging to any of the considered classes of events). In order to overcome such mis-classifications a post-processing elaboration (Advanced Threshold Algorithm—ATA) has been also implemented. To such aim, two terms have to be defined: (1) fall dynamics evaluation and (2) post-fall evaluation; the word “dynamic” is related to the nature of the investigation which takes into account the time evolution of the event to be classified, while the post-fall evaluation takes into account the orientation of the accelerometer axes at the end of the dynamic evolution of the unknown event. The ATA represents an improvement as respect to the TA version since it adds the post-fall evaluation of the acceleration axes. It is used only in case of an unclassified event or multiple classifications. In the first scenario, the classification result totally relies on the post-fall classification. In case of multiple classifications, the post-fall evaluation is used to select the most likely classes among those identified by the TA algorithm. Actually, the matching between the post-fall evaluation and the multiple classifications will define the class to which the unknown event belongs.

4. A Case of Study

The classes of events, E, considered through this paper are:
  • Backward falls (FB) (50 repetitions);
  • Forward falls (FF) (50 repetitions);
  • Lateral falls (LF) (50 repetitions);
  • Sitting events (SI) (50 repetitions).
Each event has been acquired for 10 s, with a sampling frequency, f s , of 500 Hz. Although a sampling rate of 100 Hz has been demonstrated to be suitable in case of Fall detector, since the aim of this work is the classification of different kind of Falls, a higher sampling rate has been used to avoid any loss of information provided by the accelerometer signals. The acquisition were performed using ultralow-power/high-performance/three-axis nanoac- celerometer, ST LIS3DH. The accelerometer has dynamically capable of measuring accelerations with output data rates user selectable full scales of ±2g/±4g/±8g/±16g and it is ranging from 1 Hz to 5 kHz. It provides a 16-bit information by an Inter Integrated Circuit/Serial Peripheral Interface digital output interface. The sensor has been positioned on the user’s right hip since this is close to the center of the body mass. The inertial monitoring of such body point will provide reliable information on the body movements, which are minimally affected by sudden limb motion artifacts.
In particular, 10 users, with different stature and weights and ranging between 25 and 44 years old, with a mean of 37 years and a standard deviation of 5.56 years, have been selected to simulate both falls and sitting events, 5 times each. Characteristics of users involved in the experimental trials are summarized in Table 1.
It is mandatory to underline that the aim of this case study is not to distinguish falls from the sitting event but rather to classify different kinds of falls (forward fall and backward fall as an example). However, the sitting event has been included in order to the test the robustness of the methodology proposed against a non-fall event which shows a fall-similar dynamic.
It is mandatory to clarify that this work reports on laboratory tests performed by people belonging to the Research Team with different heights, ages and weights in safe conditions (falls have been simulated using a mattress as a common practice adopted also by other research groups). Each participant was requested to sign an informed consensus regarding the purpose of the study and working conditions. Nevertheless, every precaution was taken to ensure user safety during experiments. Moreover, it must be considered that the Device Under Test is not belonging to the class of medical devices, being an external inertial unit used to monitor the dynamic of the user body.
Although users addressed by the solution should be frail people, the choice of using healthy subjects performing tests in safe conditions, has been taken to avoid injuries during this preliminary phase. To support this choice, it must be stressed out that the event-driven cross-correlation classification strategy developed is robust against light modifications of signal dynamics, thus confirming that the classification procedure can be successfully extended to a new data set generated by real users.
In particular, 40 of the 50 acquisitions have been used to generate the event-related signature while, the remaining 10, have been used for test purposes. The reason behind the larger number of data used for signatures generation is due to the need of generating typical time evolution of the acceleration module for each of the considered classes. To such aim, the availability of a dataset able to properly represent the typical dynamics of each class of events is mandatory. Signatures generated using data collected during the experiments are shown in Figure 2.
As an example, features obtained are reported in Table 2. For the sake of clarification, each row of the Table 2a is an FF event taken from the test set. In particular, each element of the row is the correlation result between the FF event and the FF, BF, LF and SI signature. For example, the element in column 2 is the maximum correlation between the FF event and the BF signature.
As it clearly emerges, higher values of the features have been obtained in case of the correlation of the pre-processed unknown pattern with the its related signature: the first column of the Table 2a shows a greater value of the features because it contains the correlation between FF events and the FF signature, while, the last column of the Table 2d, shows a greater value of the features because it reports the correlation between SI events and the SI signature. The same reasoning apply to the other events.
It should be noticed also that high features values can be obtained also in case of cross-correlation between a pattern belonging to a class and the signature of a different class (this is particularly evident between the FF event and the BF one). This scenario, which could bring to mis-classifications, can be justified by similar dynamics of the two class of events.
Table 3 shows the optimal threshold, for each class of events here addressed, evaluated by using the ROC curves theory [5,18].
Each threshold value shown in Table 3, is related to the corresponding column of Table 2, which is the one associated to its signatures. As an example, the threshold value for the SI event (0.88) only applies to the SI column in Table 2a. In the same way the threshold value for the BF event (0.95) only applies to the BF column in Table 2a.
The result of the comparison between feature values and the adopted thresholds will produce 1 in cases the feature value is higher than the corresponding threshold, and 0 in the opposite case. According to the above mentioned procedure, results shown in Table 4 have been obtained; observing this Table, occurrences introduced in Section 3.1.3 can be identified. Considering Table 4a containing results for the FF events, any classification has been performed in the third and sixth rows; considering the table containing the SI events, different multiple classifications can be observed.
These occurrences can be reduced taking into account the post-fall classification, implemented by the ATA paradigm. Results shown in Table 5 demonstrate reduction of mis-classifications.

5. The Assessment Procedure

In the following notes, the measurement procedure developed to assess performances of the different classification strategies addressed in above sections, is presented.
In case of a generic Event Class E, the following quantities can be defined:
  • TP (true positive): events of type E correctly recognized as belonging to class E;
  • FN (false negative): events of type E recognized as belonging to a class different than E;
  • TN (true negative): events different from type E correctly recognized as belonging to a class different than E;
  • FP (false positive): events different from type E recognized as belonging to class E;
During the assessment procedure, the following performance indexes will be used:
  • Sensitivity ( S e ): the capability of an algorithm to correctly identify TPs as such.
    S e = T P T P + F N
  • Specificity ( S p ): the capability of the system to correctly identify TNs as such.
    S p = T N T N + F P
Basically, the aim of the assessment approach is to estimate the system performances in terms of reliability in fall classification.
In order to provide a fast and synthetic way to highlight the performances enhancement using the ATA as respect to simple TA algorithm, in Table 6 a comparison between the two classifiers is given. In particular, the Table shows the indexes computed for each event considered through this work and, moreover, an average evaluation of the algorithm’s performances across all the classes of events (last column of the Table).
In conclusion, it can be said that there is a significant improvement in the classification performances when moving from the TA algorithm to the ATA paradigm. Values reported in Table 6, then, validate the adopted strategy while confirming the reliability of the proposed approach.

6. Conclusions

The worldwide ageing population is pushing forward the development of reliable assistive solutions for the Active Assisted Living context. Particular emphasis is given to falls which represent a serious issue which could bring catastrophic consequences. It hence emerges the need for the development of reliable and robust solutions to address the requirements of frail people willing to live autonomously. To such aim and taking into account also the need for low cost solutions, the focus of research efforts should move from very expensive hardware solutions to effective signal processing and smart computational paradigms.
In this paper, after a brief review of the State of the Art on falls recognition and classification, a case of study addressing a classification methodology exploiting a event-driven correlation paradigm and a threshold based classifier is presented. An improvement to this solution is represented by the integration of the post-fall evaluation of the accelerometer axes.
Computing the threshold values by means of the ROC curves theory further allow to make the classification methodology robust to exogenous factors. Performances of the methodology proposed have been addressed by two performances indexes, S e and S p , both in the case of TA and ATA algorithms. The S e value moves from 0.81 (TA) to 0.97 (ATA). The S p value moves from 0.92 (TA) to 0.99 (ATA). Above results state for the high reliability of the methodology developed and encourage future efforts to further extend its applicability to a wide set of events.

Author Contributions

Conceptualization, S.B.; methodology, B.A.; software and validation, R.C.; resources, V.M.; data curation, S.C.; writing–original draft preparation, R.C.; writing–review and editing, R.C.

Funding

This research received no external funding.

Conflicts of Interest

The authors declare no conflict of interest.

References

  1. Overview of the UK Population; Office for National Statistics: Newport, UK, 2017.
  2. Istat.it. Available online: https://www.istat.it/ (accessed on 15 August 2019).
  3. Home-Eurostat. Available online: https://ec.europa.eu/eurostat (accessed on 15 August 2019).
  4. Ando, B. Instrumentation notes—Sensors that provide security for people with depressed receptors. IEEE Instru. Meas. Mag. 2006, 9, 56–61. [Google Scholar] [CrossRef]
  5. Ando, B.; Baglio, S.; Lombardo, C.O.; Marletta, V. A multisensor data-fusion approach for ADL and fall classification. IEEE Trans. Instrum. Meas. 2016, 65, 1960–1967. [Google Scholar] [CrossRef]
  6. Li, H.; Shrestha, A.; Fioranelli, F.; Le Kernec, J.; Heidari, H.; Pepa, M.; Cippitelli, E.; Gambi, E.; Spinsante, S. Multisensor data fusion for human activities classification and fall detection. Proc. IEEE Sens. 2017, 2017, 1–3. [Google Scholar] [CrossRef]
  7. Ando, B.; Baglio, S.; Marletta, V.; Crispino, R. A NeuroFuzzy approach for fall detection. In Proceedings of the 2017 International Conference on Engineering, Technology and Innovation (ICE/ITMC), Madeira Island, Portugal, 27–29 June 2017; pp. 1312–1316. [Google Scholar] [CrossRef]
  8. Andò, B.; Baglio, S.; Marletta, V.; Pistorio, A. A RFID approach to help frail users in indoor orientation task. In Proceedings of the 2018 IEEE Sensors Applications Symposium (SAS), Seoul, Korea, 12–14 March 2018; pp. 2–5. [Google Scholar]
  9. Andò, B.; Baglio, S.; Marletta, V.; Crispino, R.; Pistorio, A. A Measurement Strategy to Assess the Optimal Design of an RFID-Based Navigation Aid. IEEE Trans. Instrum. Meas. 2018, 68, 1–7. [Google Scholar] [CrossRef]
  10. Cippitelli, E.; Fioranelli, F.; Gambi, E.; Spinsante, S. Radar and RGB-Depth Sensors for Fall Detection: A Review. IEEE Sens. J. 2017, 17, 3585–3604. [Google Scholar] [CrossRef] [Green Version]
  11. Diraco, G.; Leone, A.; Siciliano, P. Radar Sensing Technology for Fall Detection Under Near Real-Life Conditions. In Proceedings of the 2nd IET International Conference on Technologies for Active and Assisted Living, London, UK, 24–25 October 2016; p. 5. [Google Scholar] [CrossRef]
  12. Andò, B.; Baglio, S.; La Malfa, S.; Marletta, V. A Sensing Architecture for Mutual User-Environment Awareness Case of Study: A Mobility Aid for the Visually Impaired. IEEE Sens. J. 2011, 11, 634–640. [Google Scholar] [CrossRef]
  13. Andò, B. A Smart Multisensor Approach to Assist Blind People in Specific Urban Navigation Tasks. IEEE Trans. Neural Syst. Rehabil. Eng. 2008, 16, 592–594. [Google Scholar] [CrossRef] [PubMed]
  14. Andò, B.; Baglio, S.; Malfa, S.L.; Marletta, V. Innovative Smart Sensing Solutions for the Visually Impaired. In Handbook of Research on Personal Autonomy Technologies and Disability Informatics; IGI Global: Hershey, PA, USA, 2011; pp. 60–74. [Google Scholar]
  15. Cardinaux, F.; Bhowmik, D.; Abhayaratne, C.; Hawley, M.S. Video Based Technology for Ambient Assisted Living: A Review of the Literature. J. Ambient Intell. Smart Environ. 2011, 3, 253–269. [Google Scholar]
  16. König, A.; Crispim, C.F.; Derreumaux, A.; Bensadoun, G.; Petit, P.D.; Bremond, F.; David, R.; Verhey, F.; Aalten, P.; Robert, P. Validation of an Automatic Video Monitoring System for the Detection of Instrumental Activities of Daily Living in Dementia Patients. J. Alzheimer’s Dis. 2015, 44, 675–685. [Google Scholar] [CrossRef] [Green Version]
  17. Celler, B.; Earnshaw, W.; Ilsar, E.; Betbeder-Matibet, L.; Harris, M.; Clark, R.; Hesketh, T.; Lovell, N. Remote monitoring of health status of the elderly at home. A multidisciplinary project on aging at the University of New South Wales. Int. J. Bio-Med. Comput. 1995, 40, 147–155. [Google Scholar] [CrossRef]
  18. Andó, B.; Baglio, S.; Lombardo, C.O.; Marletta, V. An Event Polarized Paradigm for ADL Detection in AAL Context. IEEE Trans. Instrum. Meas. 2015, 64, 1814–1825. [Google Scholar] [CrossRef]
  19. Bruno, A.; Baglio, S.; Crispino, R.; L’Episcopo, L.; Marletta, V.; Branciforte, M.; Virzi, M.C. A smart inertial pattern for the SUMMIT IoT multi-platform. Lect. Notes Electr. Eng. 2018, 544, 311–319. [Google Scholar]
  20. Chaccour, K.; Darazi, R.; Hassani, A.H.E.; Andrès, E. From Fall Detection to Fall Prevention: A Generic Classification of Fall-Related Systems. IEEE Sens. J. 2017, 17, 812–822. [Google Scholar] [CrossRef]
  21. Rescio, G.; Leone, A.; Siciliano, P. Supervised Expert System for Wearable MEMS Accelerometer-Based Fall Detector. J. Sens. 2013, 2013, 1–11. [Google Scholar] [CrossRef] [Green Version]
  22. Panahandeh, G.; Mohammadiha, N.; Leijon, A.; Handel, P. Chest-mounted inertial measurement unit for pedestrian motion classification using continuous hidden Markov model. In Proceedings of the 2012 IEEE International Instrumentation and Measurement Technology Conference Proceedings, Graz, Austria, 13–16 May 2012; pp. 991–995. [Google Scholar] [CrossRef]
  23. Leone, A.; Rescio, G.; Caroppo, A.; Siciliano, P. A Wearable EMG-based System Pre-fall Detector. Procedia Eng. 2015, 120, 455–458. [Google Scholar] [CrossRef] [Green Version]
  24. Rescio, G.; Leone, A.; Siciliano, P. Support Vector Machine for tri-axial accelerometer-based fall detector. In Proceedings of the 5th IEEE International Workshop on Advances in Sensors and Interfaces IWASI, Bari, Italy, 13–14 June 2013; pp. 25–30. [Google Scholar] [CrossRef]
  25. Dunkel, J.; Bruns, R.; Stipkovic, S. Event-based smartphone sensor processing for ambient assisted living. In Proceedings of the 2013 IEEE Eleventh International Symposium on Autonomous Decentralized Systems (ISADS), Mexico City, Mexico, 6–8 March 2013; pp. 1–6. [Google Scholar] [CrossRef]
  26. Franco, C.; Fleury, A.; Gumery, P.Y.; Diot, B.; Demongeot, J.; Vuillerme, N. iBalance-ABF: A Smartphone-Based Audio-Biofeedback Balance System. IEEE Trans. Biomed. Eng. 2013, 60, 211–215. [Google Scholar] [CrossRef] [PubMed]
  27. Ketabdar, H.; Lyra, M. System and methodology for using mobile phones in live remote monitoring of physical activities. In Proceedings of the 2010 IEEE International Symposium on Technology and Society, Wollongong, NSW, Australia, 7–9 June 2010; pp. 350–356. [Google Scholar] [CrossRef]
  28. Tacconi, C.; Mellone, S.; Chiari, L. Smartphone-based applications for investigating falls and mobility. In Proceedings of the 2011 5th International Conference on Pervasive Computing Technologies for Healthcare (PervasiveHealth) and Workshops, Dublin, Ireland, 23–26 May 2011; pp. 258–261. [Google Scholar] [CrossRef]
  29. Vo, Q.V.; Lee, G.; Choi, D. Fall Detection Based on Movement and Smart Phone Technology. In Proceedings of the 2012 IEEE RIVF International Conference on Computing & Communication Technologies, Research, Innovation, and Vision for the Future, Ho Chi Minh City, Vietnam, 27 Februry–1 March 2012; pp. 1–4. [Google Scholar] [CrossRef]
  30. Otanasap, N. Pre-Impact Fall Detection Based on Wearable Device Using Dynamic Threshold Model. In Proceedings of the 2016 17th International Conference on Parallel and Distributed Computing, Applications and Technologies (PDCAT), Guangzhou, China, 16–18 December 2016; pp. 362–365. [Google Scholar] [CrossRef]
  31. Cates, B.; Sim, T.; Heo, H.M.; Kim, B.; Kim, H.; Mun, J.H. A Novel Detection Model and Its Optimal Features to Classify Falls from Low- and High-Acceleration Activities of Daily Life Using an Insole Sensor System. Sensors 2018, 18, 1227. [Google Scholar] [CrossRef]
  32. Sucerquia, A.; López, J.D.; Vargas-Bonilla, J.F. Real-Life/Real-Time Elderly Fall Detection with a Triaxial Accelerometer. Sensors 2018, 18, 1101. [Google Scholar] [CrossRef] [PubMed]
  33. Wang, F.T.; Chan, H.L.; Hsu, M.H.; Lin, C.K.; Chao, P.K.; Chang, Y.J. Threshold-based fall detection using a hybrid of tri-axial accelerometer and gyroscope. Physiol. Meas. 2018, 39, 105002. [Google Scholar] [CrossRef] [PubMed]
  34. Igual, R.; Medrano, C.; Plaza, I. Challenges, issues and trends in fall detection systems. Biomed. Eng. Online 2013, 12, 66. [Google Scholar] [CrossRef]
  35. Shahzad, A.; Kim, K. FallDroid: An Automated Smart-Phone-Based Fall Detection System Using Multiple Kernel Learning. IEEE Trans. Ind. Inf. 2019, 15, 35–44. [Google Scholar] [CrossRef]
  36. Hsu, Y.; Chen, K.; Yang, J.; Jaw, F. Smartphone-based fall detection algorithm using feature extraction. In Proceedings of the 2016 9th International Congress on Image and Signal Processing, BioMedical Engineering and Informatics (CISP-BMEI), Datong, China, 15–17 October 2016; pp. 1535–1540. [Google Scholar] [CrossRef]
  37. Buzin Junior, C.L.; Adami, A.G. SDQI—Fall Detection System for Elderly. IEEE Lat. Am. Trans. 2018, 16, 1084–1090. [Google Scholar] [CrossRef]
  38. Cheffena, M. Fall Detection Using Smartphone Audio Features. IEEE J. Biomed. Health Inform. 2016, 20, 1073–1080. [Google Scholar] [CrossRef] [PubMed]
  39. Turaga, P.; Chellappa, R.; Subrahmanian, V.S.; Udrea, O. Machine Recognition of Human Activities: A Survey. IEEE Trans. Circuits Syst. Video Technol. 2008, 18, 1473–1488. [Google Scholar] [CrossRef]
  40. Messing, R.; Pal, C.; Kautz, H. Activity recognition using the velocity histories of tracked keypoints. In Proceedings of the 2009 IEEE 12th International Conference on Computer Vision, Kyoto, Japan, 29 September–2 October 2009; pp. 104–111. [Google Scholar] [CrossRef]
  41. Lei, J.; Ren, X.; Fox, D. Fine-grained Kitchen Activity Recognition Using RGB-D. In Proceedings of the 2012 ACM Conference on Ubiquitous Computing; ACM: New York, NY, USA, 2012; pp. 208–211. [Google Scholar] [CrossRef]
  42. Rohrbach, M.; Amin, S.; Andriluka, M.; Schiele, B. A database for fine grained activity detection of cooking activities. In Proceedings of the 2012 IEEE Conference on Computer Vision and Pattern Recognition, Providence, RI, USA, 16–21 June 2012; pp. 1194–1201. [Google Scholar] [CrossRef]
  43. As’ari, M.A.; Sheikh, U.U. Vision Based Assistive Technology for People with Dementia Performing Activities of Daily Living (ADLs)—an Overview. Proc. SPIE Int. Soc. Opt. Eng. 2012, 8334, 100. [Google Scholar] [CrossRef]
  44. Harrou, F.; Zerrouki, N.; Sun, Y.; Houacine, A. Vision-based fall detection system for improving safety of elderly people. IEEE Instrum. Meas. Mag. 2017, 20, 49–55. [Google Scholar] [CrossRef]
  45. Núñez-Marcos, A.; Azkune, G.; Arganda-Carreras, I. Vision-Based Fall Detection with Convolutional Neural Networks. Wirel. Commun. Mob. Comput. 2017, 2017, 1–16. [Google Scholar] [CrossRef] [Green Version]
  46. Hein, A.; Kirste, T. A Hybrid Approach for Recognizing ADLs and Care Activities Using Inertial Sensors and RFID. In Universal Access in Human-Computer Interaction; Intelligent and Ubiquitous Interaction, Environments; Stephanidis, C., Ed.; Springer: Berlin/Heidelberg, Germany, 2009; pp. 178–188. [Google Scholar]
  47. Cippitelli, E.; Gasparrini, S.; Gambi, E.; Spinsante, S.; Wåhslény, J.; Orhany, I.; Lindhy, T. Time synchronization and data fusion for RGB-Depth cameras and inertial sensors in AAL applications. In Proceedings of the 2015 IEEE International Conference on Communication Workshop (ICCW), London, UK, 8–12 June 2015; pp. 265–270. [Google Scholar] [CrossRef]
  48. Fawcett, T. An introduction to ROC analysis. Pattern Recognit. Lett. 2006, 27, 861–874. [Google Scholar] [CrossRef]
Figure 1. Paradigm adopted for the sake of events classification.
Technologies 07 00059 g001
Figure 2. The generated signatures. (a) Forward Fall; (b) Backward Fall; (c) Lateral Fall; (d) Sitting.
Technologies 07 00059 g002
Figure 3. The procedure adopted for the signature generation. The example shows the steps for the forward fall event.
Technologies 07 00059 g003
Table 1. Characteristics of the users involved in the test.
UserUserUserUserUserUserUserUserUserUser
12345678910
GenderMaleMaleFemaleMaleMaleFemaleMaleMaleFemaleMale
Age [year]36254036314440363942
Height [m]1.751.851.621.781.661.541.811.651.581.92
Weight [Kg]908254857252816360105
Table 2. Examples of correlation indexes.
(a) Correlation Indexes for the FF Event
RepetitionFFBFLFSI
10.970.880.870.69
20.950.900.870.74
30.930.940.890.85
40.960.890.880.73
50.960.880.870.70
60.930.930.880.82
70.940.840.840.65
80.940.850.850.66
90.970.930.890.77
100.950.920.860.73
(b) Correlation Indexes for the BF Event
RepetitionFFBFLFSI
10.820.920.890.81
20.850.940.870.83
30.900.990.880.81
40.870.930.870.84
50.920.980.890.87
60.910.980.890.87
70.930.980.900.87
80.900.990.880.81
90.880.940.870.82
100.840.930.880.82
(c) Correlation Indexes for the LF Event
RepetitionFFBFLFSI
10.890.880.950.84
20.870.890.970.85
30.880.890.970.85
40.890.890.980.84
50.880.910.980.84
60.840.890.920.85
70.850.890.980.87
80.840.900.960.86
90.870.910.970.86
100.860.910.920.84
(d) Correlation Indexes for the SI Event
RepetitionFFBFLFSI
10.760.950.840.99
20.760.910.830.98
30.750.910.850.99
40.750.910.850.99
50.760.950.840.99
60.760.920.850.99
70.760.920.860.99
80.760.910.830.99
90.750.910.830.99
100.770.950.840.99
Table 3. Threshold values computed by means of the ROC curves.
FFBFLFSI
0.940.950.930.88
Table 4. TA algorithm classification.
(a) FF Events
RepetitionFFBFLFSI
11000
21000
30000
41000
51000
60000
71000
81000
91000
101000
(b) BF Events
RepetitionFFBFLFSI
10000
20000
30100
40000
50100
60100
70100
80100
90000
100000
(c) LF Events
RepetitionFFBFLFSI
10010
20010
30010
40010
50010
60000
70010
80010
90010
100000
(d) SI Events
RepetitionFFBFLFSI
10101
20001
30001
40001
50101
60001
70001
80001
90001
100101
Table 5. Examples of classification performance for the ATA algorithm.
(a) FF Events
RepetitionFFBFLFSI
11000
21000
31000
41000
51000
61000
71000
81000
91000
101000
(b) BF Events
RepetitionFFBFLFSI
10100
20100
30100
40100
50100
60100
70100
80100
90100
100000
(c) LF Events
RepetitionFFBFLFSI
10010
20010
30010
40010
50010
60010
70010
80010
90010
100010
(d) SI Events
RepetitionFFBFLFSI
10001
20001
30001
40001
50001
60001
70001
80001
90001
100001
Table 6. Comparison between the TA and ATA algorithms.
AlgorithmIndexFFBFLFSIAverage
TA S e 10.500.7610.81
S p 0.97110.720.92
ATA S e 10.89110.97
S p 0.971110.99

