1. Introduction
In 2001, the United Nations (UN) Security Council authorized a temporary administration to dispatch peacekeeping forces to reassure steadiness in the region and aid delivery. In 2002, the international community pledged more than US
$5 billion in aid to rebuild Afghanistan [
1]. In the same period, the United States Congress approved more than US
$38 billion for humanitarian and reconstruction assistance in this region. The total amount of assistance from the United States was divided into four categories [
2]. The majority of the funding (56%) was reserved for the Afghan Security Forces Fund (ASFF) to train and equip Afghan security forces. At 31%, the second largest category of funding was reserved for economic, social, and political development efforts. The third category (4%) was reserved for the development of international organizations and the United States Agency for International Development (USAID); and the remaining 9% was reserved for counter-narcotics efforts. Examples included rebuilding the bottom-up economic activity of indigenous institutions and constructing the necessary urban and civil community infrastructures. The impact of these infrastructure developments has been little explored, and the relationship between infrastructure development and adverse events is not clear cut [
3].
The development of reliable models for estimating, detecting, mitigating, and/or preventing adverse events is crucial in the aviation industry [
4], healthcare institutions [
5,
6], drug administration [
7,
8], and active war theaters [
9], to name a few. In the latter, adverse events are caused by terrorist activities that primarily target the civilian population in countries such as Afghanistan. Today, very little is known regarding the impact of infrastructure development projects on adverse events in active war theaters, predominantly due to challenges in the representation of social science data and framework requirements. Some of the challenges reside in Human Social Culture Behavior (HSCB) modeling and are due to a deficiency in the common vocabulary, variations in data acquisition, and a general lack of data [
10].
The United States Department of Defense (DoD) developed the Human Social Culture Behavior (HSCB) Modeling Program [
11,
12] to undertake infrastructure development efforts to stabilize the country of Afghanistan and, consequently, to counter or reduce terrorist events. However, assessing the effect of these efforts presents significant challenges, because the data used to build models exhibit nonlinear and fuzzy behavior, and are often ill-defined with respect to their socio-economic-cultural factors. The purpose of this paper is to investigate the relationship between adverse events and infrastructure development investments in an active war theater by using a cellular automata (CA) modeling approach, in which the accuracy of the predictions is directly beneficial from an economic and humanistic point of view.
The contents of this paper are organized as follows.
Section 2 provides the relevant background by summarizing works of spatial and temporal analysis.
Section 3 describes the study, the dataset, and the methodology.
Section 4
reports the experimental findings and analysis of the results. The conclusions from the current study are presented in
Section 5.
2. Background
According to the Open Source Center (OSC) of the United States Central Intelligence Agency, terrorist attacks do not occur at random, and it is possible to detect representative patterns in space and time (spatiotemporal) [
13]. These representative patterns can be modeled by using statistical human behavior modeling approaches [
14]. Some of those spatial patterns and assessments of incidents are: Mapping the incident density, identifying the dominant ethnic group by incident location, identifying the mean center of incidents, and calculating the spatial pattern and trend of the overall incidents. Several studies have used geographic information system (GIS) data and spatiotemporal statistics to conduct incident analysis. For example, LaFree et al. [
15] examined spatial and temporal patterns of all terrorist attacks attributed to the Euskadi Ta Askatasuna (ETA) (a Spanish separatist group) from 1970 to 2007. Another study focused on the spatiotemporal factors of terrorist attacks in Israel [
16] and concluded that spatiotemporal data are necessary for describing terrorist attack patterns. Siebeneck et al. [
17] used historical data from 2004 to 2006 to develop a series of analyses to understand terrorist activity spaces and counterterrorist actions. To be able to detect patterns, the researchers focused their study on terrorist incidents in Iraq, applying several methodologies, such as clustering analysis, spatial and temporal statistics, and global information systems to provide pattern knowledge. Recently, Python et al. [
18] performed hierarchical models in a Bayesian context, in which the spatial random field is represented by a stochastic partial differential equation. The authors concluded that lethal terrorist attacks tend to generate more deaths in ethnically polarized areas and in locations within democratic countries. Another study by Marchment and Gill [
19] applied a discrete choice model to understand terrorist spatial decision making. These authors concluded that terrorists are similar to traditional criminals in their decision making, in addition to being influenced by spatial context, such as the distance from their home location to the attack location, or the presence of a premise relevant to their ideology.
Agent-based models (ABMs) have also been applied in this field. Hudak and Baez [
20] proposed an ABM that simulates operations on the populations’ perception of governance, security, and infrastructure for a particular district in Afghanistan, and found that the effects are directly related to non-kinetic operations. The ABM approach was also introduced to model residential burglaries at an individual level using a behavioral framework [
21]. However, the above applications of ABM require access to large sets of data to successfully model the targeted population characteristics [
22]. Recently, Tutun et al. [
23] aimed to model how terrorist groups and governments influence each other. To do so, an agent-based model with a network topology was used to model the system, which was composed of interacting agents (attacks) and groups.
In the current study, the relationships between infrastructure development projects and adverse events are modeled using the cellular automata approach. CA is one of the oldest models of natural computing, with a history spanning more than half of a century [
24]. In its simplest form, space is represented by a tessellation (a uniform, bi-dimensional collection of cells) in which the cells represent the population involved. Iterations are performed based on a set of rules that represent the parametric set of conditions that determine the next state of cells according to neighboring states at a discrete time
. The rules can control changes in the behavior of the CA to enable meaningful results. CA consists of identical computing cells, which locally and synchronously interact with one another to determine their next state. Although the change of a cell state in a given iteration may be small, after numerous iterations, these small changes create complex patterns representing the final condition of the system. Thus, CA is a potential tool for simulating a range of varied and sophisticated natural phenomena.
Spicer et al. [
25] applied a traditional cellular automata modeling approach to link liquor establishments to crime data. In this study, the cells in a grid behaved like city blocks, each of which was assigned its own risk factor, and the behavior of the cells was altered by the social interactions that occurred between the cells. Vaz et al. [
26] used CA to study urban growth by modeling the transactions among urban and non-urban areas and densely populated areas in Portugal. A Markov model was used to generate transition rules that were determined by social, economic, and geographical inputs. The study concluded with an urban growth scenario for the year 2020. Bing Sheng and Sui [
27] incorporated remote sensing imagery and social and economic data into a CA model to express the impact of globalization on Asian urban dynamics with domestic economic/demographic drivers. Wu et al. [
28] combined an artificial, neural network-based stochastic CA model with a set of socioeconomic measures that included the income of the non-urban population, income of the urban population, population, and gross domestic product. Lauf et al. [
29] integrated system dynamics into a CA to model the relationship between household dynamics and residential development. Mago et al. [
30] applied CA and fuzzy cognitive maps (FCM) to model the spread of HIV by combining macro and micro-level models, for which the macro-level model was identified by FCM and statistical feedback was generated from the micro-level parameters calculated by CA.
More recent studies used linear regression, neural networks, fuzzy inference systems (FISs), adaptive neuro-fuzzy inference systems (ANFISs), fuzzy overlay models, fuzzy C-means with subtractive clustering, and data streaming methods to predict and detect four types of events: The number of people killed, wounded, and hijacked, as well as other events based on infrastructure development spending and other variables in a war theater in Afghanistan [
9,
31,
32,
33,
34,
35,
36,
37]. These four categories of events are collectively called “adverse events,” which is the term that will be used throughout this paper. This study proposed a different approach for investigating the relationships between infrastructure development projects and adverse events using the CA modeling approach. A unique CA model that incorporates GIS and is capable of evaluating the impact of infrastructure development projects on adverse events, in terms of the location, time, and impact of these incidents, was developed. Using the developed cellular automata, the user can create “what-if” scenarios to forecast adverse events in comparison to previous models [
9,
31,
32,
33,
34,
35,
36,
37]. The proposed cellular automata modeling approach is capable of identifying the location, time, and impact of future adverse events.
Study Area
Afghanistan, which is constituted by 34 provinces, is located in South-Central Asia. Each province has its own capital and administration, and the 34 provinces are subdivided into a total of 400 districts. Each district contains at least one city or a certain number of villages. Afghanistan boarders Pakistan on the south and east, Iran on the west, Turkmenistan, Uzbekistan, and Tajikistan on the north, and China on the far north-east. Afghanistan is comprised of 652,000 square kilometers, such that by areal land mass, the country is only slightly smaller than the state of Texas in the United States. The population of Afghanistan was estimated to be at 34 million as of 2017. Afghanistan’s particular geography is relatively inaccessible due to significant mountainous regions, with plains in the north and south-west. These factors result in a situation that has led to great difficulty in securing the population and improving the economic situation of the country’s inhabitants.
3. Methods
3.1. Cellular Automata Model
CA modeling of the infrastructure development projects and adverse events was designed at two major implementation levels: The macro level; i.e., population and infrastructure development projects, and the micro level; i.e., reported adverse events in a given geographical region of Afghanistan. The macro-level model supports CA rules to generate predictions. The micro-level model utilizes interactions between adverse events. Transition between the macro and micro levels is deployed by CA transition rules that benefit from weighted Euclidean distances. Understanding and managing both levels as coherent dynamic entities helps to maintain the modeling system’s integrity.
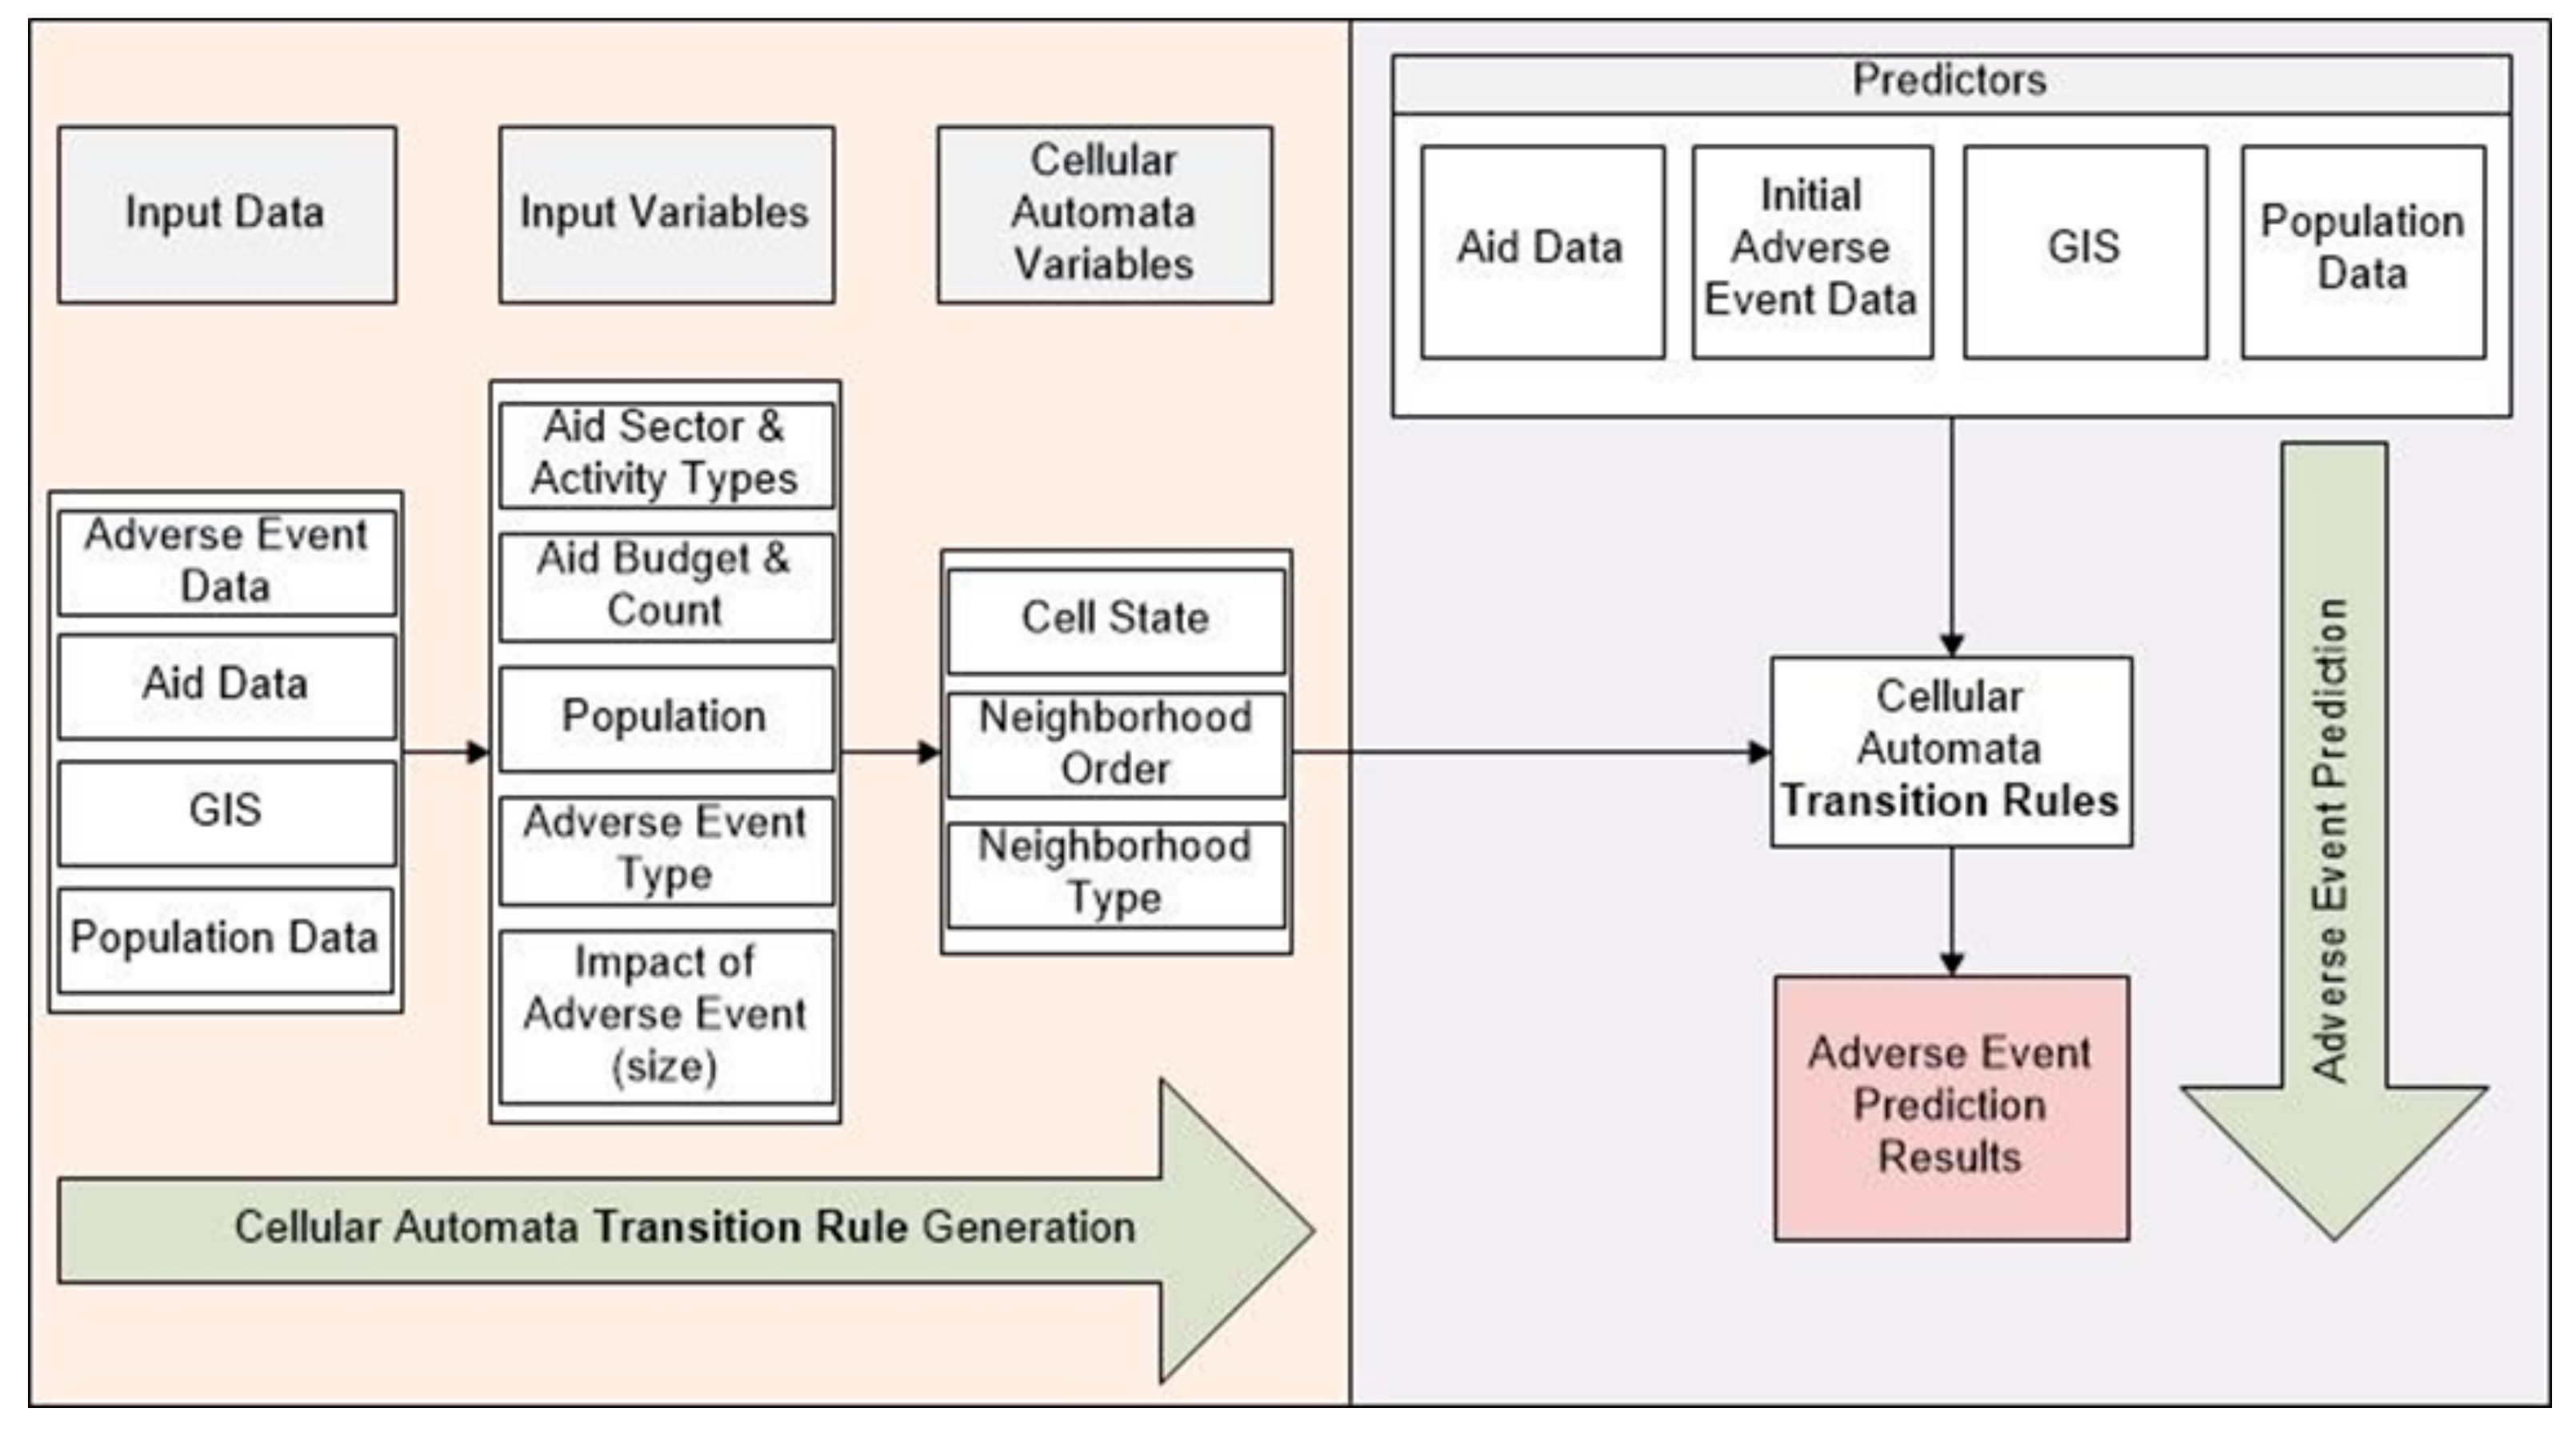
Figure 1 illustrates the modeling framework and input variables of the CA model. A transition rule generator inputs aid data as the count; the sum of the budget of the aid grouped by aid sector activity types; adverse event data as the count and the impact (population affected by the adverse event) grouped by the number of killed, wounded, or hijacked people; the count of adverse events that occurred; and population data in terms of rural and urban populations, female and male populations, the total population, and population density. In this framework, the GIS acts as both the location data integrator and the neighboring cell identifier, which uses the cellular automata’s variables. The cellular automata prediction module inputs data for only the time period in which prediction will be conducted. The input data are the same in type as the input of the transition rule generator module, except for adverse event data. The prediction module inputs the adverse event data belonging to the prediction start time at (t − 1) to apply the transition rules and generate prediction results. Next, we describe the CA neighborhood presentation, cell states, and transition rules performed in this study. If a user has defined an aid data distribution, the CA module overrides the user-specified distribution in the current state of the cell. A CA module also obtains the landscape data and population specific data from the GIS module to add into the current cell state of the cell. During the initial run of the model, the CA module also obtains adverse event initial data from the user. Subsequently, the CA loops in the CA module to create next states of the cells until the defined time span is reached; then it sends the generated data to the GIS to visualize and calculate the statistics of the results.
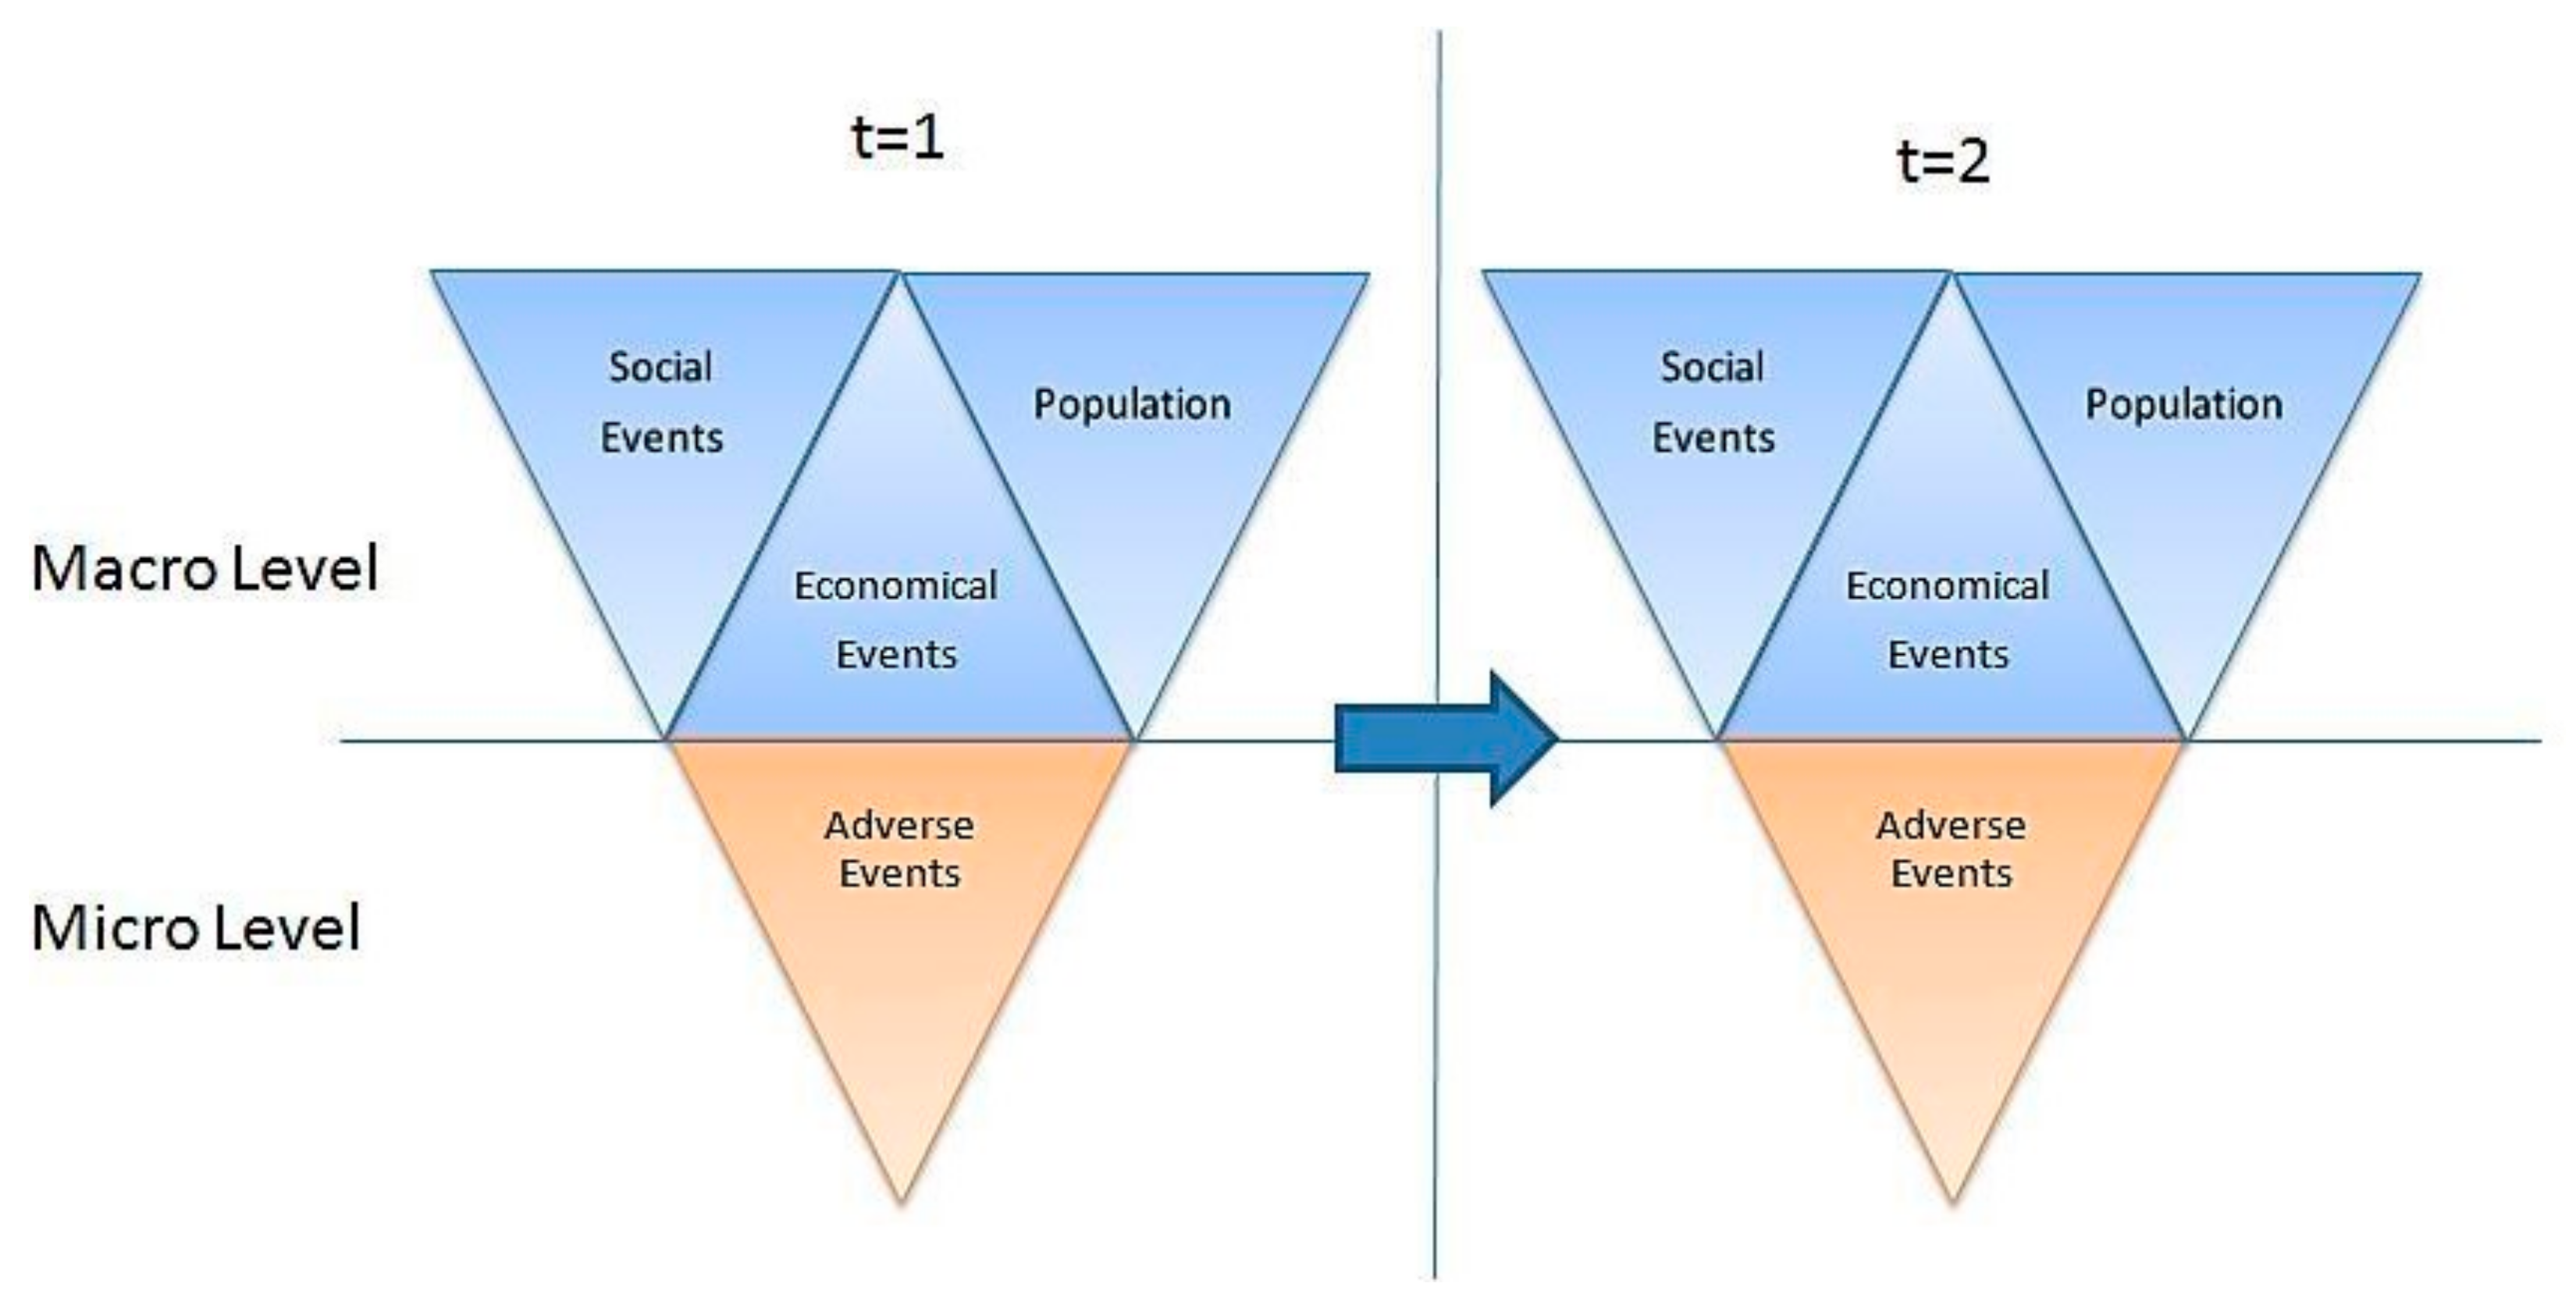
The modeling methodology of CA for social and economic analysis for this research is designed in two major implementation levels: Macro and micro-level (
Figure 2). At the macro-level, the modeling framework integrates population, social, and economic sub-systems. The macro-level allows the model to use regionalized representations and enables understanding of why the events have occurred. The macro-level supports cellular automata rules to generate accurate predictions. The predictive capabilities of CA will be used to model the micro-level interactions between individual actors, which are represented by adverse events. Understanding and managing these systems as coherent dynamic entities will help to maintain system integrity. In this methodology, CA iterates over time to generate complex patterns on the overall model by iterating with small changes.
3.2. Research Data
Empirical field data were obtained for different regions of Afghanistan from various information sources (and with different formats) and then were grouped into two major groups, adverse events and infrastructure development datasets. The adverse events’ datasets were comprised of data collected from a variety of news feeds, blogs, reports, and various databases. Among the supplied datasets, the WITSGEO dataset was selected for further study of the reported adverse events and incidents. Although other datasets had more data points for specific time periods, WITSGEO had the largest spread of data between 2005 and 2010. This dataset contained the adverse event date, the latitude and longitude of the incident location, and the number of people affected by the adverse event in terms of the numbers killed, wounded, and hijacked. Using the ArcMap overlay analysis tool, the incident locations were updated from 32 provinces to 34 provinces.
The infrastructure development datasets were comprised of data collected from the United States and regional databases. Among the supplied datasets, the USAID database was selected for the study of infrastructure development, because most of the relationships among the tables were predefined and indexes were presented. This dataset contained project identification, estimated start and end dates, estimated project budget, activity start and end dates, activity budget sector type, sector activity detail, and location information for each project. Although the USAID database was well organized, some data points were missing important content, such as project start and end dates, project budget, activity detail budget, and location information. To overcome these limitations, estimated project start and end dates and estimated project budgets (for projects with identical IDs) were utilized.
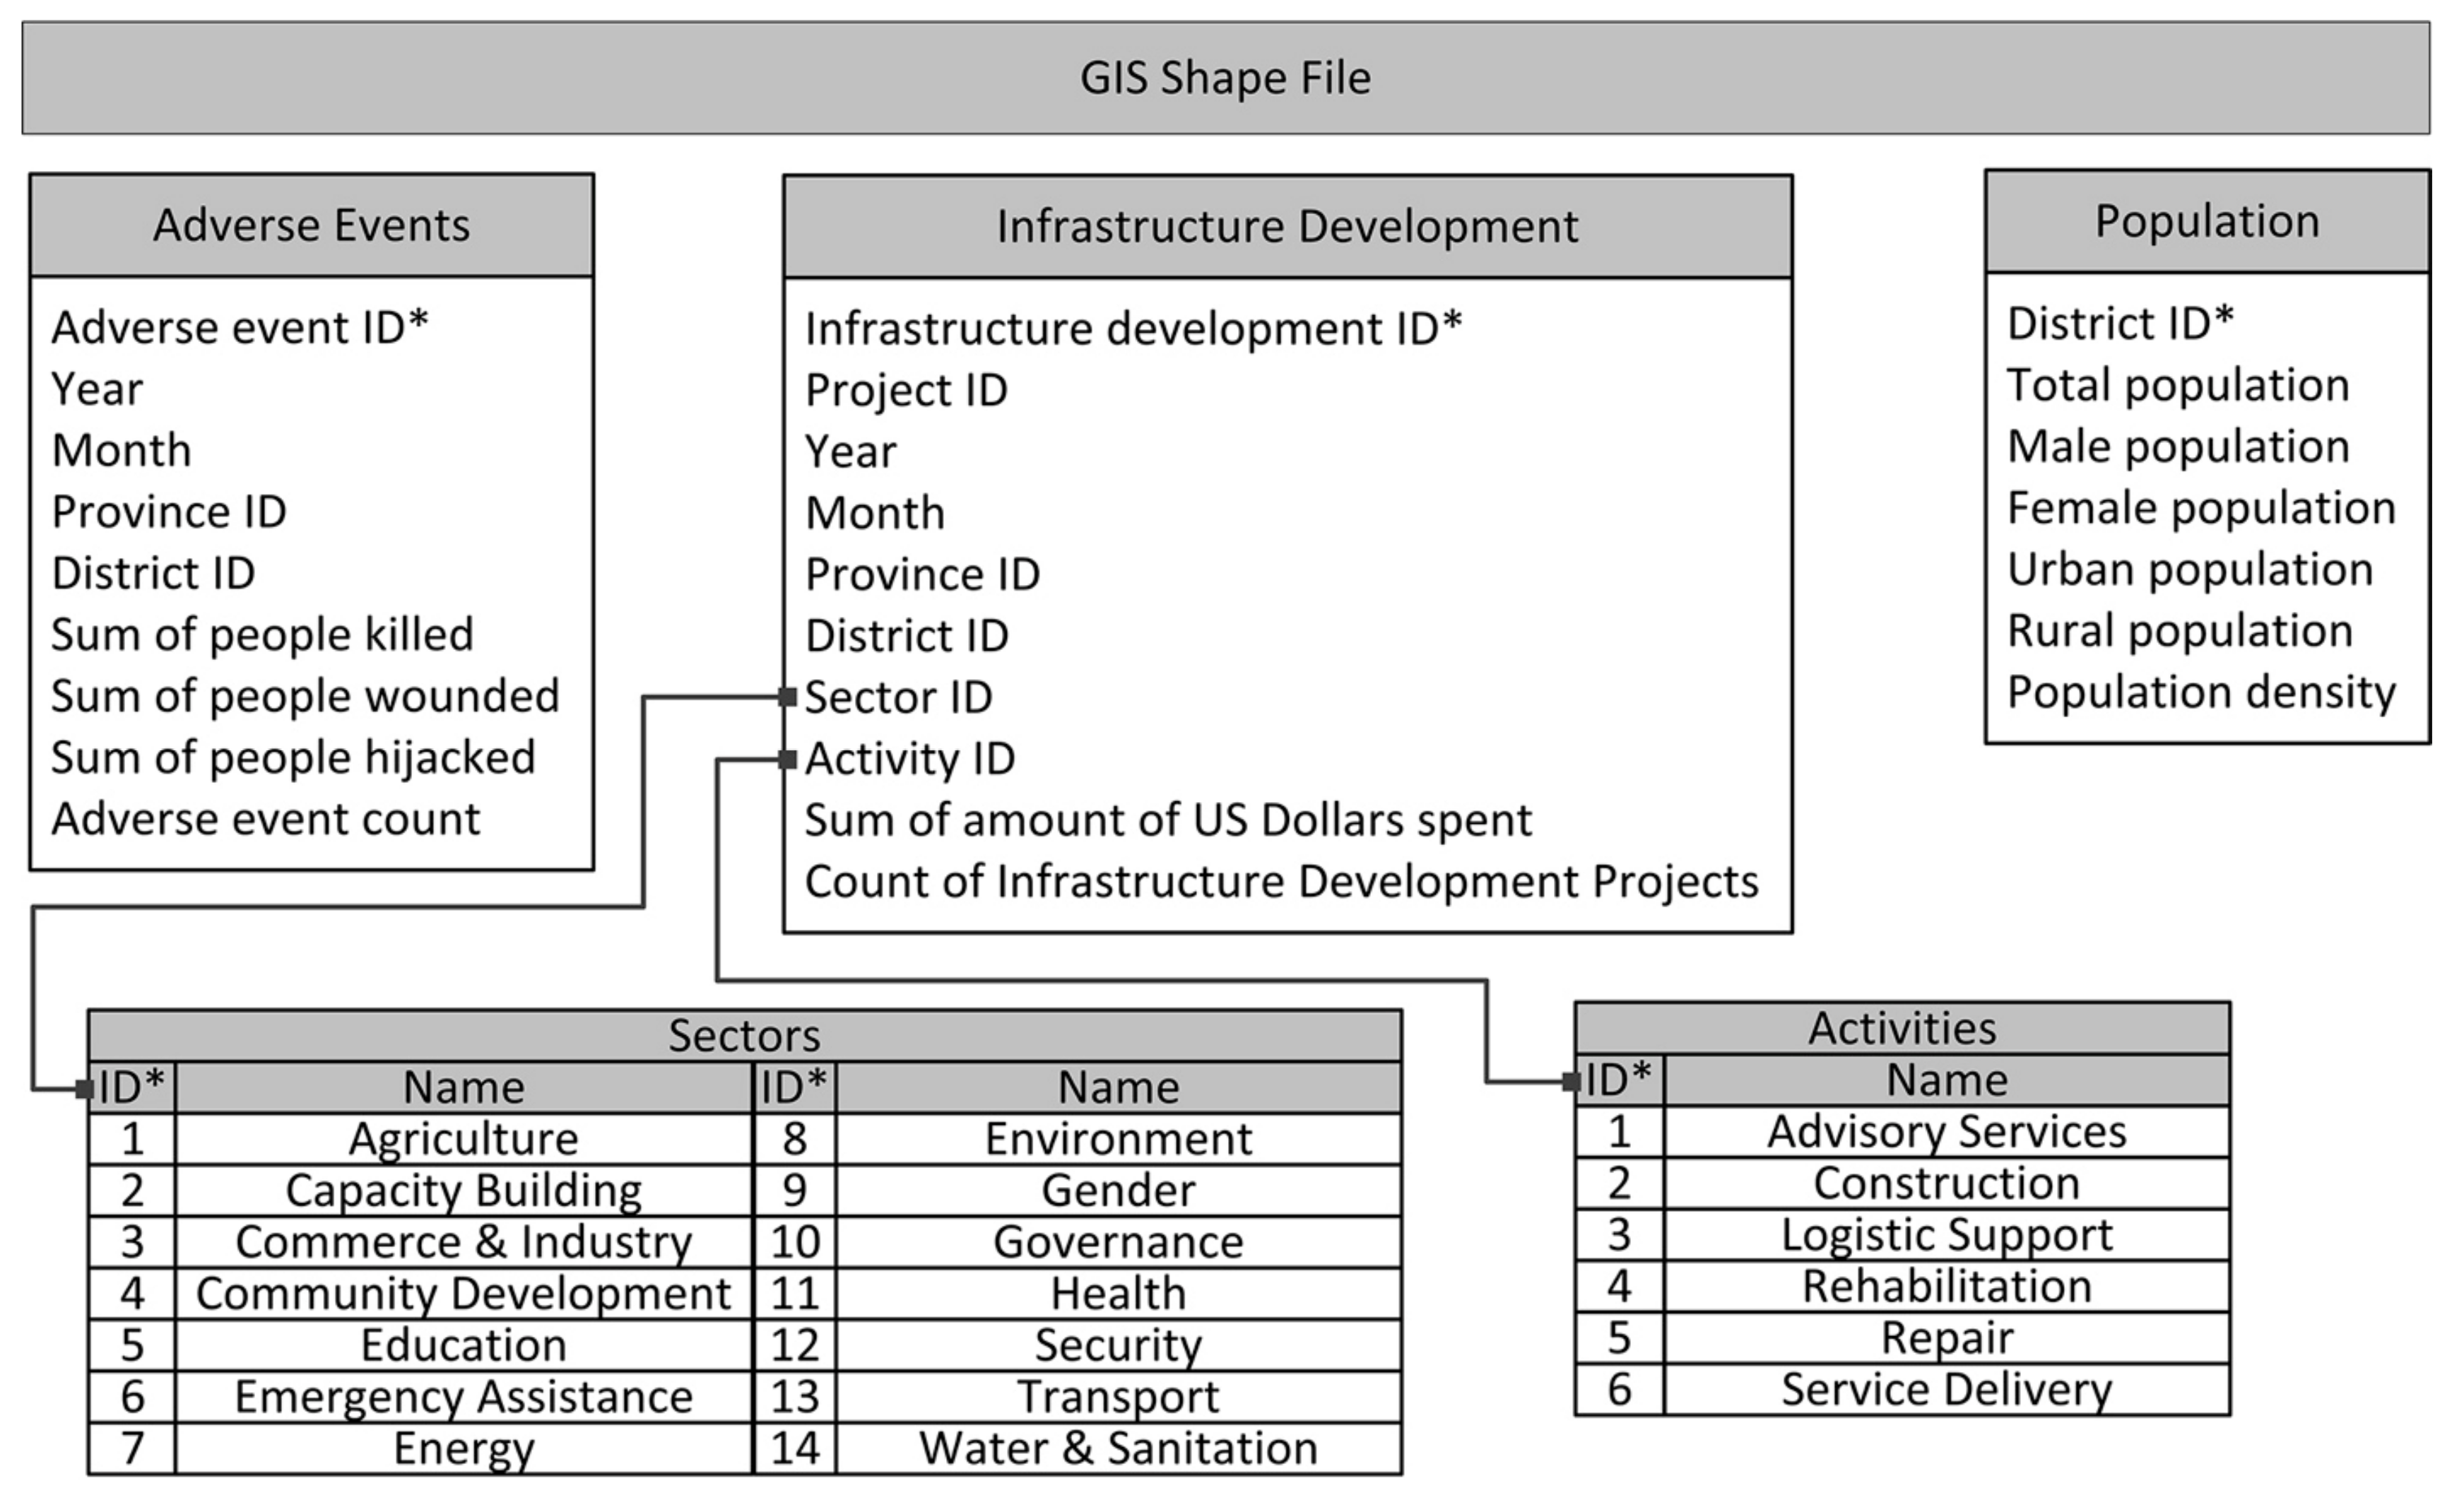
Datasets in both categories contained time and geographical location. The structure of the data and the GIS shape files enabled us to collate different layers of data within a spatial database, which allowed us to obtain information regarding neighboring districts for utilization in the CA model.
Figure 3 illustrates the spatial database populated for use in this study. The database grouped infrastructure development projects and adverse events in a monthly fashion. Infrastructure development project data branched into 14 sectors, and each sector branched into 6 activities, totaling 84 variables for a single period for a certain district. As such, a project on “education” could be conducted in more than one district within different activity types, such as “construction” and “advisory service.” We also added population data to the database to study the effects of regional demographics.
3.3. Neighborhood Definition
The common social science applications of CA use a rectangular grid, such as Moore or von Neumann neighborhoods, as the underlying network structure [
38]. Such applications have regular grid structures in which every cell has the same number of neighbors. Unfortunately, Afghanistan’s 400 districts, with numerous neighbors, preclude the use of a regular grid structure [
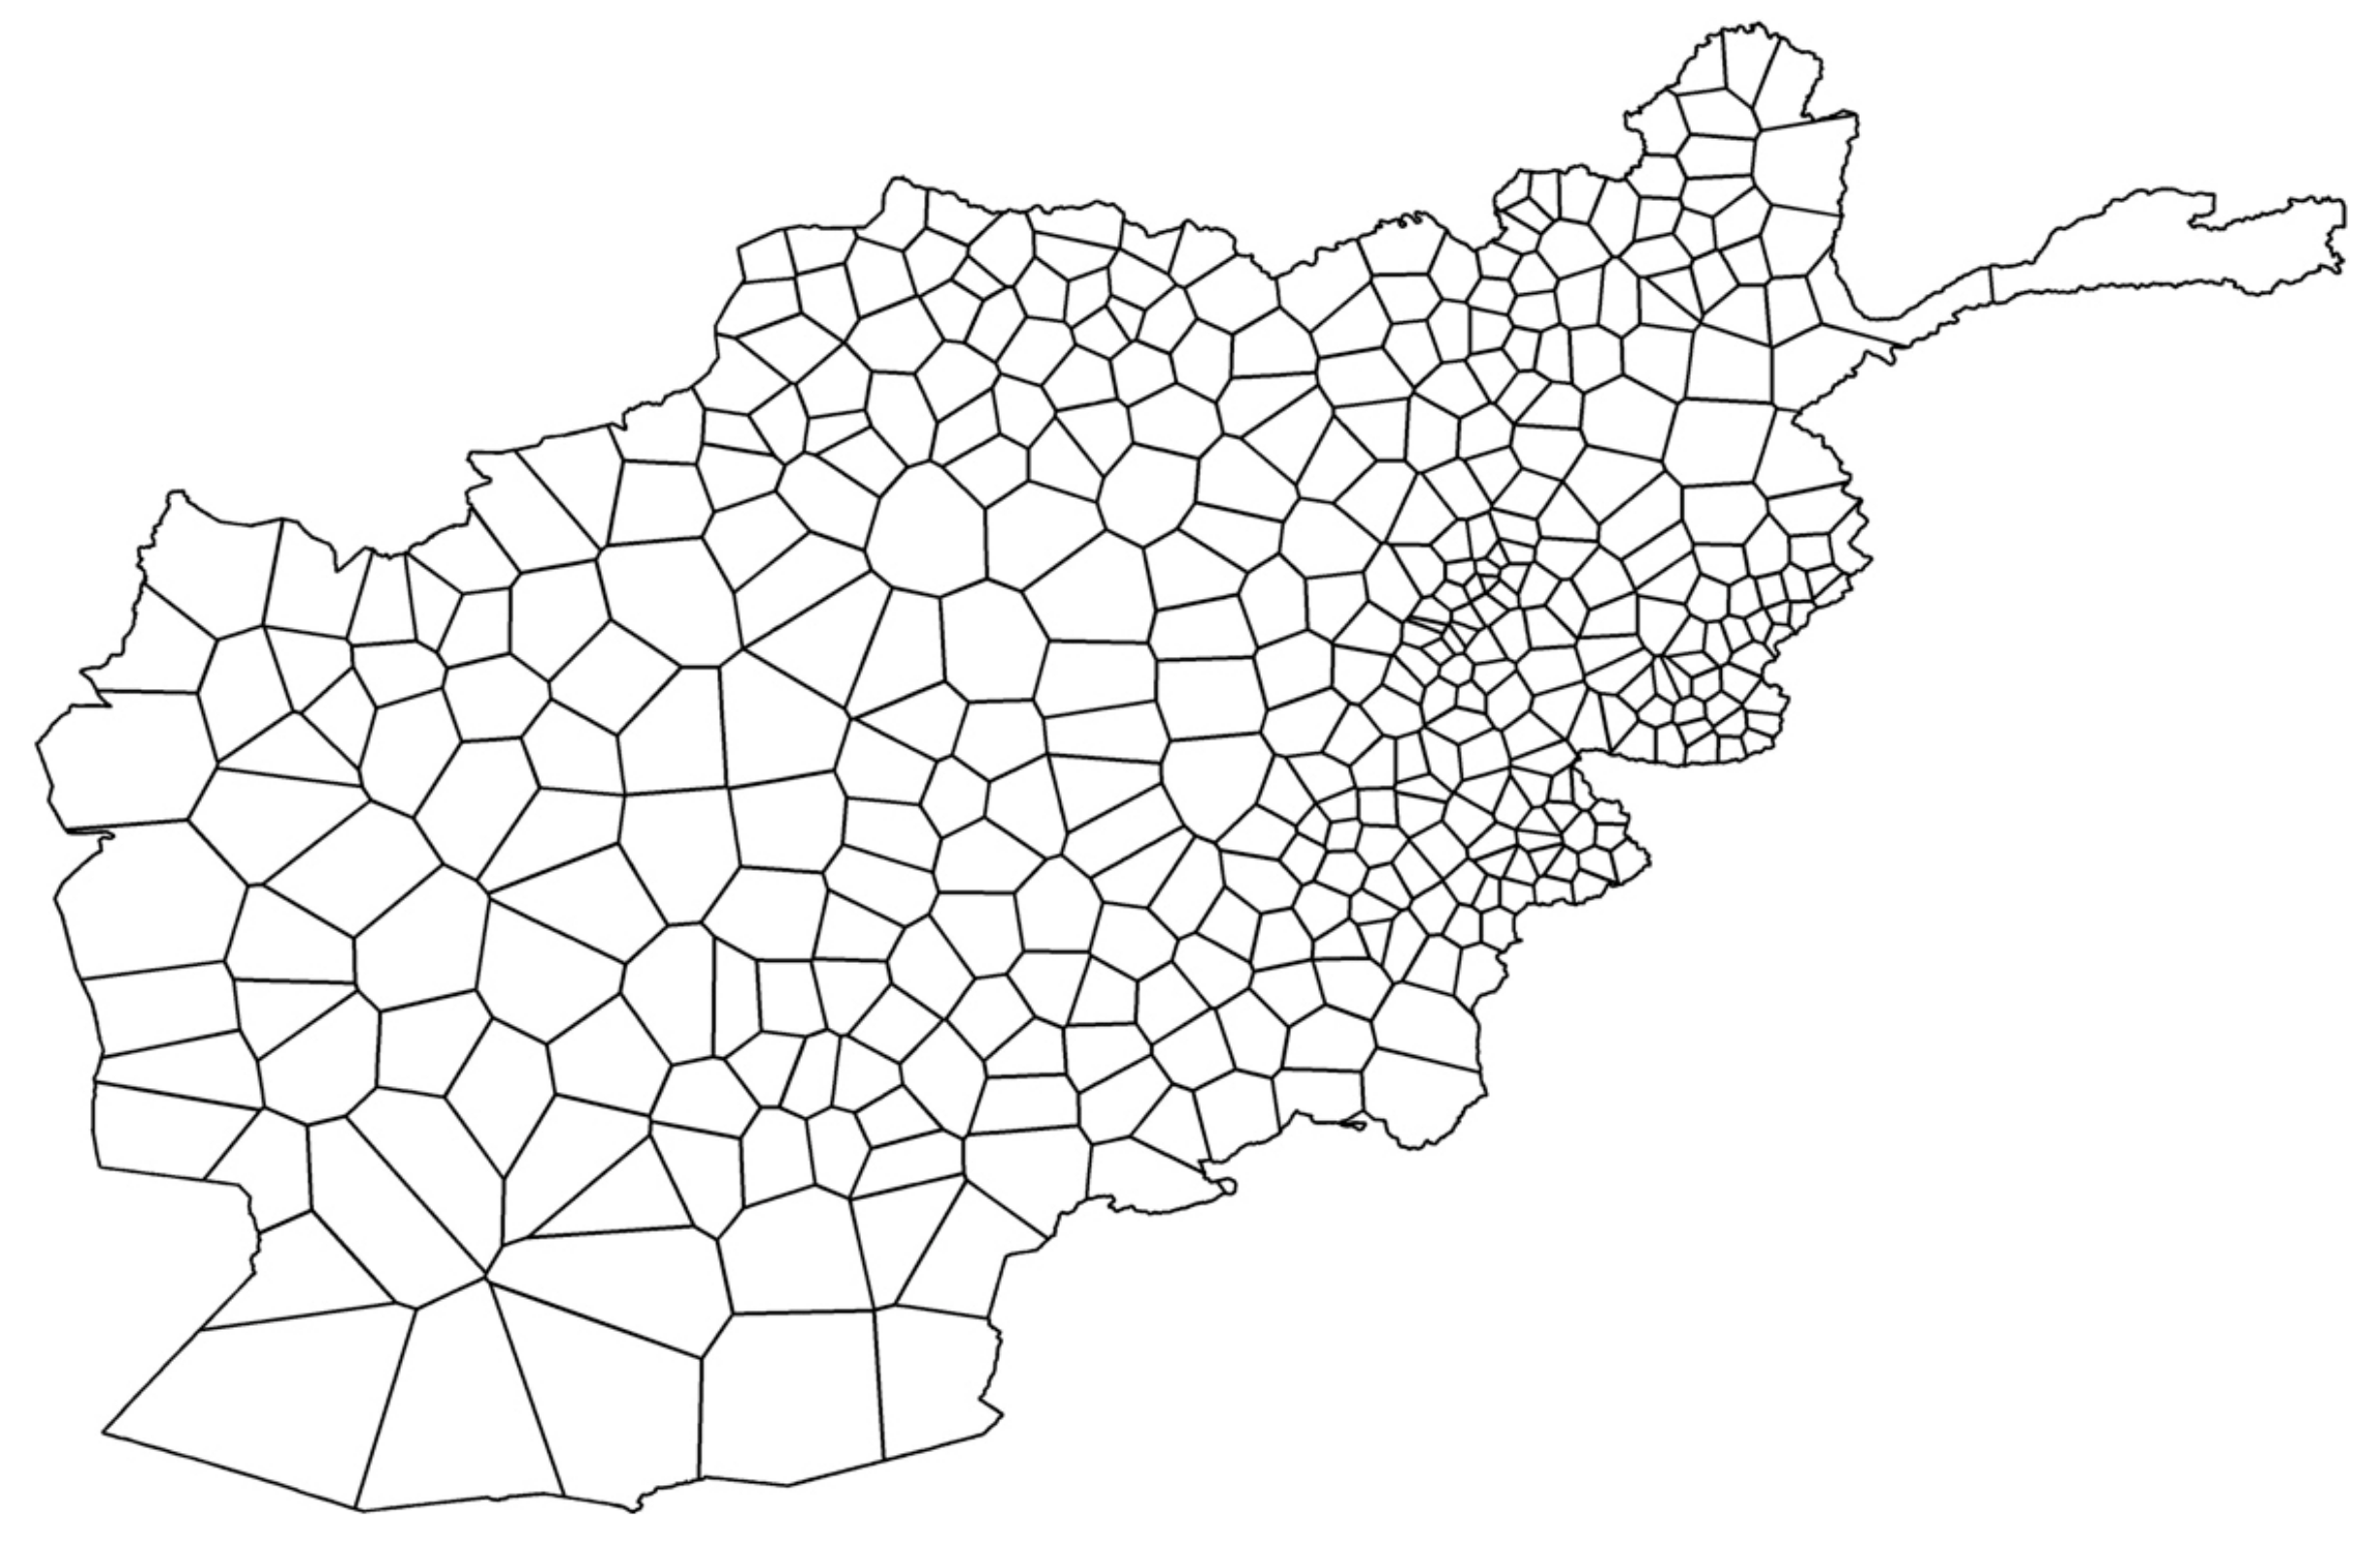
39]. To overcome this limitation, we generated an irregular CA neighborhood by using the ArcGIS geostatistical analyses tool.
Figure 4 represents a Voronoi diagram generated using ArcGIS to represent each neighborhood visually as
d, defined as a set of any first-order neighbors having a common border with the center district
d. Each cell in the Voronoi diagram represents one district. To improve visual analysis, the size and location of the Voronoi cells was held to be similar to that of the political map of Afghanistan.
3.4. State of Cells
The state of a cell,
defined as a row vector of size 178, represented the state of a district
at time
. Eighty-four elements of
were the sum of the U.S. dollars spent,
, whereas the remaining 84 constituted the count of infrastructure development projects implemented,
, where
s denotes each sector and activity type of the infrastructure development data. Five elements denoted the population number,
, where
represented the total population, male and female, for urban- and rural-area populations. Population density
was represented as its own element. Finally, four elements were employed to designate adverse events measures,
. This model involved
a = k,w,h,and c adverse event measures; i.e., the number of individuals killed, wounded, and hijacked, and the number of adverse events, respectively (Equation (1)).
3.5. Transition Rules
Transition rule describes the rules of change for each cell from its current state at time t to its next state at time . Transition rule has 3 main inputs: The transition state for the time at which prediction will occur and the state and adverse event ratio matrices T and R of the historical data. The transition rule searches through the state matrix T and identifies the most similar event(s) and conditions to . The rule then uses weighted Euclidean distances to measure similarity. After identifying the most similar event(s), the ratio of change of the adverse events in a cell is determined by using an adverse event ratio matrix R. The development of the required inputs and the transition rule are described below.
3.5.1. Transition State
We defined the states of neighboring cells,
, as the sum of each neighbor’s cell state for the centering cell
, except for the cell state of population density, which is defined as:
The transition state,
, is a row vector of size 357 that represents the macro and micro-level states of district
at time
. Two elements,
, represent the year and month of the data sampled, and the other 355 elements denote the state of the center cell,
, and the state of the neighboring cells,
, according to:
3.5.2. Adverse Event Change Ratio
We defined micro-level changes in the adverse event as the ratio of change from time
to
for adverse event measures,
, including all measures (
a = k,w,h,and c) for district
at time
:
Tis the state matrix including
for all historical data, where
is the district and
is the time of data sampling. Ris the matrix including adverse event rates for each
in T. T represents the macro- and micro-level states that support CA rules to generate predictions with the use of the corresponding R:
3.5.3. Weighted Euclidean Distance
The weight of the Euclidean distance,
, defined as a row vector of size 357, represents the weight of the impact of each variable on the adverse events at time
. Two elements of
are the weight of the impact for a given time,
, while another 168 elements constitute the weight of the impact of the total U.S. dollars spent and the total count of infrastructure development implemented at the centering cell,
. Six elements denote the weight of the impact of the population for the centering cell,
; four elements are the weight of the impact of the number killed, wounded, and hijacked and the total event count, given as
,
,
, and
, respectively. The weight of the impact of the total U.S. dollars spent and the total count of infrastructure development projects implemented are represented by 168 elements at the neighboring cells,
; five elements are the weight of the impact of the population of the neighboring cells,
; and four elements are designated to the weight of the impact of the number of people killed, wounded, and hijacked and the total event count at the neighboring cells,
,
,
, and
, respectively, giving:
Next, let
be the transition state for the time at which the prediction will occur for district d and time t to find the most similar
among the matrix T and to determine the ratio of change in the adverse events,
. Two steps are involved in the decision-making process: Selecting the conforming
and determining the ratio of change,
. In Step 1, the weighted Euclidean distances,
, are calculated between
and
, which are rows of T.
is the standard deviation of the columns of T:
To determine the ratio of change in adverse events, values of are selected with minimum Euclidean distances. In the case of more than one minimum, the most similar historical data that occurred in the same province and district as the scenario data are selected (Steps 1 and 2). If more than one minimum remains, then the scenario and historical data months are checked; if one of the months corresponds to a Holy month in the Islamic calendar, then that month is selected (Step 3). Otherwise, the ratio of change is calculated as the mean of the selected rate of change.
with the minimum that have the same province as ;
with the same district as ;
with either the Islamic months of 9 or 12 (Ramadan and Dhul-Hijjah, respectively);
Calculate the ratio of change in adverse events, , for all a=k, w, h, and c as the mean of in .
Transition rule
is defined as the change of adverse events with a ratio of
:
3.6. Weight of Impact Calculation
The sensitivity analysis of the data showed that the effect of each input on the output varies in degree. Therefore, we postulated that implementing and optimizing the weighing factors to the elements of the transition states should improve the CA model’s performance. Assuming that each element of the transition state has a different level of impact on the output, we computed all of the inner products of the weight vector with all of the other training and scenario vectors. To determine the weights that result in the most accurate model output in each time step, we also constructed the model to prevent non-iterative prediction updating.
We calculated the weights of impact for each district and each input variable to identify the drivers of the model. Due to long computation times, we reduced the number of elements of the weight of impact vectors and the number of values that each element could accept. Then, we calculated a total of 8 weights (6561 runs of the model) and assigned 6 of these weights as the weights of the centering cells, which we limited to three levels: 0.1, 0.4, and 0.9. These six weights represent an average impact of the total funds spent (expressed in U.S. dollars) and the amount of infrastructure development at the centering district, , the population of the centering district, , and the total number of individuals killed, wounded, and hijacked, and the total event count, and , respectively. We clustered the weights of neighboring cells into two groups: (1) The total funds spent for infrastructure development and count of infrastructure development projects in the neighboring district, , and total population of the neighboring district, ; and (2) the total number of individuals killed, wounded, and hijacked, and the total number of adverse events occurring in the neighboring districts, , , and , respectively. Then, we assigned a divider to each group to calculate the weights of the neighboring districts as a function of the centering district. This function is the centering cell average divided by the denominator; e.g., if the divisors for groups one and two are and , respectively, then , and either or . We limited the possible values of these two divisors to 1, 2, and 3.
We calculated the weight of impact by testing every combination of the elements of the weight vectors for 2009 and measuring the performance of each run by the mean absolute error. We input infrastructure development and adverse event data from January 2005 to November 2008 and population data for the 400 Afghanistan districts to train the model. We input data from December 2008 to November 2009 as the scenario data.
Table 1 shows the calculation results for the weights of impact for the centering district. We interpreted the weights as the impact of the infrastructure development projects and adverse events occurring in a district at time
on the prediction of adverse events, such as the number of individuals killed, wounded, and hijacked, that would occur at time
. We considered the impact weight to be high if the values were greater than 0.65, medium if the values were between 0.64 and 0.20, and low for all remaining values.
Table 1 shows that the number of individuals killed, wounded, and hijacked at time
has a significant impact on the adverse events that would occur in the same categories at time
. In addition, we note that the number of wounded individuals at time
significantly affects the prediction of the number of hijacked individuals at time
. The sum and count of infrastructure development, the total number of wounded, and the count of adverse events in a district at time
have a moderate impact on the prediction results of the total number killed at time
. Finally, we observed that the population of a district significantly impacts the total number of adverse events that would occur at time
.
Table 2 lists the calculation results for the weight of the impact for the neighboring districts. We interpret these weights as the impact of the infrastructure development projects and adverse events that occurred in the neighboring districts at time
on the prediction of adverse events that would occur at time
in the centering district. We observe that the number of individuals killed, wounded, and hijacked in the neighbors of a district at time
have a medium impact on the adverse events that would occur in the same categories at time
in the center district. The number of individuals killed at time
was moderately affected by the number of wounded people, the sum and count of infrastructure development, and the total amount of adverse events that occurred in the neighboring districts at time
. Finally, we observed that the number of wounded and the amount of population in the neighboring districts at time
had a moderate impact on the prediction of the number of hijacked individuals at time
.
4. Results and Discussion
This paper developed a CA model for testing against observed adverse events based on monthly data from January to December 2010 in Afghanistan. Infrastructure development, adverse event data from January 2005 to November 2009 for 400 Afghanistan districts, and 2008 population data were used as the inputs to train the model.
The model’s performance was measured based on the average performance and accuracy using the mean absolute error (MAE) and root mean square error (RMSE). Each of these measures expresses the average model prediction error in the unit of adverse events. Among the two models, MAE is the most natural measure of average error [
40].
The final CA model showed the highest average model performance among the variations of models generated and analyzed, such as (1) a model using standardized Euclidean distances and (2) a model using weighted Euclidean distances.
Table 3 shows the average model performance of these two variations. The highest increase observed for RMSE was the number of wounded individuals. High values of RMSE pointed to large errors in the predictions. From the study results, we concluded that implanting the weight of impact into the CA model increased its average model performance.
Model accuracy was measured by the percentage of adverse event data correctly predicted in terms of location, time, and impact in 2010. The three different success rates measured included (1) the exact success rate or the rate of correct forecasts over all forecasts that were made; (2) the one-away success rate, or the rate of correct forecasts with the error margin of one over all forecasts that were made; and (3) the three-away success rate, or the rate of correct forecasts with an error margin of three over all forecasts that were made.
Table 4 shows the percentage of the successful prediction rates of the CA model with weighted Euclidean distances for 2010. Predictions of the total number of hijacked individuals resulted in 93.29 percent of the exact prediction. Predictions of the number of killed and wounded individuals resulted in more than 80 percent of the exact prediction. When the error margin of the success rate increased, correct predictions of the number of killed, wounded, and hijacked individuals resulted in more than 90 percent of all predictions. It was also observed that the number of hijacked individuals was more than 97 percent with an error margin of three.
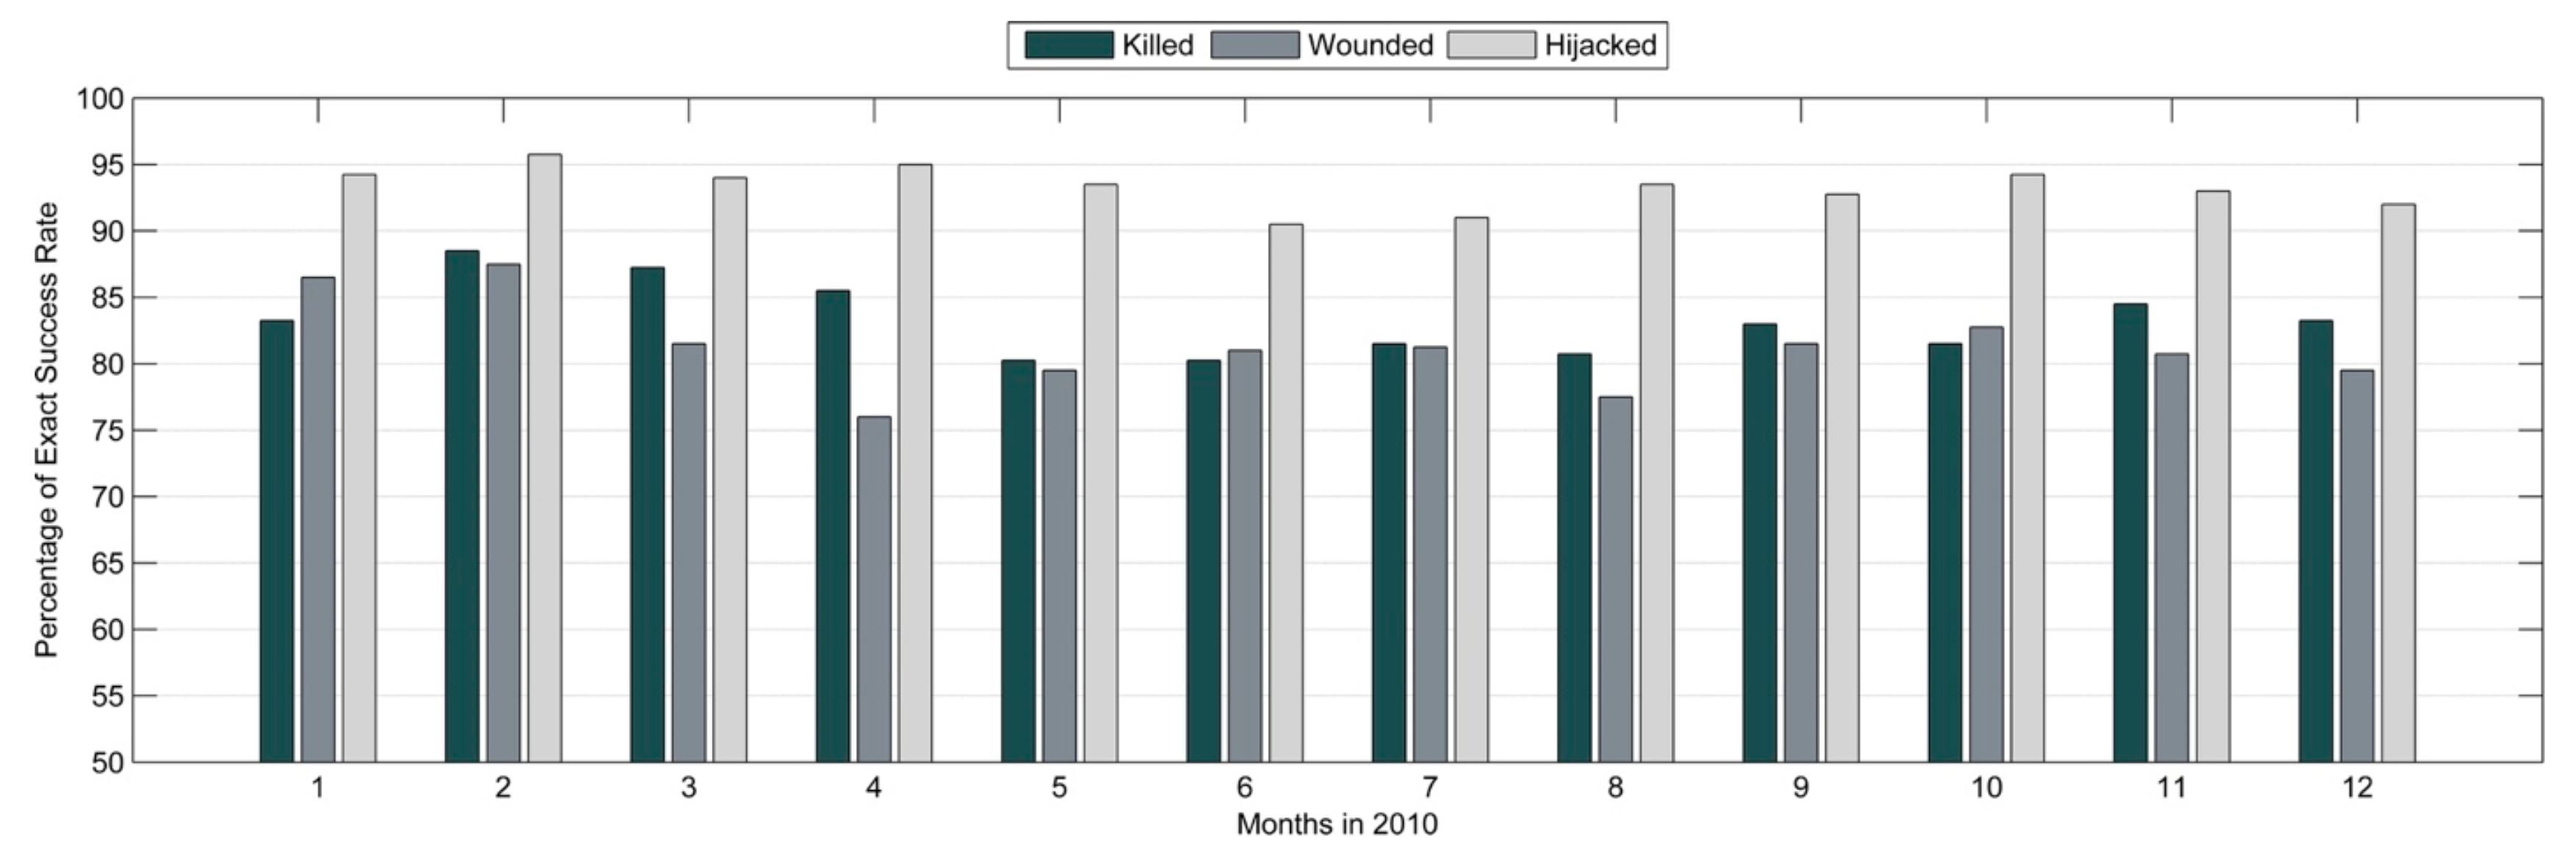
The distribution of the percentages of the exact success rates for each month is shown in
Figure 5, which indicates that the exact success rate for hijacked individuals was close to 95 percent in February, April, and October, whereas the exact success rate for killed individuals was greater than 85 percent in February, March, April, and November. The prevalence of exact success rates for killed, wounded, and hijacked individuals showed similar trends. Intuitively, with further iterations, this CA model should be able to predict the number of killed, wounded, and hijacked individuals with similar accuracy.
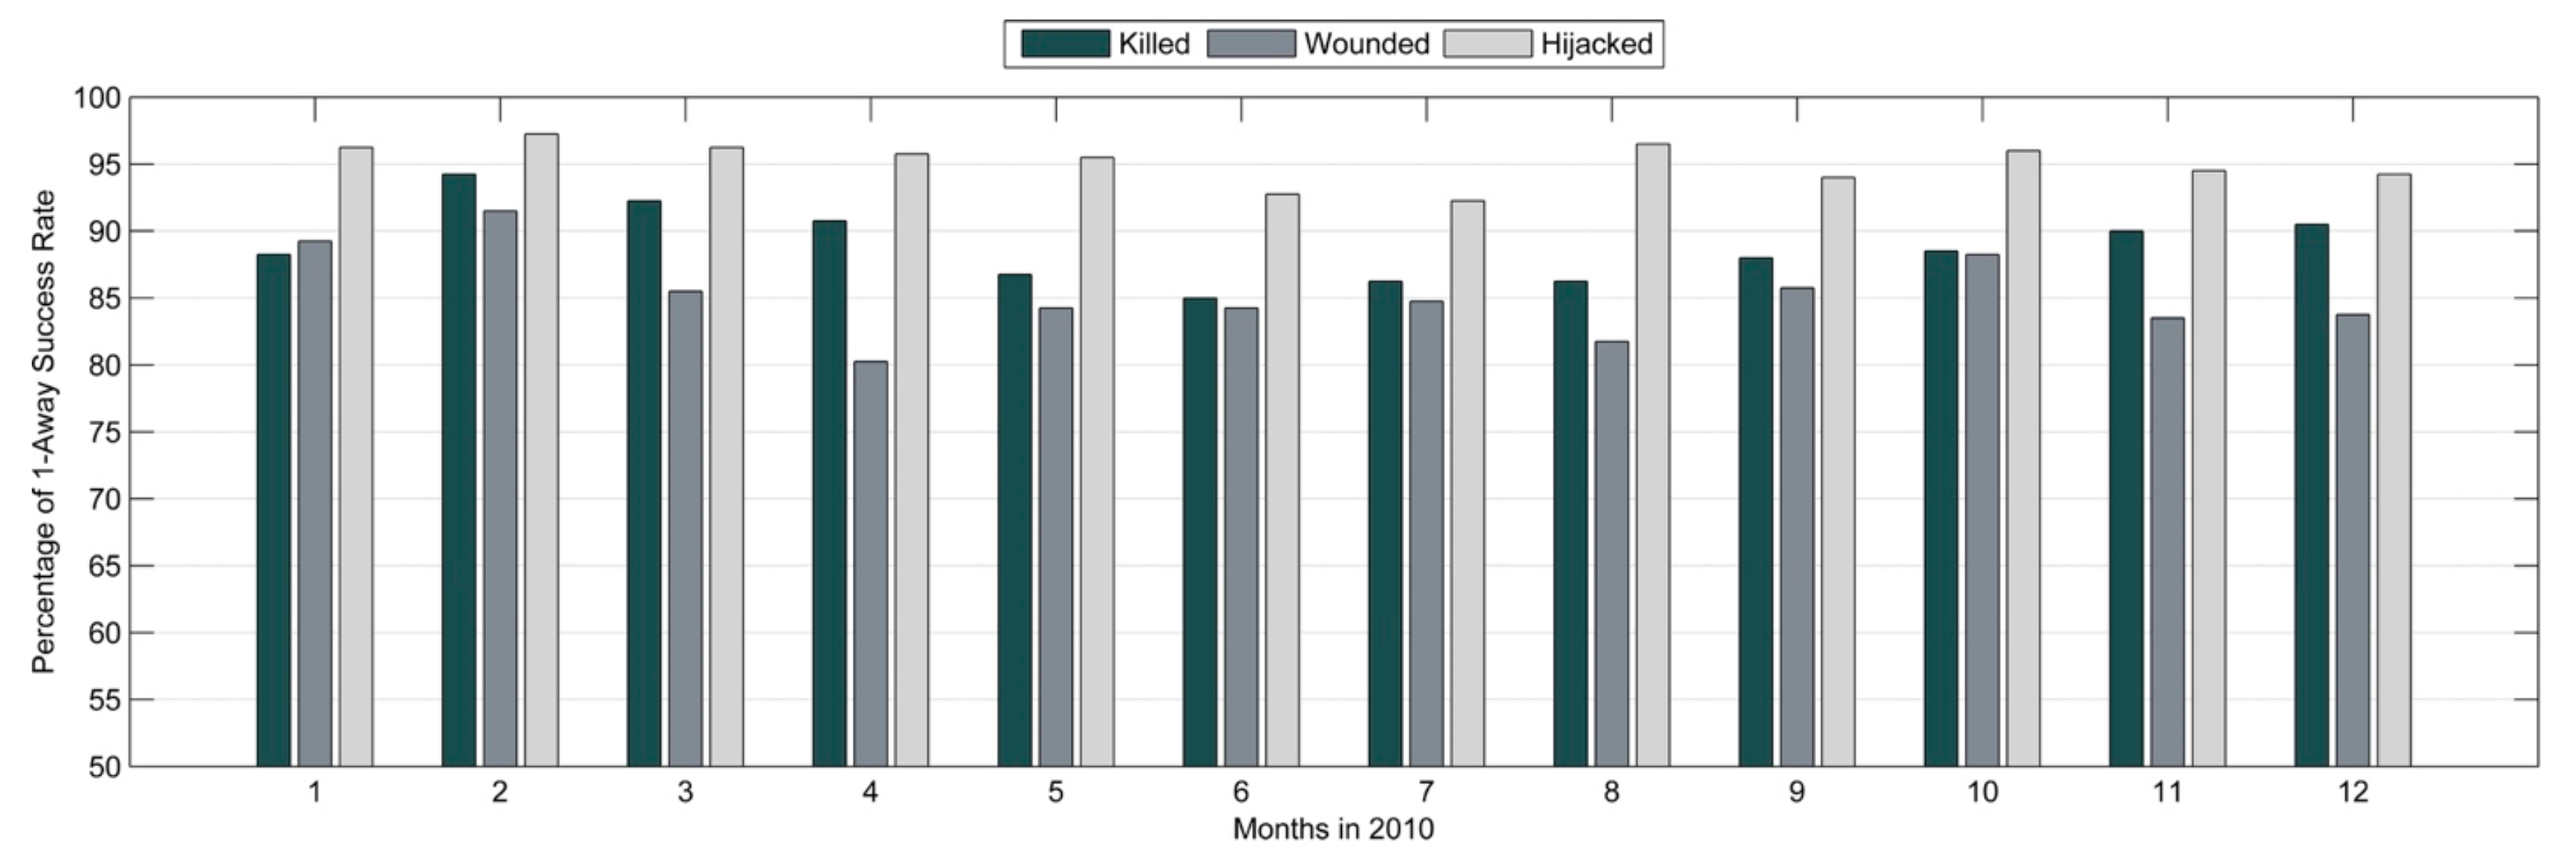
According to
Figure 6, which shows the distribution of 1-away success rates for each month, when the error margin of the number of people affected by an adverse event was increased by 1, the success rate of the prediction of the number of hijacked individuals increased to more than 95 percent for most months. For the number of individuals killed, the success rate was greater than 85 percent for every month.
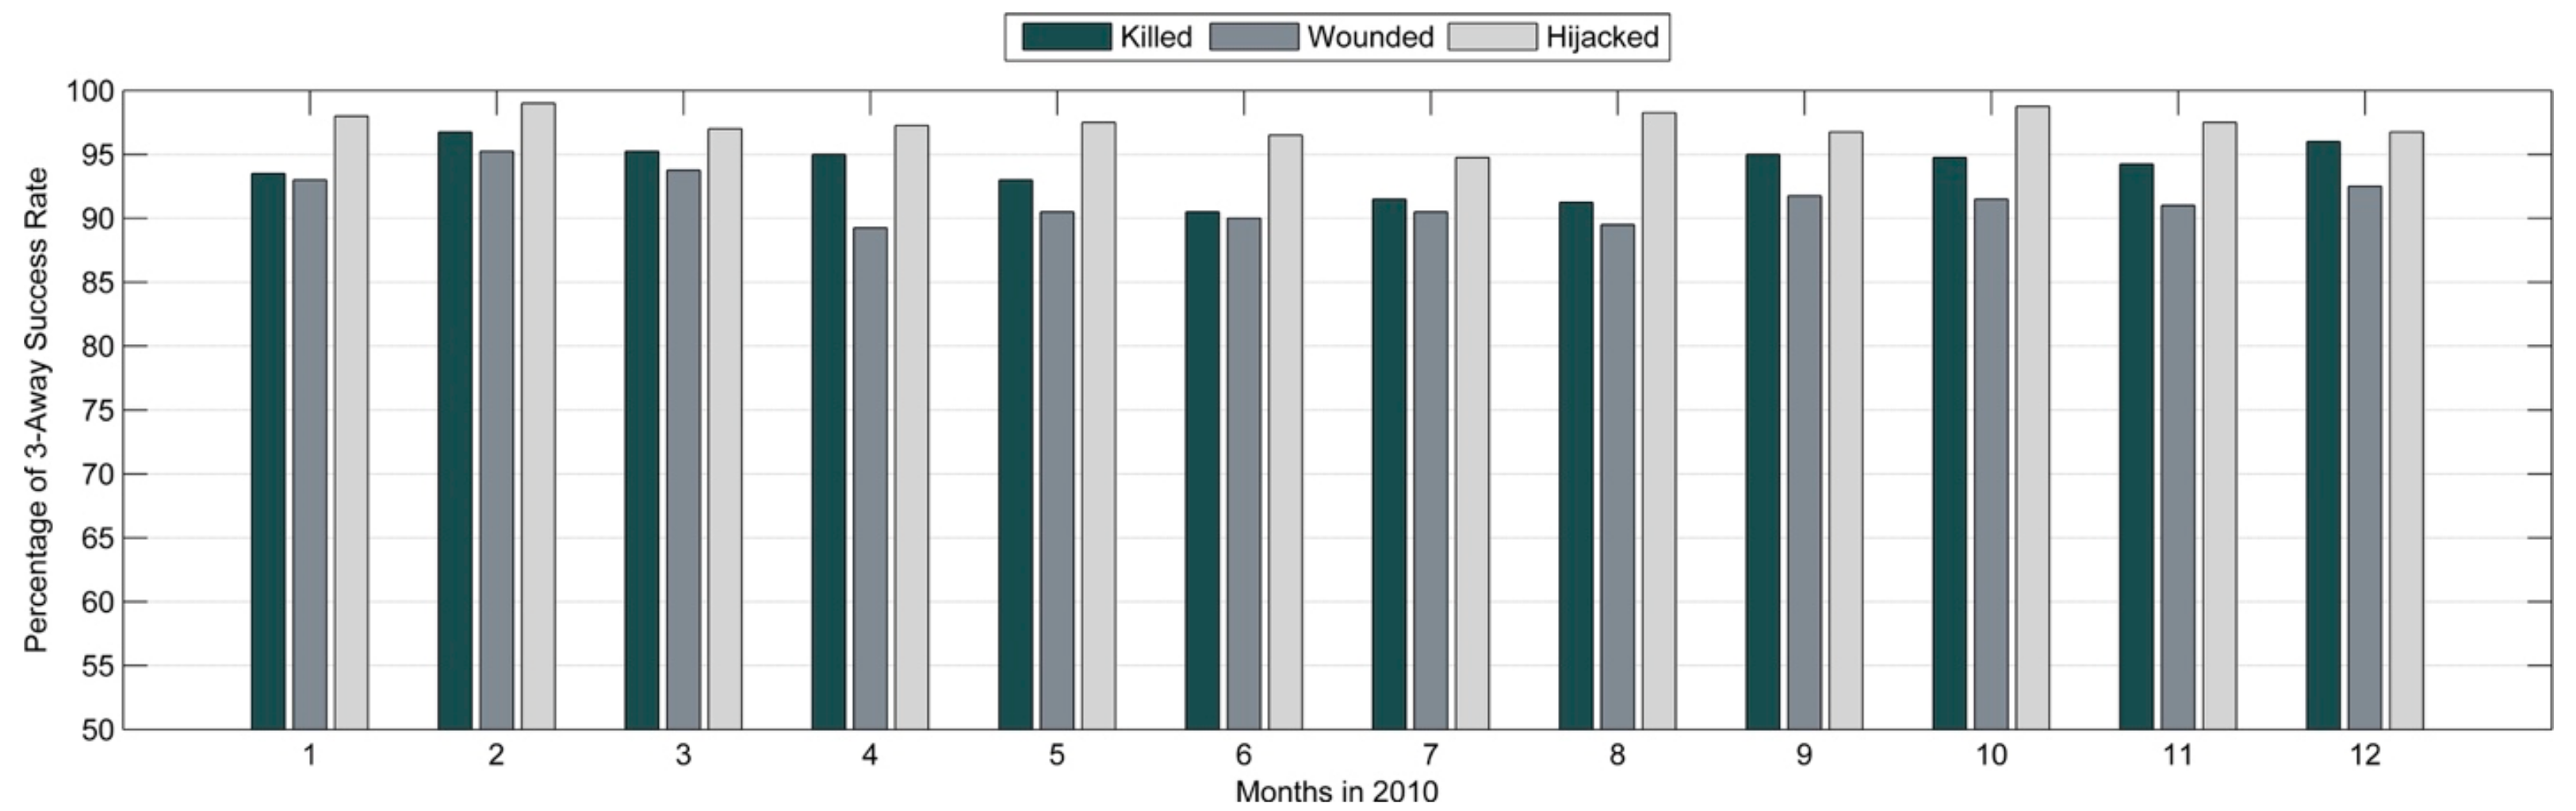
The distribution of the three-away success rates for each month is shown in
Figure 7, which indicates that when the error margin of the number of people affected by an adverse event was increased by three, the success rate of the number of hijacked individuals was 98 percent accurate for most months and for the number killed, was greater than 90 percent for every month. Moreover, the success rate for the number killed was within an accuracy of 95 percent for six months, and for the number wounded, the accuracy was greater than 90 percent for every month. The prevalence of the three-away prediction accuracies with similar trends increased the confidence of the model accuracy for further iterations to predict the number of killed, wounded, and hijacked.
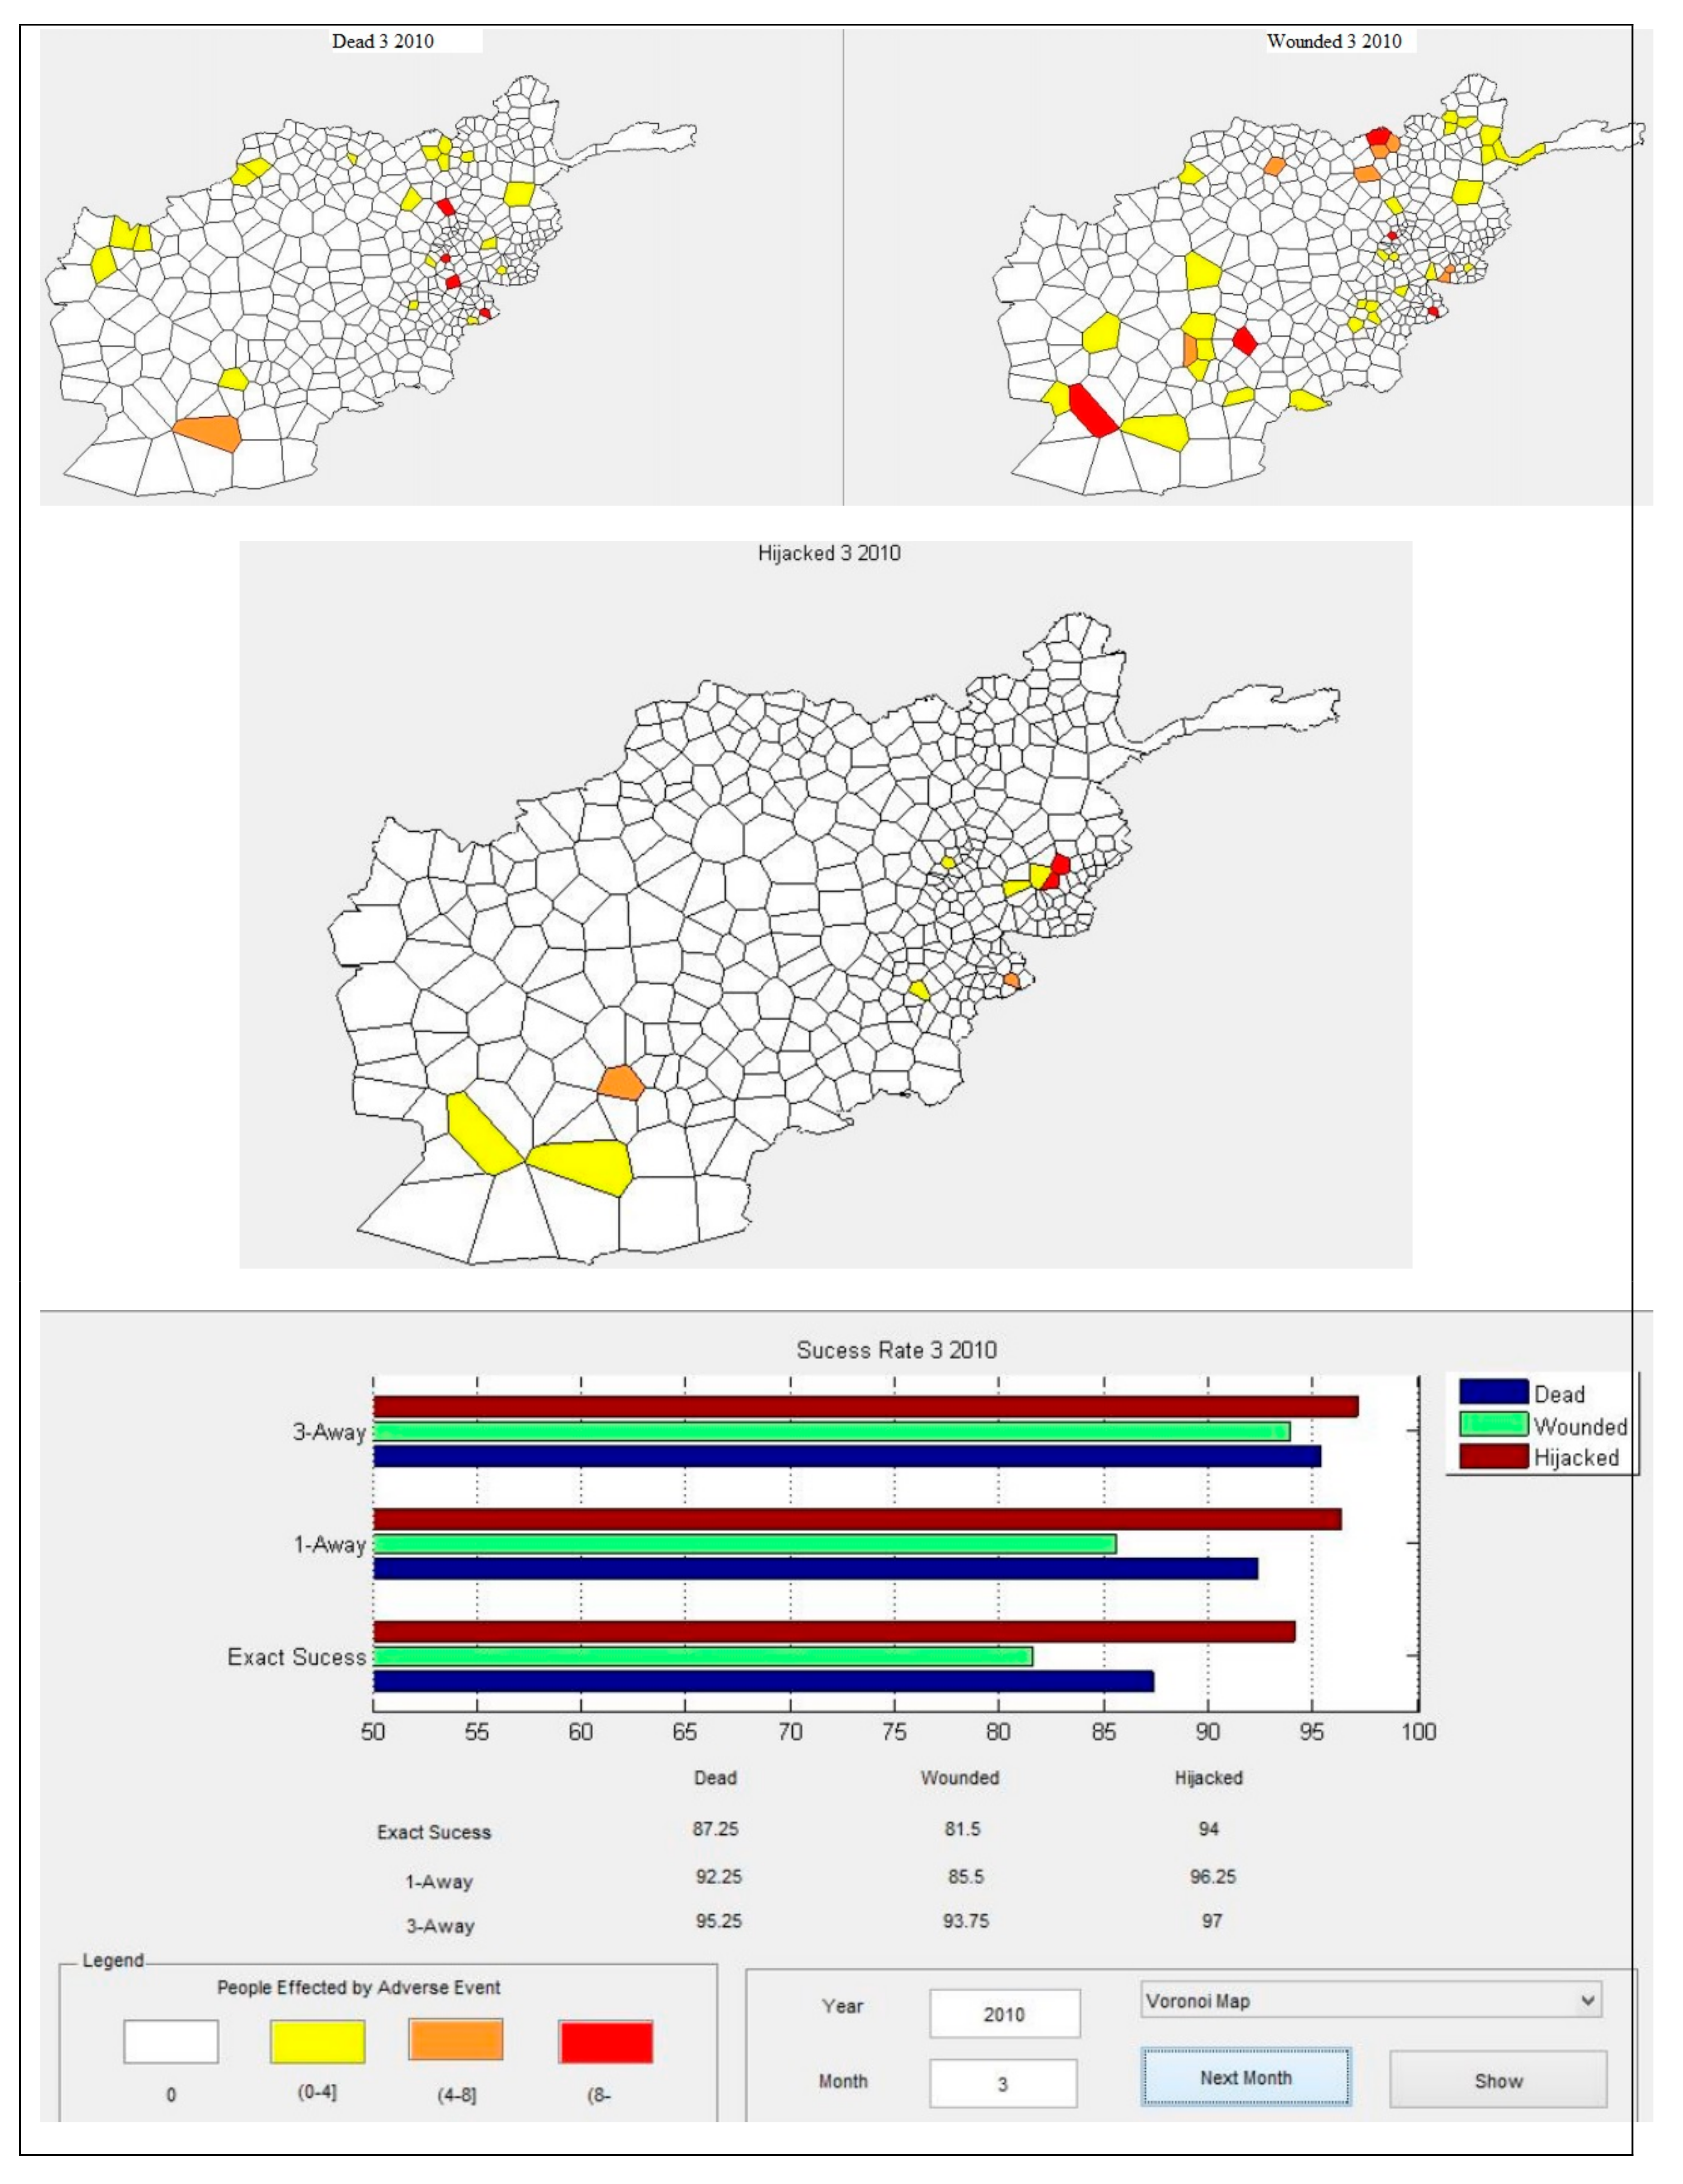
Figure 8 displays the predicted data for March 2010 by location, time, and impact of the adverse events likely to occur. The map legend represents the range of the number of people affected for each adverse event measure. In the upper-left corner is a Voronoi diagram of the districts where people were killed; in the upper-right corner is a Voronoi diagram of the districts where people were wounded; in the lower-left corner is a Voronoi diagram of the districts where people were hijacked. The lower-right corner includes a bar chart and table of the exact one-away, and three-away prediction success rates. The districts in white indicate predictions with no adverse events; the districts in yellow indicate predictions resulting in zero to four people affected by an adverse event; the districts in orange indicate predictions resulting in four to eight people affected; and the districts in red indicate predictions resulting in more than eight people affected.
More than 85 percent of predictions were exactly correct regarding the number of people killed and the location. The districts where the model failed to correctly predict the number killed were the first-or second-order neighbors of the districts where the model correctly predicted the number of killed. Most of the districts for which the model failed to correctly predict the number killed were also located in the provinces where killed individuals were predicted. Similar to the killed people data, most of the incorrect predictions of the number wounded were located at the neighboring cells of the correct predictions. The killed and wounded individual data showed a similar pattern of distribution among CA neighborhoods. The Voronoi diagram of the predicted number of hijacked individuals was correctly predicted at 94 percent. The predictions showed that the developed model was capable of predicting the path, possible location, and impact of the observed adverse events.
4.1. Model Capability
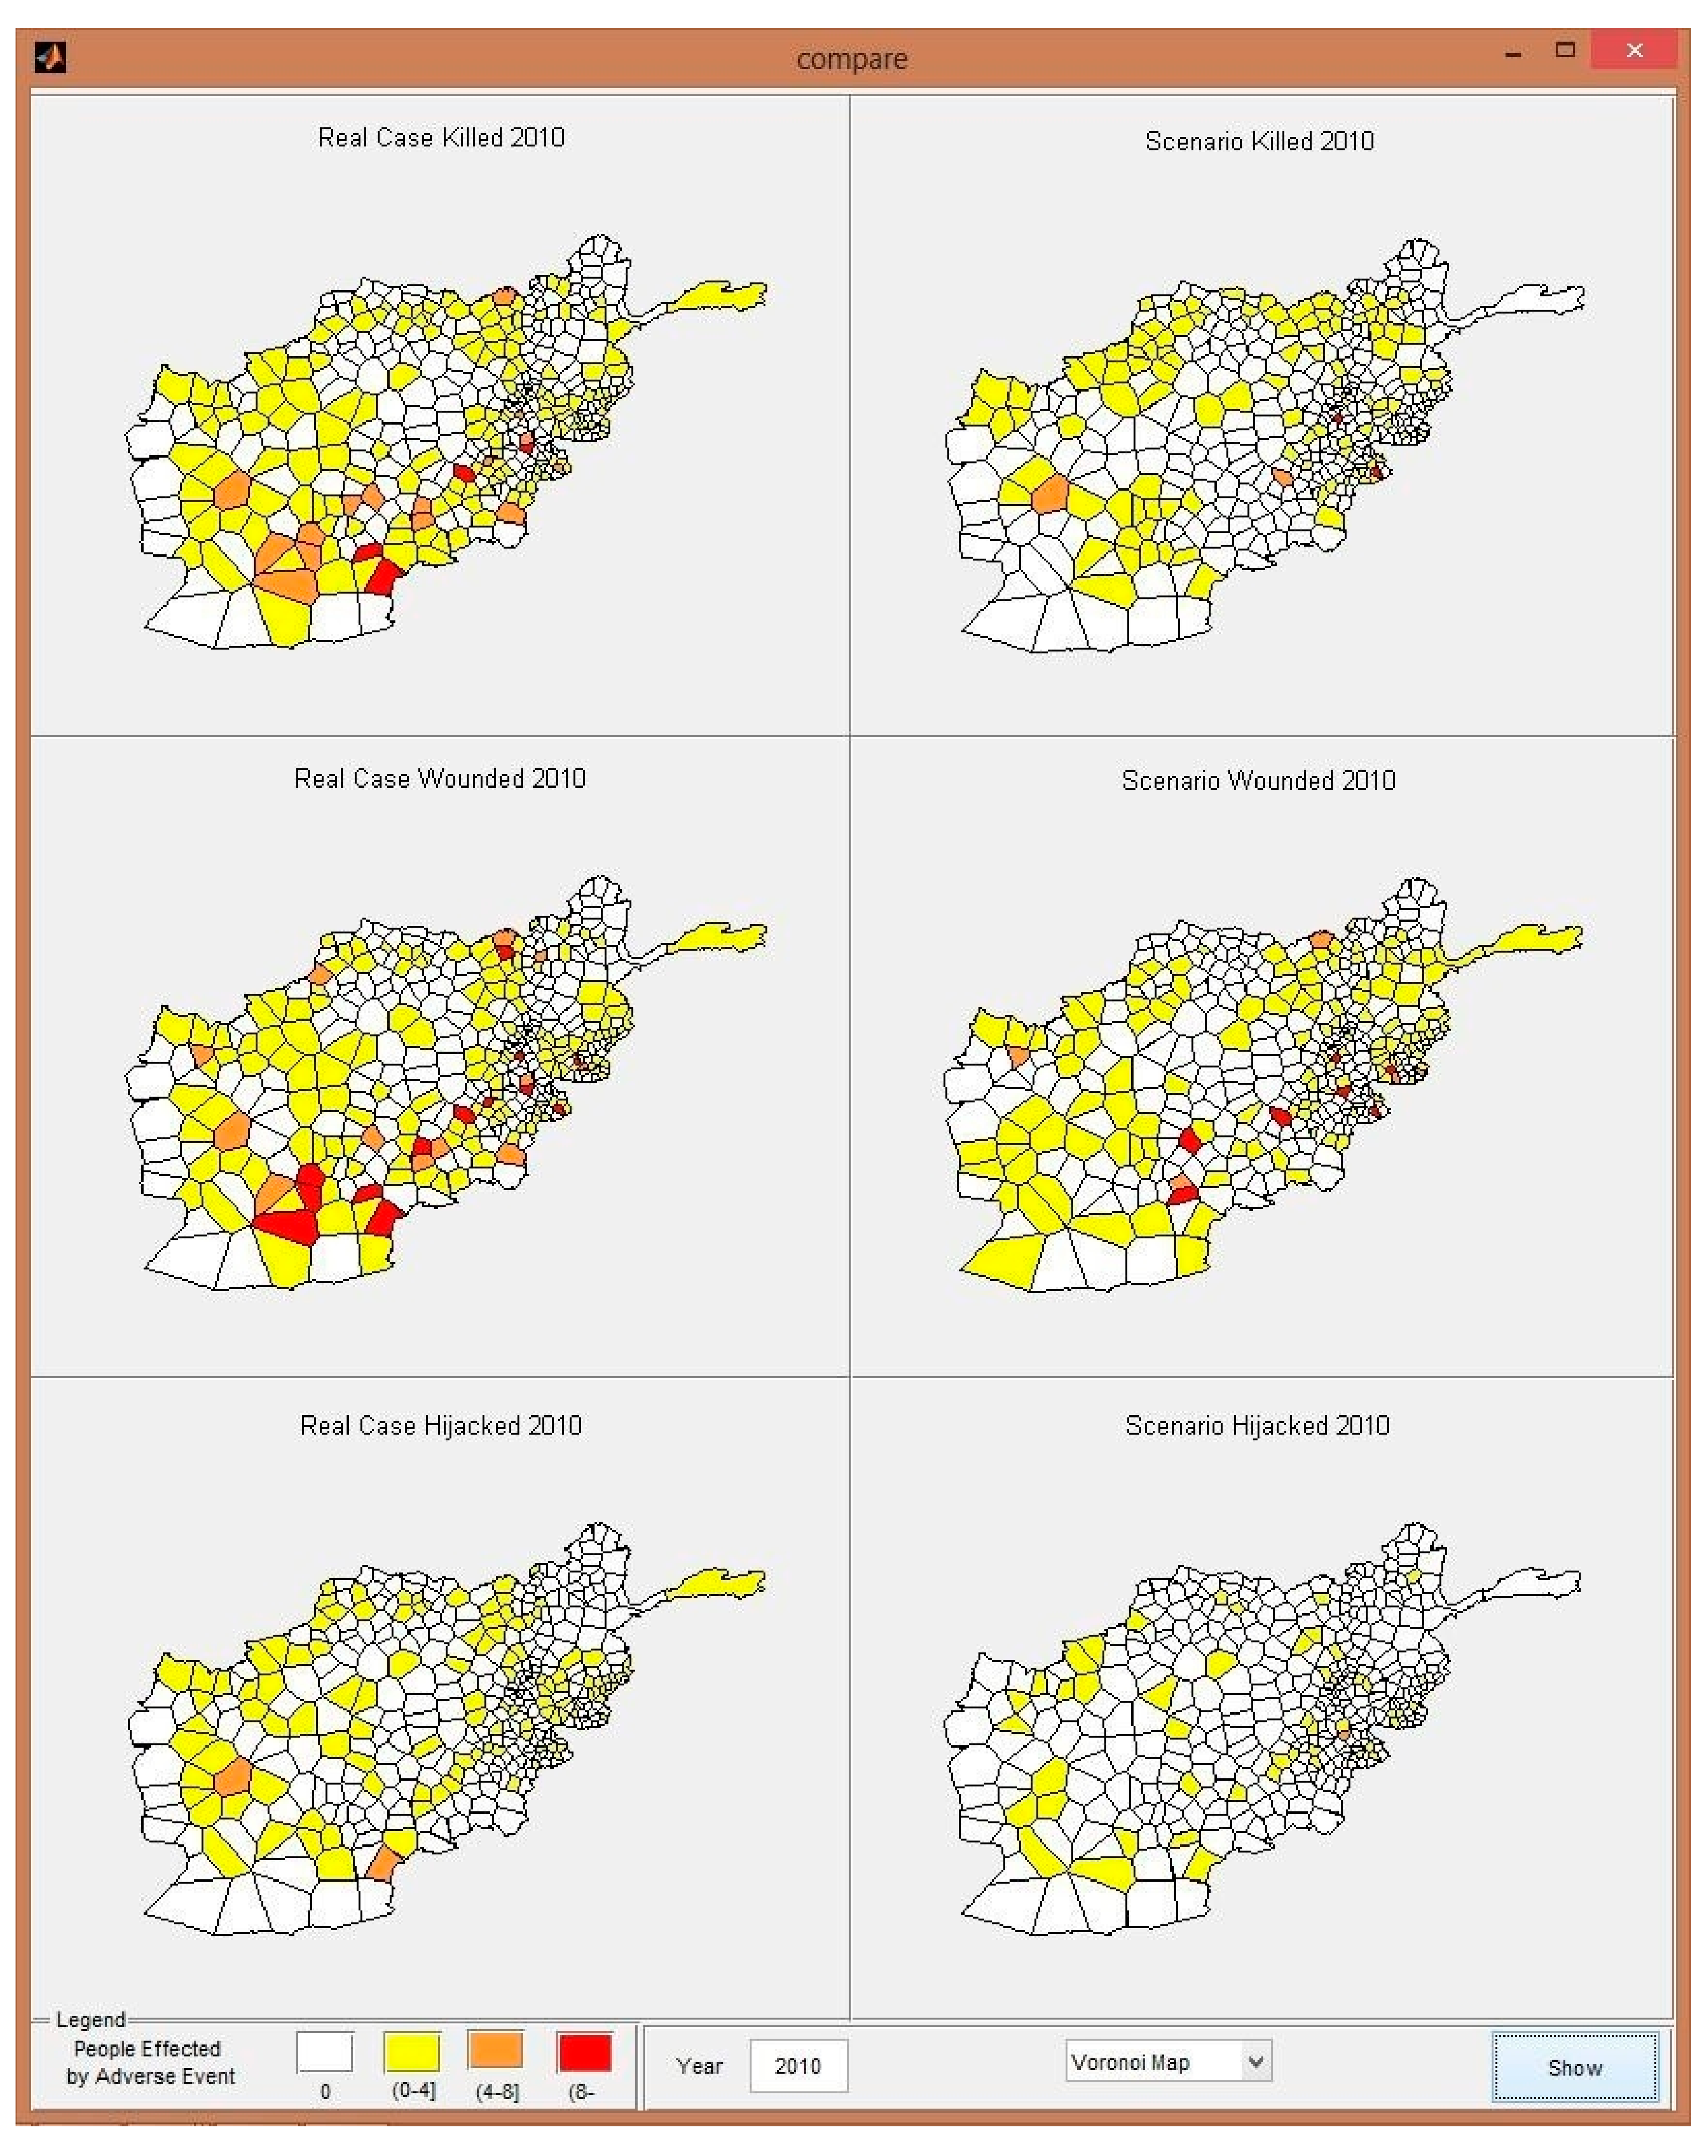
This section exemplifies a what-if scenario and cellular automata model prediction for 2015 to express the capability of the model. The what-if scenario is designed to examine the changes in adverse events if the amount of money spent and the count of aid were doubled for the year 2010. For the scenario examined, aid distribution among districts has remained the same.
Table 5 shows the USAIDdistribution among sectors for the real case and the what-if scenario. The amount spent and the counts of aid conducted for each sector in the table are averages for 400 districts of Afghanistan.
According to the results of the designed what-if scenario, the expected changes in the number of adverse events are as follows. If the amount and count of aid were doubled over 2010, it is predicted that the number of killed people in 155 districts, the number of wounded people in 147 districts, and the number of hijacked people in 95 districts would decrease over the months of 2010. However it is predicted that the number of killed people in 57 districts, the number of wounded people in 76 districts, and the number of hijacked people in 30 districts would increase. The results can be interpreted as indicating that increasing the USAID does not necessarily decrease the number of people affected by adverse events, because it is predicted that there are districts in which the number of people affected by adverse events increases. However, more districts are positively affected by the change in USAID.
In the cellular automata model, districts in the same neighborhood synchronously interact with each other to determine their next state, and changes in iteration in a month yield complex formations. Thus, it is expected that if the distribution of USAID were changed among different districts or months, the rates of changes in adverse events would be different from the scenario examined. It is also expected that if the amount of money spent in each sector were distributed among the different activity types of these sectors, the rates of change on adverse events would differ.
Figure 9 displays the monthly average output for the real-case and what-if scenario for 2010.
4.2. Performance Comparison of Models
In this study, we compared the proposed CA models with a previous model [
33] on the same basis, using the MAE performance metric to identify the most accurate model among three approaches. When the model performance was evaluated by using the MAE values, the proposed CA model variations had the potential to perform better than Çakıt and Karwowski’s fuzzy based model [
33] (
Table 6). The superiority of the proposed CA approach might be attributed to its ability to capture the nonlinear dynamics of the data, and such superiority may be problem-related and may require extensive applications on various data sets to be generalized.
5. Conclusions
This study aimed to develop a CA model to better understand the impact of infrastructure development projects on adverse events in an active war theater. The analysis was performed on a set of spatial data representing projects based on infrastructure development and adverse events data. The infrastructure projects and adverse events represented the states of the districts. Districts in the same neighborhood synchronously interacted to determine their next states. Small changes in an iteration yielded complex formations of adverse event risk after several iterations of time. The modeling methodology of CA for infrastructure development analysis was implemented at both macro and micro levels. Macro-level subsystems were supported by CA rules to generate accurate predictions. The predictive capability of the CA modeled the micro-level interactions between individual actors, which were represented by adverse events.
Application to a real war theater in Afghanistan demonstrated that the CA model was useful for evaluating the influence of infrastructure development projects on reported adverse events, and for identifying the likelihood of the location, time, and impact of such incidents. The infrastructure development projects examined had different levels of impact on each category of adverse events; i.e., the number of individuals killed, wounded, and hijacked. Funds spent for infrastructure development projects, and the number of infrastructure development projects in a given district, had a moderate impact on the number of individuals killed, whereas the population of a district had a moderate impact on the number of individuals hijacked. Performance tests showed that the model was capable of predicting the number of individuals killed, wounded, and hijacked with 83, 81, and 93 percent success rates, respectively.
The study concluded that the prediction capabilities of the developed CA model can be used to support decision-makers in promoting regional rebuilding operations in a war theater through economic infrastructure development programs. Future research will focus on improving the model’s capabilities by implementing an optimization method for distributing funds through different geographical sectors. This approach will better support policymakers in deciding on the distribution of infrastructure development projects in regard to their location and timing. The model can be applied in other countries seeking to pursue infrastructure development in times of continued adverse events.


