1. Introduction
Cognitive fatigue (CF), which is different from but related to physical fatigue, is a ubiquitous symptom found in numerous real-world applications such as healthcare, transportation safety, and in the industrial workplace. It is considered an “invisible” safety risk [
1], often going undetected and untreated, and can cause impaired judgment and other symptoms. For example, consider a school bus driver who is so fatigued that he misses a stop sign, or an airport security officer who fails to recognize a gun inside a passing bag, or a nurse or doctor who administers the wrong medication, or a lecturer who makes mistakes, impacting the quality of education. In medicine, physical and CF are the most common symptoms across many physical and mental diseases such as Multiple Sclerosis (MS), Lupus [
2], Parkinson’s disease [
3], Chronic Insomnia or bad sleep quality [
4], Traumatic Brain Injury (TBI) [
5], and others. Despite the many application areas and medical conditions that we can identify CF as a symptom, this work focuses explicitly on the detection and analysis of CF as it is experienced by healthy individuals and more specifically healthy adults. Hence, the findings presented in this paper may be seen as an important step towards understanding the robustness and generalizability of CF patterns across the aforementioned targeted population group, but should not be considered to be expected behaviors by subjects suffering from various autoimmune diseases or other medical conditions that can cause neurological damage. However, the discussed machine learning-based computational methods, have the potential to be applied for such medical conditions in the future, if the targeted population meets the required criteria (i.e., subjects who suffer from a specific medical condition such as MS).
CF can have a direct impact on the quality of life as it can affect productivity and the efficiency of completing everyday tasks. It can significantly increase the possibility of unwanted accidents with critical effects in a variety of occupations [
6,
7], with some of the most characteristic being machine operators in a production line [
8], medical practitioners such as surgeons [
9], air traffic controllers [
10], public transportation or individual drivers [
11], public safety and military personnel and many others [
12]. CF, specifically, is cited as being a significant barrier to employment, educational attainment, and everyday functioning [
13]. According to the Occupational Safety and Health Administration (OSHA) [
14], employees suffering from fatigue are 2.9 times more likely to be involved in job-related accidents such as slips, falls, and even death. Though human error cannot be eliminated completely, accidents can be reduced and prevented by applying intelligence to identifying the root causes of fatigue, based on analysis of longitudinal behavioral data.
Motivated by the aforementioned observations, we propose CogBeacon, a dataset designed to identify signs of CF across individuals while performing a cognitive task. CogBeacon, offers access to
multi-sensing data along with
user reports and
task-based performance metrics towards identifying events of CF. Thus, allowing researchers to investigate complex correlations across these three diverse but highly correlated groups of behavioral characteristics. Moreover, along with the collected dataset, CogBeacon comes with an open-access software that provides the required back-end computational framework needed for data collection (
https://github.com/MikeMpapa/CogBeacon-WCST_interface). Our goal is to motivate other researchers to extend the functionalities of the system by integrating their own cognitive tasks and sensors and enrich the available dataset by conducting new experiments using the CogBeacon platform.
This paper is organized as follows. In
Section 2 we discuss computational methods that have been proposed in the past for CF analysis. In
Section 3 we explain the WCST cognitive task and we present our implementation used for the data collection.
Section 4 describes the experimental setup and provides an in-depth description of the compiled dataset.
Section 5 and
Section 6 show our initial findings after conducting the user study and a preliminary machine-learning analysis on the collected multi-modal data.
Section 7 provides a discussion over the main contributions presented in this paper and finally,
Section 8 summarizes our work and highlights future directions.
2. Background—Computational Modeling of Cognitive Fatigue
Detecting and predicting CF is not a new problem in behavioral modeling. Several research efforts have tried to tackle the problem in the past by adopting various approaches under different experimental assumptions. However, it remains a widely open problem due to its high level of ambiguity and despite its importance in many applications there are very few (if any) available datasets designed to tackle the problem. In 2004 Hursh et al. [
15] were one of the first research groups that tried to predict CF using methods of computational modeling. In particular, they proposed FAST a tool for fatigue forecasting designed to assist operators in the transportation sector. FAST functioned based on the SAFTE model, a computational architecture for modeling fatigue based on signal analysis related to sleep activity and task effectiveness of the operator. In 2007 Donovan et al. [
16] highlighted once again the potentials of using cognitive modeling methods to predict fatigue by conducting a user study on 256 women that were under treatment for early stage breast cancer. A few years later, Gonzalez et al. [
17] used the ACT-R [
18] cognitive architecture to predict user fatigue in a data entry task. Their method takes advantage of the principles described by the ACT-R architecture and estimates how specific performance parameters such as task accuracy and response time are being affected by fatigue using a rule-based decision-making approach. ACT-R has motivated other recent approaches as well related to fatigue and performance monitoring with applications in smart driving and vocational safety [
19,
20]. In 2018 Golan et al. [
21] focused on the major importance of subjective reporting with respect to CF and its impact on cognitive functioning on patients suffering from MS.
Taking all the aforementioned findings into account, CogBeacon aims to provide a robust dataset and a computational platform able to serve multiple modeling approaches and research purposes. CogBeacon is designed based on the principles described by Tsiakas et al. [
22] on how to design multi-sensing interaction scenarios towards assessing cognitive and physical fatigue. In contrast to most of the referenced works, we suggest a machine learning-based analysis of EEG signals towards identifying CF. Our method comes as an extension of our previous findings, originally presented in [
23,
24], where similar modeling solutions were deployed to predict cognitive performance on a short-term memory cognitive task. Long term scope of this exploratory research is to develop advanced computational methods for fatigue prediction and modeling able to enhance the efficiency of current approaches in assistive technologies related to medical conditions such as MS [
25] or workplace training [
26].
3. The Wisconsin Card Sorting Test
The Wisconsin Card Sorting Test (WCST) is a neuropsychological test of “set-shifting”, i.e., displaying flexibility in the face of changing schedules of reinforcement [
27]. Several stimulus cards are presented to the user. The user is told to match the cards, but not how to match them; instead, the system provides feedback on whether a particular match is right or wrong. There are 3 different rules that a subject can adopt (based on the color, shape, or number of the symbols), and the only feedback is whether the classification is correct or not. At each turn, only one of the three rules applies and based on that rule the user must make a choice (out of 4 possible choices). The user goal is to derive the rule based on the feedback provided by the system. Once the user correctly identifies the rule (operationalized as several consecutive correct responses [e.g., six]), the rule changes and the user must identify the new rule. The task generates several psychometric scores, including categories achieved, trials, errors, and perseverative errors (i.e., when the user is unable to switch rules, despite repeated errors). WCST has been extensively used to assess dysfunction of the prefrontal cortex of the human brain. Previous brain imaging studies have focused on identifying activity related to the set-shifting requirement of the WCST [
28].
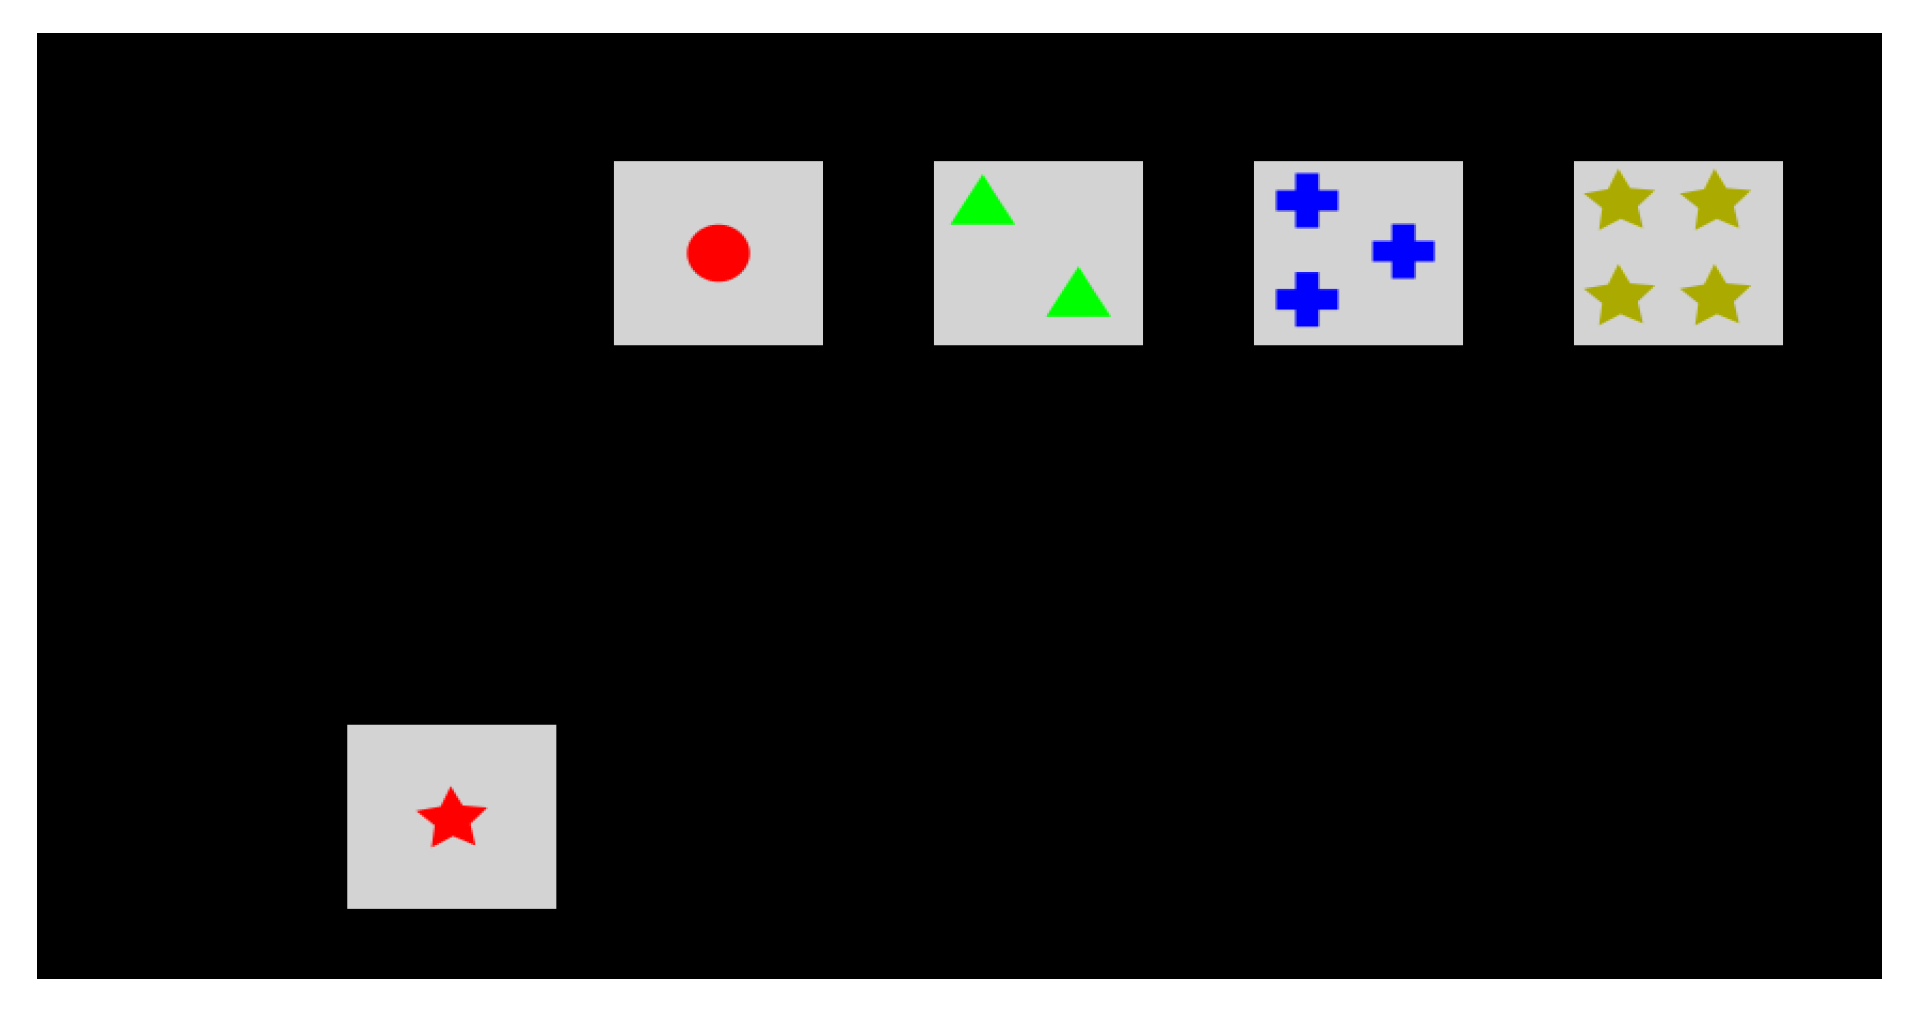
Figure 1 shows a screenshot of the computerized version of the original WCST provided by the PsyToolkit Library [
29].
Inspired by the principles of the original WCST we developed our own computerized cognitive game. Our task shares a relatively similar graphical environment as the game offered by [
29] and provides access to the same metrics offered by the traditional WCST task. Our goal was to create a cognitive game that challenges the same cognitive functionalities as the original WCST but in the form of a computer game that has different difficulty modes and variations so it can become more engaging for the users through the introduction of alternative scenarios. As we explain in the next section our implementation has a mode that simulates the exact rules followed by the original task but also provides alternative functionalities towards creating a challenging cognitive environment.
The reason of choosing a game that simulates the WCST principles is that such a cognitive task incorporates cognitive challenges such as short-term memory, adaptive decision-making, and problem-solving that can be found in a great variety of daily living activities.
Inducing Cognitive Fatigue by Increasing Complexity
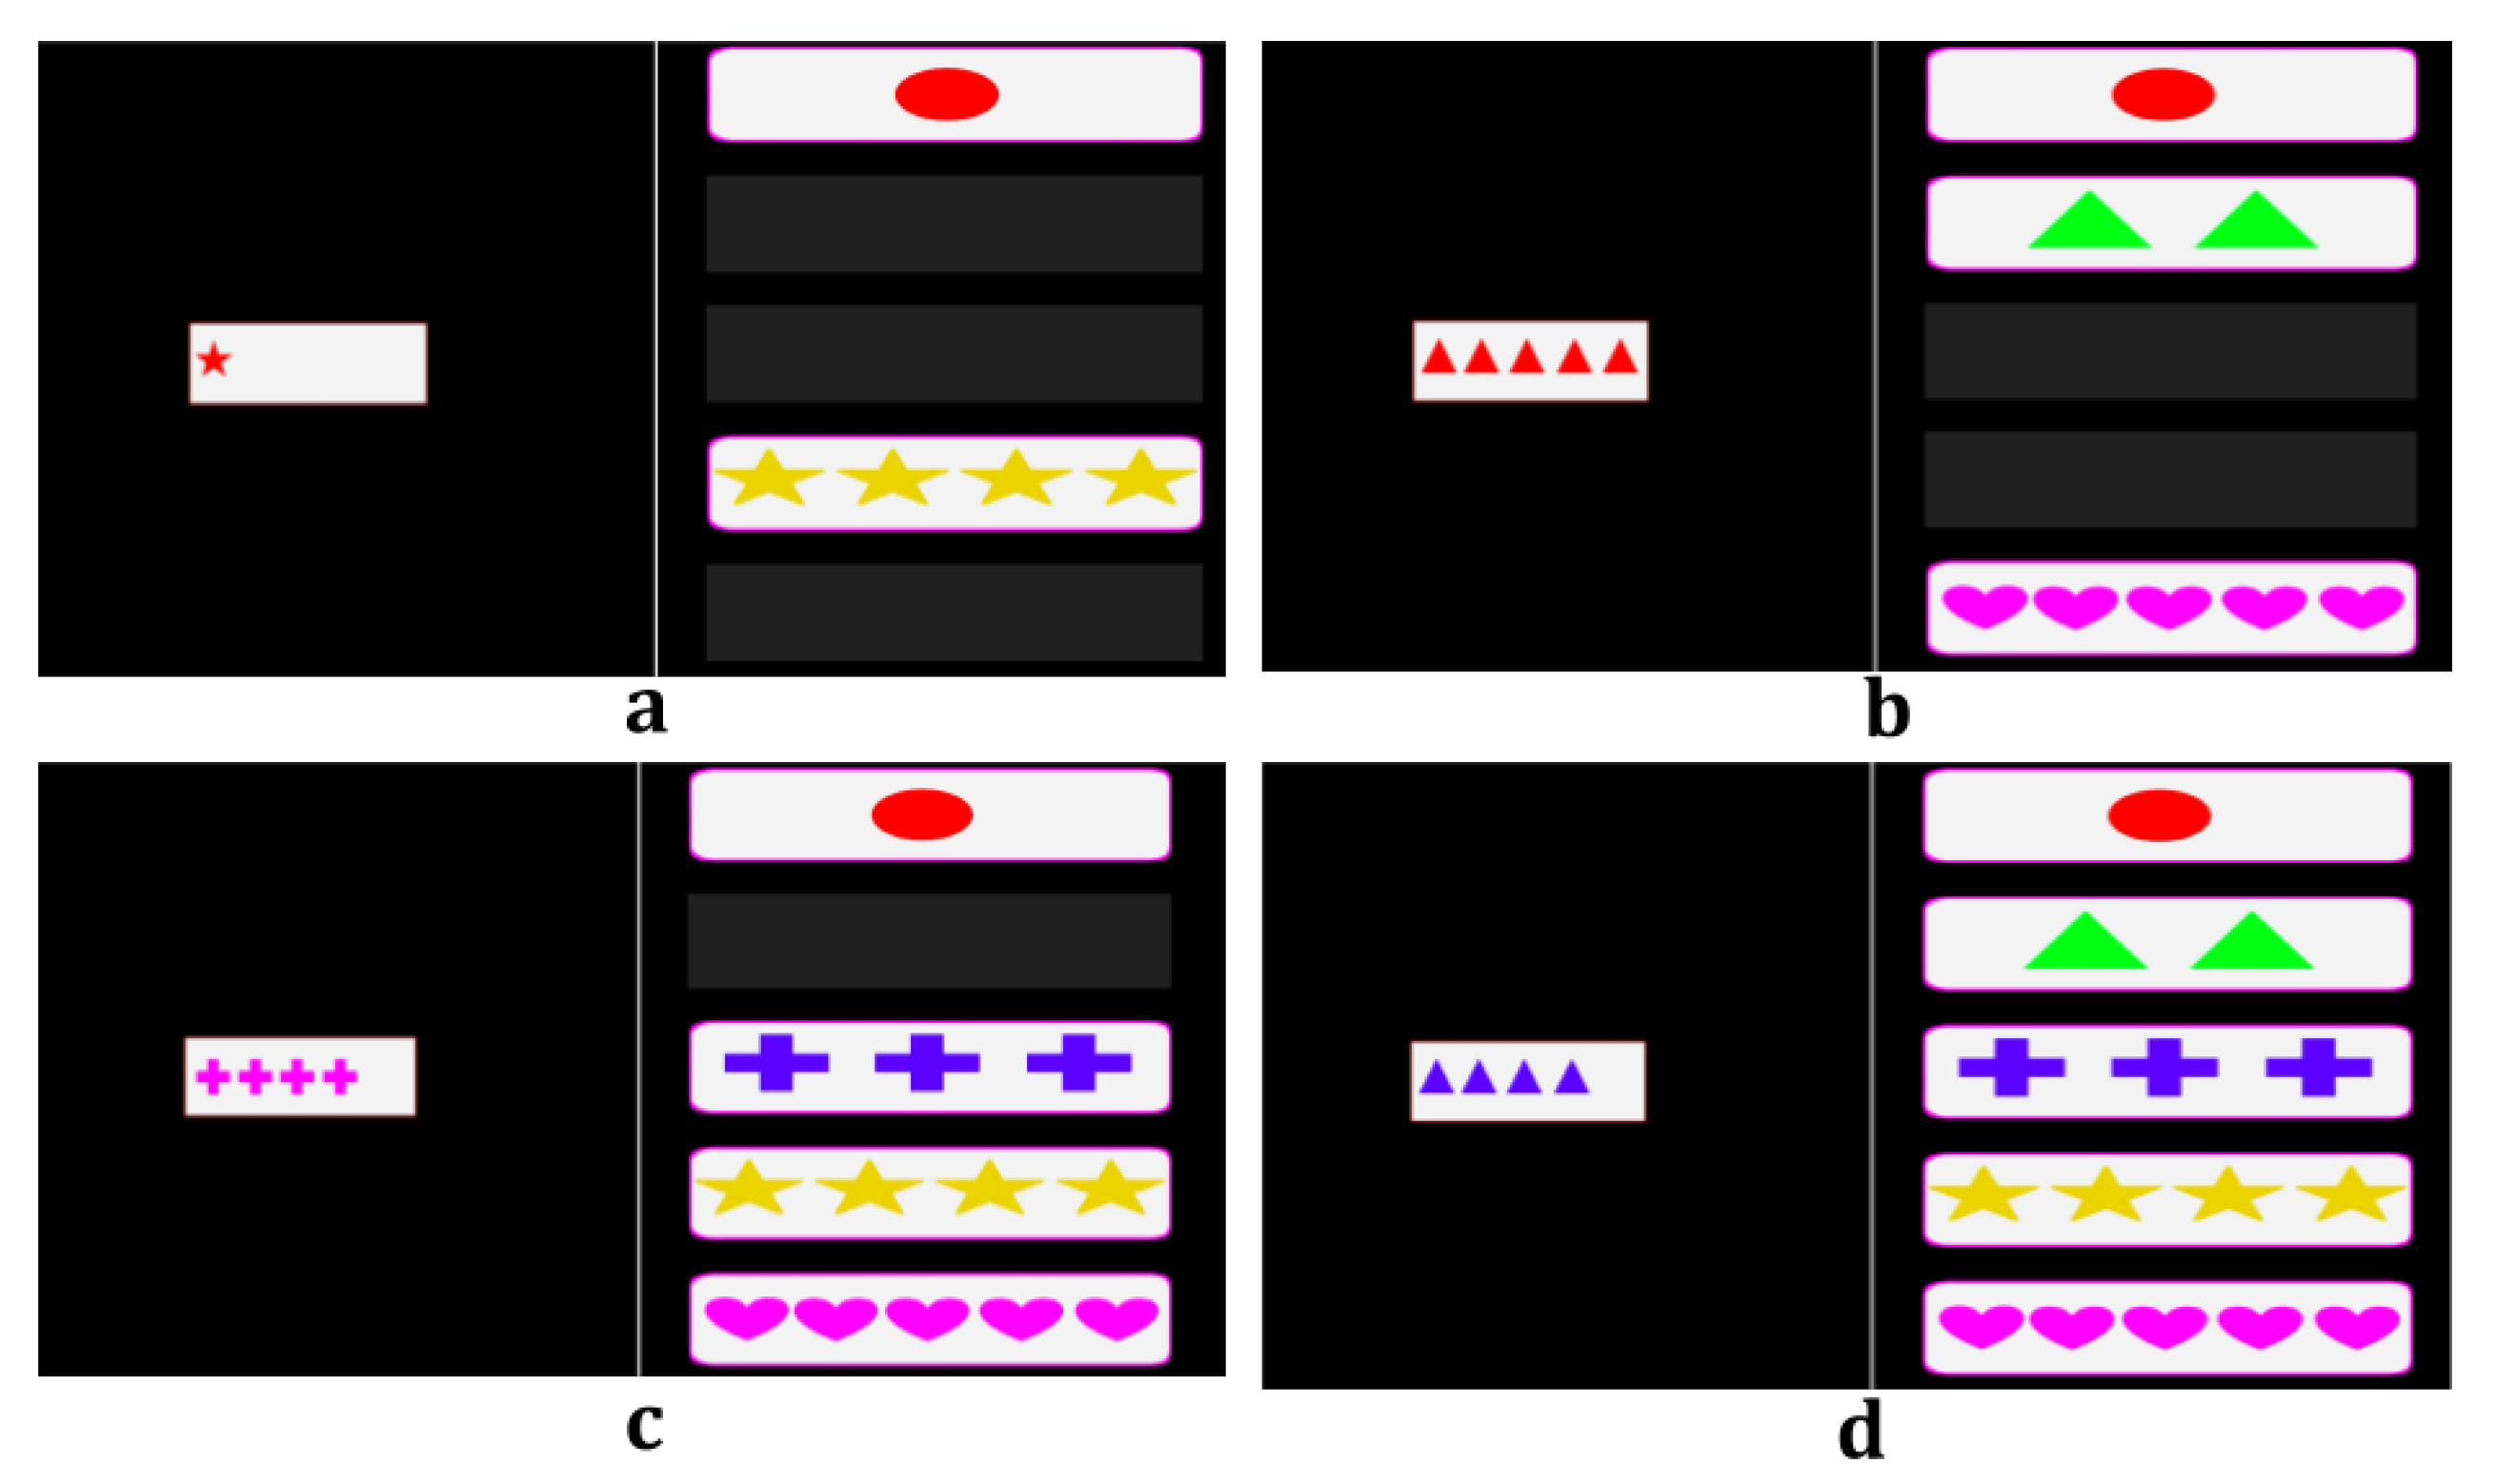
To induce fatigue to the users, we developed two alternative versions of the original task that aimed to increase the overall complexity and game demands with respect to user engagement and attention. In the first version (V1), the game starts by offering just two possible choices to the subject (against the standard four choices provided by the original task). As the game progresses, the number of possible choices gradually increases by one until a total number of five possible choices are reached. In the second version (V2) the number of possible choices is randomly changing when the decision rule changes. As in V1, for V2 the minimum number of choices is two and the maximum five. In both modified versions the total number of rounds is almost doubled compared to the original WCST (from 60 rounds to 128), the decision rule changes more often (every 4 rounds in V1 and V2 compared to every 6 rounds in the original WCST) and the maximum available response time is decreased by 2 seconds (from 6 sec in the original WCST to 4 sec in V1 and V2). In
Figure 2 we show four possible states of the modified versions, V1 and V2, of the original WCST.
To validate that our experiments were able to induce some CF to the participants, we asked them to fill out a questionnaire after the completion of the session. According to their responses, out of the 38 data-collection sessions (see
Section 4.1) that were conducted, in 28 of them (~74% of the times) users reported being more tired at the end of the process compared to how they were feeling right before starting the experiment. Moreover, most participants suggested that they had to put more effort to adapt to the varying number of choices offered by the modified versions of the game. Based on the same post-completion questionnaires, from a scale between 1 (No Fatigue) to 5 (Very Fatigued) an average increase in fatigue of 1.05 points was recorded with a standard deviation of 3.54 across all 38 data-collection sessions.
The aforementioned analysis indicates that the overall data-collection process along with our modifications in the original task were indeed able to create a demanding environment in terms of cognitive effort for the participants. These findings are in line with the subjective reports provided by the users in real time, while performing the test (see
Section 5). In the following Sections we describe in detail the experimental setup and we present a more in-depth analysis of the data captured during data collection and the functionalities provided by the current version of the CogBeacon software.
4. The CogBeacon Dataset
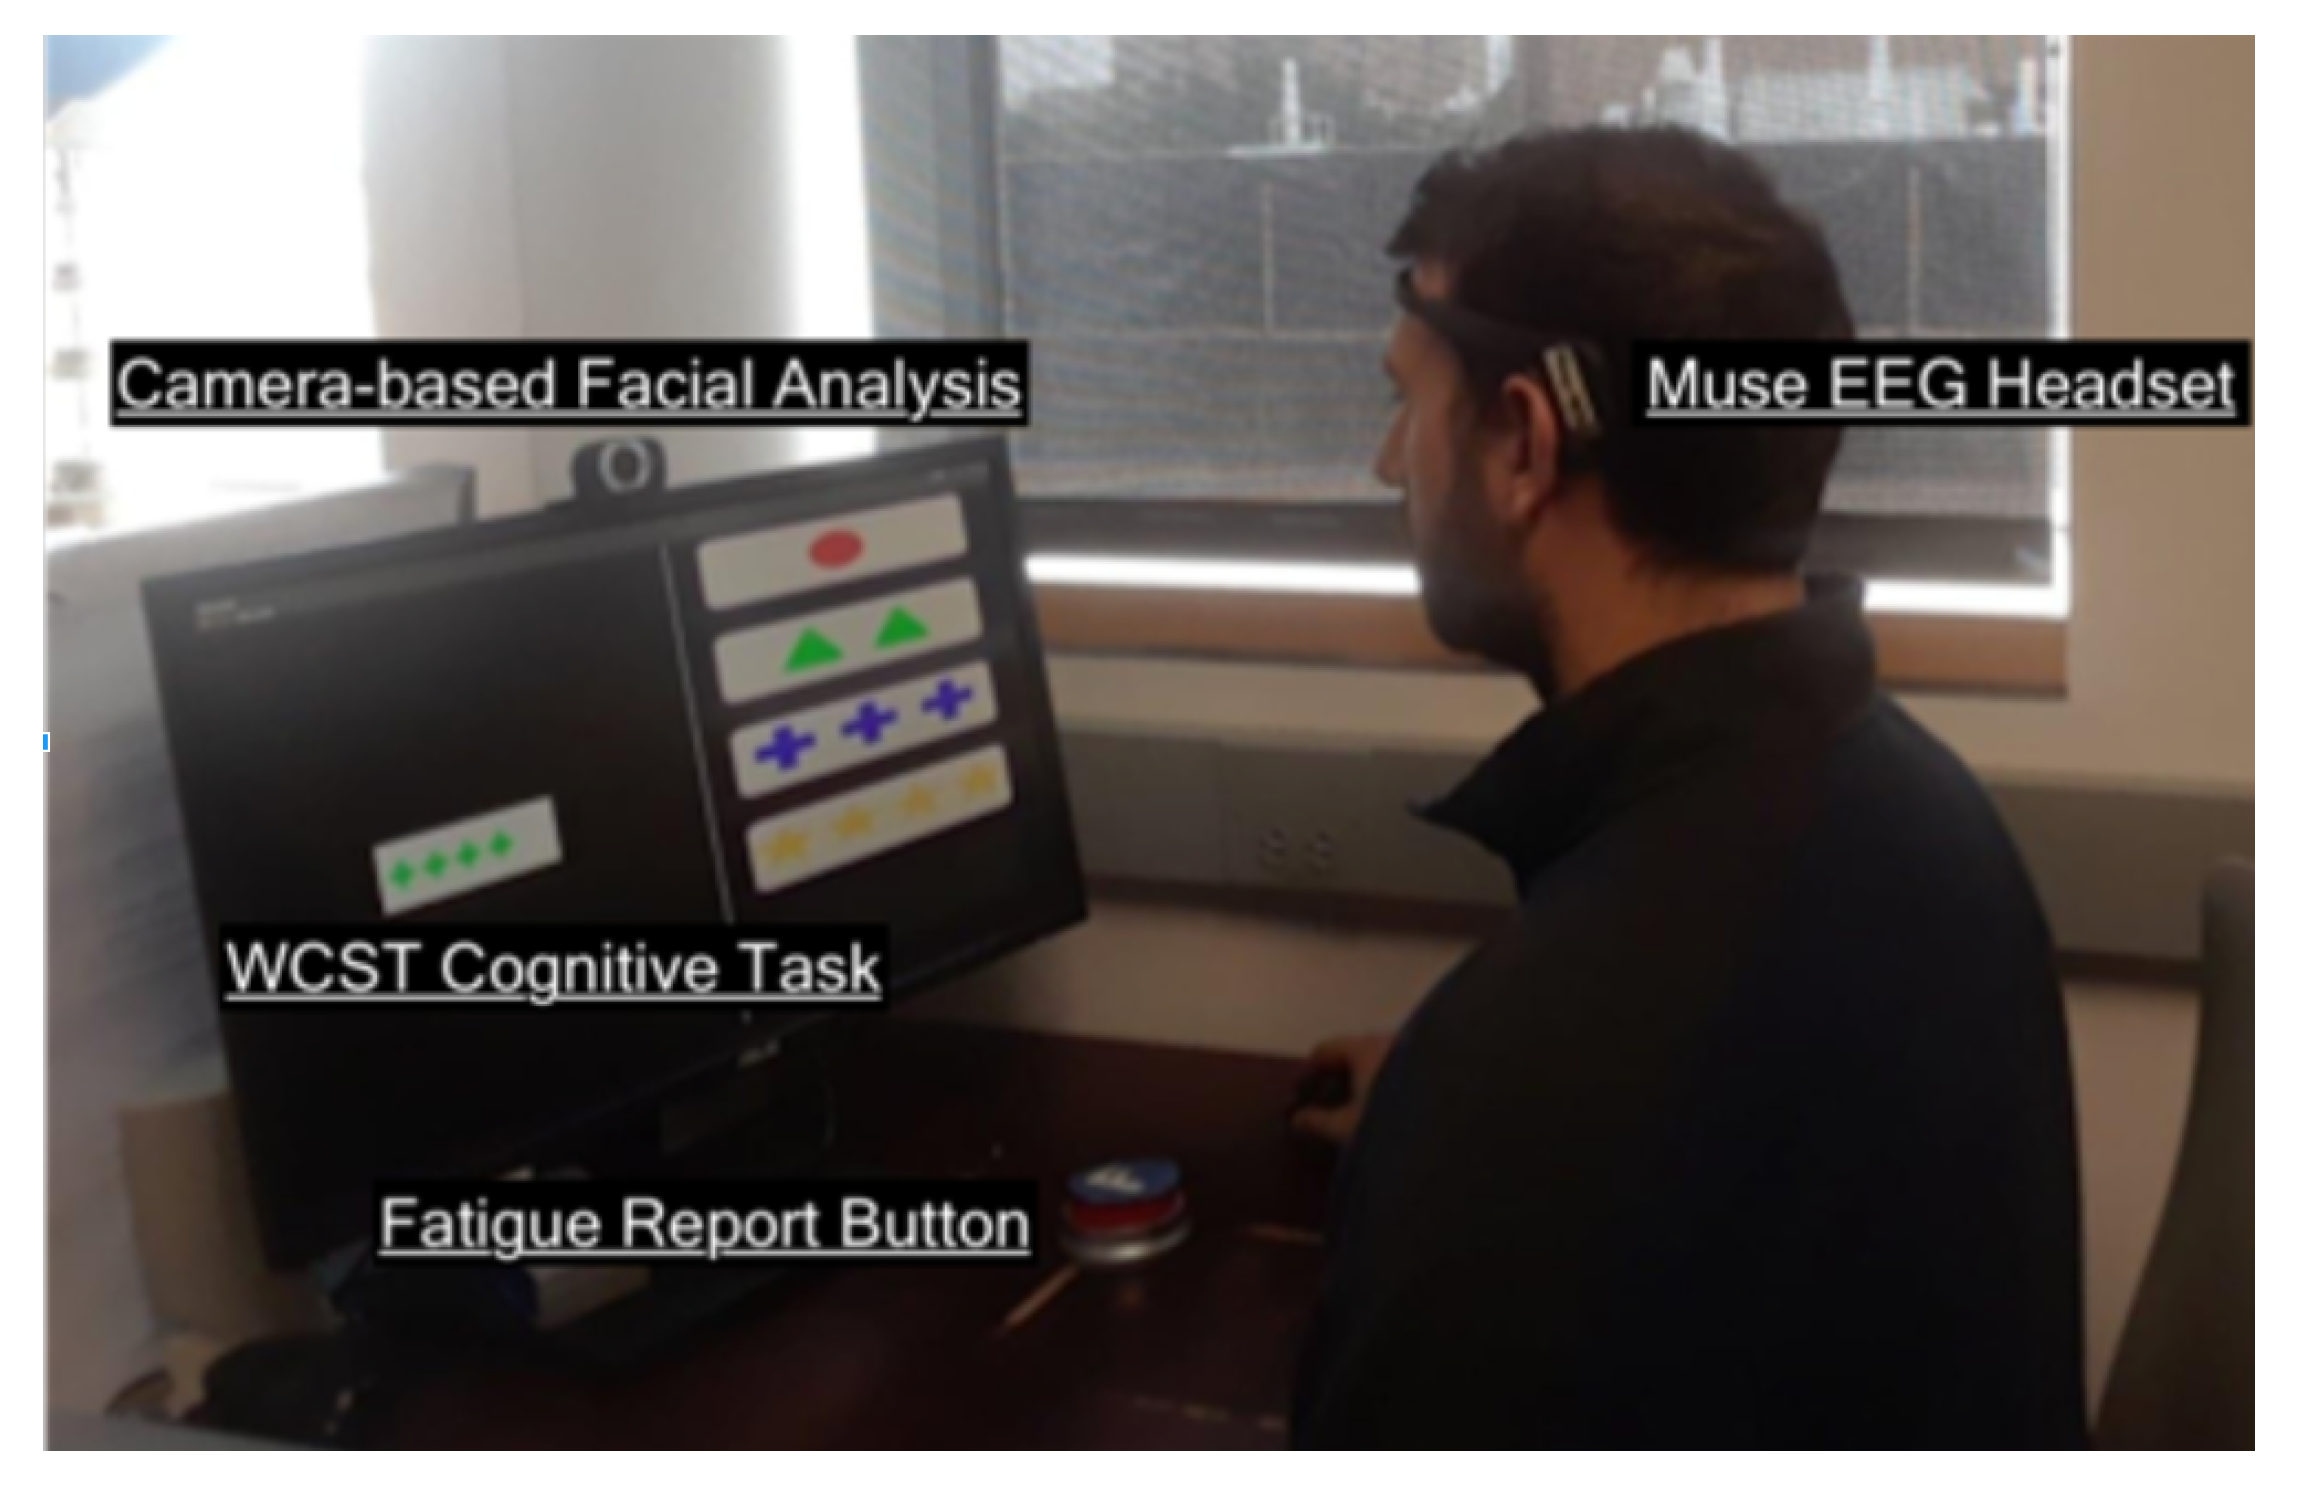
The current version of the CogBeacon dataset consists of 76 cognitive tasks performed by 19 individuals. During each task we collected a range of diverse data, capturing physiological, behavioral, and performance characteristics. In addition, we recorded user reports provided in real time with respect to the levels of CF experienced by each participant. In
Figure 3 we illustrate the experimental setup. The dataset along with the code for the preliminary analysis discussed in
Section 6 can be found online and are available for further experimentation (
https://github.com/MikeMpapa/CogBeacon-MultiModal_Dataset_for_Cognitive_Fatigue).
Our team has received permission by the Institutional Review Board (IRB) of the University of Texas at Arlington to conduct these experiments and share the collected data (Protocol ID 2019-0253). A copy of the consent form used for the purposes of this study can be found in the online data repository. Participants of this study were asked to consent that they did not have any of the following cognitive or physical disabilities: any kind of upper limb mobility limitations, severe visual impairments (people wearing glasses or contacts were not considered to be ‘severe’), cognitive and/or physical impairments related to Parkinson’s disease, Dementia, Multiple Sclerosis, Down syndrome, or similar diseases that have a chronic impact on the nervous system. Moreover, participants who were under medication that could cause drowsiness and/or sleepiness were not allowed to participate. For additional information or questions about the confidentiality or data sharing protocol please feel free to directly contact the IRB office at UTA (
erahelpdesk@uta.edu) or the authors of this paper.
4.1. Data-Collection Process
We have collected data from 19 healthy participants between the ages of 19 and 33 years old. All participants were either faculty or students (undergraduates and graduates) of the Computer Science Department at our institution. In total we captured data from 6 female and 13 male participants. The total duration of an experiment was usually ranging from 25 to 30 min depending on the response time of each individual user, and the time s/he needed to understand the experimental procedures. None of the users was familiar with the WCST test before participating in our experiment. During that time, each user had to be attentive so to understand and complete the following steps. Step1: Understand the instructions of the original WCST task as described by the researcher (~5 min). Step2: Perform our implementation of the original WCST (~4 to 7 min). Step3: Answer a post-completion questionnaire to report subjective fatigue at this point (~2 min). Step4: Understand the instructions of the modified WCST (V1 or V2) task as described by the researcher (~3 min). Step5: Perform the modified version of WCST (~7 to 9 min). Step6: Answer a post-completion questionnaire to report subjective fatigue after the completion of the experiment (~2 min). No resting time was offered to the participants during the experiment and each step started immediately after the previous one was completed.
It must be noted that task duration should not be considered to be the only factor responsible of inducing CF. The modified versions (V1–V2) were designed so to increase the computational demands of the task by altering their parameters (see
Section 3), thus playing a significant role towards increasing CF. Moreover, as several pieces of research suggest [
17,
30,
31], repetitive and monotonous tasks, such as the WCST, tend to decrease the levels of arousal and introduce CF. Even though, quantifying the amount of CF induced by each individual factor is out of the scope of this paper, we argue that all the aforementioned steps played an important role towards inducing CF at the end. The CogBeacon platform acts mainly as the tool to monitor and observe this build-up of CF in real time.
To conduct our experiments, we divided our data-collection process into two sessions. Each participant had to participate in both sessions and each session took place on a different day. Both sessions consisted of two main parts. In the first part, which was the same in both sessions, participants were asked to play the cognitive game designed by our team which followed the same rules and guidelines as described by the original WCST [
29]. The test consisted of 60 turns in total with 4 stimulus cards on each turn and the matching rule changed every 6 turns. The second part which took place right after the completion of the first test, was to play one of the modified versions, V1 or V2. The main difference between the two sessions was in the second part of the task. During the second part of the first session, users were asked to play the V1 version of the WCST while in the second session they had to play V2.
Our goal with the introduction of V1 and V2 as a second part was (a) to expose the user to something similar to what s/he had already experienced but not the same, so that s/he must pay attention in order to adapt to the changes, (b) to induce CF in the users, and (c) to create a rich dataset of similar but not identical tasks towards understanding CF.
Table 1 summarizes the details of the data-collection process.
4.2. Sensors and Data Stored
4.2.1. Physiological and Behavioral Data:
We recorded the user EEG data during task performance, using the MUSE EEG headset [
32], a non-invasive wearable device, widely used for BCI systems [
33]. MUSE has four electrodes, two over the prefrontal lobe and two behind the ears. We recorded raw EEG activation in a sampling rate of 220 Hz and using the digital signal processing unit embedded in the device we also stored information and features extracted from the individual EEG frequency bands namely: gamma 32–100 Hz (
), beta 13–32 Hz (
), alpha 8–13 Hz (
), theta 4–8 Hz (
) and delta 0.5–4 Hz (
) in a sampling rate of 10 Hz. As extensive research on the field suggests [
34],
delta waves provide information related to deep dreamless sleep when there is a lack of body awareness,
theta waves are useful to describe deep mental states such as dreaming or deep meditation where subjects have reduced consciousness,
alpha waves describe physically and mentally relaxed states of mind while
beta and
gamma can be used to describe awake and alert states of consciousness with heightened perception and are related to active thinking, excitement, learning, and increased cognitive processing. Thus, for each of the four MUSE sensors the following EEG data-streams have been logged:
Raw EEG: at a sampling frequency of 220 Hz
Absolute Frequency Bands (A):,
,
,
and
at sampling frequency of 10 Hz. The absolute band power for a given frequency range is the logarithm of the sum of the Power Spectral Density of the EEG data over that frequency range.
where f_low and f_high are the minimum and maximum frequencies of frequency band x and G is the FFT of the EEG signal g
Relative Frequency Bands (R):,
,
,
and
at sampling frequency of 10 Hz. The relative band powers are calculated by dividing the absolute linear-scale power in one band over the sum of the absolute linear-scale powers in all bands.
where x is one of the five frequency bands.
Session Score for each frequency band (S): A value computed by comparing the current value of a band power to its history in sampling frequency of 10 Hz. This value is mapped to a score between 0 and 1 using a linear function that returns 0 if the current value is equal to or below the 10th percentile of the distribution of band powers, and returns 1 if it is equal to or above the 90th percentile. Linear scoring between 0 and 1 is done for any value between these two percentiles.
Signal Quality Indicator: An integer value from 1 (optimal quality) to 4 (very bad quality).
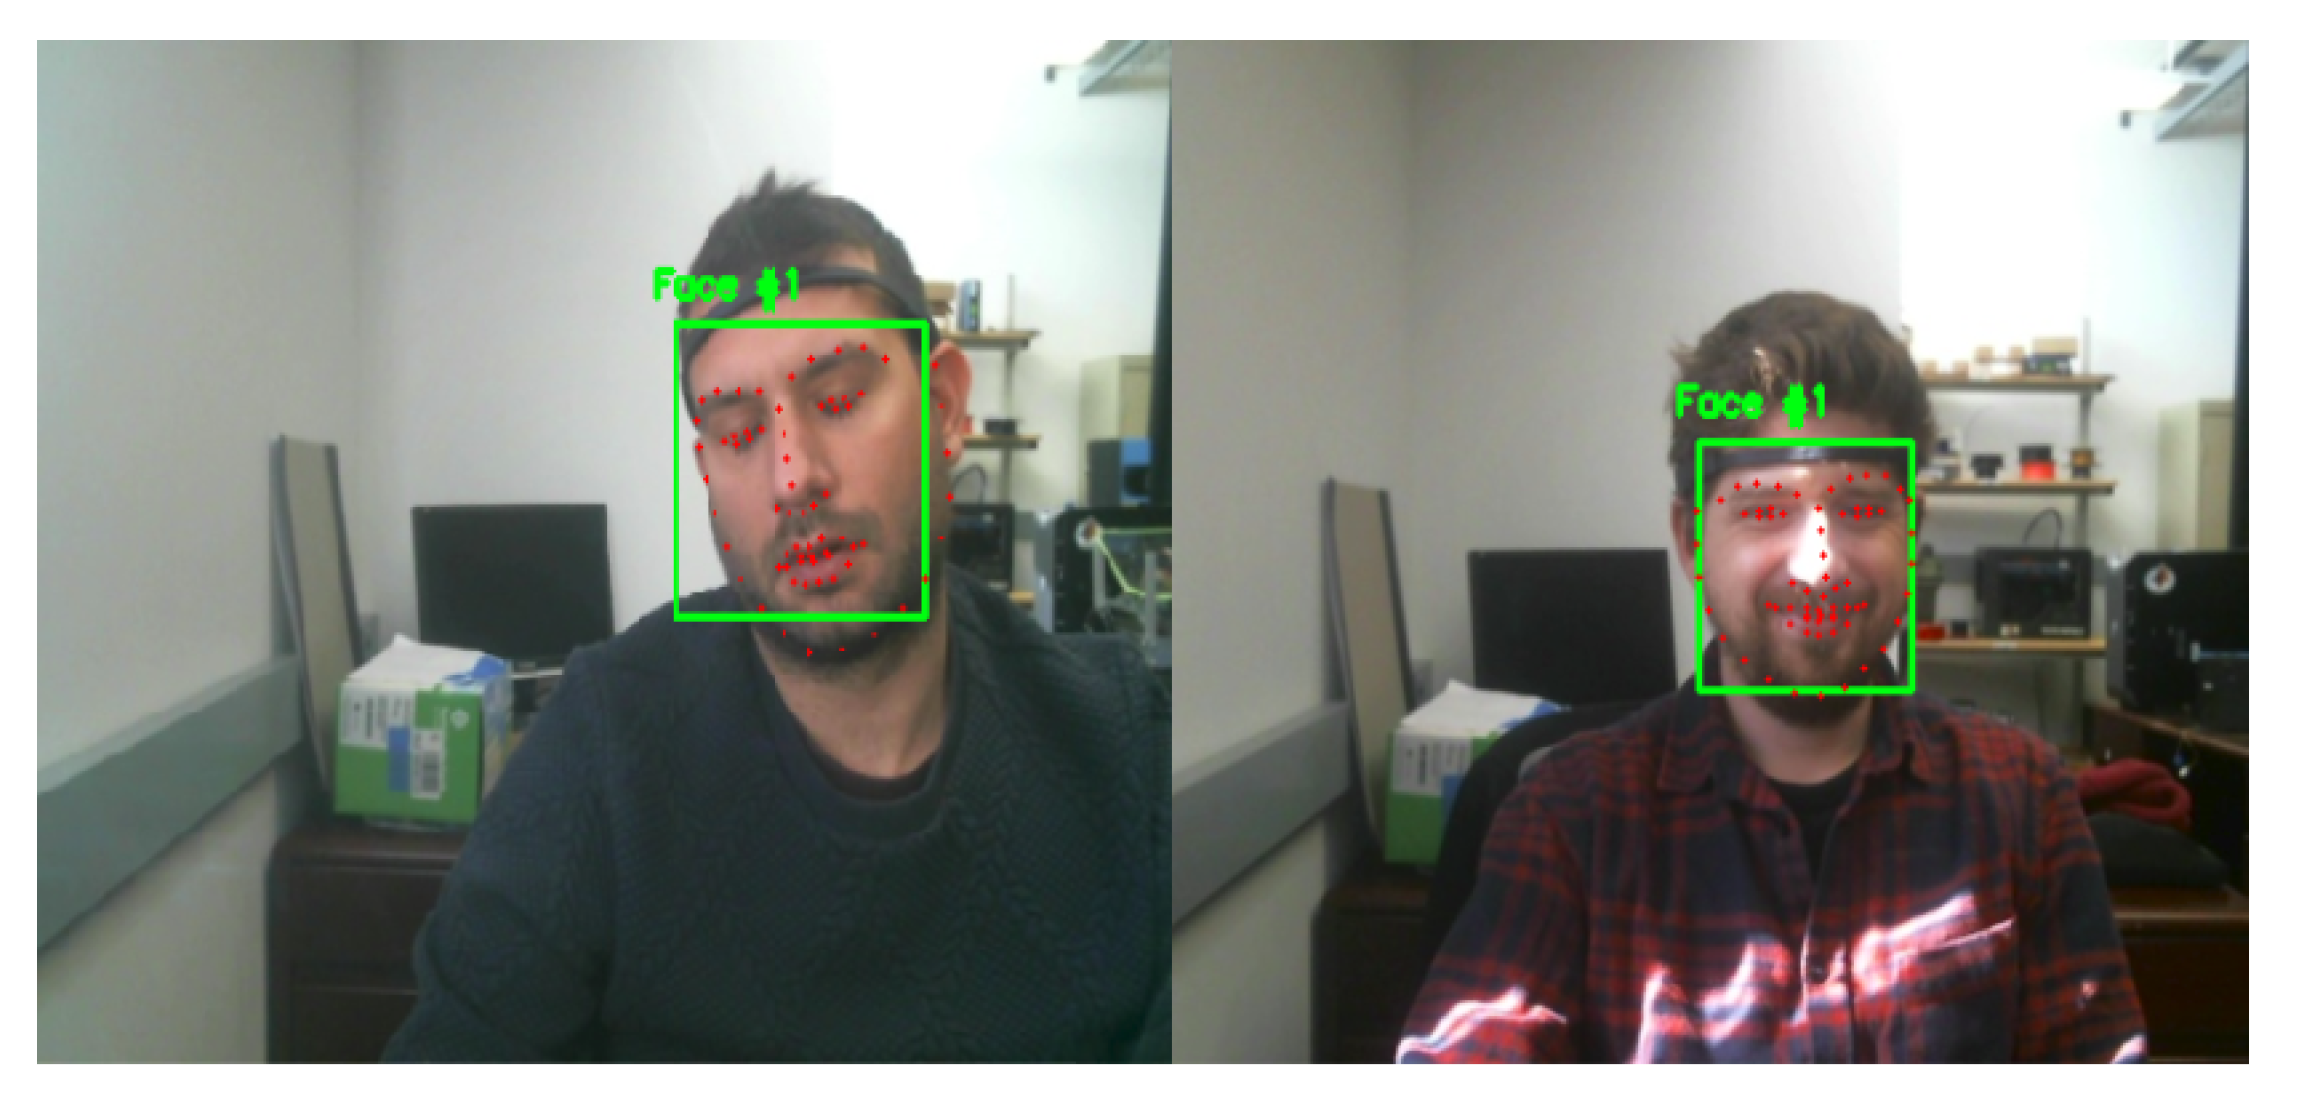
To capture behavioral changes during the task, we also recorded variations in the movement of the face, capturing a set of 68 facial keypoints with a webcam placed on top of the screen. To identify facial keypoints, we deployed the method presented by [
35] that uses a Regression Tree approach and can be applied in real time.
Figure 4 illustrates the output of the algorithm from two different users in two random frames. Our preliminary analysis on these data did not provide any significant and worth-reporting results. Hence, for the purposes of this study we do not provide any experimental findings based on the facial keypoint analysis. However, we believe that this aspect must be investigated further in the future.
4.2.2. Real-Time User Reports on Cognitive Fatigue:
During each test, participants were told to report when they were having trouble to keep up with the task by pressing a button placed in front of them (see
Figure 3). The button could be pressed at any time during a game as many times as the participants felt appropriate. Thus, a button press would act as an indicator that the user is feeling overwhelmed by the game and could be the result of someone’s inability to pay attention, boredom, difficulty to remember or resolve the correct decision rule or any other reason/condition that could potentially affect task performance according to the subjective opinion of the participant. For the purpose of this exploratory data collection all the reasons/conditions mentioned above were considered to be indicators of cognitive fatigue.
4.2.3. Task-based Performance Metrics:
For every round of every test the system logs a set of metrics and scores related to user performance with respect to the task. These metrics are:
A binary flag that indicates if a user response was correct in a given round.
The cumulative number of perseverative errors until the current round. Perseverative errors are when the user continues to apply the wrong rule despite the informative feedback provided by the system.
The cumulative number of non-perseverative errors until the current round. Non-perseverative errors are the errors recorded when the user tries to figure out the new rule after a rule change. Given that there were three possible decision rules in total (based on color or shape or number), a user is supposed to figure out the correct rule no later than the third round after a rule change. Any error that occurred before the third round is considered to be non-perseverative error. All other errors are considered to be perseverative errors.
The total number of correct answers.
User response time at every round.
An indicative round-based user score computed as:
Score is computed only if user answer was correct otherwise the score is 0.
In addition, for every round the system logs the following task characteristics:
The number of possible choices offered by the system: 2, 3, 4, or 5.
The type of the correct stimuli: color, shape, or number.
The value of the correct stimuli:
- -
If color: green, yellow, blue, red, or magenta
- -
If shape: triangle, star, cross, circle, or heart
- -
If number: one, two, three, four, or five
4.3. The CogBeacon Data-Collection Platform
As mentioned before the CogBeacon data-collection software can be found online and downloaded for free (
https://github.com/MikeMpapa/CogBeacon-WCST_interface). The software is easy to install and execute, and can be used to extend the current dataset and the analysis provided here. Moreover, the software can be easily modified to run across different platforms as it is mainly written in Kivy [
36], a Python-based API that can run on Windows, Linux, iOS, and Android operating systems. The CogBeacon data-collection platform aims to support the integration of additional and more advanced sensors for monitoring human behavior. In addition, our future goal is to extend the functionalities of the library by incorporating more cognitive and problem-solving games, such as the ones described by [
37,
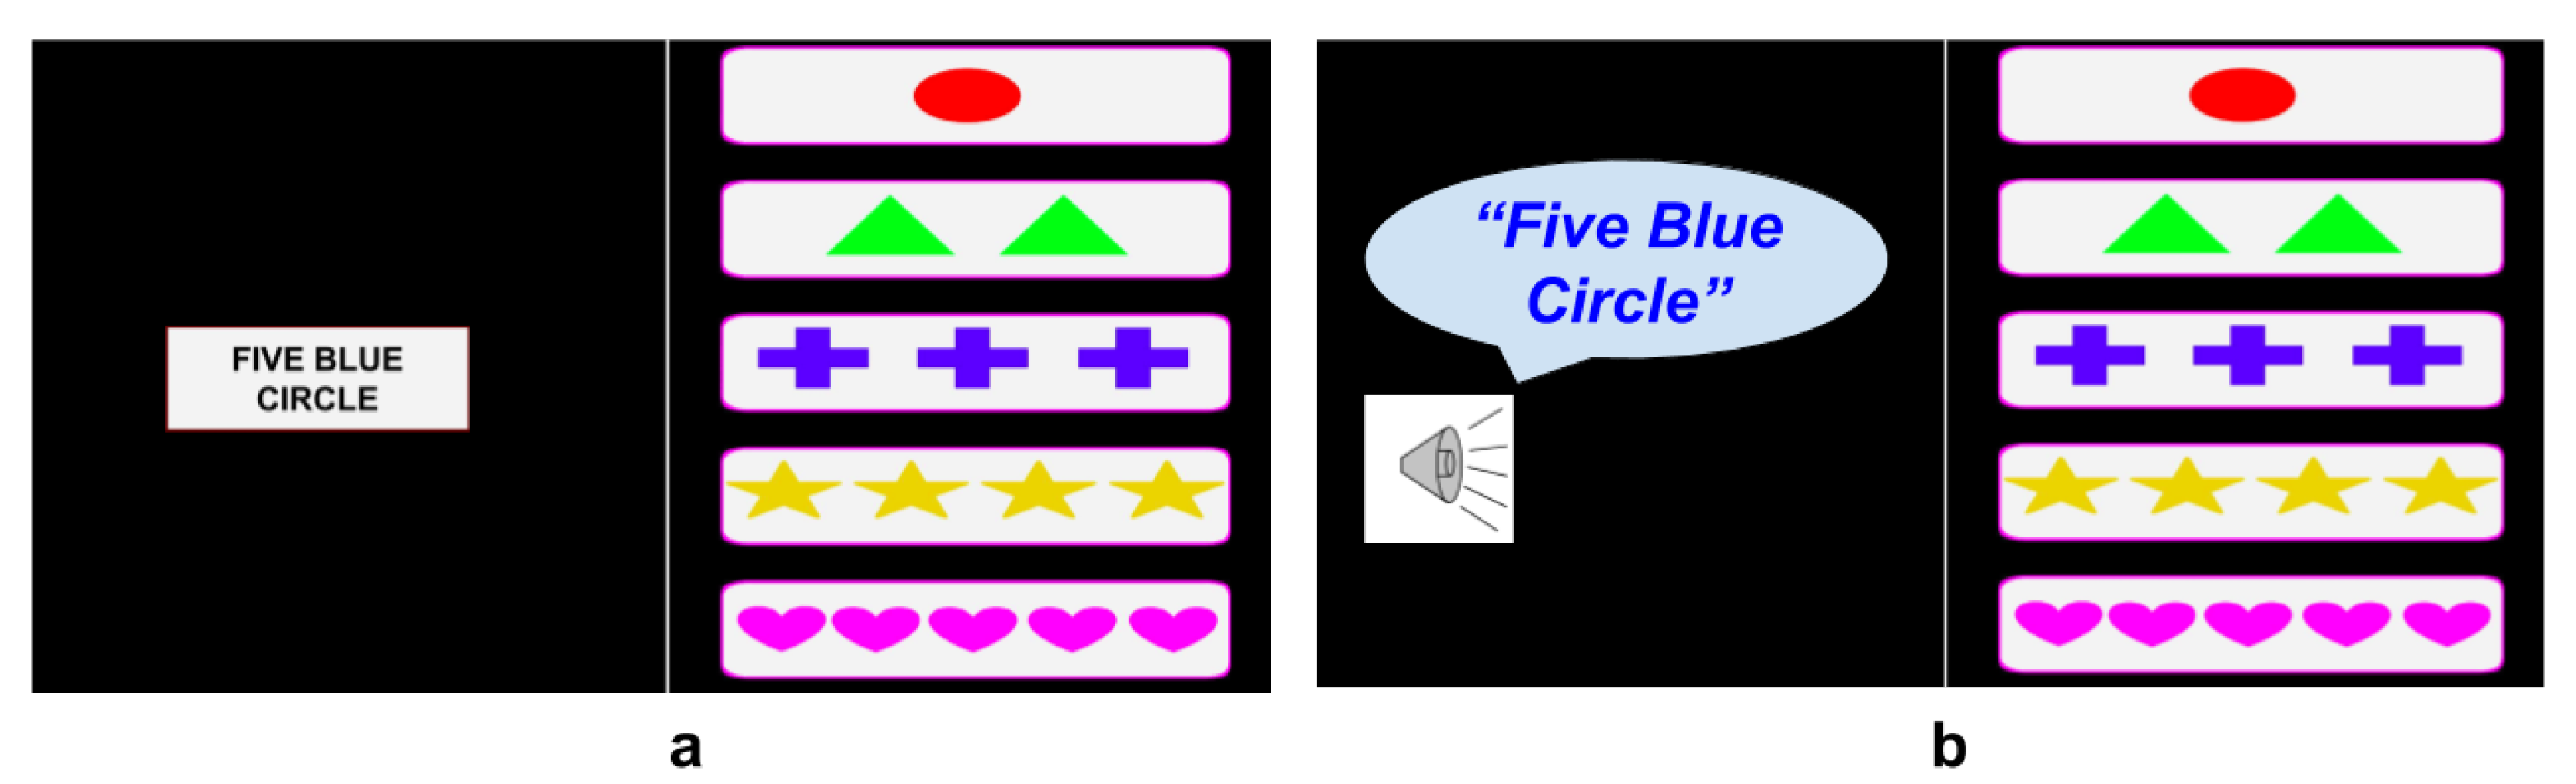
38], towards modeling different aspects of CF and understanding its effects on human behavior and performance. The current implementation provided online offers extensive functionalities compared to the ones used for this analysis. In particular, textual and auditory-based stimuli are available online as extra features/options of our cognitive task. These functionalities contrast with the traditional design of the WCST which is explicitly based on visual stimuli. In the case of textual stimuli, the card that is given to the user is described through text (i.e., one red circle) while in the auditory version the system describes the card through audio. These functionalities are designed to evaluate the user ability to adapt to different types of stimuli. However, this kind of analysis is out of our current scope, and thus, not related analysis is presented here. In
Figure 5 we visualize the textual and auditory-based versions of our cognitive task and in
Figure 6 we show two screenshots of the audiovisual feedback provided at each round to the user by the interface.
5. User Study—Preliminary Analysis
Figure 7,
Figure 8 and
Figure 9 show a cumulative analysis of CF and task performance from versions V1 and V2 of the WCST task.
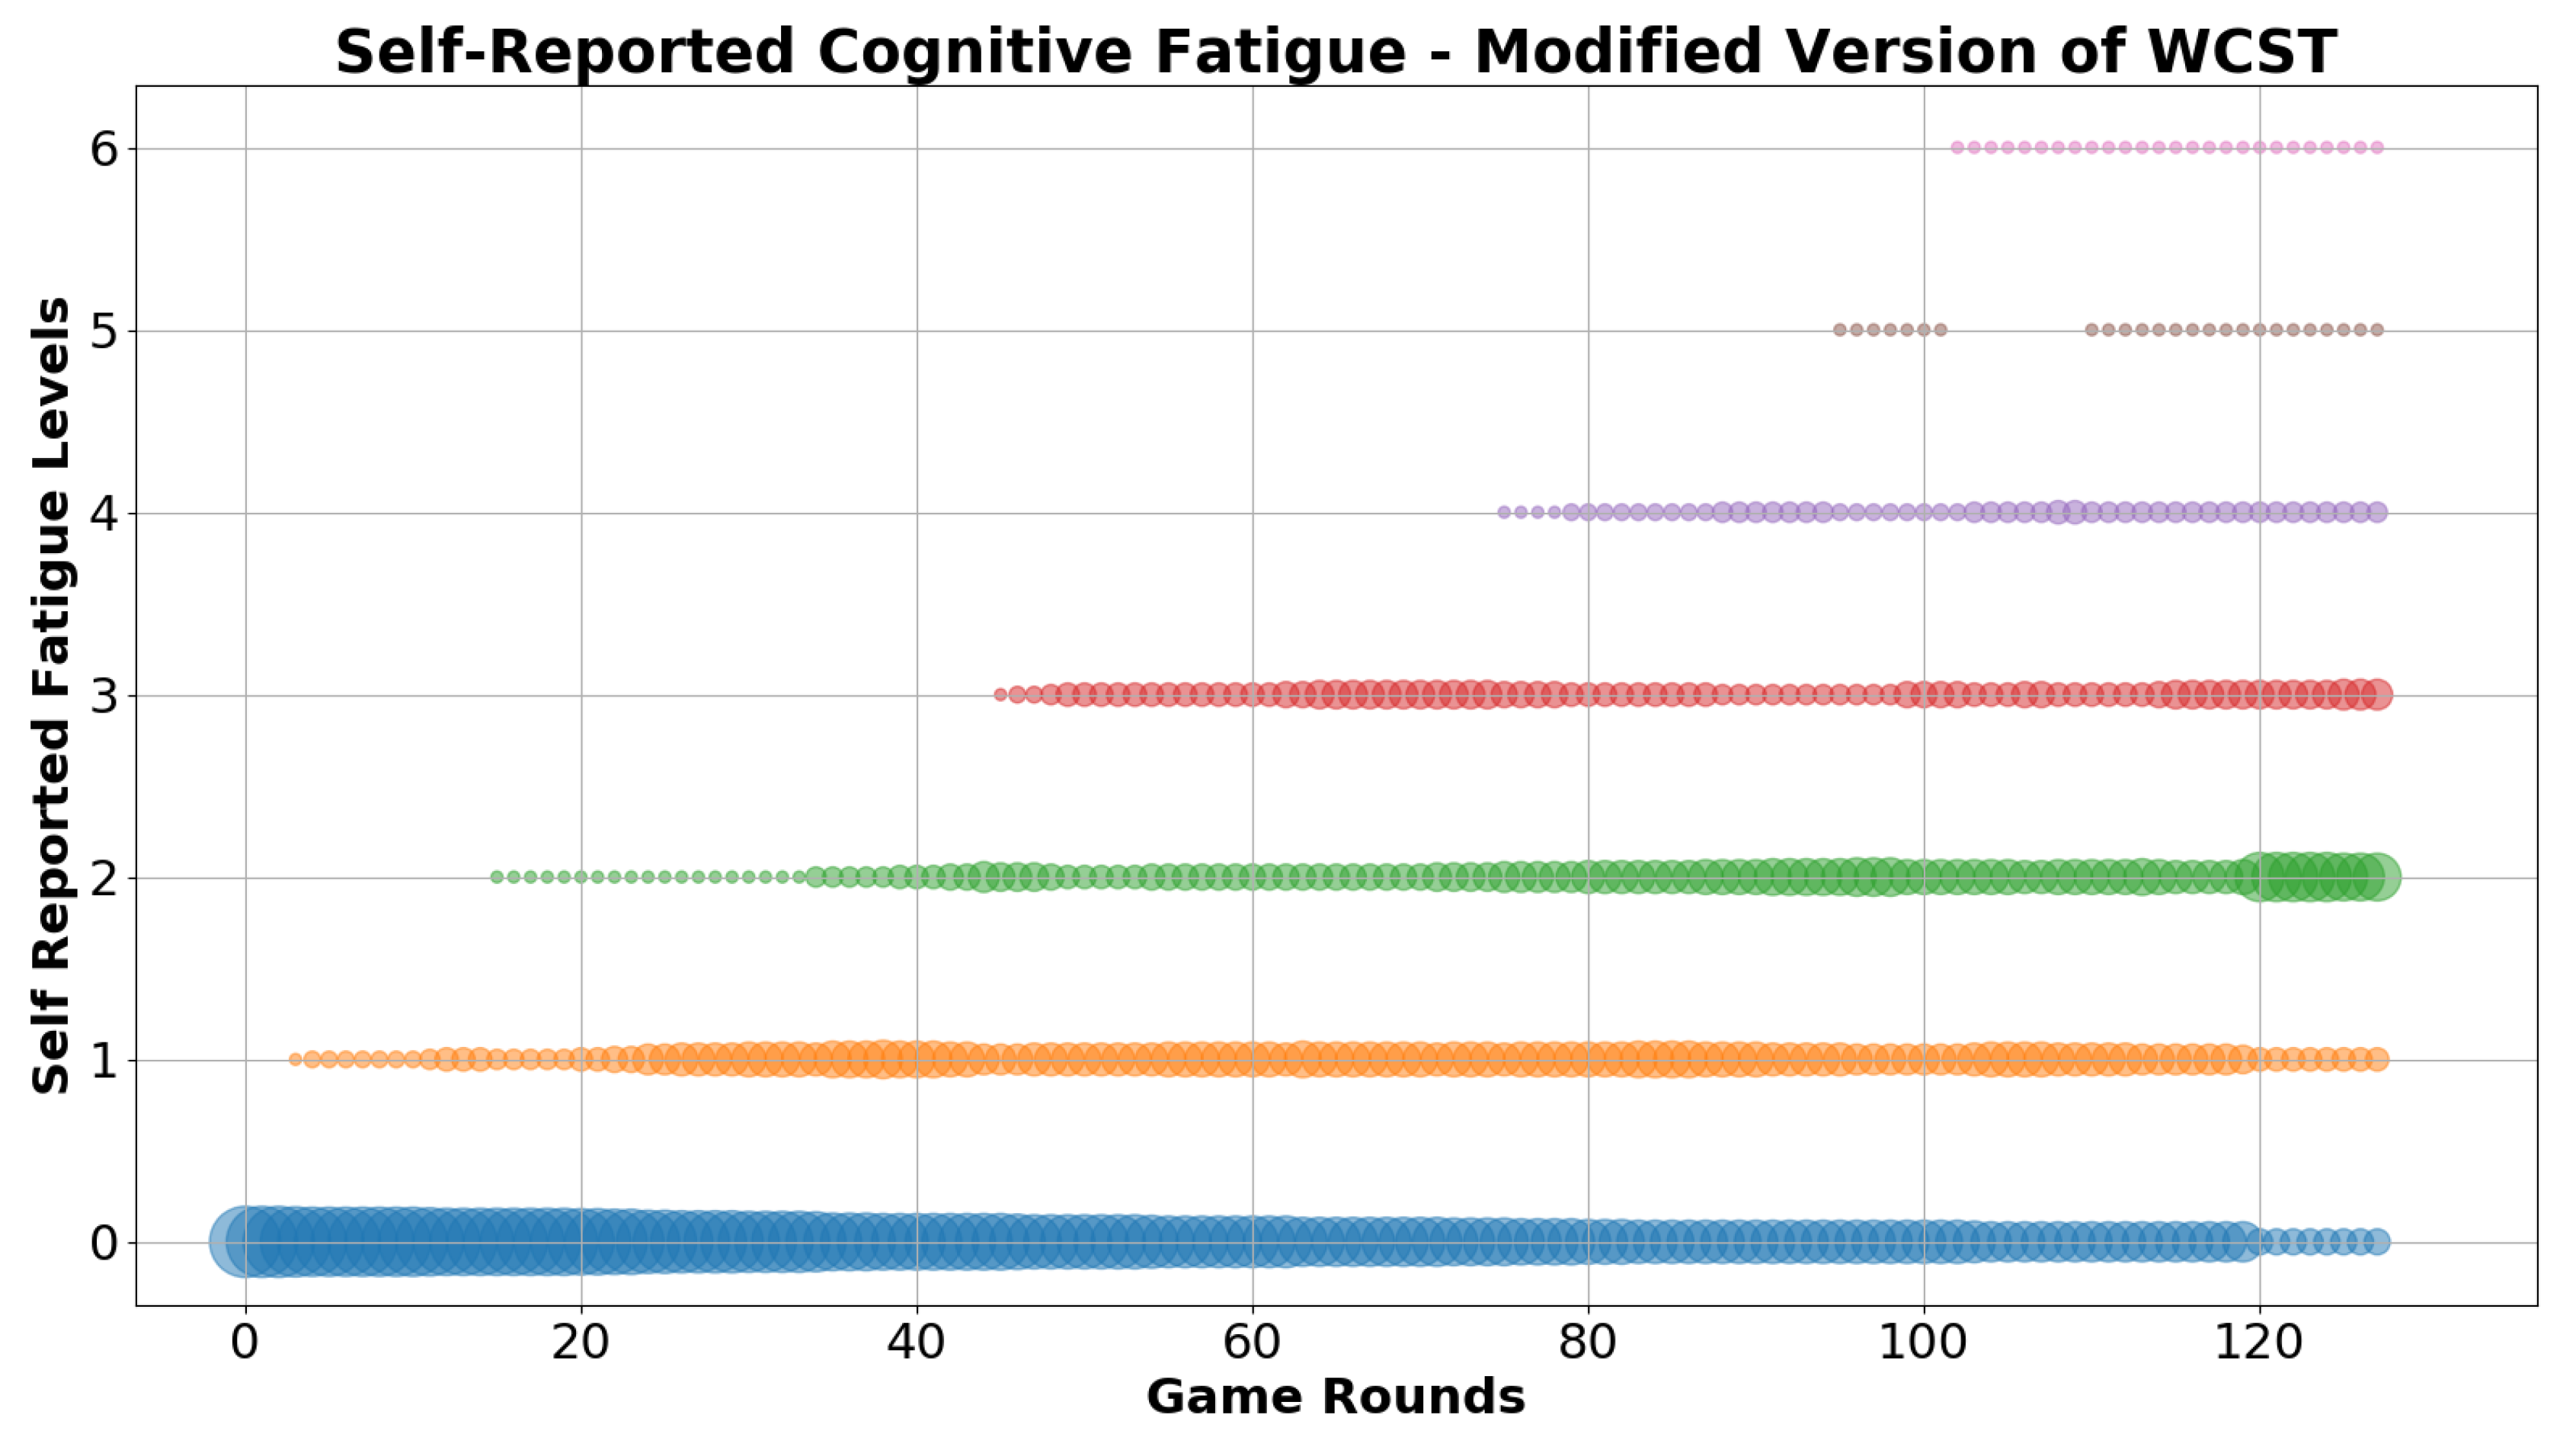
Figure 7 illustrates the levels of CF as indicated by the users when pressing the “FATIGUE” button during the task. The X axis shows the rounds of the game (128 total rounds) and the Y axis shows the levels of CF as described by the total number of button presses by each user. The thicker and denser the line, the larger the group of users it represents. At the beginning of the game, no CF was reported. As the game progressed, more and more users reported signs of CF. By the end of the game, the vast majority of users had pressed the “FATIGUE” button at least once, while the maximum number of times the button was pressed by a user was 6.
The top graph of
Figure 8 illustrates how the percentage of fatigued users increased during the game. According to our data analysis, in 35 out of the 38 different tests of V1 and V2 combined, users reported experiencing at least some levels of CF by the end of the game. This percentage corresponds to almost 93% of the sessions, while the average number of times a user reported fatigue was 2.2 as shown in the bottom graph of
Figure 8.
Figure 9 shows how the average number of perseverative errors increased during a session across all users. On average, each user made 9.3 perseverative errors (with a standard deviation of 2.65). Perseverative errors in WCST can be considered to be the “unwanted” errors. While errors are unavoidable in the game since the users are supposed to learn the correct rule through the feedback, perseverative errors indicate that the user has failed to adjust to the change and keeps making decisions based on the wrong stimuli despite the negative responses provided by the system. An increasing number of perseverative errors in a healthy individual can be considered to be a clear sign of cognitive fatigue.
The user study indicates that the experiment was successful in introducing CF in this group of healthy subjects which could potentially influence user performance. Our initial findings showed that response time did not play an important role in the quality of decision-making. Our future analysis will focus on how user responses on CF are correlated with the actual performance in the task. However, based on the small number of subjects provided by the current version of the CogBeacon dataset no safe generalizations can be drawn for this relation.
6. Predicting Cognitive Fatigue Based on Subjective Reports and EEG signals
Our initial experimentation towards predicting cognitive fatigue was performed based on the EEG signals and the subjective user reports provided during the data collection (by pressing the button). Specifically, we used an approach similar to the one presented in [
23] and we focused on identifying the presence of fatigue in a single round of the described cognitive game.
For the purposes of this study all rounds from all three variations (original WCST, V1, and V2) were combined to form a single dataset for our analysis. All the rounds that were not associated with a “button press” were considered to be NO-FATIGUE samples while all the rest were used to represent the FATIGUE class. No temporal relation across consecutive rounds was considered for these initial experiments.
For modeling the EEG signals we chose to do an exhaustive grid search analysis across all the available feature streams that were captured during the data collection in order to choose the best signal representation (see
Section 4.2.1). According to our analysis the most promising indicators were the feature streams related to the beta 13–32 Hz (b) and gamma 32–100 Hz (g) wavelengths and in particular their absolute (A) and relative (R) values. This finding is in line with the related literature that suggests that beta and gamma waves are highly related to mental states such as alert, normal alert consciousness, active thinking and problem-solving [
34]. More specifically beta waves can be good indicators when someone is active in a conversation or when decision-making and problem-solving takes place while gamma waves can be used as identifiers of heightened perception, or a ’peak mental state’ when there is simultaneous processing of information from different parts of the brain.
6.1. Round Representation and Feature Extraction
To represent the EEG signals within a round in the form of a feature vector we extracted a set of time and spectral features that are known for their capabilities of describing core behavioral characteristics of 1D signals and have been extensively used in other EEG classification tasks in the past [
23,
39,
40]. In particular, the following six features were extracted for a given sequence of EEG measurements within a round of each cognitive game:
Mean Value
Standard Deviation
Maximum Value
Minimum Value
Spectral Centroid
where
N is the size of the spectrum,
X are the observed frequencies and
p(
X) is the probability to observe a specific value in
X. Spectral Centroid represents the center of gravity of the spectrum.
Spectral Rollof
where
X is the spectrum of the signal and
N is the size of the positive spectrum. Spectral Rollof corresponds to the frequency below which 90% of the magnitude distribution of the spectrum is concentrated.
Considering that the MUSE has 4 electrodes in total the final representation for each round was a feature vector of size features.
During experimentation we also evaluated other popular features such as zero crossing rate, signal energy, spectral spread, entropy of energy, and spectral entropy but no significant improvements were observed in the classification results. In particular, in most cases classification performance dropped between 5% to 8% in terms of average F1 when additional features were added.
6.2. Classification Results and Analysis
For classification purposes we experimented with a set of traditional ML classifiers that have been extensively used for modeling problems of similar nature. More specifically, we tried SVMs, SVMs with an RBF kernel (SVMr), Random-Forests (RF), Extra-Trees (ET), and Gradient-Boosting (GB) [
23,
41].
To evaluate our models, we performed a 10-fold cross validation across all the available data provided by the 76 sessions available in the CogBeacon dataset (20% of the sessions for testing and the rest for training). The distribution of samples across the two classes in training and testing varied in each fold based on the total number of times users reported fatigue in the specific sessions that were used for training or testing, respectively. However, in all cases the two classes were highly unbalanced towards the “NO-FATIGUE” class. Hence, in order to efficiently train our classifiers and avoid over-fitting we omitted most of the “NO-FATIGUE” samples to avoid extreme biases and we trained the classifiers on balanced classes, with the total number of samples for each class being equal to the available “FATIGUE” samples in each fold. For example, given a fold i, if “NO-FATIGUE” class had M training samples and “FATIGUE” class had N training samples, with , we randomly removed samples from the “NO-FATIGUE” class so to make both classes have N training samples each. Since for the purposes of this experiments we considered each round of the game as an independent sample (i.e., no temporal relation between the rounds was taken into account) this step of sample removal did not introduce any biases that could affect the outcome nor the performance of our experimental results. For testing we used the original sample ratio so to have a realistic representation of the targeted problem. For the rest of the paper “NO-FATIGUE” class will be represented as NF while “FATIGUE” class as F.
Table 2 depicts the details of the data used for experimentation while
Table 3 shows the best results obtained by the aforementioned classifiers.
Looking deeper into the final results presented in
Table 3 it is observed that despite the simplistic modeling of the problem this preliminary ML analysis can provide very promising results and great insights towards identifying robust CF patterns for the specific task. As highlighted in the previous paragraph, derivatives of gamma and beta wavelengths seem to be the most informative towards identifying intense cognitive effort. Moreover, the relatively high Precision of the NF class achieved by all classifiers indicates that when an algorithm characterized a user as not fatigued there was a big chance (>70%) that the prediction was correct. On the other hand, the comparatively low Precision for the F class ( best is 51% for the RF classifier) indicates that only in 50% of the cases that the algorithm detected fatigue the prediction was in line with the user responses. Judging now according to the Recall scores, it seems that in the cases of RF classifier for the NF class and for SVMs for the F class the algorithms were very likely to capture efficiently most samples belonging in each corresponding class (
70%). Based on these preliminary results we perform a post classification by combining the predictions of all 5 methods by averaging their assigned probabilities for each label. Combining all methods provided an improvement of 2% in terms of average F1 and a 3% improvement in terms of accuracy compared to the best scores reported by the individual classifiers.
The graphs of
Figure 10 show the ROC curves of the combinatory classifier as estimated for each individual fold. ROC curve is a performance measurement for a classification problem at various threshold settings. ROC is a probability curve and AUC represents degree or measure of separability. It indicates how much a model is capable of distinguishing between classes. Higher the AUC, better the model is at predicting F samples as F and NF samples as NF. According to
Figure 10, in 8 out of 10 cases the combinatory classifier was able to successfully distinguish between the two classes in a rate equal or higher to 66% which, is very promising given the difficulty and the ambiguity of the problem. In two cases, Fold-3 and Fold-6, the classifier performed very poorly and failed to provide sufficient separability between ‘FATIGUE’ and ‘NO-FATIGUE’. This indicates that in the sessions used for testing at these folds, users had very diverse behaviors when reporting cognitive fatigue thus, confusing the predictive model. This observation highlights the fact of individual differences and provides a very useful insight for future directions.
These results are very informative about how different traditional ML techniques may behave towards modeling the targeted problem of CF detection and will guide our future directions. In addition, they complement our prior findings on predicting user cognitive performance through EEG, where we used a similar modeling process but for a completely different task related to short-term memory assessment [
23]. Based on these observations, we could speculate that incorporating more user-specific information to our models could prove very beneficial for targeting CF and that is where we plan to draw our attention during the next steps.
8. Conclusions and Future Work
In this work we presented CogBeacon, the first publicly available multi-modal dataset designed for the analysis and prediction of cognitive fatigue. Towards tackling the major problem of reproducibility and limited data availability, along with the dataset we provided free access to the data-collection software, therefore allowing other researchers to expand the current version of CogBeacon and also integrate more sensors in an intuitive way to the back end of the system. These contributions are crucial towards capturing additional sources of information and understanding how CF affects specific aspects of cognitive performance across different users. Current analysis based on the conducted user study and the preliminary results on CF detection indicate the meaningfulness of the dataset and pave the way towards future exploration of CF detection and prediction using machine learning-based techniques.
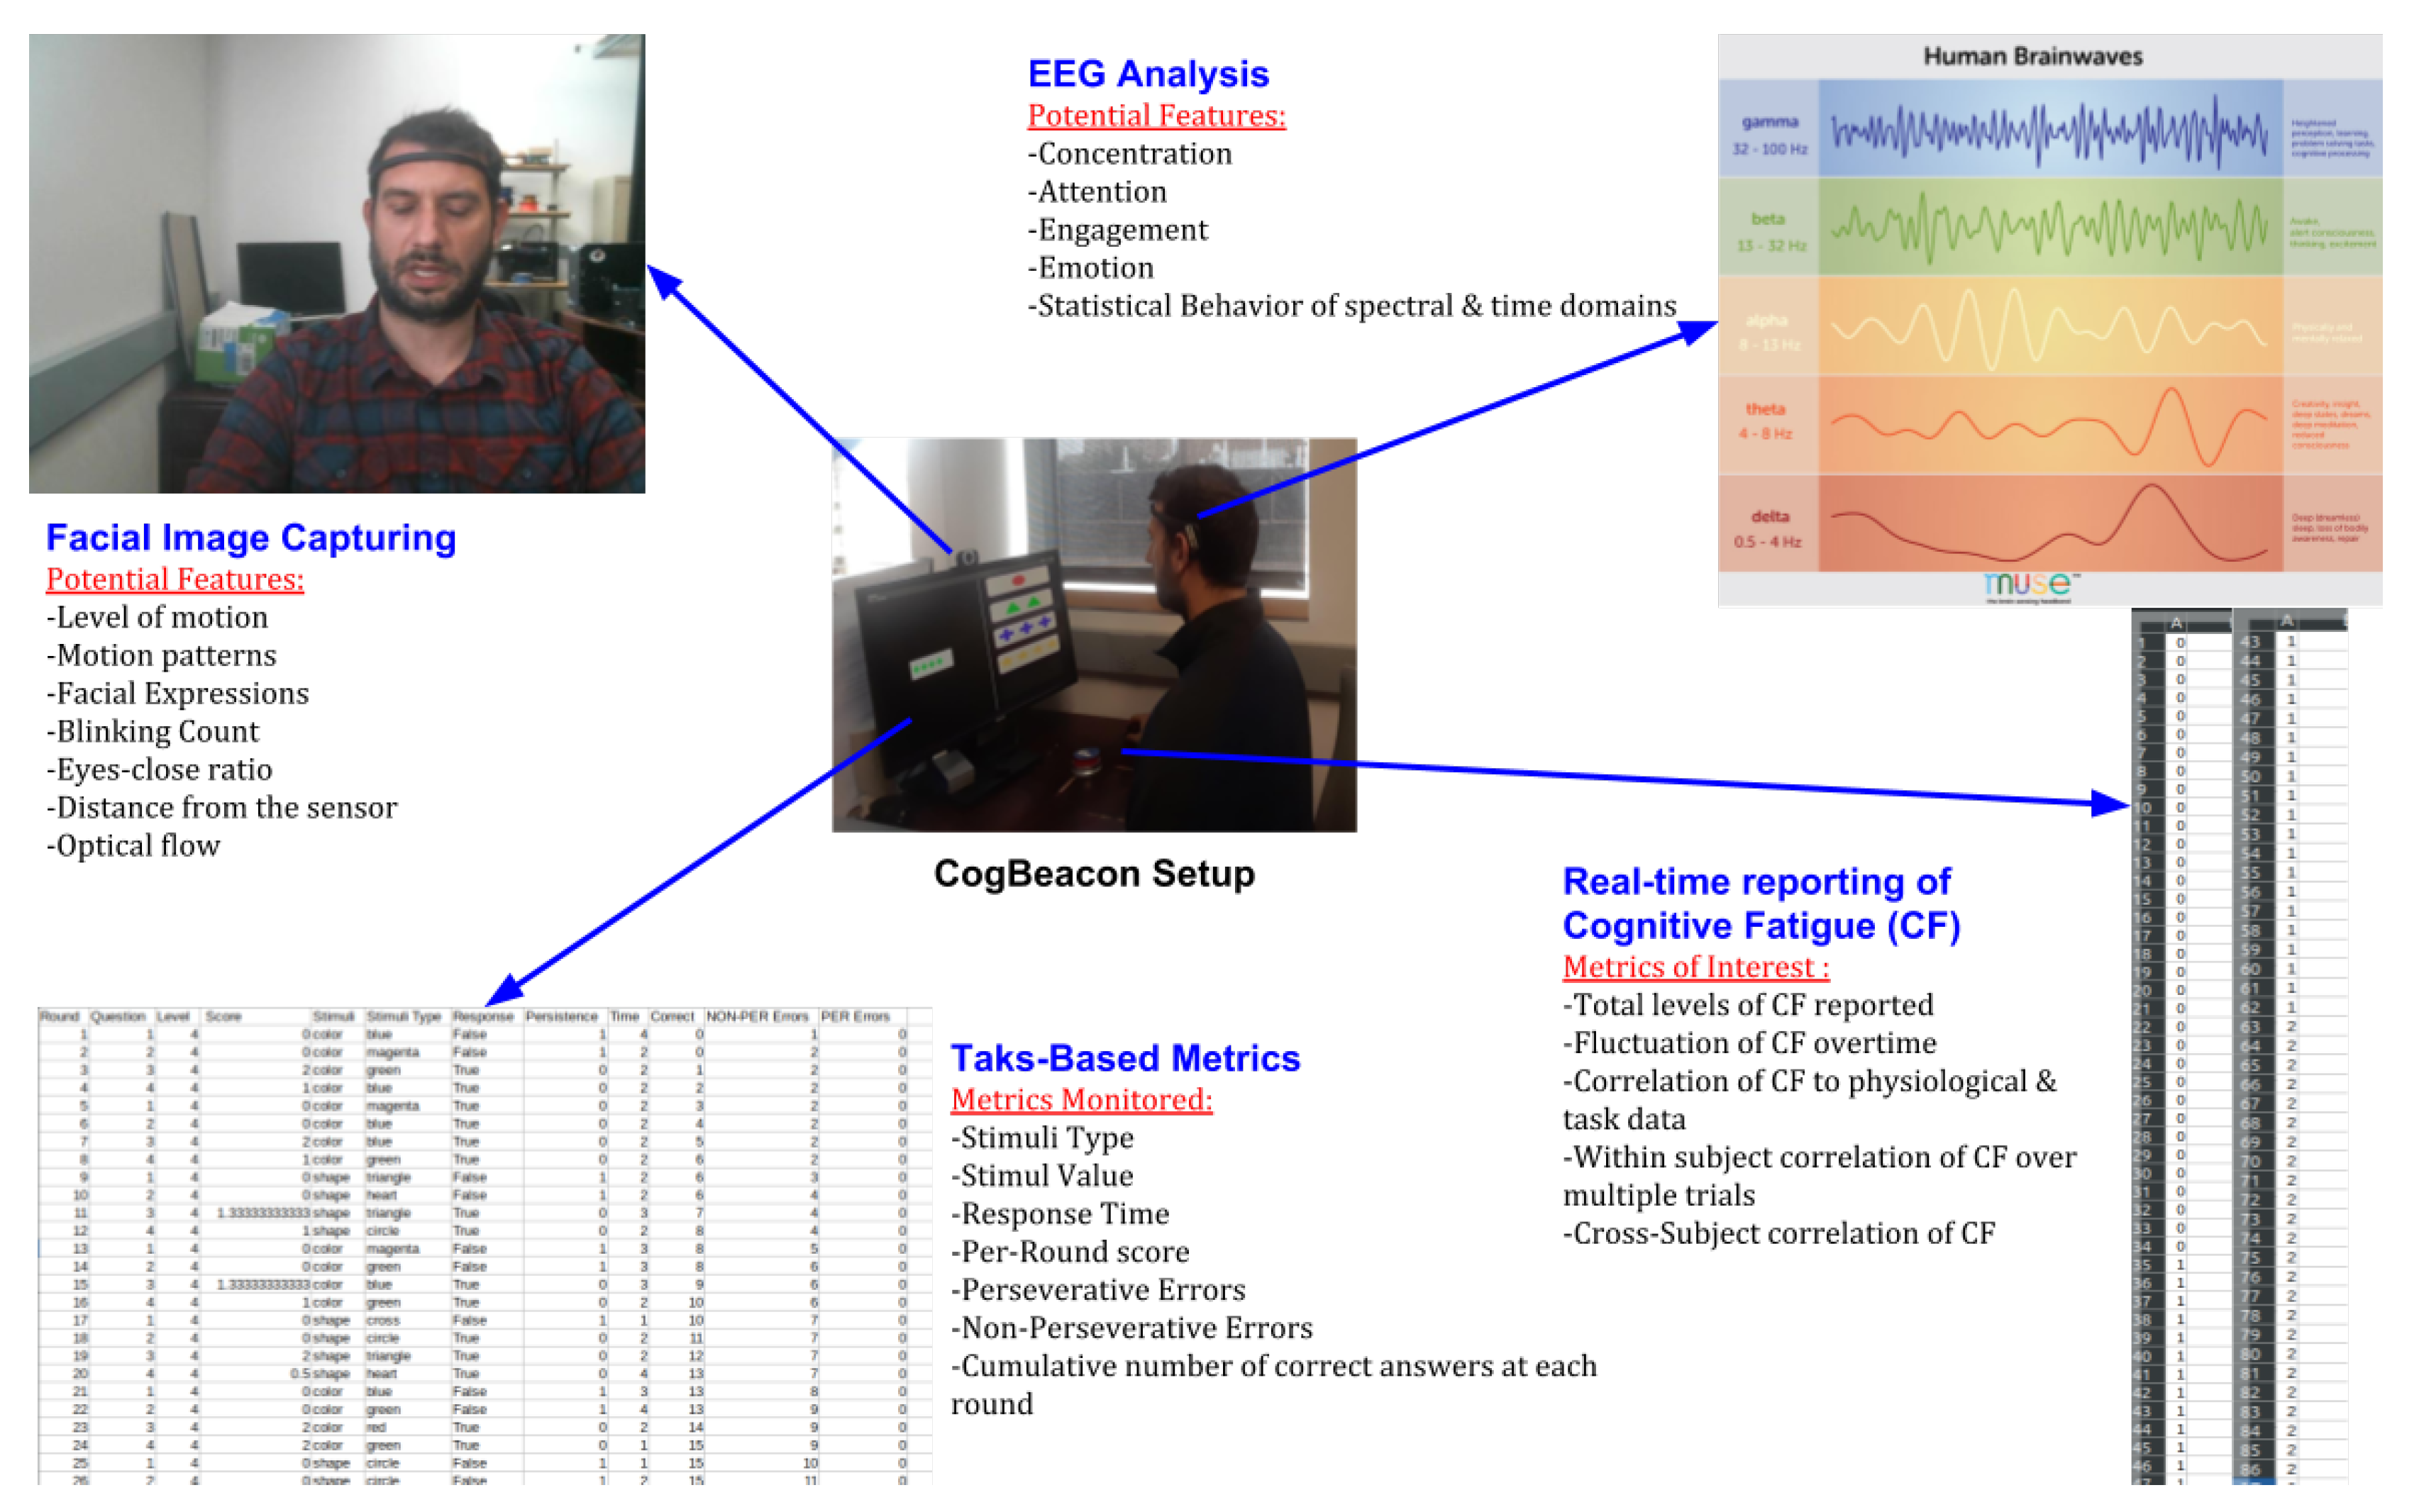
Figure 11 illustrates an overall visualization of the available data collected through CogBeacon along with potential features that can be extracted from the individual modalities. Potential features correspond to properties that can be extracted by the data captured by the system. For the purposes of this study we conducted experiments using only the raw data as described in
Section 4.2.1 and we did not extract any of the features that are labeled as
Potential Features in
Figure 11.
Our initial findings indicate that user reports are critical towards identifying robust patterns of CF across different subjects. However, it seems clear that personalized behavior must be taken into account in the future, towards improving cognitive assessment and creating more personalized and user-centric interaction scenarios.
CogBeacon is still an evolving platform. Our future steps will be focused on four main axes. Firstly, we plan to enrich the current dataset with more subjects. This step would help us depict more generalized patterns of CF and will also help us draw results with respect to the relation of CF to actual task performance. It must be noted that the total number of subjects offered by the current version of the CogBeacon dataset can be considered relatively limited towards verifying critical observations with respect to CF. However, our current experiments clearly highlight the potentials of machine learning towards achieving that goal even on a small amount of training samples. The online data repository offered by CogBeacon (
https://github.com/MikeMpapa/CogBeacon-MultiModal_Dataset_for_Cognitive_Fatigue) aims to motivate other researchers to submit their collected data when using our platform thus, actively contributing to the enrichment of the dataset. Secondly, we would like to enrich CogBeacon with additional data using other sensors and monitoring devices, such as other EEG headsets (EMOTIV, OpenBCI etc.) or GSR, respiratory, and other similar sensors. This, will help our research towards (a) showcasing the hardware-independent properties of the CogBeacon and (b) capturing a greater spectrum of physiological signal responses with respect to CF. In the online repository of the CogBeacon software (
https://github.com/MikeMpapa/CogBeacon-WCST_interface), we provide information on how other sensors can be bound with the system. Moreover, in the future we plan to investigate the potentials of incorporating to our computational mechanism, the information extracted by the facial analysis module towards detecting signs of CF. As a third step, we plan to incorporate more cognitive games that challenge different cognitive functionalities in the data-collection software. This step is critical to understanding how CF affects various aspects of cognitive functioning and will help us create a more robust and standardized framework towards collecting data for CF analysis. Current absence of datasets and standardized methods for collecting multi-sensing data related to CF is probably the number one obstacle in conducting and reproducing experiments in this field of research and CogBeacon’s primary goal is to address this resource gap. Finally, we plan to experiment with more sophisticated modeling techniques by incorporating additional personal characteristics of the user during interaction. Such characteristics could stem either from the analysis of behavioral patterns extracted from the camera such as levels of motion, user emotion etc., or metrics related to user performance in the cognitive task (such as reaction time).


