1. Introduction
With rapid progress in hardware and wireless technologies, a large number of mobile applications with substantial resource consumption (in terms of memory, GPU and CPU usage) have been developed and installed in mobile devices. The usage of these applications facilitates daily life and improves the user experience (UX) of the products [
1]. The definition of user experience, as outlined by the International Organization for Standardization, is a “person’s perceptions and responses resulting from the use and or anticipated use of a product, system or service”. Or, more simply, user experience is how you feel about every interaction you have with what is in front of you in the moment you are using it.
As one of the most important user experience aspects of mobile phones, mobile phone fluency has been paid more and more attention by mobile phone manufacturers and users. It is also one of the important parameters for consumers to choose mobile phones. Conventionally, loading time (including initiation of an App and preparation for relevant functions, i.e., camera focalization) is recognized as an important feature of the machine’s performance [
2,
3,
4] and parameter of mobile phone fluency. If the length of waiting time exceeds threshold limit value of user’s waiting time, users will be bored, anxious, grumpy and so on, and their ratings of product satisfaction will be greatly reduced. Loading time is essential to current mobile terminals; a mobile terminal or application demanding a longer time to respond may be detrimental to the UX [
5,
6].
It is infeasible to perpetually reduce the loading time of mobile devices by using the most advanced hardware because it will drastically increase the cost to manufactures [
7]. Moreover, reducing loading time may not perceptible by users due to functional sensory limits [
8], the speed and architecture of the neural network [
9] and the number of distinct incidents that the brain can simultaneously process [
10]. Furthermore, the perceptive threshold depends on many subjective factors such as individual background [
11,
12] and emotion [
13]. Environments and scenarios also drastically influence human perception [
14]. Therefore, the perception of time has attracted many studies on product design and the optimization of the human-machine interaction.
Subjective satisfaction with loading time is an essential component of evaluating the performance of mobile devices, but very few reports on the subject have been published. Zhao et al. [
15] recently investigated the perceptions of different loading types using a 19-inch LCD monitor. These authors found that adding an animation during loading prolonged the estimated duration and lowered the users’ evaluation of speed and satisfaction. However, human interaction with a PC monitor is completely different from that with a mobile phone screen (for example, the size and resolution of the screen and the operation with a mouse or finger). As such, it is necessary to analyze satisfaction with loading time using realistic mobile products.
Researches based on subjective perception for UX experience and mobile design have attracted more and more attention in the existing documents and literature, but the research on product design and optimization of the human-machine interactions, especially of App loading time, are rather lacking. From the angle of the human-machine interaction, the article presents a study that evaluates satisfaction with loading processes during human interactions with mobile devices. This is an innovative study to investigate human perception in terms of loading time for critical scenarios using a realistic mobile device. Further, in this work, we explore the impact that animation effect design of loading on user’s perception to probe into mobile design. The presented methodology and tools could be used to analyze the loading time of different mobile terminals and will benefit mobile manufactures as well as App developers.
2. Materials and Methods
2.1. Identification of the Concerned Scenarios
Internet searching was conducted with the 12 largest mobile forums in China (
http://bbs.cnmo.com/,
http://bbs.zol.com.cn/,
http://bbs.gfan.com/,
http://bbs.hiapk.com/,
http://lt.imobile.com.cn/,
http://bbs.it168.com/,
http://cn.club.vmall.com/forumall-1.html,
http://bbs.smartisan.com/forum.php,
http://www.oneplusbbs.com/,
http://www.galaxyclub.cn/,
http://bbs.xiaomi.cn/,
http://www.oppo.cn/). The searching keywords were: 慢 (slow), 卡顿 (lagging), 流畅 (fluent), 死机 (freezing), and 不灵 (does not work). The results within 12 months (1 January 2017 to 1 January 2018) were collected for analysis. An in-house web crawling tool was used for web searching. The searching ability of this tool was verified manually. The number of effective messages was 5339. Two independent operators allocated the effective messages into 14 major categories and 58 secondary categories (
Table S1). A referee was added to categorize the messages if the two operators were in conflict.
Based on the survey results, the secondary categories, with the number of complaints exceeding 5%, were selected for further investigation, i.e., initialization for the dialer and WeChatTM (a social App) as well as the focalization of the camera.
2.2. Determining the Performance of the Contemporary Products
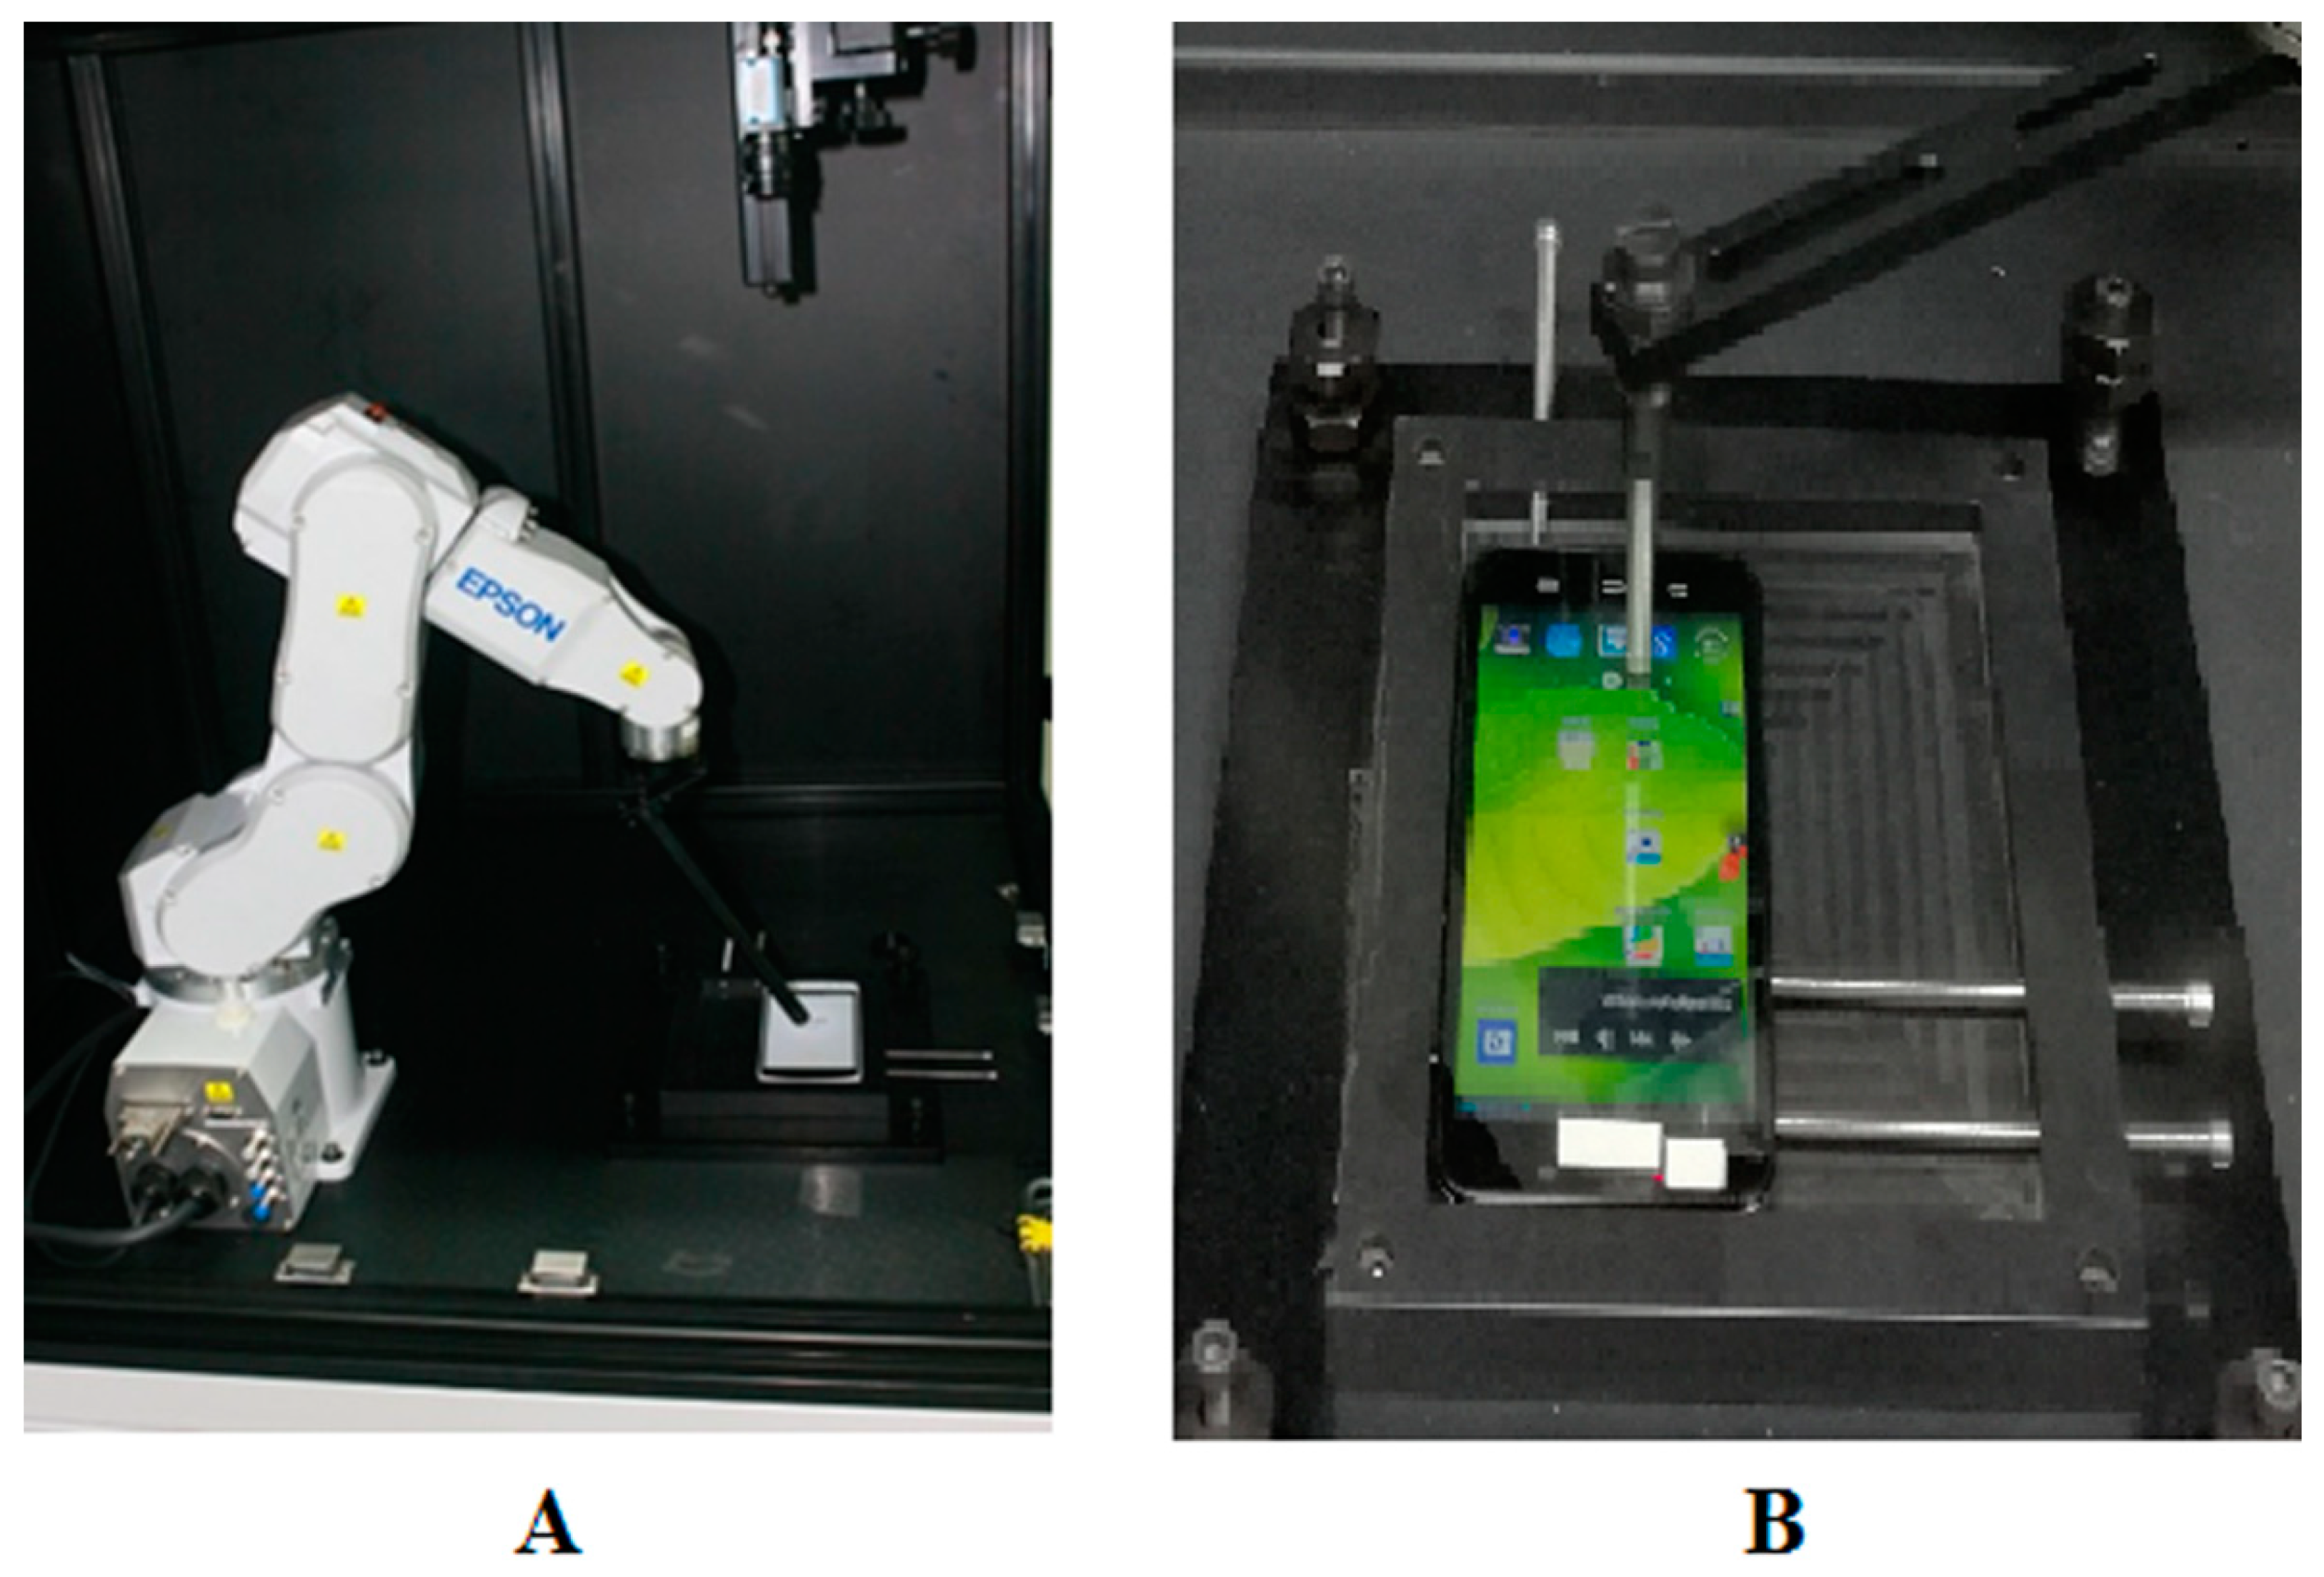
The subjective evaluation of loading time should ensure that the surveyed parameters are technically attainable and preventative. Therefore, we selected the ten best-selling mobile devices for evaluation (the types of mobile devices are not disclosed to protect commercial interests). A robotic arm (C4 6-axis, Seiko Epson, Nagano, Japan) with a high-speed camera (FASTCAM Mini UX100, Photron, Tokyo, Japan) was used to measure loading time. The measurement system was installed in a darkroom, and all the experiments were performed on an anti-vibration table. The repeatable precision of the robotic arm was 0.02 mm. By the configurations, the change on the screen of the mobile device was detected with a time resolution of 1 ms.
The control system was programmed with C#. The measurement setup and the control window are shown in
Figure 1A. A pointer was carried by the robotic arm to touch the screen of the mobile phone. Changes on the screen of the device being tested were captured to determine the loading time.
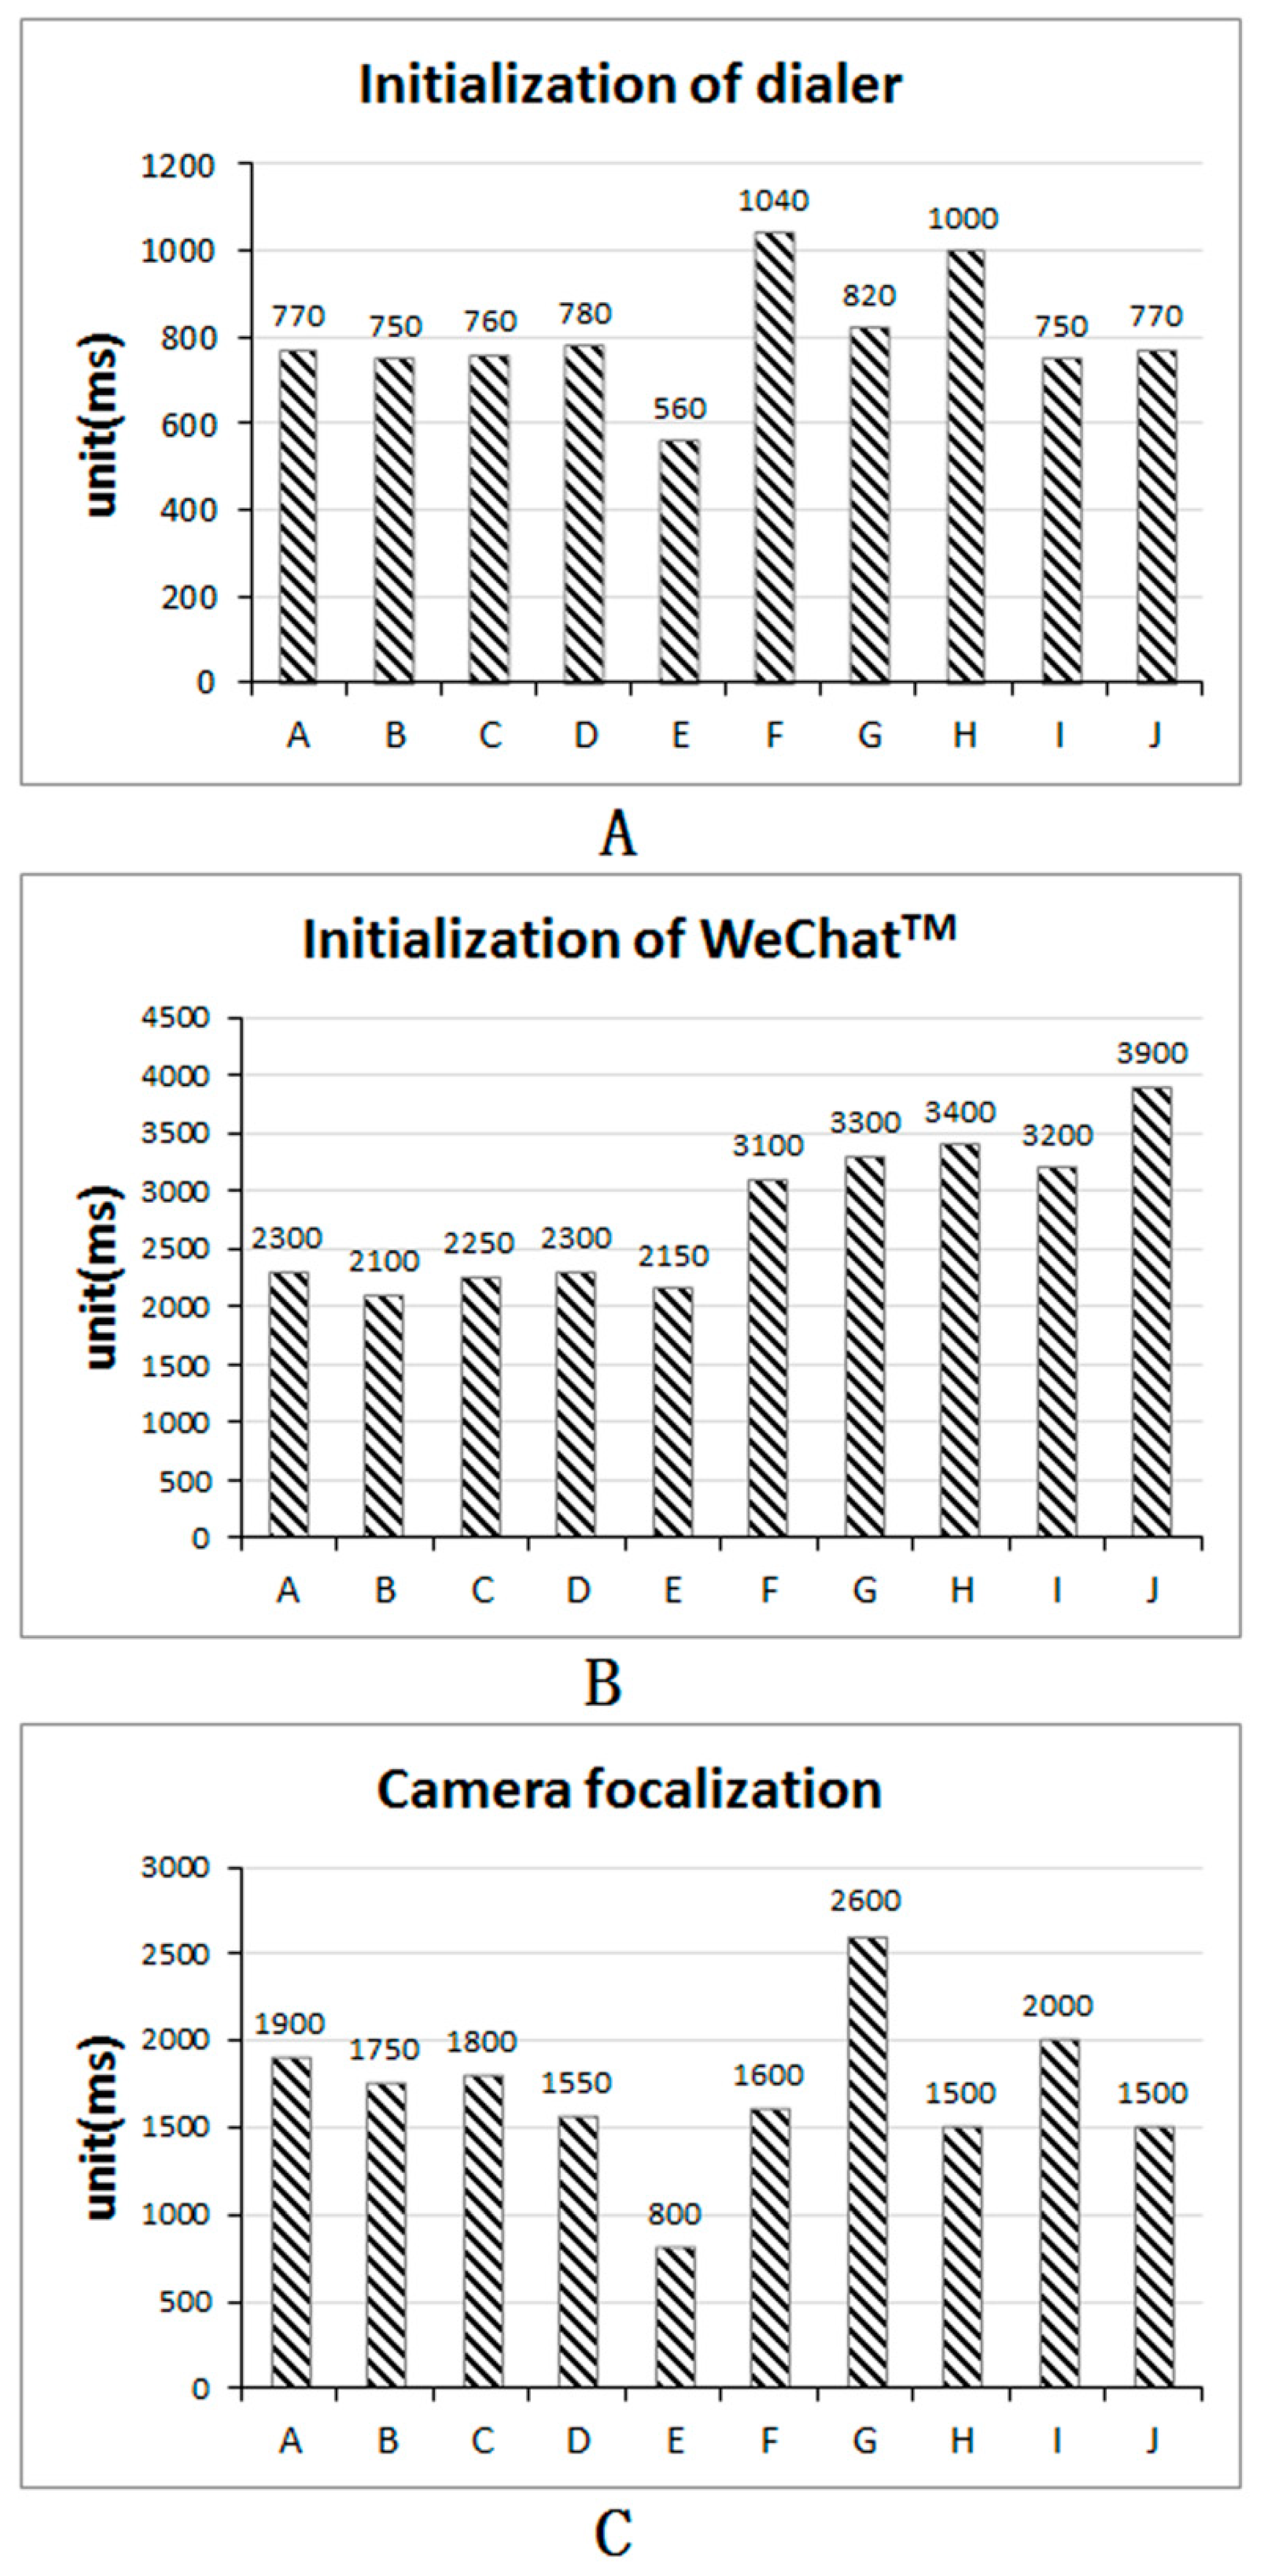
The measured values for the phones are shown in
Figure 2. The minimum, mean and the maximum loading time intervals were used for the experiments.
2.3. Developing the High-Fidelity Models
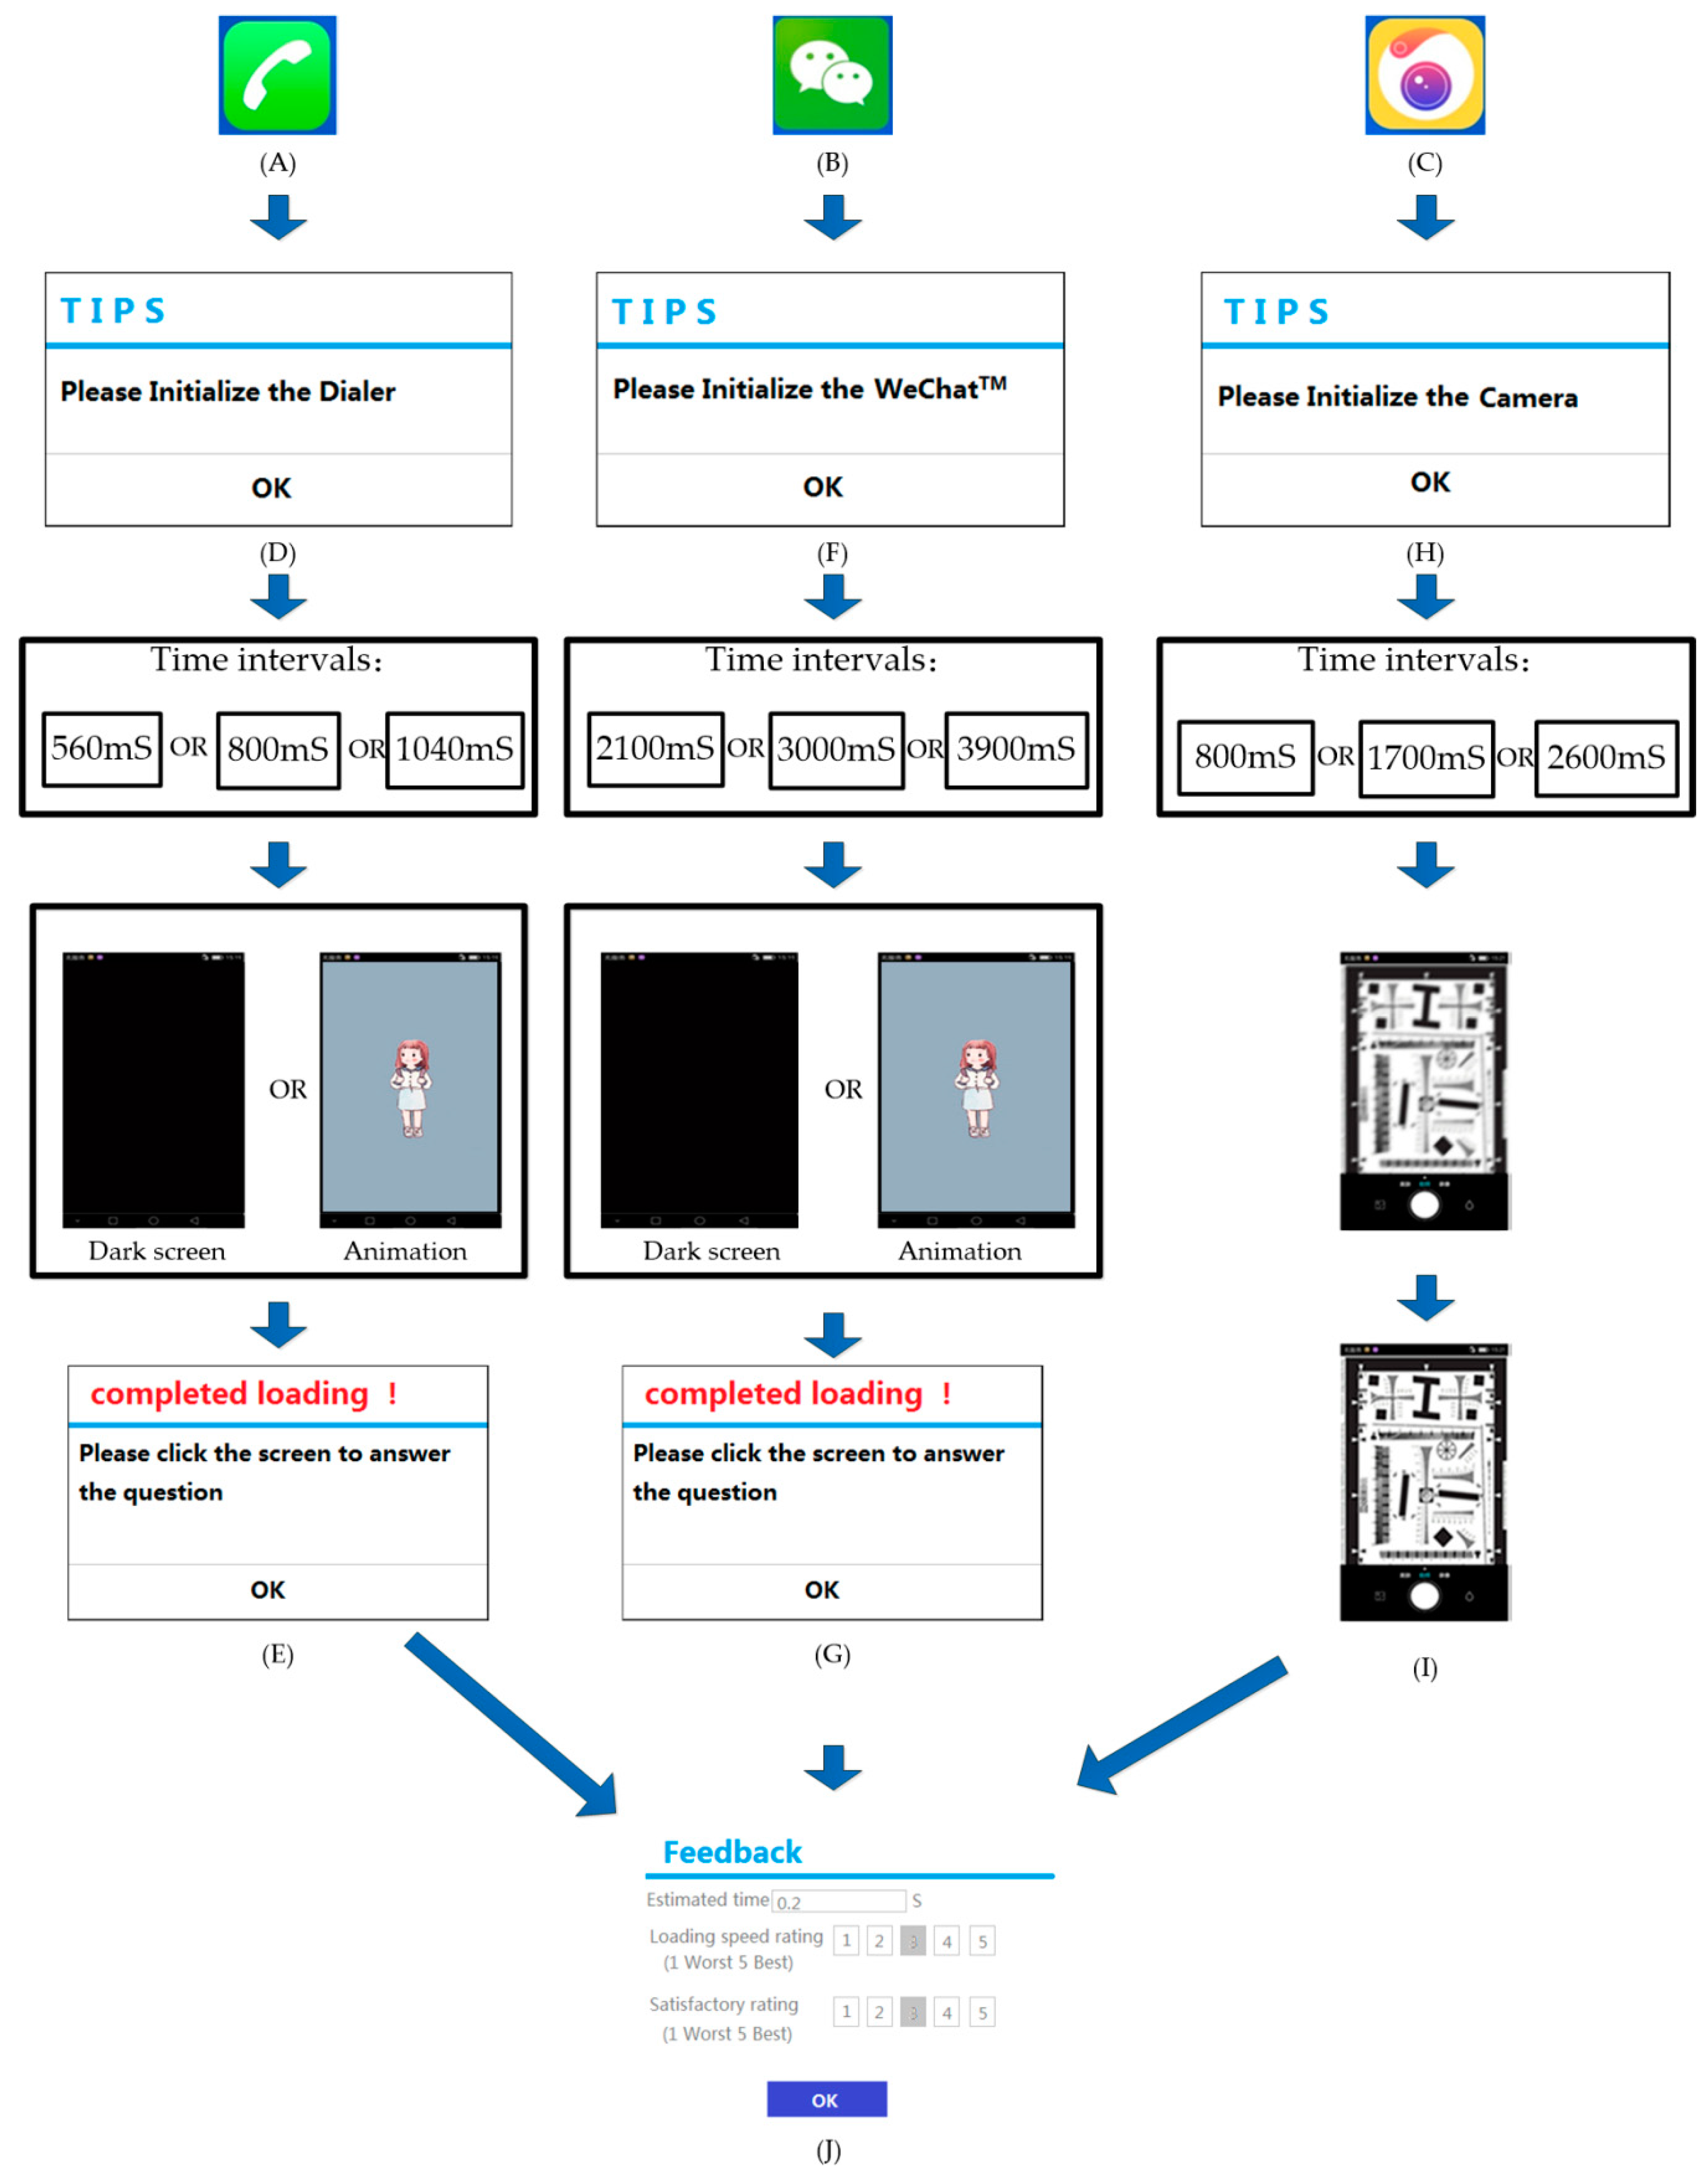
The high-fidelity models replicated the dedicated scenarios so that the subjects could perform according to a predefined and repeatable time delay. We developed three high-fidelity models to mimic the human-smartphone interaction. The high-fidelity models were programmed by JavaScript. All the models are compatible with Android OS v6.0 and previous versions. The icons of the three models are shown in
Figure 3A–C.
The specifications for each scenario are presented as follows:
Initialization of the dialer. By touching the icon, a pop-up indicator (
Figure 3D) instructed the users to touch the icon of the dialer and start the loading process. The loading transition was featured with an animation effect (as shown in
Video S1 file) or the effect of a dark screen. Upon completion of loading, a pop-up indicator instructed users to score the loading time and the overall loading process (
Figure 3E). The loading times were 560, 800 and 1040 ms.
Initialization of WeChat
TM. By touching the icon, a pop-up indicator (
Figure 3F) instructed the users to touch the WeChat
TM icon and begin the loading process. We also set two effects, animation (
Supplementary Video S2 File) or a dark screen, for the loading transition. The time intervals were 2100, 3000 and 3900 ms. Upon completion of loading, a pop-up indicator instructed the users to score the loading time and the overall loading process (
Figure 3G).
Focalization of the camera. After touching the icon, a pop-up indicator (
Figure 3H) instructed the users to touch the camera icon and start the focalization process. The focalization time intervals were set to 800, 1700 and 2600 ms. We used the figure from the ISO 12,233 resolution chart (ISO/TC WG18, 2000). By coarsely sampling its resolution, the transition from blurring to distinctiveness was recreated (
Figure 3I). The animated focalization process is visualized in
Supplementary Video S3 File.
After each experiment, the subjects were asked to score (
Figure 3J), on a 5-point Likert scale, how quickly time seemed to pass (with 1 = extremely slowly, 3 = normal, and 5 = very fast) and the degree of satisfaction (with 1 = dissatisfactory, 3 = medium, 5 = satisfactory). A satisfactory rating may include but is not limited to loading time, rending effect and animation.
2.4. Subjects
Sixty-seven subjects were enrolled by university Bulletin Board System (BBS). A telephone interview was conducted to screen for candidates with alcohol, nicotine and caffeine addictions to eliminate fine experimental deviations caused by addictions. The selected subjects were 25.5 ± 4.53 (mean ± standard deviation) years old, who were active mobile phone users. Among them, 39 subjects used Android phones, and 28 subjects used iOS phones. Users of two operating systems with evaluation parameters can exclude the impact of the operating system on the results. There were 34 students (17 male and 17 female, 24 Android users and 10 iOS users) and 33 workers (17 male and 16 female, 15 Android users and 18 iOS users). Educational background parameters exclude the influence of educational background on results. The selected subjects used mobile phones for 2-4 h per day. The subjects reported having good sleep quality the day before the test. All subjects provided written informed consent prior to the experiment and were paid 200 Yuan for their participation. The research was approved by the academic review board of China Academy of Information and Communications Technology (CTTL-18004). The written informed consent was obtained from all subjects after the experimental procedure had been fully explained. All of them provided written consent before the experiment. The design of the experiment complied with the Declaration of Helsinki.
2.5. Experiments
To obtain a representative result, each case (three scenarios, two loading types as dark screen and animation, and different time intervals) was repeated twice in the test, and the scores were averaged. Therefore, the subjects were supposed to provide scores for (2 × 3 + 2 × 3 + 3) × 2 = 30 cases. The sequence of cases was randomly selected, but the consecutive cases were obtained from different scenarios.
The high-fidelity models were installed in 3 mobile phones of the same type (Display size: 5.2 inches, Resolution: 1080 × 1920 pixels, Display type: Super AMOLED capacitive touch screen, 16 M colors, 8-core CPU: 4 × 1.5 GHz Cortex-A53 & 4 × 1.2 GHz Cortex-A53, GPU: Adreno 405, Chipset: Qualcomm MSM8952 Snapdragon 617, OS: Android OS, v6.0, Memory: 64 GB andRAM:4 GB RAM, specific type anonymous to protect commercial interests), which were distributed to the subjects for the test. A 3min pause was allowed for the subjects every 20 min. The entire test for one subject lasted approximately 40 min.
2.6. Statistical Analysis
Subjective estimates for the initialization of dialer and WeChatTM were subjected to 2 × 2 × 3 × 2 × 2 (gender × loading type × loading time × occupation × operational system) repeated measures analyses of variance (ANOVAs). The analysis for camera focalization was subjected to 3 × 2 × 2 (loading time × occupation × operational system) ANOVAs. Greenhouse-Geisser adjustment was applied to correct the degrees of freedom if the assumption of sphericity failed (by Mauchley’s test). Upon detection of a significant difference, a Bonferroni correction was applied to minimize the likelihood of a type I error. SPSS 21.0 (IBM, Endicott, NY, USA) was used for statistical analysis in the study.
3. Results
3.1. Initialization of the Dialer
3.1.1. Scores on Loading Time
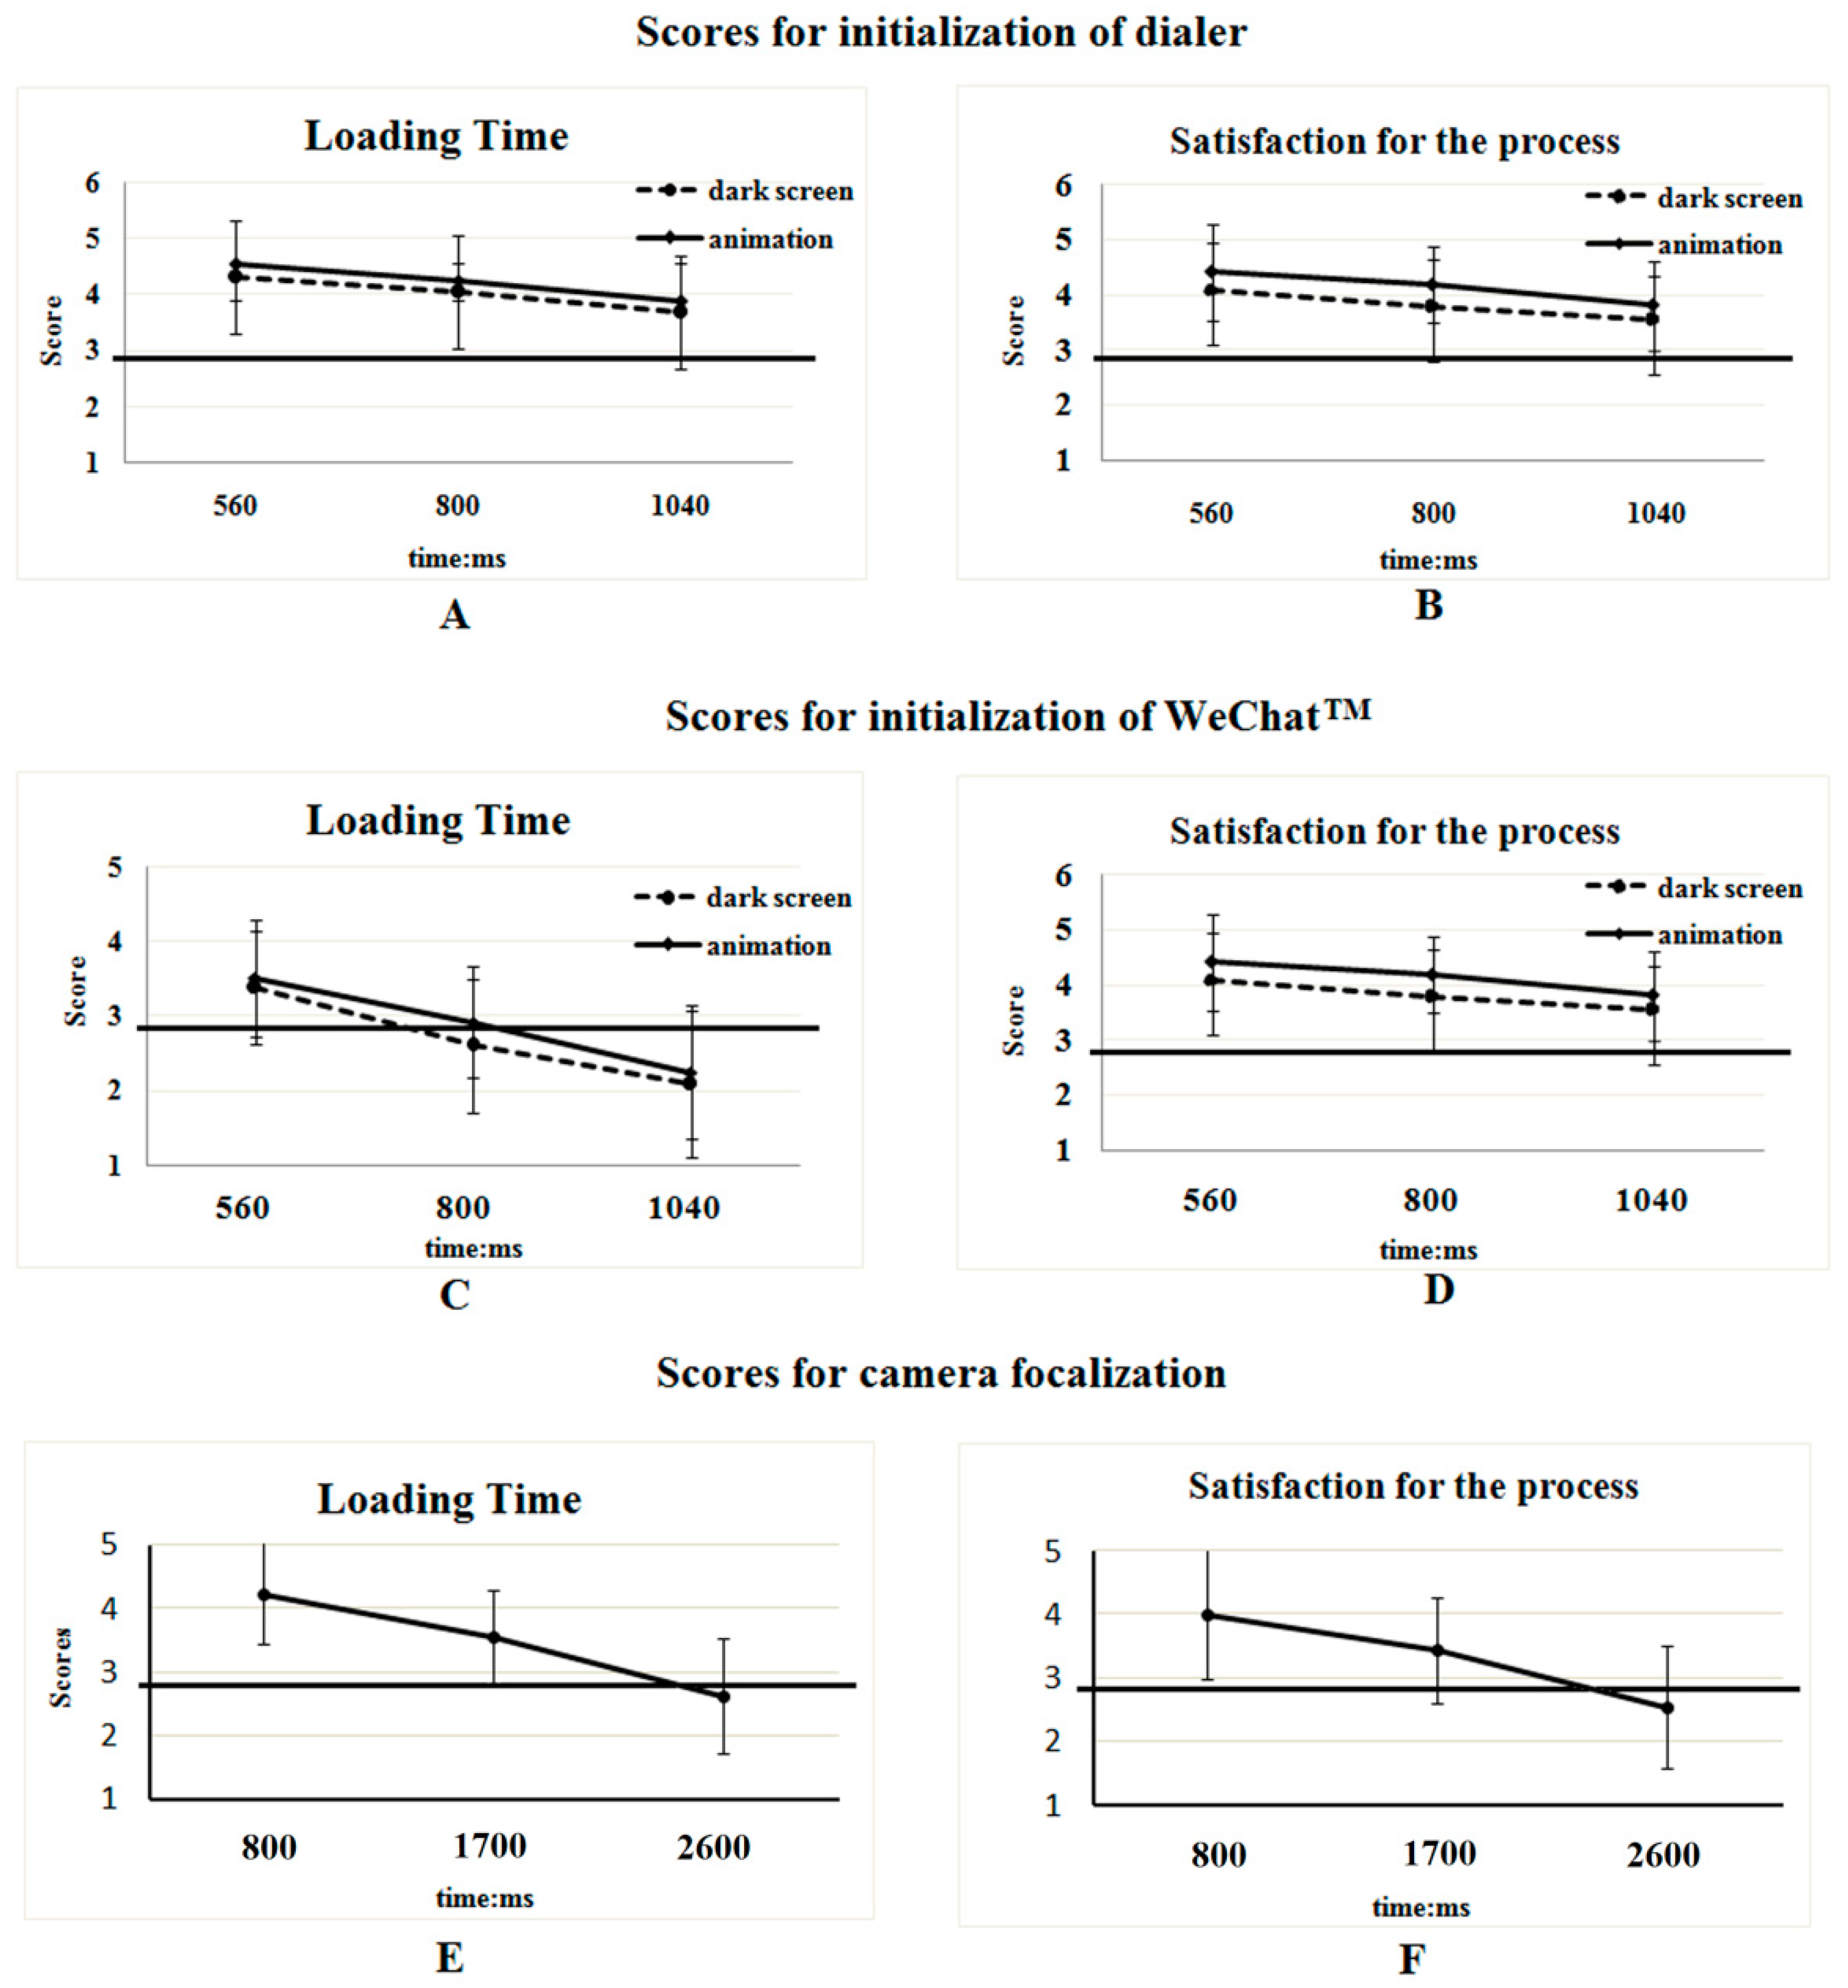
A significant difference was found for the interaction of gender × occupation × loading type (F = 4.353, p < 0.038). There was a significant difference in the factors of loading time (F = 29.726, p < 0.001) and loading type (F = 9.826, p = 0.002). A post hoc test demonstrated that the average rating on the case of 560 ms was significantly higher than that in the case of 800 ms, which was significantly higher than in the case of 1040 ms. Animation was rated significantly higher than the dark effect.
3.1.2. Satisfaction of the Process
A significant difference was found for the interaction of gender × occupation × loading type (F = 3.359, p = 0.029). Scores on the effects of loading time (F = 16.927, p = 0.001) and loading type (F = 12.570, p = 0.001) were significantly different. A shorter loading time and animation received significantly higher scores.
3.2. Initializing WeChatTM
3.2.1. Scores on Loading Time
A marginal difference was found for the interaction of gender × occupation × operation system × loading time (F = 3.085, p = 0.047). A significant difference was found for the interaction of operation system × loading type (F = 6.962, p = 0.009). The cases with animation always received higher scores than the cases with the dark screen (F = 8.441, p = 0.004). Android users reported higher ratings than iOS users (F = 37.877, p < 0.001). A significant difference was found for the factor of loading time as well (F = 86.229, p < 0.001). The post hoc test revealed that the rating on 2100 ms was higher than in the case of 3000 ms, which was higher than in the case of 3900 ms.
3.2.2. Satisfaction of the Process
A significant difference was found for the interactions of gender × occupation × operation system × loading type (F = 5.933, p = 0.015), occupation × operation system × loading type (F = 5.779, p = 0.017), operation system × loading type (F = 7.509, p = 0.006), occupation × loading type (F = 5.750, p = 0.017) and occupation × operation system (F = 7.861, p = 0.005). Students gave significantly lower scores than did the workers (F = 10.193, p = 0.002). iOS users had lower ratings compared with the Android users (F = 19.912, p < 0.001). The loading time length significantly influenced the satisfactory scores (F = 68.197, p < 0.001). The post hoc test revealed that the scores for the case of 2100 ms were significantly higher than those for the case of 3000 ms, which were significantly higher than those for the case of 3900 ms. The animation effect received higher scores than the dark screen effect (F = 29.070, p < 0.001).
3.3. Camera Focalization
3.3.1. Scores on Loading Time
A significant difference on loading time was detected (F = 71.481, p< 0.001), and the post hoc test showed that scores were significantly higher in the following order: 800 ms> 1700 ms> 2600 ms.
Male subjects had slightly lower scores compared with those of the female subjects (
Table 3) but without a significant difference.
3.3.2. Satisfaction of the Process
A significant difference of time length was detected (F = 42.918, p < 0.001), and the post hoc test showed that scores were significantly higher in the following order: case 800 ms> 1700 ms> 2600 ms.
No trend was identified between male and female participants.
4. Discussions
With increasingly resource rich of mobile devices, fluency remains a significant challenge. Three reasons may be responsible. First, hardware cost limits manufacturers’ unlimited investment in the pursuit of fluency. Second, network latency resulting from the limitations of mobile cellular technology. Third, increasingly graphics and media-rich functions of apps leave previous-generation mobile phones feeling sluggish to load.
App’s loading is most direct parameter that refers to those processes for loading data. If the length of waiting time exceeds the threshold limit value of a user’s waiting time, users will be bored, anxious, and grumpy and so on, and their ratings of product satisfaction will be greatly reduced. To address the issue, we presented the perception and satisfaction evaluation of loading time with a mobile device under three scenarios.
4.1. Experimental Design
From the perspective of user experience, this paper analyses the smoothness of mobile phone usage, and proposes an innovative evaluation method based on multi-dimension and machine interaction by combining objective (loading time recorded by manipulator) with subjective measures (satisfaction score). We also plan to carry out further research to improve this evaluation method in order to promote user experience design for mobile phone manufacturers.
In retrospective time estimation, the duration of a time interval that has already elapsed has to be judged. Observers need to estimate a given duration in retrospect from the amount of processed and stored memory contents; that is, duration has to be reconstructed from memory [
16,
17,
18]. The experiments adopted a retrospective paradigm, where the subjects were notified in advance that the task would require evaluating the length of the break and were aware that they would need to estimate the duration of a task [
19].Yan et al. have adopted a similar trace-based analysis for evaluating the delay time for windows phones [
20].The tasks involved in the three scenarios were rather simple, involving only one touch on the screen, which largely avoided influencing the experimental design. Therefore, the net scores were comparable among the three scenarios. The scenarios were determined by internet searching. A robotic arm and high-speed camera measured the loading times of the ten best-selling mobile phones.
4.2. Animation Effect
We developed three high-fidelity models to reproduce the dedicated scenarios, and the measured loading time intervals were replicated in the models. The notion that the experience of time would not rely on clock processes but would be an epiphenomenon evolving from cognitive and emotional responses during the time interval [
21]. In all the scenarios of our study, the result that animation helped increase the scores for the same loading time may due to delightful emotion from the animation effect. Previous studies demonstrated that the temporal interval is estimated as shorter than it actually is if the task is difficult because cognitive resources are preferentially allocated for task-related information processing, and the subject has fewer cognitive resources available to process temporal information [
22]. In our experiments, this improvement may arise either from the animation content (which was appealing to the subjects) or from the occupation of individual cognitive resources by the animated images so that fewer resources are used to estimate time. We used only one kind of animation in the experiments. The details of the animation affected the perception of time elapsed [
23]. To fully understand the effect of specific features of the animation on the human perception of loading time, different animation effects should be tested in future experiments. Animation also improved the scores in terms of satisfaction with the process, which is consistent with a previous study on online videos [
24]. Therefore, optimization of the animation effect seems worthwhile for manufacturers and App developers.
4.3. Loading Time
Shorter loading times received higher scores. This result indicated that the difference in the time interval in all the experiments was discernible by the users. In fact, the minimal interval was 240 ms (initialization of the dialer), which was perceptible according to previous research on loading times of webpages [
25].
There was a strong correlation between global satisfactions and loading time, which indicated that satisfaction mainly, depended on loading time.
Regression of the scores showed a linear relationship between loading time and scores (
Figure 4). This finding revealed that improving loading time could effectively ameliorate the UX. The time interval used in the experiments was measured from contemporary devices so that the results were representative and technically achievable. The effort to reduce loading time, at least to the present extent, was perceptible to users and may therefore be worthwhile for manufacturers and developers.
The scores for the social App, WeChatTM, were relatively low. This finding indicated that the measured loading time of this App from the available phones was not satisfactory. Mobile manufacturers need to optimize the devices to achieve a better UX. Since the loading time for the three scenarios was comparable, but only in the case of the social App received unsatisfactory scores, the users may have higher expectations for this kind of application.
Notably, the results are inconsistent with those of a recent study on loading time, as they claimed that the animation effect prolonged the estimated duration and lowered the evaluation of speed and satisfaction [
15]. However, that study conducted experiments on a PC. The difference in human interaction, screen size, display resolution and refresh frequency may influence the UX [
26,
27]. The PC and smartphone computing environments can drastically influence survey results [
27].
4.4. Difference in Terms of Operational System User, Gender and Occupation
We screened for candidates with operational system user, gender and occupation to eliminate fine experimental deviations caused by these differences. Significant differences based on the operational system user and occupation had only been detected for the case of WeChat
TM, a social App. Students and iOS users gave lower scores. Young people (students) tended to use mobile phones more often than did adults [
28]. As heavy users, students may have high mental anticipation for the performance of social features [
29]. Therefore, students were likely to underscore on this social App. Mobile phones with iOS systems usually demonstrated shorter loading times (also shown in our measurement) compared with the mean level of contemporary Android phones. Therefore, the iOS users were accustomed to shorter loading times and gave comparatively lower scores for its loading time. Gender differences were not obvious, but the interaction of gender with other factors showed a significant difference on the scores. This effect should be of concern during App optimization.
4.5. Limitations
Further experiments with different kinds of mobile devices should be conducted to generate a comprehensive conclusion. The enrolled subjects were young users who were the targeted population of the study. The survey protocols and developed tools can also be used with subjects from other age-groups to understand the needs of specific populations.
5. Conclusions
The present study analyzed human perception of loading time for several typical scenarios using realistic mobile devices. The studied scenarios were obtained and summarized from internet searches of complaints. Accordingly, high-fidelity models were generated to reproduce these scenarios, and the loading intervals adopted the measured values from contemporary mobile devices. We enrolled the subjects to perform experiments and provide scores on different time intervals and effects. The results revealed that animation can effectively improve subjective satisfaction on the loading process as well as the loading time. A shorter loading time was essential to achieve a higher subjective satisfaction perceptible to users. Since the values were measured from realistic mobile devices and were technically achievable, it is worth pursuing further improvements by manufacturers. Users showed relatively lower ratings for the social App, even with the shortest loading intervals. This result was an interesting finding and indicated that user expectations may be higher in this scenario.
Supplementary Materials
The following are available online at
https://www.mdpi.com/2227-7080/7/1/27/s1, Table S1: Table Category of the effective messages, Video S1: The experimental process1. Video S2: The experimental process2. Video S3: The experimental process3.
Author Contributions
Data curation, C.Z. and M.L.; Formal analysis, W.Z. and J.C.; Funding acquisition, T.W.; Investigation, C.Z.; Writing—original draft, L.Y.; Writing—review and editing, B.L.
Funding
This work was supported by the National Natural Science Foundation of China under Grant No. 61371187; the National Natural Science Foundation of China under Grant No. 61671158; and the National Science and Technology Major Project under Grant No. 2018ZX10301201.
Acknowledgments
Any opinions, findings and conclusions or recommendations expressed in this material are those of the authors and do not necessarily reflect the view of the affiliated agencies.
Conflicts of Interest
The authors declare no competing interest. None of the authors have any personal or financial involvement with organizations that have a financial interest in its content. The funders had no role in the design of the study; in the collection, analyses, or interpretation of data; in the writing of the manuscript, or in the decision to publish the results.
References
- Sari, K.; Virpi, R.; Kaisa, V.V.M.; Evangelos, K.; Arto, S. UX Curve: A method for evaluating long-term user experience. Interact. Comput. 2011, 23, 473–483. [Google Scholar] [CrossRef]
- Jakob, N. Usability Engineering; Elsevier: Abingdon, UK, 1994. [Google Scholar]
- Ben, S. Human values and the future of technology: A declaration of responsibility. ACM SIGCHI Bull. 1991, 23, 11–16. [Google Scholar] [CrossRef]
- Ben, S.; Catherine, P.; Maxine, C.; Steven, J.; Niklas, E.; Nicholas, D. Designing the User Interface: Strategies for Effective Human-Computer Interaction; Addison-Wesley: Abingdon, UK, 2016. [Google Scholar]
- Eija, K.; Virpi, R.; Kristin, R.; Kaisa, V.V.M.; Teija, V.; Wolfgang, M.; Dhaval, J.; Sujan, S. User experience of mobile internet: Analysis and recommendations. Int. J. Mob. Hum. Comput. Interact. 2009, 1, 4–23. [Google Scholar] [CrossRef]
- Dongwon, L.; Junghoon, M.; Yong, J.K.; Mun, Y.Y. Antecedents and consequences of mobile phone usability: Linking simplicity and interactivity to satisfaction, trust, and brand loyalty. Inf. Manag. 2015, 52, 295–304. [Google Scholar] [CrossRef]
- Barbara, B. Designing the Mobile User Experience; John Wiley and Sons: Abingdon, UK, 2007. [Google Scholar]
- James, I.; Patrick, C. The spatial resolution of visual attention. Cogn. Psychol. 2001, 43, 171–216. [Google Scholar] [CrossRef]
- James, V.H.; Elizabeth, A.H.; Gobbini, M.I. The distributed human neural system for face perception. Trends Cogn. Sci. 2000, 4, 223–233. [Google Scholar] [CrossRef]
- Lei, Y.; David, U.; Steven, F. Are categorical spatial relations encoded by shifting visual attention between objects? PLoS ONE 2016, 11, e0163141. [Google Scholar] [CrossRef]
- de Fockert, J.; Davidoff, J.; Fagot, J.; Parron, C.; Goldstein, J. More accurate size contrast judgments in the Ebbinghaus Illusion by a remote culture. Hum. Percept. Perform. 2007, 33, 738–742. [Google Scholar] [CrossRef] [PubMed]
- Peter, A.H.; Rausch, R. The effects of sex, age, and interval duration on the perception of time. Acta Psychol. 2010, 133, 170–179. [Google Scholar] [CrossRef]
- Wang, Y. On the cognitive processes of human perception with emotions, motivations, and attitudes. Int. J. Cogn. Inf. Nat. Intell. (IJCINI) 2007, 1, 1–13. [Google Scholar] [CrossRef]
- Mary, B.R.; John, M.C. Usability Engineering: Scenario-Based Development of Human-Computer Interaction; Morgan Kaufmann: Abingdon, UK, 2002. [Google Scholar]
- Zhao, W.; Ge, Y.; Qu, W.; Zhang, K.; Sun, X. The duration perception of loading applications in smartphone: Effects of different loading types. Appl. Ergon. 2017, 65, 223–232. [Google Scholar] [CrossRef] [PubMed]
- Ornstein, R.E. On the Experience of Time; Penguin Books: Baltimore, MD, USA, 1970. [Google Scholar]
- Flaherty, M.G.; Freidin, B.; Sautu, R. Variation in the perceived passage of time: A cross-national study. Soc. Psychol. Q. 2005, 68, 400–410. [Google Scholar] [CrossRef]
- Noulhiane, M.; Pouthas, V.; Hasboun, D.; Baulac, M.; Samson, S. Role of the medial temporal lobe in time estimation in the range of minutes. Neuroreport 2007, 18, 1035–1038. [Google Scholar] [CrossRef] [PubMed]
- Richard, A.B. Cognitive Models of Psychological Time; Psychology Press: Abingdon, UK, 2014. [Google Scholar]
- Yan, T.; Chu, D.; Ganesan, D.; Kansal, A.; Liu, J. Fast app launching for mobile devices using predictive user context. In Proceedings of the 10th International Conference on Mobile Systems, Applications, and Services, Low Wood Bay, UK, 25–29 June 2012; pp. 113–126. [Google Scholar]
- Wittmann, M. The inner experience of time. Philos. Trans. R. Soc. B Biol. Sci. 2009, 364, 1955–1967. [Google Scholar] [CrossRef] [PubMed]
- Richard, A.B.; Dan, Z. Prospective and retrospective duration judgments: A meta-analytic review. Psychon. Bull. Rev. 1997, 4, 184–197. [Google Scholar] [CrossRef]
- Huhtala, J.; Sarjanoja, A.H.; Mäntyjärvi, J.; Isomursu, M.; Häkkilä, J. Animated UI transitions and perception of time: A user study on animated effects on a mobile screen. In Proceedings of the SIGCHI Conference on Human Factors in Computing Systems, Atlanta, GA, USA, 10–15 April 2010; pp. 10–15. [Google Scholar]
- Kim, W.; Xiong, S.; Liang, Z. Effect of Loading Symbol of Online Video on Perception of Waiting Time. Int. J. Hum. Comput. Interact. 2017, 33, 1001–1009. [Google Scholar] [CrossRef]
- Robert, A.; Donald, M. A distributed hypermedia system for managing knowledge in originations. Commun. ACM 1988, 31, 820–835. [Google Scholar]
- Jung, Y.; Kim, S.; Choi, B. Consumer valuation of the wearables: The case of smartwatches. Comput. Hum. Behav. 2016, 63, 899–905. [Google Scholar] [CrossRef]
- Cho, W.; Jung, Y.; Im, J.H. Students’ evaluation of learning management systems in the personal computer and smartphone computing environments. Int. J. Mob. Commun. 2014, 12, 142–159. [Google Scholar] [CrossRef]
- De-Sola Gutiérrez, J.; Rodríguez de Fonseca, F.; Rubio, G. Cell-phone addiction: A review. Front. Psychiatry 2016, 7, 175. [Google Scholar] [CrossRef] [PubMed]
- Anastasios, A.E.; Amalia, G. Students’ thoughts about the importance and costs of their mobile devices’ features and services. Telemat. Inform. 2009, 26, 57–84. [Google Scholar] [CrossRef]
© 2019 by the authors. Licensee MDPI, Basel, Switzerland. This article is an open access article distributed under the terms and conditions of the Creative Commons Attribution (CC BY) license (http://creativecommons.org/licenses/by/4.0/).


