Abstract
The design of large dams is a collaborative activity with relevant social and political implications. Planning such large infrastructures requires involving all the interested stakeholders, making shared decisions, tracing the design process. There are currently not many Virtual Prototyping tools to support this collaborative design process. In this paper, we propose a participated planning support system based on mobile and Augmented Reality technologies which allows different stakeholders to take part in the review of a large dam project through an application that automatically acquires information available online, allows all stakeholders to share information, and finally records everything for a subsequent analysis. The development of the application, as well as its use in two case studies and a user study, are described in the paper.
1. Introduction
More than half of the world’s rivers are regulated by dams [1], forming a cumulative storage capacity of about 8000 [2]. This volume represents nearly 10% of the water stored in all natural freshwater lakes [3] and about one-sixth of the total annual river flow into the oceans [4]. According to the World Bank [5], these figures are expected to grow rapidly over the next years especially in developing countries, where dams are considered as a primary mean to secure water availability for different economic sectors, producing relatively carbon-neutral energy, and reducing flood risk [6,7,8]. At the same time, dams may potentially negatively impact on other water-related interest, including ecosystem services [9], water quality [10], habitat fragmentation [11], or sediment transport and dynamics [12].
Planning the construction of these large infrastructures requires an integrated and participated approach [13] to address the multiple interconnections among the biophysical, social, economic, and political aspects of the problem. In fact, the presence of multiple and competing water uses, both within and between countries, requires the active involvement of the stakeholders in each stage of the decision-making process, from the identification of their preference structure to the negotiations of the decisions to be implemented [14]. This participatory approach may contribute in preventing the rise of disputes over contested use of water at different spatial and institutional scales [15,16], which are instead currently ongoing in many large projects such as the Three Gorges dam (China), the Itapu dam (Brazil), the Grand Inga dam (Democratic Republic of Congo), or the Grand Ethiopian Renaissance Dam (Ethiopia).
Promoting an active stakeholders participation is, however, a challenging task, as it should not be limited to providing stakeholders with items of information on the project’s outcomes or to just asking them some information [17]. Conversely, this process builds on information, transparency, and repeatability. The aim is to enable the building of trust and social learning that lead stakeholders in co-designing project’s solutions by taking part in multilateral discussions. During these discussions, led by external (neutral) facilitators, stakeholders can express their points of view in terms of expectations and concerns about the problem, and also suggest candidate options to be implemented (see Figure 1).
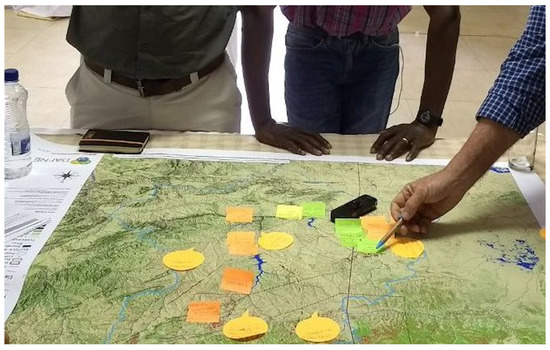
Figure 1.
Example of stakeholders’ participation during the Negotiation Simulation Lab of DAFNE research project (http://dafne-project.eu/) for the Zambezi River Basin, held in Lusaka (Zambia) on 11–12 September 2017.
To foster the spread of these integrated and participated approaches we have developed a Virtual Prototyping application to support the collaborative planning of dams through Augmented and Virtual Reality visualisation and editing.
The novelty of our work is two-fold.
First, there are no other commercial or academic collaborative applications described in the literature to support the planning of this kind of large infrastructures, an activity that is usually performed by multiple people, very distant from each other, who normally need to exchange a great amount of data before reaching joint decisions.
Second, our solution introduces some distinguishing elements with respect to existing collaborative applications in the Architectural, Engineering and Construction (AEC) field (see Section 2). Virtual Prototyping technologies have been mainly used to enable a more realistic 3D models visualisation, to visualise projects in the real scene and, when paired with a networking system, for supporting maintenance activities (e.g., see [18,19,20]). In our work, the project is shared between an arbitrary number of participants, that can fully and equally interact with it, using Augmented and Virtual Reality. Moreover, multiple devices are supported, so the system can be used indifferently with a desktop computer or a mobile phone (further aspects will be discussed in Section 4). There are only a few examples of collaborative applications allowing AR visualisation, (e.g., see [20,21,22]) since mainly virtual environments have been used as communication platforms (e.g., see [23,24]).
The paper is structured as follows. In Section 2, a review of the literature is provided, with a focus on the use of AR and VR technologies in the AEC field. In Section 3, an analysis of the main requirements to be fulfilled when designing collaborative applications is provided. Section 4 describes the developed application, detailing the main implementing modules and how it works. In Section 5, we showcase the potential of our application in supporting the participatory planning of two real dam projects in the Zambezi River Basin. In Section 6 we describe a user study. Finally, conclusions are drawn in Section 7.
2. Related Works: Collaborative Virtual Prototyping Applications for the AEC Field
Co-creation and co-design can be defined as any act of collective creativity, involving professionals and, in the case of co-design, consumers and final users as well [25]. This approach is not limited to the design of products, services or interfaces, but can be extended to other contexts, such as AEC areas. In civil engineering, collaborative design systems can improve interdisciplinary communication, enabling the evaluation of more design options and supporting real-time analysis and decision making [26,27]. Virtual Prototyping tools can effectively support co-design and other collaborative activities. Yeomans et al. state that Collaborative Prototyping practices supported by ICT (Information and Communication Technologies) to share information present several benefits for the AEC fields, creating better team-working environments, reducing conflicts and enhancing confidence regarding the projects’ outcomes, improving coordination and efficiency [28]. Despite these advantages, according to their evaluation, the AEC industry has invested very little in the development of Collaborative Prototyping tools in the past years, compared to other collaborative working tools. Considering the Virtual Prototyping enabling technologies, Virtual Reality (VR) and Augmented Reality (AR) are among the most promising ones. In fact, VR collaborative environments can support AEC professionals and the other stakeholders involved in a project in various activities, from the concept design to construction and maintenance phases [24]. AR tools allow visualising AEC projects in the real world, including both the construction site and remote working spaces where to discuss the design. They have already been adopted to support collaborative activities in many design and engineering fields (e.g., see [29]), starting with the Studierstube project [30] in the late nineties, which introduces an approach based on a multi-user mixed reality experience. Each user controls his/her viewpoint and display preferences independently, allowing multiple stakeholders to visualise the same object and simultaneously explore various aspects, depending on their interests or technical background. In fact, AR and VR—or Mixed Reality—tools enable users to update and annotate the 3D models in real time, visualising and comparing possible solutions concerning geometries, aesthetic features and appearance (e.g., colours and textures) [31], but also functionality and ergonomics [32]. This versatility is desirable especially when there are many cooperators involved, focusing on different parts of a project, as it happens in the AEC fields. In this context, Mixed Reality tools can improve real collaboration when preparing alternative solutions, instead of leaving each part of the work to the individuals and postponing decisions to the following meetings [33]. Many AR projects in the AEC areas are dedicated to the commissioning phases [34], focusing on verification processes during and after constructions. In particular, the possibility to visualise projects in their actual environment, allows engineers to find eventual discrepancies with planning documentation, improve, simplify and shorten progress monitoring [35]. In [36], a conceptual framework is described with the aim to provide indications on how to combine Building Information Modelling (BIM), used in the AEC field, and AR technologies: again, the objective is to offer an enhanced visualisation of the construction progress monitoring so as also to strengthen the collaboration. An implementing application concerning this topic is, for example, described in [37].
However, this easy management and visualisation of the information has a great potential in design phases as well. In fact, it is estimated that at least 5% of building construction costs are caused by problems which arise in the early stages of design, and which could be prevented if the proper information were acknowledged and communicated in time [38]. Communications, document management, and interoperability are recognised to be part of a general collaboration issue affecting AEC industry [39]. AR and VR platforms can address these problems and enhance cooperation among stakeholders leading to an improvement of the design process, avoiding construction delays and reducing costs.
Despite this keen interest of the AEC community in Virtual Prototyping and Mixed Reality tools only a few examples of collaborative applications based on these technologies are available. For example, INTEGRA is a VR tool to involve various remote stakeholders in the design of buildings [40]. Different aspects are integrated together, including visualisation, cost modeling and risk assessment. However, solutions are mostly proposed by architectures and engineers, while the other stakeholders can provide feedbacks and approvals. In [41] is described an interesting example of an advanced AR workbench for the preliminary phases of urban planning, which enables a multi-layer representation of the physical and digital contents. The system permitted merging three different kinds of information: 2D paper drawings; physical models; and digital simulations able to show the effects of the atmospheric conditions (e.g., wind) on the proposed urban plan. The application is able to visually integrates different contents towards a shared workspace, however, since it makes use of a dedicated workbench, the collaboration has been not conceived to occur remotely. Another compelling case is the application described in [21]. However, again, this application is not conceived to work remotely (participants need to wear head-mounted displays and sit at the same table) and the focus is more on visualisation rather than on providing an advanced contents communication and manipulation. The application described in [22] allows remote collaborations, but the focus is still on providing advanced contents visualisation. Actually, this work demonstrates that AR-based collaborative applications have the potential of facilitating the decision-making process if compared with standard collaborative design platforms.
However, when collaborative planning large infrastructures, one of the critical elements is to make participants aware of decisions and make such decisions more transparent. Collaborative applications for the AEC field have to not only provide an advanced visualisation of the contents, but also an advanced manipulation, communication, storage of such contents, and of the decisional path followed to create them. Moreover, all these functions should be enabled not only for AEC professionals, but for all the stakeholders involved. Considering the open issues and limitations identified, in this paper we describe an innovative collaborative remote Virtual Prototyping application based on VR and AR for the planning of large water infrastructures, such as dams. The specific requirements that have driven the design of the application are discussed in the Section 3.
3. Setting Design Requirements of Collaborative Applications: A Focus in the AEC Field
Relevant contributions concerning the design requirements of collaborative applications, especially related to the design phase, come from the product design field. For example, in [42], a discussion on Computer Supported Collaborative Design (CSCD) is provided. The authors identified a number of challenges to be faced when designing CSCD systems. They underlined the relevance of developing web-based solutions grounded in communication protocols able to guarantee the access to data when and where necessary. Besides, they also discussed the fundamental role played by the User Interfaces (UI) of such applications, which should be “integrated, expressive, goal oriented, cooperative, easy to use, and customizable” (see [42], p. 860). In [43], a list of requirements is provided, among which the necessity to implement multi-modal communications and that all the participants to the design process are made aware of the rational at the basis of each decision. The need to strengthen the user’s awareness is also discussed in [44], where a collaboration system merging AR technology and telepresence is described. The telepresence system guarantees face to face communications without delays, while the shared and marker-based AR whiteboard allows an effective sharing of the information.
Focusing the analysis on the AEC field and the planning phase of large infrastructures, as already underlined in Section 1, the involvement of multiple stakeholders is fundamental. They can have a different level of interest in the project as well as different background [45]. For example, in the case of dams, the active participation in the decision-making process of, e.g., natural-physical-social scientists, engineers, political and administrative figures is fundamental to accurately account for the social impacts of these infrastructures [46]. Consequently, systematic approaches are needed to manage the complexity of the decision-making process, with the target of reaching a reasonable degree of engagement of all these heterogeneous stakeholders in all project phases [45].
Indications on the requirements to be fulfilled when designing collaborative applications for the AEC field are provided in [47]. The author identifies some key aspects, which we have summarised and reinterpreted as follows: interactions among participants should be guaranteed since they should be able to actively intervene; information representation, sharing, retrieval, storing and recording is fundamental to support the decisional process and leave marks of design decisions; a workspace should be provided where each participant has the possibility to manipulate the generated contents; and multi-modal communications (e.g., verbal, textual, and sketch-based) should be implemented to guarantee an interaction as much natural as possible.
Additional design specifications were provided by experts of participatory water resources planning and management on the basis of their experience in past research projects (e.g., [48,49,50]). They underlined the necessity to make use of 3D visualisations of the dam and of its impact on the surrounding environment (e.g., distinguishing those areas that will be flooded by the water). A multi-user access to the application, as already stated, is fundamental considering the high number of stakeholders involved in the planning process. Furthermore, the possibility to establish a remote collaboration is a crucial aspect. Indeed, especially in the case of international water infrastructures’ planning, this feature would allow the various stakeholders to significantly reduce the time and costs spent on travelling. Finally, different types of dams should be considered in the planning process together with the necessity to properly take into account the morphology of the specific landscape where the dam will be built.
Merging all these contributions, in Table 1, we summarise the main requirements taken into account to drive the design of the application.

Table 1.
Main requirements for the design of the participated planning application.
4. DAM Builder Architecture
In this section, we provide all the details related to the design and prototyping of our application. It has been designed using the Unity development platform, a leading game engine often used also for virtual prototyping applications [51]. The application has been conceived to work both for desktop and mobile operating systems (see Table 1).
Figure 2 shows the main modules of the application. We can identify two main building blocks: the Networking and Synchronisation Framework and the Data management blocks. The first (i.e., the Networking and Synchronisation Framework) allows multiple users (i.e., the clients) to connect to the main user (i.e., the server) through a log-in screen and to exchange data in real time through a networking system, based on the TCP/IP (Transmission Control Protocol/Internet protocol) stack. Moreover, a synchronisation engine (see Figure 2) is provided to easily propagate data changes between all logged users. The latter (i.e., the Data Management block) controls the manipulation and editing of the information generated during the dam planning, and it is made up of three main modules. The Data set module deals with all the actions that can be performed on the used, generated and modified data during the dam planning session. To establish a multi-modal communication (see Section 3 and Table 1) among users, a Chat module has been included (see Figure 2), to also visually report each users’ action. Finally, since in a multi-user program a shared permanent space for storing the information is not available, a project manager module has been included (see Figure 2). A project is a “container” of all the pieces of information that allow replicating a specific state of the application. The related module allows the participants to view, delete, save or restore these projects, which are stored in the server hard disk. All the changes performed through the three modules (i.e., Data set, Chat, and Project Manager) are managed by the Synchronisation engine, which propagates every change performed during the session to current and future participants.
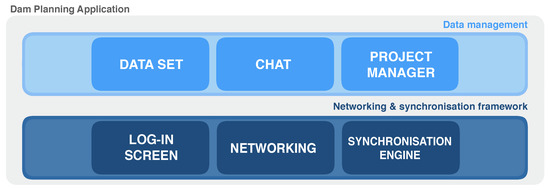
Figure 2.
The main building blocks and modules of the dam planning application: the Networking and Synchronisation Framework block controls the Data management block which consists of three main modules (i.e., Data set, Chat, and Project Manager). The Networking and Synchronisation Framework block allows users to connect to the application (through a Log-in Screen), to exchange data (through the Networking System), and it guarantees that those data are synchronised (through the Synchronisation Engine).
4.1. The Networking and Synchronisation Framework
In a client–server approach, each user (the client) can connect to a server (i.e., the main user) and exchange data with it in a bidirectional way. Both the server and client parts are implemented into a single application: the user can select one of the two modes (i.e., server or client) through a log-in screen, shown just after the initialisation of the application (see Figure 3). A library built upon the networking system can detect all the various events that can happen while a server is running: client connections, disconnections, server creation and closure. To implement this approach, we used the consolidated TCP/IP stack together with the Unity High-Level network Application Programming Interface (HLAPI) that is typically used to develop multi-player applications [52].
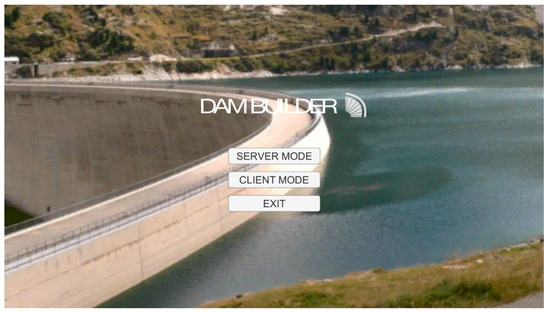
Figure 3.
The “Start” window which allows the log-in of the user: he/she can decide whether to act as a client (typing the ip-address of the server he/she wants to be connected) or as a server.
A Synchronisation Engine has also been conceived to keep synchronised the data edited by the users. The implementation is based on the use of synchronisation variables. A custom version of these synchronisation variables has been built from scratch. These variables are instantiated on each client after the log-in.
The Server (i.e., the leading participant) manages the main copy of each synchronization variable, which is saved on the server’s hard disk (see Figure 4). In fact, since the information generated during the planning of a dam refers to a specific construction project, it is essential to store all the data into a project file that can be saved and loaded when necessary, keeping the whole history of the discussion. When a client connects to the server, the server sends the main copy of the data to it, updating the client’s local copy, the same thing happens each time the main copy is modified. If a secondary user makes changes to his/her copy, he/she can request the server to update the main copy and the other clients’ copies as well (see Figure 4). When a writing request is sent to the server from a user (e.g., the data set is edited) the server propagates this request to the other clients’ variables. These, on the contrary, listen for update requests from the server, applying it and notifying the client. The real-time update is not allowed since it must be validated by the server and sent back. For this reason, the rapidity of this action depends on the quality of the connection between the client and the server.
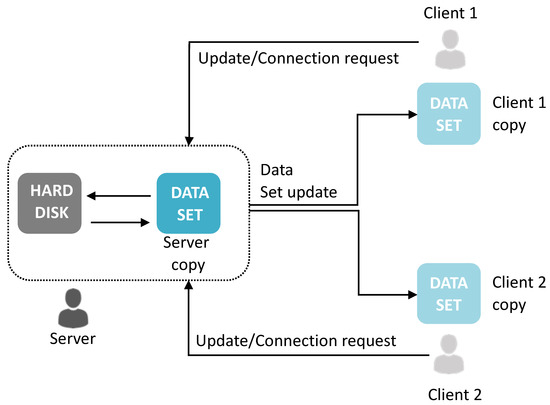
Figure 4.
How the Synchronisation Engine works. The Server (i.e., the main user) controls the data-set updates and the connection requests of the clients (i.e., the other users). The data syncronisation is performed by means of variables related to the data-set, whose values are updated by the server any-time a change of these data is performed by the server or the clients.
4.2. The Project Manager Module
This module allows storing all the data into a project file that can be saved and loaded when necessary, keeping the whole history of the dam planning process (see Table 1). The server (i.e., the leading participant) is the only one in charge of managing the project, which is saved and loaded from the hard disk (see Figure 4). When a client connects to the server, the server sends the main copy of the data to it, updating the client’s local copy. The same thing happens each time the main project copy is modified. The Javascript Object Notation (JSON) open standard has been used to encode the project data and save it into a file on the server. The saving, update and generation of projects can be performed through the dedicated buttons available in the Graphical User Interface (GUI) of the application (see Figure 5): a wildcard character near the project name indicates whether saving is needed.
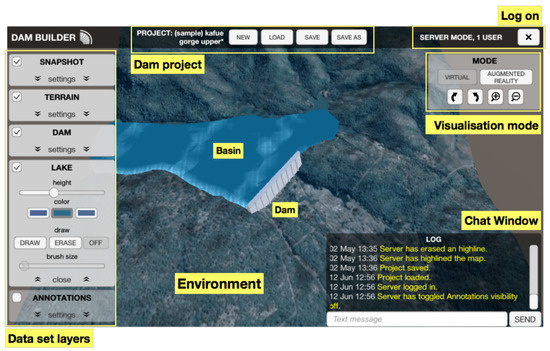
Figure 5.
The Graphical User Interface (GUI) of the application. The yellow textual boxes and rectangles are used to highlight the main elements of the GUI which are detailed in Section 4.2, Section 4.3 and Section 4.4.
4.3. The “Data Set” Module
A set of data is created, shared and manipulated by the users during the dam planning through a Graphical User Interface (GUI) (see Figure 5). These items are synchronised through the mechanism explained in Section 4.1 (see also Figure 6b).
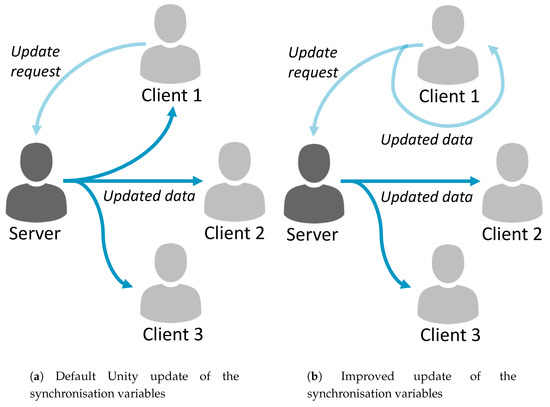
Figure 6.
The two strategies that can be applied to guarantee the data-set synchronisation among the various session participants. Any update request of the data-set must be validated by the server. However, in Figure 6b, only the variables of the client requesting the data-set update are automatically synchronised. In this way, at least for the client requesting this update, the real-time data syncronisation is performed as in a single-user program.
The Unity environment allows filling a single window (on desktop operating systems) or the entire screen (on mobile operating systems) with 3D contents and 2D controls. Since the aim of the session is the planning of large water infrastructures, the GUI has, at least, to graphically render the central elements of the planning process, i.e., the environment where the dam will be built, the dam itself and a basin surface.
The environment is the component on which all the other objects are placed and visualised (see Figure 5). It is the starting point of the planning session since, as underlined, it is the place where the dam will be built. The environment can be created by the users in various ways: through a snapshot of the place or the GPS Coordinates, which can be calculated by providing a textual address.
Regarding the snapshot, the software gives the possibility of taking and using an arbitrary 2D picture as terrain, which can be placed in the 3D environment through dedicated controls that act on its position and scale (see Figure 7a). There are several applications of this feature. For instance, one user could be at the site, taking a photo with his/her camera, while another could be in the office, ready to plan the infrastructure on top of the provided data; alternately, the picture could be provided by a participant with access to the project cartography, and mapped on an AR target in a different place. This technique has been successfully used for remote maintenance and training programs, mixed with the AR modality (e.g., see [53]).
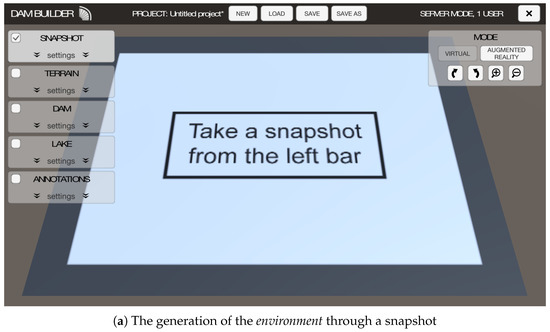
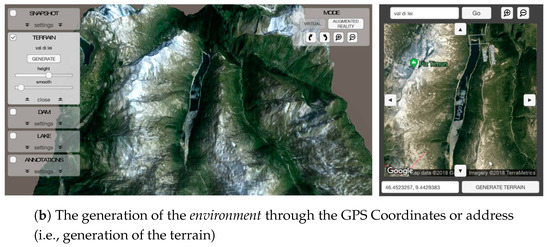
Figure 7.
How the environment is generated (see also Figure 5).
Another option consists of using a 3D representation of the terrain, generated through the mix of the corresponding texture and a heightmap (see Figure 7b). An increasing number of online services allow downloading terrain-related data without fees or restrictions, with a resolution good enough for planning purposes. Since these services are accessible through the HTTP (HyperText Transfer Protocol) protocol and Unity provides a dedicated web library, this download process can be automatised. A dedicated window can be used to type the needed address and adjust the position through four arrows (see Figure 7b, right). By clicking the “Generate” button (see Figure 7b, left), two web services are contacted to download, respectively, the terrain texture (a flat satellite image corresponding to the point of interest) and a heightmap (a black and white image whose colours represent the terrain height). These are used to generate the final 3D terrain. A snapshot and a terrain can also be simultaneously used when a background photo of the place is available.
After having created the terrain or uploaded the snapshot, a dam can be added on top of it. A fixed model can be chosen, adjusted in height, width and depth and moved (see Figure 8a). The basin height and extension is the real matter of interest of the planning since its presence influences the existing valley conformation. A lake can be created by choosing its height and colours through a slider, then by drawing its surface through a brush with an adjustable size (see Figure 8b). In reality, the brush draws on a 2D image, that is then given to the Graphics Processing Unit (GPU), to determine which area of the screen must be rendered as a realistic water surface (see Figure 8b, right). The use of a 2D image allows synchronising this apparently complex content through the previously built Networking and synchronisation framework, described in Section 4.1.
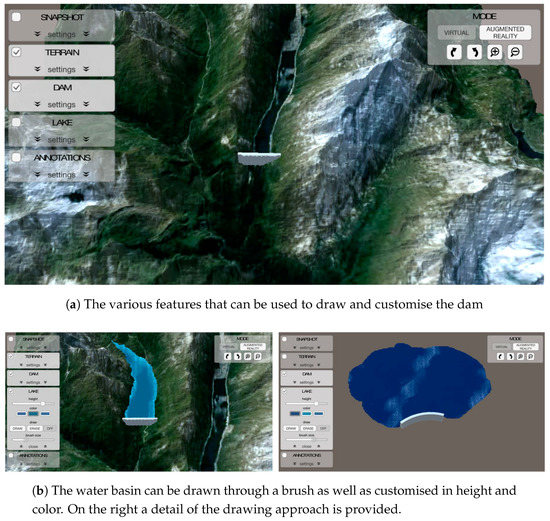
Figure 8.
How the dam and the lake can be drawn and customised through the GUI features.
A single stroke is enough to trigger the image data upload to the server and the propagation to all session participants (with a consequent waste of bandwidth and a significative delay). Hence, the underlying system has been modified to avoid such a waste: instead of the full image data, only the stroke action is propagated, and applied to the copy of the image available on the other connected devices, resulting in a much lower delay.
Finally, another data source is represented by annotations, which can be added on top of the previously created content. These annotations can help in identifying places or problems (see also Table 1). The application allows drawing freely on a 2D surface normal to the terrain/snapshot, customising the brush colour and size (see Figure 9a), or creating pickers associated with a specific text (see Figure 9b), that can be moved freely on the environment.
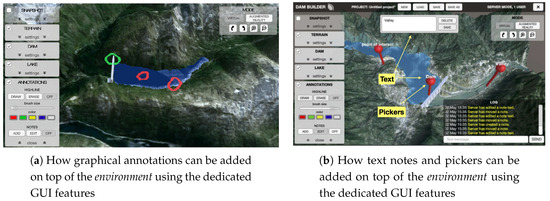
Figure 9.
How users can apply annotations.
All these contents are organised into layers (i.e., snapshot, terrain, dam and lake settings, see Figure 5) that can be shown or hidden. For each layer, a control panel is provided with specific controls, like sliders, toggles and text inputs (Figure 5). The generated contents can be saved or loaded through the Project manager module (see Section 4.2).
The application has been developed to provide two visualisation modes. The Visualisation mode window (see Figure 5) allows switching between a Virtual or AR representation of the data-set. The Virtual representation is the standard one while the AR allows visualising the contents in a real-world location, captured by a live camera feed. Existing locations are identified using markers (images with distinct zones easily recognisable by an algorithm) or using other data (GPS, magnetometer, and accelerometer). This feature is implemented using a widely used commercial library called Vuforia [54], which allows the use of user-defined targets. These can be photos of the place taken on site, upon which the dam infrastructure is shown, and can be modified. A client will select the AR view mode to see the data-set superimposed on the target, scaled accordingly (see Figure 10). Moreover, it is possible to use the target image as the snapshot, allowing the other clients to use it to build the environment (see Figure 7a). The current implementation of the software does not allow the propagation of the target used by the AR mode. Consequently, each participant has to use a different target, or he/she has to switch to the non-AR visualisation mode.
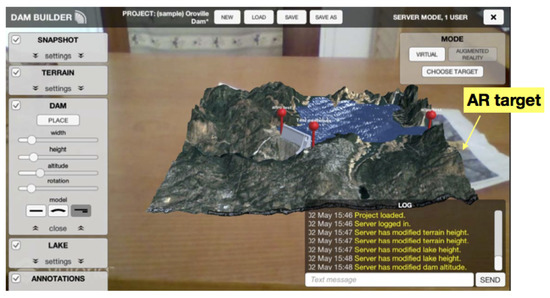
Figure 10.
What the user can see activating the AR visualisation modality: the 3D representation can be seen for example, through a tablet, within a real scenario which could also be the real environment where the dam will be built.
4.4. The “Chat” Module
This module provides the users with the possibility of exchanging simple textual messages. These are displayed in a dedicated window (see Figure 5), together with their timestamp and author, and sort by date.
Since a requirement of the project is the storage of every action (see Table 1), the chat window is also used to display a full log of every user action, making aware the other participants of all the changes and events that have occurred. This is implemented by associating every session participant’s action with a precise textual message that describes it. This message is recorded while the action is occurring. Since the log is also part of a project, its content is saved and restored along with the other data belonging to the project.
5. Use of the Application in Real Dam Planning Projects
5.1. Case Study
In this Section, we take as examples two real cases of dam planning projects in the Zambezi River Basin, i.e., Batoka Gorge Dam and Mphanda Nkuwa Dam [55]. The Zambezi River Basin is the fourth largest basin of Africa with an area of 1.32 million km shared by eight countries (Angola, Botswana, Malawi, Mozambique, Namibia, Tanzania, Zambia and Zimbabwe) and populated by almost 40 million inhabitants. The existing reservoirs in the basin, which account for 5000 MW of installed hydropower generation capacity, are mainly operated for hydropower production, with considerable negative effects on the aquatic ecosystem in the Zambezi delta due to the alteration of the natural flow regime [56]. The economic development of the riparian countries is triggering major hydropower expansion, which is expected to increase the average energy production from 30,000 to around 60,000 GWh/year through the extension of existing facilities and the addition of new infrastructures. Specifically, Batoka Gorge is a new roller compacted concrete gravity arch dam to be constructed on the border between Zambia and Zimbabwe upstream of Lake Kariba, which will provide 1600 MW of installed capacity [57]. Mphanda Nkuwa Dam is instead a new concrete gravity dam to be constructed in Mozambique downstream of Cahora Bassa, which will provide 1300 MW of installed capacity and is expected to ensure a mean annual production of 8600 GWh/year [58].
Figure 11 and Figure 12 show two examples of the created planning sessions in two visualisation modes (i.e., Virtual and AR, see Section 4.3). The possibility of creating the dam and editing its characteristics (e.g., typology, position, and height, see also Figure 8a) simply and rapidly has come out to be a fundamental feature in the dam planning. Moreover, the opportunity to save different versions of the same project to compare the effects provided by setting different dam characteristics is another aspect that has been heartily appreciated. Together with the possibility to insert any annotation, another relevant feature of the application is the remote collaboration. Indeed, as already explained in Section 3, especially for those planning projects involving multiple countries, frequent and expensive travel meetings have to be organised to guarantee that all the necessary figures are involved. The possibility to replace at least a part of these discussion/negotiation meetings with a remote and “realistic” planning activity would allow saving time and money. In addition, the possibility to perform this remote collaboration with participants directly placed at the site of interest (e.g., technicians) is also fundamental, and it is nowadays not possible. These participants can take pictures of the place (for example using drones) and use them to create, e.g., the environment. In this way, annotations can be placed directly on them.
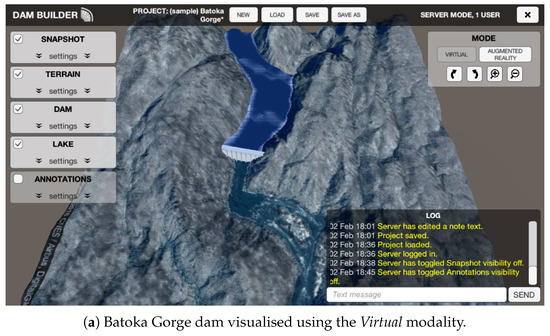
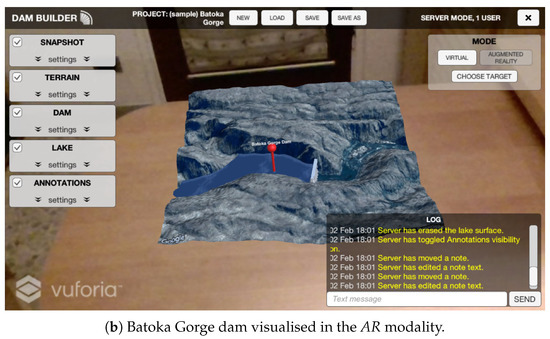
Figure 11.
An example of planning session generated for the Batoka Gorge dam project.
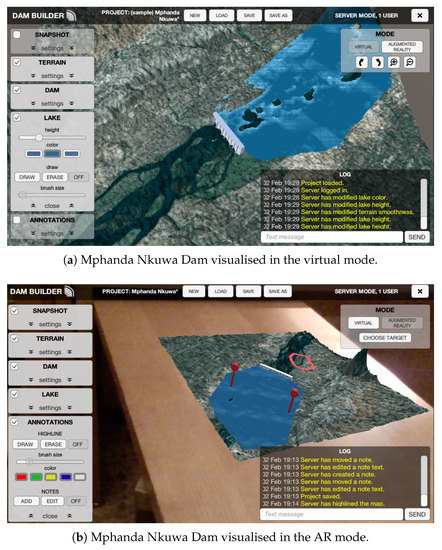
Figure 12.
An example of planning session generated for the Mphanda Nkuwa Dam project.
5.2. Networking performance
As the application is intended to exchange data between users that can be very distant from each other, the quality of the connection could be very low. The main performance indicators of network traffic are latency and bandwidth, the first one referring to the delay between the sending and the receiving of a piece of information, and the second one referring to the quantity of information that can be simultaneously sent (see [59]). Precautions have been taken to address both a great latency and a low available bandwidth.
As already explained in Section 4.1, the communication between the client and the server occurs through the TCP/IP protocol. Unity already provides an efficient strategy for exchanging the information. This one is conceived to avoid intermediate levels of conversion of the information, leaving it in its simplest binary form (as, for example, otherwise occur for the HTTP protocol), at the cost of imposing a fixed sequence that the software must follow to receive a packet correctly. This approach allows reducing the weight of the packages of information exchanged through the Synchronisation variables (see Section 4.1), addressing the bandwidth issue.
Regarding latency, we applied the strategy already introduced in Section 4.1 (see also Figure 6b). Indeed, Unity by default does not allow a client to autonomously modify his/her projects: the client has to first send the update request to the server, a feature introduced to avoid cheating since Unity is mainly a game engine. On the contrary, we allowed the client data-set copy to be automatically updated (see Figure 6b), making it independent from the eventual latency of the connection.
Besides, to further reduce the needed bandwidth, the images exchanged during the session (e.g., the ones used for modelling the water basin, see Section 4.3 and Figure 8b), before being sent to the server, are compressed. They are compressed into the JPG format if they do not contain the transparency while, in the PNG format, whether the transparency is present. Besides, images modified through the Brush feature (e.g., see Figure 8b and Figure 9a) are not entirely sent: just that part modified by the brush.
To summarise, the further strongly appreciated feature of the application is the fact that it can work in areas having low band connectivity because a quick server response is not necessary to modify the data (i.e., the client requesting the change does not need to wait for the server approval). In addition, a large bandwidth is not necessary since the data exchange has been optimised (i.e., they are sent only when necessary). An estimation of the minimum needed bandwidth is difficult to perform because it depends on the session.
However, while the update of strings and numbers is easily affordable, what require more resources are the texture updates (e.g., the terrain, see Figure 7b). For example, considering a terrain made through two pictures of 640 × 640 pixels, for a total of 800 kb using the JPG format, and the necessity that the terrain is updated in maximum 5 s, we need an Internet connection having an upload speed of 160 kB/s (i.e., 1.3 Mb/s). Adding a minimum of overhead to this value and considering that internet providers calculate the connection speed as the sum of upload and download speeds, a reasonable value could be 5 MB/s, which corresponds to a 3G connection (e.g., see [60]) which is nowadays an acceptable requirement for a web-based application.
6. User Study
We performed a user study whose aim was to verify whether the developed application fulfilled the requirements listed in Table 1. The test took place in the Virtual Prototyping Lab in Politecnico di Milano on a desktop configuration (CPU: i7 5930k 3.5 GHz-6 cores-12 threads, RAM: 16 gb, GPU: Nvidia Quadro k4200 4 gb), using two identical 24 inch LCD monitors, one serving as server and one as client, connected through a Wi-Fi router. The two workstations were opposite to each other. The application was used in the VR mode.
Initially, the participants went through a training phase during which they received explanations concerning the aim of the application and its functions. Then, they were able to use the application by themselves and when they both felt ready the test could start. During the test, the experimenter asked the testers to perform a number of tasks. The tasks to accomplish have been assigned so that each player was able to try all the functions of placing and editing objects, drawing and erasing. Each time a player completed a task, he/she had to send a confirmation message through the chat (e.g., “done”) to the other player, to communicate that the task had been concluded. After the test, users were asked to complete a usability questionnaire also gathering background information. Questionnaires where based on a five-point Likert scale where 1 means “strongly disagree” and 5 means “strongly agree”. The average duration of the test was about 25 min. Ten users (five couples) performed the test. Three of the users were female and seven were male. Three of them were researchers, four were master students, two PhD students and one was a professor. The average age was 27.9, with a range of 23–34. All of them had experience in using CAD/graphics systems.
In general, the visual aspect of the application was appreciated by the participants: most of them agree (70%) or strongly agree (10%) that the quality of the virtual environment was good and the representation was realistic. In particular, users appreciated the representation of the terrain, while three of them suggested the graphical aspects can be improved, especially considering the dam and water representation.
All of the testers disagree (50%) or strongly disagree (50%) that it was difficult to learn how to use the system, moreover, all of them agree (70%) or strongly agree (30%) that they felt more confident in the end of the experiment compared to the beginning.
The majority of the testers had no difficulty in using any of the functions in the system. In fact, they agree (70%) or strongly agree (20%) that placing the objects in the scene was easy, 60% of the them agree that the system allowed them to move the objects in a natural way, while 40% were neutral. Most of the participants disagree (40%) or strongly disagree (30%) that it was difficult to edit the objects, only one user agrees and the other was neutral. Most of the participants agree (60%) or strongly agree (30%) that it was easy to draw on the map, while they disagree (50%) or strongly disagree (40%) that it was difficult to erase them. One participant suggested the drawing tool could be more accurate. 60% of the users strongly agree and 40% agree that it was easy to find the information and tools they were searching for in the GUI. They appreciated the tools panel and found it clear, however two users suggested that the UI, especially the buttons, could be improved.
One user strongly agrees and one agrees that the system did not respond to their action immediately, while most of them disagree (60%) or strongly disagree (10%). The participants disagree (70%) or strongly disagree (10%) they kept making mistakes and also disagree (40%) or strongly disagree (40%) it was difficult to correct their own errors, in both cases the remaining users are neutral. Most of them agree (70%) or strongly agree (10%) that they felt they performed the task well. 70% of the testers agree that the system reacted to their actions in a way they expected. One of the users that found problems with the responsiveness of the system also had difficulties in placing the objects, this could be due to some temporary malfunctioning of the application or connection. However, some testers suggested that the interaction between the objects (lake, dam and terrain) could be improved. The interaction with the other player was evaluated as good by almost all the participants. In fact, 50% of them agree and 40% strongly agree that it was easy to interact with the other user. Moreover, 50% of the participants strongly agree and 40% agree that it was easy to use the chat system, while 40% disagree and 40% strongly disagree that it was difficult to communicate to the other user through the chat. However, two testers suggested to implement a tool for verbal communication. Regarding the chat, most of the participants strongly agree (50%) or agree (40%) that seeing the history of actions and messages in the chat window was useful.
It is important to highlight that all the users had prior experience in using CAD/graphics systems, but none of them had a specific background in AEC fields. Therefore, the knowledge of AEC software is not necessary to use the application. Moreover, despite the participants had no expertise in the design of buildings and infrastructures, they were stimulated in editing and adjusting the dam to the environment, exploring all the pre-defined configurations. The menu containing the tools and editing options was indeed appreciated and found clear by the participants. All the users were active in generating and modifying contents and the system was able to update the data in real-time, even when the players were editing a component simultaneously. In fact, the interaction with the other user was easy for almost all of the participants, as well as the use of the chat window. Therefore, the testing confirmed that the main requirements of the application listed in Table 1 were fully satisfied.
7. Conclusions
In this paper, we describe an innovative client–server application for the participatory planning of large water infrastructures such as dams. It has been designed for visualising the environmental impact of future or pre-existent water infrastructures (artificial lakes and dams) on the territory. The application works with both Windows and Android operating systems. Lakes and dams can be built on photos, maps and even real 3D terrains, generated through the program. Multiple clients can connect to the program through the standard TCP/IP protocol and edit the content simultaneously, allowing participatory planning. The application allows concentrating in a single and shared “environment” the steps required for the gathering and planning of the data needed for the dam planning. This possibility allows also increasing the stakeholders’ responsiveness and working on a shared basis, independently from stakeholders’ location.
Textual notes and drawings can be added on top of the terrain. This dataset can then be saved and loaded in projects. The program works both in a virtual mode (without the use of the webcam) and in an AR mode, which allows visualising the content on a target. A multi-user environment has been created; it has a good networking efficiency reached by decreasing the quantity of exchanged data, thus the server latency, which is the real bottleneck of such kind of applications.
The potential of our application has been successfully verified and improved with two real dam projects in the Zambezi River Basin, namely Batoka Gorge Dam on the border between Zambia and Zimbabwe, and Mphanda Nkuwa Dam in Mozambique. The different characteristics of these projects represent a proper testing environment that allowed discovering some interesting features of our application, which could be further refined in future works. The AR visualisation mode has come out to fit particularly well with the networking architecture, as it adds a dimension (and so a degree of realism) to objects that can be built or changed from another part of the world. In addition, we also realised that the use of a 3D terrain might be more relevant in the case of mountain territories, such as for the Batoka Gorge Dam, than in mainly flat ones, such as for the Mphanda Nkuwa Dam. In the Batoka Gorge Dam, the use of the height map is useful to visualise the impact of the project on the existing environment evaluating different height levels for the basin (see Figure 11b).
We identified some general requirements for the application in Table 1, which have been verified through a user study. The user study confirmed that the application can be a valid tool to actively involve professionals which have no specific background in AEC fields in the design of dams and that the interaction between players that the application provides is good. This study was a necessary step before further testing with real stakeholders. In future works, such testing will be performed to determine which specific additional information or functions should be implemented in the application (for instance, regarding the dimensioning of the infrastructure). These additional features were not required for the current phase and user study, since users had no knowledge of the case study we provided, including the territory and the economic and social conditions of the area. An interesting possibility is the one of comparing the design process supported and not supported by the use of the application. Moreover, in a complex and varying field such as the AEC one, further suggestions may always emerge during the application use and design process, according to the peculiarity of each project. Indeed, applications developed for this purpose should be easily adaptable: possible variables could be investigated in future case studies.
Finally, additional extensions of the application could be introduced in the future with the intent of further improving its efficiency as well as its accuracy to, for example, allow more comprehensive analyses of the consequences generated by the construction of dams (e.g., see [61]).
Author Contributions
Conceptualization, A.R. and M.G.; Methodology, F.F., G.W.S., S.G. and M.B.; Software, A.R.; Validation, A.R., M.G. and F.F.; Investigation, G.W.S.; Writing—Original Draft Preparation, A.R., G.W.S. and S.G.; Writing—Review & Editing, S.G., G.W.S. and M.G.; Visualization, F.F.; Supervision, M.B.
Funding
The work was partially funded by the DAFNE project funded by the European Commission under the Horizon 2020 framework programme (grant No. 690268).
Conflicts of Interest
The authors declare no conflict of interest.
References
- Nilsson, C.; Reidy, C.A.; Dynesius, M.; Revenga, C. Fragmentation and flow regulation of the world’s large river systems. Science 2005, 308, 405–408. [Google Scholar] [CrossRef] [PubMed]
- Lehner, B.; Liermann, C.R.; Revenga, C.; Vörösmarty, C.; Fekete, B.; Crouzet, P.; Döll, P.; Endejan, M.; Frenken, K.; Magome, J.; et al. High-resolution mapping of the world’s reservoirs and dams for sustainable river-flow management. Front. Ecol. Environ. 2011, 9, 494–502. [Google Scholar] [CrossRef]
- Gleick, P. The World’s Water 2000–2001: The Biennial Report on Freshwater Resources; Island Press: Washington, DC, USA, 2000. [Google Scholar]
- Hanasaki, N.; Kanae, S.; Oki, T. A reservoir operation scheme for global river routing models. J. Hydrol. 2006, 327, 22–41. [Google Scholar] [CrossRef]
- World Bank. Directions in Hydropower. Technical Report. 2009. Available online: http://documents.worldbank.org/curated/en/164581468336679451/Directions-in-hydropower (accessed on 26 July 2018).
- Biemans, H.; Haddeland, I.; Kabat, P.; Ludwig, F.; Hutjes, R.; Heinke, J.; Von Bloh, W.; Gerten, D. Impact of reservoirs on river discharge and irrigation water supply during the 20th century. Water Resour. Res. 2011, 47. [Google Scholar] [CrossRef]
- Zarfl, C.; Lumsdon, A.E.; Berlekamp, J.; Tydecks, L.; Tockner, K. A global boom in hydropower dam construction. Aquat. Sci. 2014, 77, 161–170. [Google Scholar] [CrossRef]
- Giuliani, M.; Anghileri, D.; Vu, P.; Castelletti, A.; Soncini-Sessa, R. Large storage operations under climate change: Expanding uncertainties and evolving tradeoffs. Environ. Res. Lett. 2016, 11. [Google Scholar] [CrossRef]
- Ziv, G.; Baran, E.; Nam, S.; Rodriguez-Iturbe, I.; Levin, S. Trading-off fish biodiversity, food security, and hydropower in the Mekong River Basin. Proc. Natl. Acad. Sci. USA 2012, 109, 5609–5614. [Google Scholar] [CrossRef] [PubMed]
- Castelletti, A.; Yajima, H.; Giuliani, M.; Soncini-Sessa, R.; Weber, E. Planning the Optimal Operation of a Multi–Outlet Water Reservoir with Water Quality and Quantity Targets. J. Water Resour. Plan. Manag. 2014, 140, 496–510. [Google Scholar] [CrossRef]
- Grill, G.; Lehner, B.; Lumsdon, A.E.; MacDonald, G.K.; Zarfl, C.; Liermann, C.R. An index-based framework for assessing patterns and trends in river fragmentation and flow regulation by global dams at multiple scales. Environmen. Res. Lett. 2015, 10, 015001. [Google Scholar] [CrossRef]
- Schmitt, R.; Bizzi, S.; Castelletti, A.; Kondolf, G. Improved trade-offs of hydropower and sand connectivity by strategic dam planning in the Mekong. Nat. Sustain. 2018, 1, 96. [Google Scholar] [CrossRef]
- Soncini-Sessa, R.; Castelletti, A.; Weber, E. Integrated and Participatory Water Resources Management: Theory; Elsevier: Amsterdam, The Netherlands, 2007. [Google Scholar]
- Castelletti, A.; Pianosi, F.; Soncini-Sessa, R. Integration, participation and optimal control in water resources planning and management. Appl. Math. Comput. 2008, 206, 21–33. [Google Scholar] [CrossRef]
- Wolf, A. Conflict and Cooperation Along International Waterways. Water Policy 1998, 1, 251–265. [Google Scholar] [CrossRef]
- Julien, F. Hydropolitics is what societies make of it (or why we need a constructivist approach to the geopolitics of water). Int. J. Sustain. Soc. 2012, 4, 45–71. [Google Scholar] [CrossRef]
- Hare, M.; Letcher, R.A.; Jakeman, A.J. Participatory modelling in natural resource management: A comparison of four case studies. Integr. Assess. 2003, 4, 62–72. [Google Scholar] [CrossRef]
- Zhou, Y.; Luo, H.; Yang, Y. Implementation of augmented reality for segment displacement inspection during tunneling construction. Autom. Constr. 2017, 82, 112–121. [Google Scholar] [CrossRef]
- Dunston, P.; Wang, X.; Billinghurst, M.; Hampson, B. Mixed Reality Benefits for Design Perception; Nist Special Publication sp; Nist Special Publication: Gaithersburg, MD, USA, 2003; pp. 191–196. [Google Scholar]
- Behzadan, A.H.; Dong, S.; Kamat, V.R. Augmented reality visualization: A review of civil infrastructure system applications. Adv. Eng. Inform. 2015, 29, 252–267. [Google Scholar] [CrossRef]
- Dong, S.; Behzadan, A.H.; Chen, F.; Kamat, V.R. Collaborative visualization of engineering processes using tabletop augmented reality. Adv. Eng. Softw. 2013, 55, 45–55. [Google Scholar] [CrossRef]
- Wang, X.; Dunston, P.S. Tangible mixed reality for remote design review: a study understanding user perception and acceptance. Visual. Eng. 2013, 1, 8. [Google Scholar] [CrossRef]
- Bullinger, H.J.; Bauer, W.; Wenzel, G.; Blach, R. Towards user centred design (UCD) in architecture based on immersive virtual environments. Comput. Ind. 2010, 61, 372–379. [Google Scholar] [CrossRef]
- Bouchlaghem, D.; Shang, H.; Whyte, J.; Ganah, A. Visualisation in architecture, engineering and construction (AEC). Autom. Constr. 2005, 14, 287–295. [Google Scholar] [CrossRef]
- Sanders, E.B.N.; Stappers, P.J. Co-creation and the new landscapes of design. CoDesign 2008, 4, 5–18. [Google Scholar] [CrossRef]
- Sun, M.; Aouad, G.; Bakis, N. A Multidisciplinary Collaborative Design System for Civil Engineering Projects. In Proceedings of the Sixth International Conference on Application of Artificial Intelligence to Civil & Structural Engineering, Eisenstadt, Austria, 19–21 September 2001; Civil-Comp Press: Stirlingshire, UK, 2001; pp. 21–22. [Google Scholar]
- Pena-Mora, F.; Dwivedi, G.H. Multiple device collaborative and real time analysis system for project management in civil engineering. J. Comput. Civ. Eng. 2002, 16, 23–38. [Google Scholar] [CrossRef]
- Yeomans, S.G.; Bouchlaghem, N.M.; El-Hamalawi, A. An evaluation of current collaborative prototyping practices within the AEC industry. Autom. Constr. 2006, 15, 139–149. [Google Scholar] [CrossRef]
- Van Krevelen, D.; Poelman, R. A survey of augmented reality technologies, applications and limitations. Int. J. Virtual Real. 2010, 9. [Google Scholar]
- Szalavári, Z.; Schmalstieg, D.; Fuhrmann, A.; Gervautz, M. “Studierstube”: An environment for collaboration in augmented reality. Virtual Real. 1998, 3, 37–48. [Google Scholar] [CrossRef]
- Park, J. Augmented Reality Based Re-formable Mock-Up for Design Evaluation. In Proceedings of the 2008 International Symposium on Ubiquitous Virtual Reality, Gwangju, Korea, 10–13 July 2008; pp. 17–20. [Google Scholar]
- Regenbrecht, H.; Baratoff, G.; Wilke, W. Augmented reality projects in the automotive and aerospace industries. IEEE Comput. Gr. Appl. 2005, 25, 48–56. [Google Scholar] [CrossRef]
- Broll, W.; Lindt, I.; Ohlenburg, J.; Wittkämper, M.; Yuan, C.; Novotny, T.; Fatah gen. Schieck, A.; Mottram, C.; Strothmann, A. ARTHUR: A Collaborative Augmented Environment for Architectural Design and Urban Planning. JVRB J. Virtual Real. Broadcast. 2004. [Google Scholar] [CrossRef]
- Fite-Georgel, P. Is There a Reality in Industrial Augmented Reality? In Proceedings of the 2011 10th IEEE International Symposium on Mixed and Augmented Reality, Basel, Switzerland, 26–29 October 2011; IEEE Computer Society: Washington, DC, USA, 2011; pp. 201–210. [Google Scholar] [CrossRef]
- Golparvar-Fard, M.; Peña-Mora, F.; Savarese, S. D4AR–a 4-dimensional augmented reality model for automating construction progress monitoring data collection, processing and communication. J. Inf. Technol. Constr. 2009, 14, 129–153. [Google Scholar]
- Wang, X.; Love, P.E.; Kim, M.J.; Park, C.S.; Sing, C.P.; Hou, L. A conceptual framework for integrating building information modeling with augmented reality. Autom. Constr. 2013, 34, 37–44. [Google Scholar] [CrossRef]
- Wang, X.; Truijens, M.; Hou, L.; Wang, Y.; Zhou, Y. Integrating Augmented Reality with Building Information Modeling: Onsite construction process controlling for liquefied natural gas industry. Autom. Constr. 2014, 40, 96–105. [Google Scholar] [CrossRef]
- Dias, J.M.S.; Capo, A.; Carreras, J.; Galli, R.; Gamito, M. A4D: Augmented Reality 4D System for Architecture and Building Construction. In Proceedings of the Conferencia Virginia Tech, Blacksburg, VA, USA, 24–26 September 2003. [Google Scholar]
- Shen, W.; Hao, Q.; Mak, H.; Neelamkavil, J.; Xie, H.; Dickinson, J.; Thomas, R.; Pardasani, A.; Xue, H. Systems integration and collaboration in architecture, engineering, construction, and facilities management: A review. Adv. Eng. Inform. 2010, 24, 196–207. [Google Scholar] [CrossRef]
- Bouchlaghem, D.; Shang, H.; Anumba, C.J.; Cen, M.; Miles, J.; Taylor, M. ICT-enabled collaborative working environment for concurrent conceptual design. Architect. Eng. Des. Manag. 2005, 1, 261–280. [Google Scholar] [CrossRef]
- Ishii, H.; Ben-Joseph, E.; Underkoffler, J.; Yeung, L.; Chak, D.; Kanji, Z.; Piper, B. Augmented Urban Planning Workbench: Overlaying Drawings, Physical Models and Digital Simulation. In Proceedings of the 1st International Symposium on Mixed and Augmented Reality, Los Alamitos, CA, USA, 30 September–1 October 2002; IEEE Computer Society: Washington, DC, USA, 2002; p. 203. [Google Scholar]
- Shen, W.; Hao, Q.; Li, W. Computer supported collaborative design: Retrospective and perspective. Comput. Ind. 2008, 59, 855–862. [Google Scholar] [CrossRef]
- Wang, J.X.; Tang, M.X.; Song, L.N.; Jiang, S.Q. Design and implementation of an agent-based collaborative product design system. Comput. Ind. 2009, 60, 520–535. [Google Scholar] [CrossRef]
- Wang, X.; Love, P.E.; Kim, M.J.; Wang, W. Mutual awareness in collaborative design: An Augmented Reality integrated telepresence system. Comput. Ind. 2014, 65, 314–324. [Google Scholar] [CrossRef]
- Mok, K.Y.; Shen, G.Q.; Yang, J. Stakeholder management studies in mega construction projects: A review and future directions. Int. J. Proj. Manag. 2015, 33, 446–457. [Google Scholar] [CrossRef]
- Tilt, B.; Braun, Y.; He, D. Social impacts of large dam projects: A comparison of international case studies and implications for best practice. J. Environ. Manag. 2009, 90, S249–S257. [Google Scholar] [CrossRef] [PubMed]
- Achten, H. Requirements for collaborative design in architecture. In Sixth Design and Decision Support Systems in Architecture and Urban Planning—Part One: Architecture Proceedings; Ellecom; Timmermans, H., Ed.; 2002; Available online: http://papers.cumincad.org/cgi-bin/works/Show?ddssar0201 (accessed on 26 July 2018).
- Castelletti, A.; Soncini-Sessa, R. A procedural approach to strengthening integration and participation in water resource planning. Environ. Model. Softw. 2006, 21, 1455–1470. [Google Scholar] [CrossRef]
- Soncini-Sessa, R.; Cellina, F.; Pianosi, F.; Weber, E. Integrated and Participatory Water Resources Management-Practice; Elsevier: Amsterdam, The Netherlands, 2007. [Google Scholar]
- Castelletti, A.; Soncini-Sessa, R. Bayesian Networks and participatory modelling in water resource management. Environ. Model. Softw. 2007, 22, 1075–1088. [Google Scholar] [CrossRef]
- Available online: https://unity3d.com (accessed on 30 May 2018).
- Available online: https://docs.unity3d.com/Manual/UNetUsingHLAPI.html (accessed on 30 May 2018).
- Scurati, G.W.; Gattullo, M.; Fiorentino, M.; Ferrise, F.; Bordegoni, M.; Uva, A.E. Converting maintenance actions into standard symbols for Augmented Reality applications in Industry 4.0. Comput. Ind. 2018, 98, 68–79. [Google Scholar] [CrossRef]
- Available online: https://www.vuforia.com (accessed on 30 May 2018).
- World Bank. The Zambezi River Basin: A Multi-Sector Investment Opportunities Analysis—Volume 2 Basin Development Scenarios. Technical Report. 2010. Available online: http://documents.worldbank.org/curated/en/599191468203672747/pdf/584040V40WP0Wh1lysis0and0Input0Data.pdf (accessed on 26 July 2018).
- Giuliani, M.; Castelletti, A. Assessing the value of cooperation and information exchange in large water resources systems by agent–based optimization. Water Resour. Res. 2013, 49, 3912–3926. [Google Scholar] [CrossRef]
- Zambezi River Authority. Development of the Batoka Gorge Hydro—Electric Scheme. Project Overview Document, Technical Report. 2017. Available online: http://www.zaraho.org.zm/sites/default/files/BGHES_Project%20Overview%20Document.pdf (accessed on 26 July 2018).
- Spalding-Fecher, R.; Yamba, F.; Walimwipi, H.; Kling, H.; Tembo, B.; Nyambe, I.; Chapman, A.; Cuamba, B. Water Supply and Demand Scenarios for the Zambezi River Basin. Climate Change and Upstream Development Impacts on New Hydropower Projects in the Zambezi Project. Report for Climate & Development Knowledge Network, Technical Report. 2014. Available online: http://www.erc.uct.ac.za/sites/default/files/image_tool/images/119/Hydro-Zambezi/HZ-Water_Supply_and_Demand_Scenarios_Report.pdf (accessed on 26 July 2018).
- Grigorik, I. High Performance Browser Networking: What Every Web Developer Should Know about Networking and Web Performance; O’Reilly Media, Inc.: Sebastopol, CA, USA, 2013. [Google Scholar]
- Available online: https://www.mikroe.com/blog/2g-3g-4g-speed (accessed on 30 May 2018).
- Brown, P.H.; Tullos, D.; Tilt, B.; Magee, D.; Wolf, A.T. Modeling the costs and benefits of dam construction from a multidisciplinary perspective. J. Environ. Manag. 2009, 90, S303–S311. [Google Scholar] [CrossRef] [PubMed]


© 2018 by the authors. Licensee MDPI, Basel, Switzerland. This article is an open access article distributed under the terms and conditions of the Creative Commons Attribution (CC BY) license (http://creativecommons.org/licenses/by/4.0/).